Attached files
| file | filename |
|---|---|
| 8-K - FORM 8-K - REGIONS FINANCIAL CORP | d597127d8k.htm |
Exhibit 99.1
Regions Financial Corporation - Dodd-Frank Act Mid-Year Stress Test Disclosure
This disclosure of summary mid-year stress test results is required by 12 CFR 252.148, which implements the requirements of Section 165(i)(2) of the Dodd-Frank Wall Street Reform and Consumer Protection Act. The following results reflect pro forma capital ratios and select Income Statement line items for Regions Financial Corporation (“Regions” or “Company”) and Regions Bank under the Company’s severely adverse scenario.
Dodd-Frank Act Stress Test Assumptions
Unlike the annual Dodd-Frank Act Stress Test (“DFAST”), which was based upon a severely adverse scenario developed by the Federal Reserve, the mid-year DFAST is based solely upon macroeconomic assumptions developed by each bank subject to 12 CFR 252.148. The Federal Reserve-developed scenario was created to appropriately stress macroeconomic conditions for the banking industry as a whole and not tailored to individual institutions. Regions disclosed the results of the annual stress test on March 14, 2013. The mid-year DFAST is not part of the annual Comprehensive Capital Analysis and Review (“CCAR”) process and accordingly, no objection or non-objection will be provided by the Federal Reserve with respect to these results.
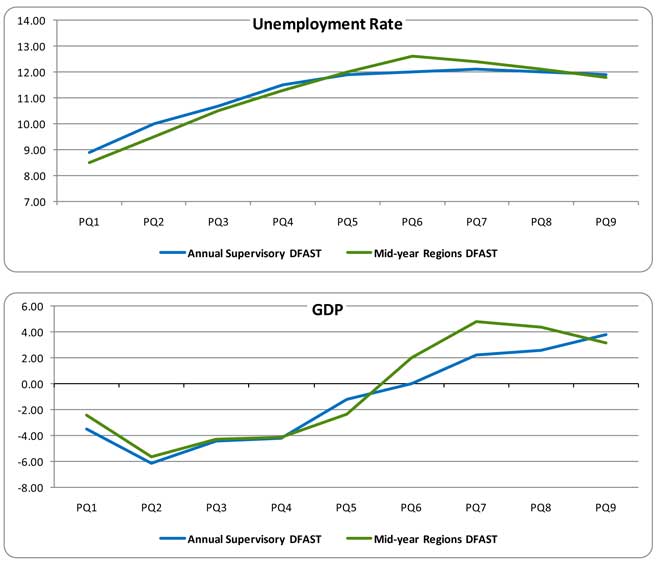
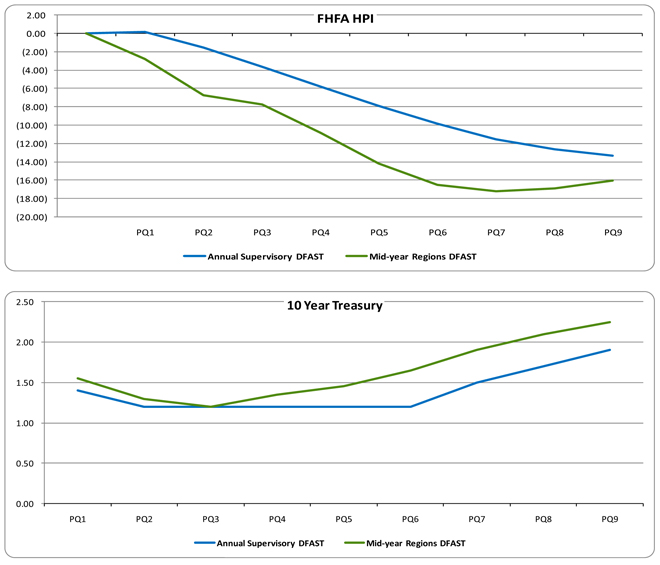
Pursuant to regulatory guidance for the mid-year DFAST, Regions is required to develop scenarios that appropriately stress the idiosyncratic risks of the company. Given Regions’ core businesses consist of traditional banking activities, the company is most exposed to scenarios that stress the overall health of the broader economy, with particular emphasis on the Southeast given our geographic footprint. Regions’ severely adverse scenario is characterized by a substantial weakening in the U.S. economy. This scenario does not represent expected conditions, but rather is a hypothetical path of economic variables to be used to assess the strength of Regions and its capital base in a severely adverse economic environment. Specifically, the impact of this macroeconomic scenario can be best illustrated through key economic factors such as the level of interest rates, house price index and unemployment from both a macro and micro perspective (as shown in the table below, which details key variables under the course of the company’s severely adverse scenario). Given Regions’ particular sensitivity to these economic factors, and in order to ensure that the scenarios Regions created were of a sufficient severity, Regions stressed certain of these key variables more severely than the extent to which the Federal Reserve did when developing the system-wide scenarios. The graphs in Appendix A illustrate key differences between select economic variables in the severely adverse scenarios developed by the Federal Reserve and those developed by Regions.
For purposes of the table below, the period forecasted includes 2Q 2013 through 2Q 2015 where PQ1 represents 2Q 2013 and PQ9 represents 2Q 2015.
| % | PQ1 | PQ2 | PQ3 | PQ4 | PQ5 | PQ6 | PQ7 | PQ8 | PQ9 | |||||||||||||||||||||||||||
| Annual Gross Domestic Product (“GDP”) |
(2.44 | ) | (5.62 | ) | (4.27 | ) | (4.15 | ) | (2.33 | ) | 2.05 | 4.82 | 4.36 | 3.15 | ||||||||||||||||||||||
| Annual Consumer Price Index (“CPI”) |
(0.91 | ) | (2.90 | ) | (2.24 | ) | (1.35 | ) | (0.04 | ) | 0.70 | 2.40 | 3.07 | 2.27 | ||||||||||||||||||||||
| House Price Index (“HPI”) |
(2.80 | ) | (6.75 | ) | (7.72 | ) | (10.88 | ) | (14.17 | ) | (16.48 | ) | (17.22 | ) | (16.87 | ) | (16.01 | ) | ||||||||||||||||||
| Unemployment Rate |
8.50 | 9.50 | 10.50 | 11.30 | 12.00 | 12.60 | 12.40 | 12.10 | 11.80 | |||||||||||||||||||||||||||
| 10 year Treasury |
1.55 | 1.30 | 1.20 | 1.35 | 1.45 | 1.65 | 1.90 | 2.10 | 2.25 | |||||||||||||||||||||||||||
| Fed Funds Rate |
0.25 | 0.25 | 0.25 | 0.25 | 0.25 | 0.25 | 0.25 | 0.25 | 0.25 | |||||||||||||||||||||||||||
| 3 month LIBOR |
0.65 | 0.90 | 0.85 | 0.75 | 0.65 | 0.52 | 0.44 | 0.42 | 0.38 | |||||||||||||||||||||||||||
These summary stress test results for Regions assume specific capital actions as provided for in the regulation. For Regions, the Dodd-Frank capital action assumptions are:
| 1) | actual capital distributions completed in the second quarter of 2013 including: |
| a. | repurchase of approximately $175 million of common stock |
1
| b. | redemption of $100 million of the Union Planters REIT Preferred Stock |
| c. | redemption of $498 million of the 6.625% Trust Preferred Securities |
| d. | payment of a $0.03 per share common stock dividend |
| 2) | quarterly common stock dividends equal to $0.015 per share for each of the third quarter of 2013 through the second quarter of 2015, which is the quarterly average dollar amount of common stock dividends that Regions paid over the four quarters between the third quarter of 2012 through the second quarter of 2013, |
| 3) | payments on any other instrument that is eligible for inclusion in the numerator of a regulatory capital ratio equal to the stated dividend, interest or principal due on such instrument during the quarter (this includes subordinated debt, preferred stock, and other capital securities), |
| 4) | no redemption or repurchase of any capital instrument that is eligible for inclusion in the numerator of a regulatory capital ratio (other than those noted in assumption 1) above), and |
| 5) | no issuances of capital securities. |
The stress testing process and the development of the key variables relies in certain cases on the judgment of subject matter experts. Regions understands that whereas expert judgment is necessary in certain cases, it should be defendable and effectively challenged throughout the review process.
Description of the Types of Risk Included in the Stress Test
Regions considers all identified risks in its stress testing activities. These risks range from idiosyncratic risks, such as geographic footprint and industry concentrations in the credit portfolios, to broad economic, political, and regulatory and compliance risks which Regions believes will impact it and all of its peers. Specifically, Regions considers the following key risks in its stress testing activities: (1) credit risk, or the risk that a borrower or counterparty fails to perform on an obligation as agreed; (2) market risk, or the risk to Regions’ financial condition from changes in interest rates or changes in the market value of assets and traded financial instruments, both on and off-balance sheet; (3) liquidity risk, or the risk arising from an inability to meet obligations as they come due in the normal course of business without undue hardship or incurring unacceptable loss; (4) operational risk, or the risk of loss resulting from inadequate or failed internal processes, people, and systems, or from external events; and (5) legal risk, or the risk related to improper actions, whether intentional or unintentional, in carrying out its fiduciary or contractual duties.
Each of the risks identified above are applied to particular portfolios of assets where those risks are applicable. Additionally, these risks are assessed across Regions’ three Business Groups (Business Services, Consumer Services and Wealth Management) as well as general corporate functions (Treasury, etc.). Regions, to the best of its ability, fully captures the impacts of each risk as it relates to the defined scenarios. As part of its risk management practices, Regions monitors these risks through additional stress testing activities to ensure the risks are fully understood under a wide range of potential scenarios.
Credit Risk
Credit risk represents the risk that parties indebted to Regions fail to perform as contractually obligated. Regions’ primary credit risk arises from the possibility that borrowers may not be able to repay loans, and to a lesser extent, the failure of securities issuers and counterparties to perform as contractually required. In monitoring credit risk, Regions’ objective is to maintain a high-quality credit portfolio that provides for stable credit costs with acceptable volatility through an economic cycle. In order to assess the risk characteristics of the loan portfolio, Regions considers the current U.S. economic environment and that of its primary banking markets, as well as risk factors within the major categories of loans.
2
Credit risk spans all corporate groups but is concentrated in Business Services and Consumer Services. Regions specifically measures credit risk for each portfolio of assets on the balance sheet as well as risks that arise from off balance sheet unfunded commitments. The underlying credit quality of these assets is stressed per the methodologies discussed in the next section.
Market Risk
Regions’ primary market risk is interest rate risk, including uncertainty with respect to absolute interest rate levels as well as uncertainty with respect to relative interest rate levels, which is impacted by both the shape and the slope of the various yield curves that affect the financial products and services that the Company offers. In addition, Regions, like most financial institutions, is subject to changing prepayment speeds on mortgage-related assets under different interest rate environments. Prepayment risk is a significant risk to earnings and specifically to net interest income. For example, mortgage loans and other financial assets may be prepaid by a debtor, so that the debtor may refinance its obligations at lower rates. As loans and other financial assets prepay in a falling rate environment, Regions must reinvest these funds in lower-yielding assets. Prepayments of assets carrying higher rates reduce Regions’ interest income and overall asset yields. Conversely, in a rising rate environment, these assets will prepay at a slower rate, resulting in opportunity cost by not having the cash flow to reinvest at higher rates. Prepayment risk can also impact the value of securities and the carrying value of equity. Regions’ greatest exposures to prepayment risks primarily rest in its mortgage-backed securities portfolio, the mortgage fixed-rate loan portfolio and the mortgage servicing asset, all of which tend to be sensitive to interest rate movements. Regions also has prepayment risk that would be reflected in non-interest income in the form of servicing income on loans sold. Regions’ capital markets business, which includes derivatives, loan syndication and foreign exchange trading activities, expose it to market risk. Further, the Company is exposed to non-trading market risk from mortgage hedging activities which include secondary marketing of loans to government-sponsored entities and mortgage servicing rights valuation.
Liquidity Risk
Liquidity risk relates to Regions’ ability to fund present and future obligations. Regions considers liquidity risk in its stress testing activities through an evaluation of its funding sources and assumptions regarding how those liabilities may re-price during times of stress. Liquidity risks are most pronounced within deposit portfolios in all three Business Groups and within Treasury funding portfolios.
Operational and Legal Risks
Operational and legal risks are also modeled for all internal groups in the stress tests based on historical observations of losses and expectations on how those types of losses may materialize in the scenarios being modeled. Regions supplements internal data with external loss data in order to ensure that future loss projections are not based solely on historical observations at Regions. In addition to historical data, Regions also considers internal control frameworks that highlight additional potential areas of risk that may not have produced historical losses. The potential for future losses that these frameworks suggest are also considered in forecasted stressed losses.
Description of Methodologies Employed by Regions
Regions’ primary design consideration for loss forecasting in adverse scenarios is to project credible losses that are appropriately sensitive to macroeconomic shocks. Loss forecasting relies on a set of
3
economic assumptions that, in the Company’s severely adverse scenario, are meant to produce significant loss estimates with a corresponding stress on our capital levels. There are numerous models used to support the loss forecasting process, with each subject to validation, oversight and governance. Historical performance informs future forecasts and is relied upon as the basis of the model outputs. Regions understands that historical performance is not always indicative of performance in future periods of stress and accounts for this uncertainty through a buffer for forecasting imprecision. Our models rely on a sound risk measurement and management infrastructure that supports the identification, measurement, assessment and control of all material risks arising from our exposures.
Regions establishes its Allowance for Loan and Lease Losses (“ALLL”) in compliance with U.S. generally accepted accounting principles (“GAAP”). The primary consideration in forecasting the ALLL is determined based on the modeled losses in an adverse scenario over the nine-quarter forecast period. Several ratios are employed to ensure that the modeled ALLL is appropriately established.
In the development of projections for pre-provision net revenue (which consists of net interest income on a fully-tax equivalent basis plus non-interest revenues less non-interest expenses), Regions uses an integrated process to derive and aggregate enterprise level results under each macroeconomic scenario. The process starts with the formulation of the base case, which is then stressed as appropriate for the various scenarios. The assumptions used in the base case (and in fact, in all scenarios) are the foundation for projections of the balance sheet as well as the resulting components of revenue and expense, as appropriate.
The ability to translate macroeconomic factors and key risk measurements into pro formas relies upon the utilization of models from across Regions. As with loss forecasting, robust model development, documentation, validation and overall model governance practices are critical to the process. Other factors are also considered, such as expected growth levels of customer households, pricing levels for the products and services offered to our customers, usage and utilization assumptions and other revenue drivers. On the expense front, consideration is given to the direct costs of generating the revenue such as investments in people and incentive expenses related to the revenue production; projections of depreciation and amortization based on previous and expected management decisions to invest in capital expenditures and in product development; as well as general and administrative expenses.
The process for projecting the balance sheet is consistent with, and in certain instances directly linked to, the processes used to forecast certain pre-provision net revenue line items. As with pre-provision net revenue, macroeconomic-dependent models are utilized to develop key balance forecasts. In creating these forecasts, the Company makes several key assumptions such as estimating the behavior of customers in certain circumstances, perhaps most importantly as it relates to assumed deposit behavior. Key assumptions such as these are discussed and challenged through the review process for reasonableness and effectiveness. Once a consolidated balance sheet is created, risk weighted assets are forecasted based upon the final balance sheet; including off balance sheet exposures such as unfunded commitments.
The previously described methodologies translate identified risks into potential revenue and loss projections over the nine-quarter planning horizon. These projections are then aggregated into a net income / loss estimate over the planning horizon. These estimates then feed Regions’ regulatory capital estimation process, which, when coupled with the forecasted risk-weighted assets, estimates key regulatory capital ratios for Regions. The calculations are based on codified guidance by Regions’ regulators as well as proposed guidance when applicable. In addition to estimating capital accretion / depletion from net income / loss over the nine-quarter planning horizon, Regions also estimates impacts to regulatory capital based on planned capital actions or prescribed actions (as is the case with the Dodd-Frank Stress Test scenarios). The resulting regulatory capital ratios are then compared against management’s targeted levels which become a key input into Regions’ capital adequacy assessment.
4
Summary of Mid-Year Results for Regions Financial Corporation
| Projected Capital Ratios through Q2 2015 under the Regions’ Severely Adverse Scenario |
||||||||||||
| Actual | Stressed Capital Ratios | |||||||||||
| Q1 2013 | Q2 2015 | Minimum* | ||||||||||
| Tier 1 Common Ratio (%) |
11.2 | % | 8.1 | % | 8.1 | % | ||||||
| Tier 1 Capital Ratio (%) |
12.4 | % | 8.6 | % | 8.6 | % | ||||||
| Total Risk-Based Capital Ratio (%) |
15.8 | % | 11.5 | % | 11.5 | % | ||||||
| Tier 1 Leverage Ratio (%) |
10.1 | % | 7.0 | % | 7.0 | % | ||||||
| Projected Losses, Revenue, and Net Income Before Taxes through Q2 2015 under the Regions’ Severely Adverse Scenario |
||||||||
| Billions of Dollars |
Percent of Average Assets |
|||||||
| Pre-provision Net Revenue |
2.6 | 2.2 | % | |||||
| Other Revenue |
— | 0.0 | % | |||||
| Less |
||||||||
| Provisions for loan losses |
5.3 | 4.6 | % | |||||
| Realized Gains/Losses on Securities (AFS/HTM) |
0.1 | 0.1 | % | |||||
| Trading and Counterparty Losses |
— | 0.0 | % | |||||
| Other Losses/Gains |
— | 0.0 | % | |||||
| Equals |
||||||||
| Net Income/(Loss) Before Taxes |
(2.8 | ) | -2.5 | % | ||||
| Projected Loan Losses by Type of Loans for Q2 2013 through Q2 2015 under the Regions’ Severely Adverse Scenario |
||||||||
| Billions of Dollars |
Portfolio Loss Rates (%) |
|||||||
| Loan Losses |
4.02 | 5.7 | % | |||||
| First Lien Mortgages, Domestic |
0.51 | 3.5 | % | |||||
| Junior Liens and HELOCs, Domestic |
0.71 | 7.7 | % | |||||
| Commercial and Industrial |
0.82 | 4.4 | % | |||||
| Commercial Real Estate |
1.40 | 8.9 | % | |||||
| Credit Cards |
0.14 | 16.2 | % | |||||
| Other Consumer |
0.23 | 5.5 | % | |||||
| Other Loans |
0.21 | 2.6 | % | |||||
| * | “Minimum” means the lowest result for any quarter over the nine-quarter planning horizon. |
5
Summary of Mid-Year Results for Regions Bank
The following results reflect pro forma capital ratios for Regions Bank under Regions’ severely adverse scenario. These capital levels are derived using a process identical to that described in this document for Regions. As with Regions, Regions Bank’s capital ratios decline over the 9 quarter planning horizon in this theoretical severely adverse scenario as credit costs exceed pre-provision net revenue generation. In its scenario planning, Regions assumes capital actions at Regions Bank during the planning horizon that are in alignment with its internal capital adequacy assessment process. These actions, which may include dividends from or infusions into Regions Bank as well as redemptions or repurchases of capital securities, are based on where forecasted capital levels are relative to management’s targets and limits, among other factors.
| Bank Projected Capital Ratios through Q2 2015 under the Regions’ Severely Adverse Scenario |
||||||||||||
| Actual | Stressed Capital Ratios | |||||||||||
| Q1 2013 | Q2 2015 | Minimum* | ||||||||||
| Tier 1 Common Ratio (%) |
13.2 | % | 10.8 | % | 10.8 | % | ||||||
| Tier 1 Capital Ratio (%) |
13.3 | % | 10.8 | % | 10.8 | % | ||||||
| Total Risk-Based Capital Ratio (%) |
16.1 | % | 13.0 | % | 13.0 | % | ||||||
| Tier 1 Leverage Ratio (%) |
10.9 | % | 8.8 | % | 8.8 | % | ||||||
| Bank Projected Losses, Revenue, and Net Income Before Taxes through Q2 2015 under the Regions’ Severely Adverse Scenario |
||||||||
| Billions of Dollars |
Percent of Average Assets |
|||||||
| Pre-provision Net Revenue |
3.0 | 2.6 | % | |||||
| Other Revenue |
— | 0.0 | % | |||||
| Less |
||||||||
| Provisions for loan losses |
5.3 | 4.7 | % | |||||
| Realized Gains/Losses on Securities (AFS/HTM) |
0.1 | 0.1 | % | |||||
| Trading and Counterparty Losses |
— | 0.0 | % | |||||
| Other Losses/Gains |
— | 0.0 | % | |||||
| Equals |
||||||||
| Net Income/(Loss) Before Taxes |
(2.4 | ) | -2.1 | % | ||||
| Bank Projected Loan Losses by Type of Loans for Q2
2013 through Q2 2015 under the Regions’ Severely Adverse |
||||||||
| Billions of Dollars |
Portfolio Loss Rates (%) |
|||||||
| Loan Losses |
4.02 | 5.7 | % | |||||
| First Lien Mortgages, Domestic |
0.51 | 3.5 | % | |||||
| Junior Liens and HELOCs, Domestic |
0.71 | 7.7 | % | |||||
| Commercial and Industrial |
0.82 | 4.4 | % | |||||
| Commercial Real Estate |
1.40 | 8.9 | % | |||||
| Credit Cards |
0.14 | 16.2 | % | |||||
| Other Consumer |
0.23 | 5.5 | % | |||||
| Other Loans |
0.21 | 2.6 | % | |||||
| * | “Minimum” means the lowest result for any quarter over the nine-quarter planning horizon. |
6
Explanation of the most significant causes for the changes in regulatory capital ratios and tier 1 common ratio
The severely adverse scenario as applied internally through Regions’ Capital Planning Process results in projected declines in regulatory capital ratios of approximately 300 basis points from 1Q 2013 actual levels for Regions and approximately 200 – 300 basis points from 1Q 2013 actual levels for Regions Bank. This decline is primarily driven by an expectation of credit costs exceeding pre-provision net revenues over the nine-quarter forecast horizon. As detailed in the summary of results tables, this leads to a pre-tax net loss of approximately $2.8 billion over the forecast horizon for Regions and a $2.4 billion pre-tax net loss for Regions Bank. The capital actions enumerated previously also reduce certain regulatory capital ratios. In particular, for Regions, Tier 1 Common is reduced by the executed share repurchases as well as the assumed per share quarterly common stock dividend. In addition to these two items, Tier 1 Capital at Regions is also decreased by the redemption of the 6.625% Trust Preferred and the Union Planters REIT Preferred.
7
Appendix A: Severely Adverse Scenarios
The tables below compare the forecasts for key economic variables forecasted by the Federal Reserve during the Annual Supervisory DFAST submission versus Regions’ forecast for the same variables created during the mid-year DFAST submission.
8
9