Attached files
| file | filename |
|---|---|
| 8-K - CHINA FUND INC | fp0008255_8k.htm |
|
Aug 31, 2013
|
Monthly Insight
The China Fund, Inc. (CHN)
|
|
Investment Objective
|
The investment objective of the Fund is to achieve long term capital appreciation. The Fund seeks to achieve its objective through investment in the equity securities of companies and other entities with significant assets, investments, production activities, trading or other business interests in China or which derive a significant part of their revenue from China.
The Fund has an operating policy that the Fund will invest at least 80% of its assets in China companies. For this purpose, ‘China companies’ are (i) companies for which the principal securities trading market is in China; (ii) companies for which the principal securities trading market is outside of China or in companies organized outside of China, that in both cases derive at least 50% of their revenues from goods or services sold or produced, or have a least 50% of their assets in China; or (iii) companies organized in China. Under the policy, China means the People’s Republic of China, including Hong Kong, and Taiwan. The Fund will provide its stockholders with at least 60 days’ prior notice of any change to this policy.
|
Performance Overview
|
|
Performance History
|
1 month
|
3 months
|
YTD
|
1 Year
|
3 Years
|
5 Years
|
10 Years
|
Since
|
|
(p.a.)
|
(p.a.)
|
(p.a.)
|
Inception
|
|||||
|
NAV (%)
|
0.67
|
-2.25
|
5.89
|
16.57
|
2.52
|
7.73
|
14.49
|
10.69
|
|
Market price (%)
|
1.41
|
-1.70
|
-2.80
|
12.69
|
0.39
|
7.19
|
11.40
|
9.55
|
|
Benchmark (%)
|
0.73
|
-1.35
|
-1.37
|
13.83
|
5.12
|
4.75
|
10.05
|
N/A
|
|
Performance History
|
2012
|
2011
|
2010
|
2009
|
2008
|
2007
|
2006
|
2005
|
|
NAV (%)
|
12.07
|
-24.37
|
27.25
|
72.82
|
-46.95
|
86.20
|
57.10
|
6.09
|
|
Market price (%)
|
20.46
|
-27.51
|
23.60
|
72.19
|
-40.65
|
50.24
|
65.67
|
-21.51
|
|
Benchmark (%)
|
22.65
|
-18.36
|
13.60
|
67.12
|
-49.37
|
37.97
|
39.50
|
10.27
|
Source: State Street Bank and Trust Company. Source for index data: MSCI as at Aug 31, 2013.
|
Portfolio Analysis
|
|
Sector allocation (%)
|
Country allocation (%)
|
 |
 |
|
Source: State Street Bank and Trust Company as at Aug 31, 2013.
|
* China includes A-shares (7.0%), A-share equity linked securities (7.1%), B-shares (0.0%), H-shares (11.5%) and Red-chips (16.5%).
|

The China Fund, Inc. (CHN)
|
Portfolio Analysis (continued)
|
|
Top 10 Holdings
|
Sector
|
%
|
|
HAND ENTERPRISE SOLUTIONS CO., LTD.
|
I.T.
|
7.0
|
|
CHINA EVERBRIGHT INTERNATIONAL, LTD.
|
INDUSTRIALS
|
6.2
|
|
TAIWAN SEMICONDUCTOR MANUFACTURING CO., LTD.
|
I.T.
|
5.4
|
|
SUN HUNG KAI PROPERTIES, LTD.
|
FINANCIALS
|
4.4
|
|
INDUSTRIAL & COMMERCIAL BANK OF CHINA
|
FINANCIALS
|
4.3
|
|
CNOOC, LTD.
|
ENERGY
|
3.7
|
|
TENCENT HOLDINGS, LTD.
|
I.T.
|
3.3
|
|
ENN ENERGY HOLDINGS, LTD.
|
UTILITIES
|
2.9
|
|
CHINA MOBILE, LTD.
|
TELECOM
|
2.9
|
|
RUENTEX DEVELOPMENT CO., LTD.
|
FINANCIALS
|
2.6
|
|
Total
|
42.7
|
|
|
Direct Investments
|
Sector
|
%
|
|
GOLDEN MEDITECH HOLDINGS, LTD. 15.0%, 11/16/13
|
OTHERS
|
1.6
|
|
Total
|
1.6
|
Source: State Street Bank and Trust Company as at Aug 31, 2013.
|
Fund Details
|
|
NAV
|
$23.91
|
|
Market price
|
$20.81
|
|
Premium/Discount
|
-12.97%
|
|
Market cap
|
US$326.3m
|
|
Shares outstanding
|
15,682,029
|
|
Exchange listed
|
NYSE
|
|
Listing date
|
July 10, 1992
|
|
Benchmark
|
MSCI Golden Dragon Index (Total Return)
|
|
Fund Manager
|
Christina Chung
|
|
Listed and direct investment manager
|
RCM Asia Pacific Limited
|
Source: State Street Bank and Trust Company as at Aug 31, 2013.
|
Distribution History (10 years)
|
|
Declaration
date |
Ex-dividend
date
|
Record
date |
Payable
date |
Dividend/
Share |
Income
|
Long-term Capital
|
Short-term Capital
|
|
10 Dec 2012
|
20 Dec 2012
|
24 Dec 2012
|
28 Dec 2012
|
3.2517
|
0.3473
|
2.9044
|
0.0000
|
|
8 Dec 2011
|
21 Dec 2011
|
23 Dec 2011
|
29 Dec 2011
|
2.9964
|
0.1742
|
2.8222
|
0.0000
|
|
8 Dec 2010
|
21 Dec 2010
|
24 Dec 2010
|
29 Dec 2010
|
2.2742
|
0.3746
|
1.8996
|
0.0000
|
|
9 Dec 2009
|
22 Dec 2009
|
24 Dec 2009
|
29 Dec 2009
|
0.2557
|
0.2557
|
0.0000
|
0.0000
|
|
8 Dec 2008
|
22 Dec 2008
|
24 Dec 2008
|
23 Jan 2009
|
5.8174
|
0.4813
|
5.3361
|
0.0000
|
|
7 Dec 2007
|
19 Dec 2007
|
21 Dec 2007
|
25 Jan 2008
|
12.1200
|
0.2800
|
9.0000
|
2.8400
|
|
8 Dec 2006
|
19 Dec 2006
|
21 Dec 2006
|
29 Dec 2006
|
4.0117
|
0.2996
|
2.7309
|
0.9812
|
|
9 Dec 2005
|
19 Dec 2005
|
21 Dec 2005
|
29 Dec 2005
|
2.5119
|
0.2172
|
2.2947
|
0.0000
|
|
13 Dec 2004
|
20 Dec 2004
|
22 Dec 2004
|
7 Jan 2005
|
3.5701
|
0.1963
|
3.2664
|
0.1074
|
|
19 Dec 2003
|
29 Dec 2003
|
31 Dec 2003
|
15 Jan 2004
|
1.7800
|
0.0700
|
0.6700
|
1.0400
|
Source : State Street Bank and Trust Company as at December 31, 2012
2
The China Fund, Inc. (CHN)
The China Fund Inc. NAV Performance of USD $10,000 since inception (with dividends reinvested at NAV price)
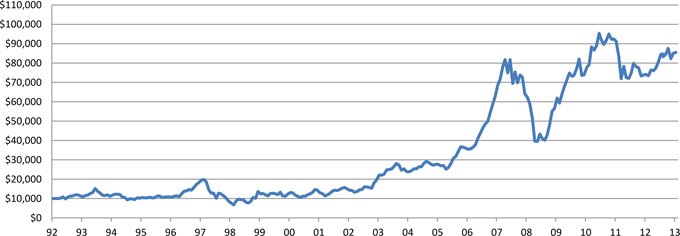
Past performance is not a guide to future returns.
Source: State Street Bank and Trust Company as at Aug 31, 2013.
The China Fund Inc. Premium / Discount

Past performance is not a guide to future returns.
Source: State Street Bank and Trust Company as at Aug 31, 2013.
3
The China Fund, Inc. (CHN)
Manager’s Commentary
Market Review
The Hong Kong equity market held up during the month, following the rebound in July. The recent ASEAN market correction did not have much of an adverse impact on the China and Hong Kong equity markets. Although corporate earnings results for the first half of 2013 were lackluster in general, share prices had largely priced in investors’ low expectations. Macroeconomic data has shown improvement, with the August HSBC China flash PMI beating expectations by rising to 50.1, the first reading above 50 in four months. It may be attributable to the initial filtering through of the Chinese government's recent fine-tuning policy measures and companies’ restocking activities. Given the latest economic data, there is a growing consensus that the Chinese economy has stabilized. Meanwhile, investors will continue to focus on news of reform initiatives in the coming months.
Among the Hong Kong focused companies, major blue chips continued to trade sideways. Property stocks posted lackluster performance on policy concerns as well as the risk of rising interest rates in the US in the medium to long term. Conversely, gaming stocks continued to perform strongly, helped by robust growth in Macau gaming revenue.
In Taiwan, July export orders were -4.4% month-on-month (+1.6% year-on-year), worse than consensus estimates of +5% year-on-year growth, mainly as a result of the worse than expected exports to Hong Kong and China. However during the month, technology companies in Apple’s supply chain were in focus as Apple is expected to launch the iPhone 5S and iPhone 5C in mid-September.
Fund Review
The Fund underperformed the benchmark in August, which was mainly attributable to stock selection in the consumer discretionary and materials sectors.
The top contributor for the month was Hand Enterprise. The share price of the company continued to be supported by the decent sales growth and the market re-rating of the sector. Another top active contributor was AIA. The Fund had no position in the stock and its relative underperformance helped the Fund. On the other hand, the top active detractor was ENN Energy. The share price weakness may be attributable to slightly weaker-than-expected industrial gas demand in first half of 2013. But the long-term thesis remains intact.
Outlook
We expect the Hong Kong market to trade higher in the short term. We believe that economic data from China will generally be positive in the second half of 2013, particularly in the third quarter, helped partly by a lower base of comparison, inventory restocking as well as a moderate recovery in the global economy. Coupled with expectations of reform initiatives likely to be announced over the next few months and low market valuations, Chinese equities are likely to post better performance in the second half of 2013. However, we maintain our view that the Chinese economy will continue to grow at a relatively moderate rate and hence, while we believe this market rebound may present a trading opportunity for cyclical stocks, we would continue to focus on stock selection particularly in the secular growth sectors that offer a more sustainable and visible earnings outlook. In addition, Hong Kong companies with exposure to the global economy should benefit from a brighter outlook for the global economy.
With respect to Taiwan, we remain confident on the outlook in the second half this year; even though the recent weaker-than-expected second quarter earnings results and downward guidance revisions for third quarter may generate short-term consolidation. The weak short-term outlook is largely due to a delayed peak season among the technology sector stocks in the third quarter, but we expect it to catch up in the fourth quarter on inventory re-stocking.
Source : RCM Asia Pacific Limited as at Aug 31, 2013.
4
The China Fund, Inc. (CHN)
Portfolio Holdings
|
CUSIP
|
Security Description
|
Cost Base
|
Base MV
|
Shares
|
Percentage of
Net Assets
|
|
B3VN92906
|
HAND Enterprise Solutions Co., Ltd.
|
1,793,493.00
|
26,230,383.00
|
9,554,573
|
7.0
|
|
663094902
|
China Everbright International, Ltd.
|
11,203,641.00
|
23,366,205.00
|
24,687,000
|
6.2
|
|
688910900
|
Taiwan Semiconductor Manufacturing Co., Ltd.
|
16,072,089.00
|
20,432,823.00
|
6,084,000
|
5.4
|
|
685992000
|
Sun Hung Kai Properties, Ltd.
|
17,289,798.00
|
16,462,030.00
|
1,269,000
|
4.4
|
|
B1G1QD902
|
Industrial & Commercial Bank of China
|
16,829,555.00
|
16,008,601.00
|
24,390,000
|
4.3
|
|
B00G0S903
|
CNOOC, Ltd.
|
14,516,684.00
|
13,996,209.00
|
7,048,000
|
3.7
|
|
B01CT3905
|
Tencent Holdings, Ltd.
|
7,312,795.00
|
12,295,707.00
|
262,100
|
3.3
|
|
633393905
|
Enn Energy Holdings, Ltd.
|
606,420.00
|
10,998,826.00
|
2,204,000
|
2.9
|
|
607355906
|
China Mobile, Ltd.
|
10,406,102.00
|
10,850,150.00
|
1,009,500
|
2.9
|
|
674842901
|
Ruentex Development Co., Ltd.
|
4,180,803.00
|
9,744,314.00
|
4,933,904
|
2.6
|
|
644094906
|
Taiwan FamilyMart Co., Ltd.
|
1,186,926.00
|
8,063,185.00
|
1,592,652
|
2.2
|
|
913BMZ902
|
Ping An Insurance (Group) Company of China, Ltd.
Access Product (expiration 06/30/15)
|
9,494,980.00
|
8,010,689.00
|
1,418,047
|
2.2
|
|
635186901
|
Digital China Holdings, Ltd.
|
13,205,899.00
|
8,009,305.00
|
7,256,000
|
2.2
|
|
17313A533
|
Gree Electric Appliances, Inc. Access Product
(expiration 01/17/14)
|
6,453,442.00
|
7,767,857.00
|
1,838,546
|
2.1
|
|
B15456906
|
Bank of China, Ltd.
|
8,369,492.00
|
7,493,478.00
|
17,771,000
|
2.0
|
|
658444906
|
Merida Industry Co., Ltd.
|
6,624,016.00
|
7,375,094.00
|
1,126,000
|
2.0
|
|
626073902
|
Delta Electronics, Inc.
|
4,550,608.00
|
7,312,821.00
|
1,615,000
|
2.0
|
|
B3WH02907
|
Hermes Microvision, Inc.
|
7,867,215.00
|
7,245,367.00
|
269,000
|
2.0
|
|
B2R2ZC908
|
CSR Corp., Ltd.
|
7,466,210.00
|
7,221,912.00
|
9,930,000
|
1.9
|
|
671815900
|
Qingling Motors Co., Ltd.
|
8,718,221.00
|
7,207,417.00
|
28,960,000
|
1.9
|
|
B1L8PB906
|
Tong Hsing Electronic Industries, Ltd.
|
5,919,469.00
|
7,147,989.00
|
1,380,000
|
1.9
|
|
619376908
|
China Resources Land, Ltd.
|
5,128,719.00
|
6,998,478.00
|
2,554,000
|
1.9
|
|
637248907
|
MediaTek, Inc.
|
6,194,126.00
|
6,855,687.00
|
559,000
|
1.8
|
|
959GRNII9
|
Taiwan Life Insurance Co., Ltd., 4.0%, 12/28/14
|
6,178,274.00
|
6,703,105.00
|
200,000,000
|
1.8
|
|
608169900
|
Beijing Enterprises Holdings, Ltd.
|
6,527,292.00
|
6,590,059.00
|
927,500
|
1.8
|
|
620267906
|
Advantech Co., Ltd.
|
4,104,778.00
|
6,522,014.00
|
1,284,000
|
1.7
|
|
644806002
|
Hutchison Whampoa, Ltd.
|
5,075,405.00
|
6,174,161.00
|
532,000
|
1.6
|
|
986PLG005
|
Golden Meditech Holdings, Ltd. 15.0%, 11/16/13
|
6,001,199.00
|
6,006,267.00
|
58,222,500
|
1.6
|
|
B3ZVDV905
|
Sinopharm Group Co., Ltd.
|
4,940,075.00
|
5,343,001.00
|
2,138,000
|
1.4
|
|
626735906
|
Hong Kong Exchanges and Clearing, Ltd.
|
4,947,274.00
|
4,699,332.00
|
306,500
|
1.3
|
|
B236JB905
|
Tiangong International Co., Ltd.
|
5,449,044.00
|
4,480,058.00
|
18,480,000
|
1.2
|
|
633521901
|
Taiwan Hon Chuan Enterprise Co., Ltd.
|
4,732,447.00
|
4,186,643.00
|
1,904,000
|
1.1
|
|
613623909
|
Hengan International Group Co., Ltd.
|
3,889,897.00
|
4,120,627.00
|
375,500
|
1.1
|
|
643055908
|
Golden Meditech Holdings, Ltd.
|
4,555,715.00
|
4,066,590.00
|
35,040,000
|
1.1
|
|
B57JY2909
|
China Minsheng Banking Corp., Ltd.
|
3,689,595.00
|
3,897,051.00
|
3,628,000
|
1.0
|
|
628625907
|
Li & Fung Ltd.
|
3,939,103.00
|
3,840,586.00
|
2,608,000
|
1.0
|
|
17313X574
|
China State Construction Engineering Corp., Ltd.
(expiration 01/17/14)
|
4,674,320.00
|
3,835,402.00
|
7,375,772
|
1.0
|
|
668787906
|
Kinsus Interconnect Technology Corp.
|
3,765,894.00
|
3,750,689.00
|
1,025,000
|
1.0
|
|
B633D9904
|
Zhongsheng Group Holdings, Ltd.
|
3,466,065.00
|
3,508,187.00
|
2,662,000
|
0.9
|
|
665157905
|
Comba Telecom Systems Holdings, Ltd.
|
7,565,579.00
|
3,462,111.00
|
10,958,500
|
0.9
|
|
B16NHT900
|
Shui On Land, Ltd.
|
4,155,622.00
|
3,435,732.00
|
11,055,500
|
0.9
|
|
B6VG8G904
|
Asian Pay Television Trust
|
4,074,574.00
|
3,403,088.00
|
5,200,000
|
0.9
|
|
99ZMCS903
|
Kweichow Moutai Co., Ltd. Access Product
(expiration 10/26/15)
|
4,046,181.00
|
3,082,020.00
|
112,684
|
0.8
|
|
651795908
|
Natural Beauty Bio-Technology, Ltd.
|
4,906,910.00
|
3,045,358.00
|
47,710,000
|
0.8
|
|
972ZGS900
|
Gree Electric Appliances, Inc. Access Product
(expiration 10/14/13)
|
1,898,593.00
|
1,817,802.00
|
430,249
|
0.5
|
|
B1TDQL904
|
Ping An Insurance (Group) Company of China, Ltd.
Access Product (expiration 01/17/14)
|
1,566,145.00
|
1,185,725.00
|
209,900
|
0.3
|
|
BD04NT905
|
Integrated Waste Solutions Group Holdings Ltd.
|
7,974,083.00
|
1,119,641.00
|
25,314,000
|
0.3
|
|
972ZHB906
|
China State Construction Engineering Corp., Ltd.
(expiration 07/28/14) |
886,370.00
|
809,350.00
|
1,555,844
|
0.2
|
|
ACI0090H8
|
Zong Su Foods (acquired 09/21/10)
|
15,000,034.00
|
0.00
|
2,677
|
0.0
|
Source: State Street Bank and Trust Company as at Aug 31, 2013.
5
The China Fund, Inc. (CHN)
The information contained herein has been obtained from sources believed to be reliable but RCM and its affiliates do not warrant the information to be accurate, complete or reliable. The opinions expressed herein are subject to change at any time and without notice. Past performance is not indicative of future results. This material is not intended as an offer or solicitation for the purchase or sale of any financial instrument. Investors should consider the investment objectives, risks, charges and expenses of any mutual fund carefully before investing. This and other information is contained in the fund’s annual and semi annual reports, proxy statement and other fund information, which may be obtained by contacting your financial advisor or visiting the fund’s website at www.chinafundinc.com. This information is unaudited and is intended for informational purposes only. It is presented only to provide information on investment strategies and opportunities. The Fund seeks to achieve its objective through investment in the equity securities of companies and other entities with significant assets, investments, production activities, trading or other business interests in China or which derive a significant part of their revenue from China. Investing in non-U.S. securities entails additional risks, including political and economic risk and the risk of currency fluctuations, as well as lower liquidity. These risks, which can result in greater price volatility, will generally be enhanced in less diversified funds that concentrate investments in a particular geographic region. The Fund is a closed-end exchange traded management investment company. This material is presented only to provide information and is not intended for trading purposes. Closed-end funds, unlike open-end funds, are not continuously offered. After the initial public offering, shares are sold on the open market through a stock exchange, where shares may trade at a premium or a discount. Holdings are subject to change daily.