Attached files
| file | filename |
|---|---|
| EXCEL - IDEA: XBRL DOCUMENT - RED METAL RESOURCES, LTD. | Financial_Report.xls |
| EX-31.2 - CERTIFICATION - RED METAL RESOURCES, LTD. | rmes_ex312.htm |
| EX-31.1 - CERTIFICATION - RED METAL RESOURCES, LTD. | rmes_ex311.htm |
| EX-32.1 - CERTIFICATION - RED METAL RESOURCES, LTD. | rmes_ex321.htm |
UNITED STATES
SECURITIES AND EXCHANGE COMMISSION
Washington, D.C. 20549
FORM 10-Q
[X] QUARTERLY REPORT UNDER SECTION 13 OR 15(d) OF THE SECURITIES EXCHANGE ACT OF 1934
For the quarterly period ended: July 31, 2013
[ ] TRANSITION REPORT UNDER SECTION 13 OR 15(d) OF THE SECURITIES EXCHANGE ACT OF 1934
For the transition period from_______to_______
Commission file number 000-52055
| RED METAL RESOURCES LTD. |
| (Exact name of small business issuer as specified in its charter) |
| Nevada (State or other jurisdiction of incorporation or organization) | 20-2138504 (I.R.S. Employer Identification No.) |
|
| |
| 195 Park Avenue, Thunder Bay Ontario, Canada P7B 1B9 (Address of principal executive offices) (Zip Code) | |
|
| |
| (807) 345-7384 (Issuer’s telephone number) | |
Indicate by check mark whether the registrant (1) has filed all reports required to be filed by Section 13 or 15(d) of the Exchange Act during the past 12 months (or for such shorter period that the registrant was required to file such reports), and (2) has been subject to such filing requirements for the past 90 days. [ X ] Yes [ ] No
Indicate by check mark whether the registrant has submitted electronically and posted on its corporate Web site, if any, every Interactive Data File required to be submitted and posted pursuant to Rule 405 of Regulation S-T (§232.405 of this chapter) during the preceding 12 months (or for such shorter period that the registrant was required to submit and post such files).
[ X ] Yes [ ] No
Indicate by check mark whether the registrant is a large accelerated filer, an accelerated filer, a non-accelerated filer, or a smaller reporting company. See the definitions of “large accelerated filed,” “accelerated filer” and “smaller reporting company” in Rule 12b-2 of the Exchange Act.
| Large accelerated filer | [ ] |
| Accelerated filer | [ ] |
| Non-accelerated filer | [ ] | (Do not check if a smaller reporting company) | Smaller reporting company | [X] |
Indicate by check mark whether the registrant is a shell company (as defined in Rule 12b-2 of the Act). [ ] Yes [ X ] No
Indicate the number of shares outstanding of each of the issuer’s classes of common stock, as of the latest practicable date. As of September 11, 2013, the number of shares of the registrant’s common stock outstanding was 17,956,969.
PART I-FINANCIAL INFORMATION
Item 1. Financial Statements.
RED METAL RESOURCES LTD.
(AN EXPLORATION STAGE COMPANY)
CONSOLIDATED BALANCE SHEETS
(Unaudited)
|
| July 31, 2013 |
| January 31, 2013 | ||
|
| (Unaudited) |
|
| ||
| ASSETS |
|
|
| ||
| Current assets |
|
|
| ||
|
|
|
|
| ||
| Cash | $ | 3,997 |
| $ | 3,151 |
| Prepaids and other receivables |
| 1,176 |
|
| 991 |
| Total current assets |
| 5,173 |
|
| 4,142 |
|
|
|
|
|
|
|
| Equipment |
| 10,473 |
|
| 12,224 |
| Unproved mineral properties |
| 872,789 |
|
| 852,611 |
| Total assets | $ | 888,435 |
| $ | 868,977 |
|
|
|
|
|
|
|
| LIABILITIES AND STOCKHOLDERS' DEFICIT |
|
|
|
|
|
| Current liabilities |
|
|
|
|
|
|
|
|
|
|
|
|
| Accounts payable | $ | 305,494 |
| $ | 302,018 |
| Accrued liabilities |
| 182,710 |
|
| 142,126 |
| Due to related parties |
| 819,201 |
|
| 1,308,982 |
| Notes payable to related parties |
| 256,799 |
|
| 334,128 |
| Notes payable |
| 750,000 |
|
| - |
| Total liabilities |
| 2,314,204 |
|
| 2,087,254 |
|
|
|
|
|
|
|
| Stockholders' deficit |
|
|
|
|
|
|
|
|
|
|
|
|
| Common stock, $0.001 par value, authorized 500,000,000, |
|
|
|
|
|
| 17,956,969 issued and outstanding at July 31, 2013 and January 31, 2013 |
| 17,957 |
|
| 17,957 |
| Additional paid in capital |
| 5,978,101 |
|
| 5,958,101 |
| Deficit accumulated during the exploration stage |
| (7,384,256) |
|
| (7,085,429) |
| Accumulated other comprehensive loss |
| (37,571) |
|
| (108,906) |
| Total stockholder's deficit |
| (1,425,769) |
|
| (1,218,277) |
| Total liabilities and stockholders' deficit | $ | 888,435 |
| $ | 868,977 |
The accompanying notes are an integral part of these interim consolidated financial statements
1
RED METAL RESOURCES LTD.
(AN EXPLORATION STAGE COMPANY)
CONSOLIDATED STATEMENTS OF OPERATIONS
(Unaudited)
|
|
|
| Three months ended |
| Six months ended |
| From January 10, | |||||||
|
|
|
| July 31, |
| July 31, |
| 2005 (Inception) | |||||||
|
|
|
| 2013 | 2012 |
| 2013 | 2012 |
| to July 31, 2013 | |||||
| Revenue |
|
|
|
|
|
|
|
|
| |||||
|
|
|
|
|
|
|
|
|
|
| |||||
| Royalties |
|
| $ | - | $ | - |
| $ | - | $ | - |
| $ | 15,658 |
| Geological services |
|
|
| - |
| - |
|
| - |
| 7,804 |
|
| 7,804 |
|
|
|
|
| - |
| - |
|
| - |
| 7,804 |
|
| 23,462 |
|
|
|
|
|
|
|
|
|
|
|
|
|
|
|
|
| Operating expenses |
|
|
|
|
|
|
|
|
|
|
|
|
|
|
| Administration |
|
|
| 14,043 |
| 10,086 |
|
| 25,742 |
| 20,201 |
|
| 385,293 |
| Advertising and promotion |
|
|
| 3,398 |
| 18,570 |
|
| 5,496 |
| 41,544 |
|
| 572,571 |
| Amortization |
|
|
| 857 |
| 1,171 |
|
| 1,751 |
| 2,407 |
|
| 9,347 |
| Automobile |
|
|
| 1,189 |
| 1,230 |
|
| 3,030 |
| 5,474 |
|
| 103,577 |
| Bank charges |
|
|
| 1,163 |
| 2,108 |
|
| 2,459 |
| 3,476 |
|
| 31,791 |
| Consulting fees |
|
|
| 29,999 |
| 79,410 |
|
| 65,971 |
| 160,122 |
|
| 1,083,301 |
| Interest on current debt |
|
|
| 27,565 |
| 60,642 |
|
| 54,565 |
| 75,674 |
|
| 433,060 |
| IVA expense |
|
|
| 621 |
| 811 |
|
| 1,508 |
| 3,164 |
|
| 39,928 |
| Mineral exploration costs |
|
|
| 28,318 |
| 52,376 |
|
| 30,131 |
| 183,196 |
|
| 2,167,237 |
| Office |
|
|
| 3,608 |
| 5,454 |
|
| 10,170 |
| 14,419 |
|
| 84,296 |
| Professional development |
|
|
| - |
|
|
|
|
|
|
|
|
| 5,116 |
| Professional fees |
|
|
| 22,343 |
| 18,407 |
|
| 37,334 |
| 76,422 |
|
| 836,939 |
| Rent |
|
|
| 3,324 |
| 3,393 |
|
| 6,817 |
| 6,801 |
|
| 75,667 |
| Regulatory |
|
|
| 1,435 |
| 7,709 |
|
| 7,512 |
| 28,341 |
|
| 124,242 |
| Travel and entertainment |
|
|
| 176 |
| 7,880 |
|
| 3,385 |
| 29,534 |
|
| 328,288 |
| Salaries, wages and benefits |
|
|
| 13,620 |
| 21,464 |
|
| 37,520 |
| 45,059 |
|
| 255,379 |
| Stock based compensation |
|
|
| - |
| - |
|
|
|
| - |
|
| 527,318 |
| Foreign exchange loss (gain) |
|
|
| (316) |
| (909) |
|
| (564) |
| (565) |
|
| 14,054 |
| Write-down of unproved mineral properties |
|
|
| - |
| 6,927 |
|
| 6,000 |
| 6,927 |
|
| 330,314 |
|
|
|
|
| 151,343 |
| 296,729 |
|
| 298,827 |
| 702,196 |
|
| 7,407,718 |
|
|
|
|
|
|
|
|
|
|
|
|
|
|
|
|
| Net loss |
|
| $ | (151,343) | $ | (296,729) |
| $ | (298,827) | $ | (694,392) |
| $ | (7,384,256) |
|
|
|
|
|
|
|
|
|
|
|
|
|
|
|
|
|
|
|
|
|
|
|
|
|
|
|
|
|
|
|
|
| Net loss per share - basic and diluted |
|
| $ | (0.01) | $ | (0.02) |
| $ | (0.02) | $ | (0.04) |
|
|
|
|
|
|
|
|
|
|
|
|
|
|
|
|
|
|
|
| Weighted average number of shares |
|
|
|
|
|
|
|
|
|
|
|
|
|
|
| outstanding - basic and diluted |
|
|
| 17,956,969 |
| 17,584,212 |
|
| 17,956,969 |
| 17,584,212 |
|
|
|
The accompanying notes are an integral part of these interim consolidated financial statements
2
RED METAL RESOURCES LTD.
(AN EXPLORATION STAGE COMPANY)
CONSOLIDATED STATEMENT OF STOCKHOLDERS' EQUITY (DEFICIT)
FOR THE PERIOD FROM JANUARY 10, 2005 (INCEPTION) TO JULY 31, 2013
|
| Common Stock Issued |
|
| Accumulated |
| ||||||||
|
|
|
| Additional |
| Other |
| |||||||
|
| Number of |
| Paid-in | Accumulated | Comprehensive |
| |||||||
|
| Shares | Amount | Capital | Deficit | Gain / (Loss) | Total | |||||||
| Balance at January 10, 2005 (Inception) | - | $ | - | $ | - | $ | - | $ | - | $ | - | ||
|
|
|
|
|
|
|
|
|
|
|
|
| ||
| Net loss | - |
| - |
| - |
| (825) |
| - |
| (825) | ||
|
|
|
|
|
|
|
|
|
|
|
|
| ||
| Balance at January 31, 2005 | - |
| - |
| - |
| (825) |
| - |
| (825) | ||
|
|
|
|
|
|
|
|
|
|
|
|
| ||
| Common stock issued for cash | 5,525,000 |
| 5,525 |
| 53,725 |
| - |
| - |
| 59,250 | ||
| Common stock adjustment | 45 |
| - |
| - |
| - |
| - |
| - | ||
| Donated services | - |
| - |
| 3,000 |
| - |
| - |
| 3,000 | ||
| Net loss | - |
| - |
| - |
| (12,363) |
| - |
| (12,363) | ||
|
|
|
|
|
|
|
|
|
|
|
|
| ||
| Balance at January 31, 2006 | 5,525,045 |
| 5,525 |
| 56,725 |
| (13,188) |
| - |
| 49,062 | ||
|
|
|
|
|
|
|
|
|
|
|
|
| ||
| Donated services | - |
| - |
| 9,000 |
| - |
| - |
| 9,000 | ||
| Net loss | - |
| - |
| - |
| (43,885) |
| - |
| (43,885) | ||
|
|
|
|
|
|
|
|
|
|
|
|
| ||
| Balance at January 31, 2007 | 5,525,045 |
| 5,525 |
| 65,725 |
| (57,073) |
| - |
| 14,177 | ||
|
|
|
|
|
|
|
|
|
|
|
|
| ||
| Donated services | - |
| - |
| 2,250 |
| - |
| - |
| 2,250 | ||
| Return of common stock to treasury | (1,750,000) |
| (1,750) |
| 1,749 |
| - |
| - |
| (1) | ||
| Common stock issued for cash | 23,810 |
| 24 |
| 99,976 |
| - |
| - |
| 100,000 | ||
| Net loss | - |
| - |
| - |
| (232,499) |
| - |
| (232,499) | ||
|
|
|
|
|
|
|
|
|
|
|
|
| ||
| Balance at January 31, 2008 | 3,798,855 |
| 3,799 |
| 169,700 |
| (289,572) |
| - |
| (116,073) | ||
|
|
|
|
|
|
|
|
|
|
|
|
| ||
| Common stock issued for cash | 357,147 |
| 357 |
| 1,299,643 |
| - |
| - |
| 1,300,000 | ||
| Net loss | - |
| - |
| - |
| (1,383,884) |
| - |
| (1,383,884) | ||
| Foreign currency exchange loss | - |
| - |
| - |
| - |
| (21,594) |
| (21,594) | ||
|
|
|
|
|
|
|
|
|
|
|
|
| ||
| Balance at January 31, 2009 | 4,156,002 |
| 4,156 |
| 1,469,343 |
| (1,673,456) |
| (21,594) |
| (221,551) | ||
|
|
|
|
|
|
|
|
|
|
|
|
| ||
| Common stock issued for cash | 1,678,572 |
| 1,678 |
| 160,822 |
| - |
| - |
| 162,500 | ||
| Common stock issued for debt | 3,841,727 |
| 3,843 |
| 1,148,675 |
| - |
| - |
| 1,152,518 | ||
| Net loss | - |
| - |
| - |
| (710,745) |
| - |
| (710,745) | ||
| Foreign currency exchange loss | - |
| - |
| - |
| - |
| (35,816) |
| (35,816) | ||
|
|
|
|
|
|
|
|
|
|
|
|
| ||
| Balance at January 31, 2010 | 9,676,301 |
| 9,677 |
| 2,778,840 |
| (2,384,201) |
| (57,410) |
| 346,906 | ||
|
|
|
|
|
|
|
|
|
|
|
|
| ||
| Common stock issued for cash | 540,000 |
| 540 |
| 134,460 |
| - |
| - |
| 135,000 | ||
| Net loss for the year ended January 31, 2011 | - |
| - |
| - |
| (672,618) |
| - |
| (672,618) | ||
| Foreign currency exchange loss | - |
| - |
| - |
| - |
| (13,438) |
| (13,438) | ||
|
|
|
|
|
|
|
|
|
|
|
|
| ||
| Balance at January 31, 2011 | 10,216,301 |
| 10,217 |
| 2,913,300 |
| (3,056,819) |
| (70,848) |
| (204,150) | ||
|
|
|
|
|
|
|
|
|
|
|
|
| ||
| Common stock issued for cash | 6,290,000 |
| 6,290 |
| 1,821,810 |
| - |
| - |
| 1,828,100 | ||
| Common stock issued for debt | 433,333 |
| 433 |
| 129,567 |
| - |
| - |
| 130,000 | ||
| Warrants exercised for cash | 83,333 |
| 83 |
| 24,916 |
| - |
| - |
| 24,999 | ||
| Warrants exercised for debt | 166,667 |
| 167 |
| 49,833 |
| - |
| - |
| 50,000 | ||
| Stock options | - |
| - |
| 527,318 |
| - |
| - |
| 527,318 | ||
| Net loss for the year ended January 31, 2012 | - |
| - |
| - |
| (2,928,188) |
| - |
| (2,928,188) | ||
| Foreign currency exchange loss | - |
| - |
| - |
| - |
| (15,673) |
| (15,673) | ||
|
|
|
|
|
|
|
|
|
|
|
|
| ||
| Balance at January 31, 2012 | 17,189,634 |
| 17,190 |
| 5,466,744 |
| (5,985,007) |
| (86,521) |
| (587,594) | ||
|
|
|
|
|
|
|
|
|
|
|
|
| ||
| Warrants exercised for cash | 500,000 |
| 500 |
| 149,500 |
| - |
| - |
| 150,000 | ||
| Common stock issued for cash | 267,335 |
| 267 |
| 120,034 |
| - |
| - |
| 120,301 | ||
| Net loss for the six months ended July 31, 2012 | - |
| - |
| - |
| (694,391) |
| - |
| (694,391) | ||
| Foreign currency exchange loss | - |
| - |
| - |
| - |
| (11,838) |
| (11,838) | ||
|
|
|
|
|
|
|
|
|
|
|
|
| ||
| Balance at July 31, 2012 | 17,956,969 |
| 17,957 |
| 5,736,278 |
| (6,679,398) |
| (98,359) |
| (1,023,522) | ||
|
|
|
|
|
|
|
|
|
|
|
|
| ||
| Extinguishment of related party debt | - |
| - |
| 191,823 |
| - |
| - |
| 191,823 | ||
| Donated services | - |
| - |
| 30,000 |
| - |
| - |
| 30,000 | ||
| Net loss for the six months ended January 31, 2013 | - |
| - |
| - |
| (406,031) |
| - |
| (406,031) | ||
| Foreign currency exchange loss | - |
| - |
| - |
| - |
| (10,547) |
| (10,547) | ||
|
|
|
|
|
|
|
|
|
|
|
|
| ||
| Balance at January 31, 2013 | 17,956,969 |
| 17,957 |
| 5,958,101 |
| (7,085,429) |
| (108,906) |
| (1,218,277) | ||
|
|
|
|
|
|
|
|
|
|
|
|
| ||
| Donated services | - |
| - |
| 20,000 |
| - |
| - |
| 20,000 | ||
| Net loss for the six months ended July 31, 2013 | - |
| - |
| - |
| (298,827) |
| - |
| (298,827) | ||
| Foreign currency exchange gain | - |
| - |
| - |
| - |
| 71,335 |
| 71,335 | ||
|
|
|
|
|
|
|
|
|
|
|
|
| ||
| Balance at July 31, 2013 | 17,956,969 | $ | 17,957 | $ | 5,978,101 | $ | (7,384,256) | $ | (37,571) | $ | (1,425,769) | ||
The accompanying notes are an integral part of these interim consolidated financial statements
3
RED METAL RESOURCES LTD.
(AN EXPLORATION STAGE COMPANY)
CONSOLIDATED STATEMENTS OF CASH FLOWS
|
| For the Six Months | From January 10, | ||||
|
| Ended July 31, | 2005 (Inception) | ||||
|
| 2013 | 2012 | to July 31, 2013 | |||
| Cash flows used in operating activities: |
|
|
| |||
| Net loss | $ | (298,827) | $ | (694,391) | $ | (7,384,256) |
| Adjustments to reconcile net loss to net cash used in operating activities: |
|
|
|
|
|
|
| Donated services and rent |
| 20,000 |
| - |
| 64,250 |
| Write-down of unproved mineral properties |
| 6,000 |
| 6,926 |
| 330,315 |
| Amortization |
| 1,751 |
| 2,407 |
| 9,347 |
| Stock based compensation |
| - |
| - |
| 527,318 |
|
|
|
|
|
|
|
|
| Changes in operating assets and liabilities: |
|
|
|
|
|
|
| Prepaids and other receivables |
| (193) |
| 41,248 |
| (1,184) |
| Accounts payable |
| 3,957 |
| 56,492 |
| 305,976 |
| Accrued liabilities |
| 53,454 |
| 42,475 |
| 339,504 |
| Due to related parties |
| 160,439 |
| 367,104 |
| 1,996,067 |
| Accrued interest on notes payable to related party |
| 13,941 |
| 9,774 |
| 119,516 |
|
|
|
|
|
|
|
|
| Net cash used in operating activities |
| (39,478) |
| (167,965) |
| (3,693,147) |
|
|
|
|
|
|
|
|
| Cash flows used in investing activities: |
|
|
|
|
|
|
| Purchase of equipment |
| - |
| - |
| (19,820) |
| Additions to unproved mineral properties |
| (39,048) |
| (112,283) |
| (1,355,028) |
|
|
|
|
|
|
|
|
| Net cash used in investing activities |
| (39,048) |
| (112,283) |
| (1,374,848) |
|
|
|
|
|
|
|
|
| Cash flows provided by financing activities: |
|
|
|
|
|
|
| Cash received on issuance of notes payable to related party |
| 29,773 |
| 96,944 |
| 1,322,084 |
| Repayment of related party notes, including accrued interest |
| - |
| (56,553) |
| (70,935) |
| Proceeds from issuance of common stock |
| - |
| 270,301 |
| 3,880,150 |
|
|
|
|
|
|
|
|
| Net cash provided by financing activities |
| 29,773 |
| 310,692 |
| 5,131,299 |
|
|
|
|
|
|
|
|
| Effects of foreign currency exchange |
| 49,599 |
| (11,395) |
| (59,307) |
|
|
|
|
|
|
|
|
| Increase in cash |
| 846 |
| 19,049 |
| 3,997 |
|
|
|
|
|
|
|
|
| Cash, beginning |
| 3,151 |
| 24,467 |
| - |
|
|
|
|
|
|
|
|
| Cash, ending | $ | 3,997 | $ | 43,516 | $ | 3,997 |
|
|
|
|
|
|
|
|
| Supplemental disclosures: |
|
|
|
|
|
|
| Cash paid for: |
|
|
|
|
|
|
| Income tax | $ | - | $ | - | $ | - |
| Interest | $ | - | $ | (1,778) | $ | (8,331) |
The accompanying notes are an integral part of these interim consolidated financial statements
4
RED METAL RESOURCES LTD.
(AN EXPLORATION STAGE COMPANY)
NOTES TO THE INTERIM CONSOLIDATED FINANCIAL STATEMENTS
JULY 31, 2013
NOTE 1 - ORGANIZATION AND BASIS OF PRESENTATION
Nature of Operations
Red Metal Resources Ltd. (the “Company”) was incorporated on January 10, 2005, under the laws of the State of Nevada. On August 21, 2007, the Company acquired a 99% interest in Minera Polymet Limitada (“Polymet”), a limited liability company formed on August 21, 2007, under the laws of the Republic of Chile. The Company is involved in acquiring and exploring mineral properties in Chile. The Company has not determined whether its properties contain mineral reserves that are economically recoverable.
Unaudited Interim Consolidated Financial Statements
The unaudited interim financial statements of the Company have been prepared in accordance with United States generally accepted accounting principles (“GAAP”) for interim financial information and the rules and regulations of the Securities and Exchange Commission (“SEC”). They do not include all information and footnotes required by GAAP for complete financial statements. Except as disclosed herein, there have been no material changes in the information disclosed in the notes to the financial statements for the year ended January 31, 2013, included in the Company’s Annual Report on Form 10-K, filed with the SEC. The interim unaudited financial statements should be read in conjunction with those financial statements included in Form 10-K. In the opinion of management, all adjustments considered necessary for fair presentation, consisting solely of normal recurring adjustments, have been made. Operating results for the six month period ended July 31, 2013 are not necessarily indicative of the results that may be expected for the year ending January 31, 2014.
Recent Accounting Pronouncements
The Company has reviewed recently issued accounting pronouncements and plans to adopt those that are applicable to it. It does not expect the adoption of these pronouncements to have a material impact on its financial position, results of operations or cash flows.
NOTE 2 - RELATED-PARTY TRANSACTIONS
The following amounts were due to related parties as at:
| Due to Related Parties |
| July 31, 2013 | January 31, 2013 |
|
|
|
|
|
| Due to a company owned by an officer (a) |
| $ 305,715 | $ 269,097 |
| Due to a company controlled by directors (b) |
| 389,687 | 894,377 |
| Due to a company controlled by a major shareholder (a) |
| 77,255 | 94,588 |
| Due to a major shareholder (a) |
| 46,544 | 50,920 |
| Total due to related parties |
| $ 819,201 | $ 1,308,982 |
|
|
|
|
|
| Notes Payable to Related Parties |
| July 31, 2013 | January 31, 2013 |
|
|
|
|
|
| Note payable to a director (c) |
| $ 168,873 | $ 136,532 |
| Note payable to a chief financial officer (c) |
| 9,581 | 9,210 |
| Note payable to a major shareholder (c) |
| 7,969 | 118,797 |
| Note payable to a company controlled by directors (c) |
| 70,376 | 69,589 |
| Total notes payable to related parties |
| $ 256,799 | $ 334,128 |
(a) Amounts are unsecured, are due on demand and bear no interest.
(b) Amount is unsecured, due on demand, and bears simple interest at 10% per annum.
(c) The notes payable to related parties are due on demand, unsecured and bear interest at 8% per annum.
During the six months ended July 31, 2013 and 2012 interest expense of $13,941 and $9,804, respectively, was incurred on the related party notes.
During July 2013, $750,000 of debt was reassigned to non-related parties. The Company intends to convert this debt to 15,000,000 common shares.
5
The amounts reassigned to non-related debt holders are presented in the table below:
| Debt reassigned to non-related parties by related parties |
| July 31, 2013 |
|
|
|
|
| Partial reduction of a debt due to a company controlled by directors |
| $ 560,000 |
| Partial reduction of the note and accrued interest due to a major shareholder |
| 115,000 |
| Partial reduction of a debt due to a company controlled by a major shareholder |
| 75,000 |
| Total debt reassigned to non-related parties (a) |
| $ 750,000 |
(a) The underlying terms of reassigned debt have not changed.
Transactions with Related Parties
During the six months ended July 31, 2013 and 2012, the Company incurred the following direct expenses with related parties:
|
| July 31, 2013 | July 31, 2012 |
|
|
|
|
| Consulting fees paid or accrued to a company owned by the Chief Financial Officer | $ 40,000 | $ 148,277 |
| Consulting fees donated by a company owned by the Chief Financial Officer | 20,000 | - |
| Mineral exploration fees paid to a company controlled by two directors | 23,331 | 144,908 |
| Rental fees paid to a company controlled by a major shareholder | 6,817 | 6,801 |
|
| $ 90,148 | $ 299,986 |
These transactions were in the normal course of operations and were measured at the exchange amount, which is the amount of consideration established and agreed to by the related parties.
NOTE 3 - UNPROVED MINERAL PROPERTIES
At July 31, 2013, the Company has three active projects which it is currently exploring and evaluating: the Farellon, Perth, and Mateo. These properties consist of both mining and exploration claims.
Mineral Claims | Balance, January 31, 2013 | Additions / Payments | Property Taxes Paid / Accrued | Write- down | Balance, July 31, 2013 |
| Farellon Project |
|
|
|
|
|
| Farellon Alto 1-8(1) | $ 580,234 | $ - | $ 8,910 | $ (4,838) | $ 584,306 |
| Cecil | 54,076 | - | 3,877 | (8,032) | 49,921 |
|
| 634,310 | - | 12,787 | (12,870) | 634,227 |
| Perth Project |
|
|
|
|
|
| Perth(3) | 75,346 | (37,500) | 21,967 | - | 59,813 |
|
|
|
|
|
|
|
| Mateo Project |
|
|
|
|
|
| Margarita | 19,099 | - | 476 | - | 19,575 |
| Che (2) | 25,079 | - | 1,292 | - | 26,371 |
| Irene | 48,142 | - | 510 | - | 48,652 |
| Mateo | 50,635 | - | 33,516 | - | 84,151 |
|
| 142,955 | - | 35,794 | - | 178,749 |
| Generative Claims | - | 6,000 | - | (6,000) | - |
|
|
|
|
|
|
|
| Total Costs | $ 852,611 | $ (31,500) | $ 70,548 | $ (18,870) | $ 872,789 |
(1) The claim is subject to a 1.5% royalty on the net sales of minerals extracted from the property to a total of $600,000. The royalty payments are due monthly once exploitation begins, and are subject to minimum payments of $1,000 per month. The Company has no obligation to pay the royalty if it does not commence exploitation.
(2) The claims are subject to a 1% royalty on the net sales of minerals extracted from the property to a total of $100,000. The royalty payments are due monthly once exploitation begins and are not subject to minimum payments. The Company has no obligation to pay the royalty if it does not commence exploitation.
(3) See Perth Project discussion below.
6
Perth Project
On April 30, 2013, the Company granted Geoactiva SpA (“Geoactiva”) an option to purchase 100% of the Perth property through the execution of a mining option purchase agreement (the “Option Agreement”).
To maintain the option and acquire the property, Geoactiva agreed to pay the Company $1,000,000, of which $37,500 was paid on April 30, 2013, and incur exploration expenses over 48 months as set out in the following table.
Date | Option Payments | Exploration Expenditures |
| April 30, 2013 (paid) | $ 37,500 | $ - |
| October 30, 2013 | 37,500 | - |
| April 30, 2014 | 50,000 | 500,000 |
| October 30, 2014 | 50,000 | - |
| April 30, 2015 | 100,000 | 1,000,000 |
| October 30, 2015 | 100,000 | - |
| April 30, 2016 | 125,000 | 1,000,000 |
| October 30, 2016 | 250,000 | - |
| April 30, 2017 | 250,000 | 1,000,000 |
| Total | $ 1,000,000 | $ 3,500,000 |
Upon exercise of the Option Agreement and once the commercial production begins, Geoactiva will pay the Company Net Smelter Royalty (“NSR”) of 1.5% from the sale of gold, copper, and cobalt extracted from the Perth property. At any time after the exercise of the Option Agreement and Geoactiva’s fulfilment of the investment commitment of $3,500,000 in exploration expenditures, Geoactiva may purchase 100% of the NSR as follows:
Gold: paying $5 per inferred ounce of gold, according to the definition of Inferred Mineral Resource in the CIM Definition Standards on Mineral Resources and Mineral Reserves.
Copper: $0.005 per inferred ounce of copper, according to the definition of Inferred Mineral Resource in the CIM Definition Standards on Mineral Resources and Mineral Reserves.
Cobalt: If Geoactiva acquires the NSR with respect to gold, copper, or both, the NSR relating to cobalt will be terminated.
NOTE 4 - COMMON STOCK
During the six months ended July 31, 2013, the Company did not have any transactions that resulted in issuance of its common stock.
| Warrants | July 31, 2013 | January 31, 2013 |
| Opening Balance | 7,187,001 | 7,459,666 |
| Granted | - | 267,335 |
| Exercised | - | (500,000) |
| Expired | - | (40,000) |
| Closing Balance | 7,187,001 | 7,187,001 |
On April 5, 2013, the Company extended the term of the warrants issued as part of the April 7, 2011 private equity financing for an additional year, from April 7, 2013 to April 7, 2014, and lowered the exercise price to $0.10. The incremental increase in fair value of the modified warrants is $526,690.
The weighted average life of the warrants at July 31, 2013 is 0.69 years and weighted average exercise price - $0.12.
Options
There were no options issued during the six months ended July 31, 2013.
On September 2, 2013, all of the remaining 1,040,000 options expired unexercised.
7
Item 2. Management’s Discussion and Analysis of Financial Condition and Results of Operations.
Forward-Looking Statements
This quarterly report on Form 10-Q filed by Red Metal Resources Ltd. contains forward-looking statements. These are statements regarding financial and operating performance and results and other statements that are not historical facts. The words “expect,” “project,” “estimate,” “believe,” “anticipate,” “intend,” “plan,” “forecast,” and similar expressions are intended to identify forward-looking statements. Certain important risks could cause results to differ materially from those anticipated by some of the forward-looking statements. Some, but not all, of these risks include, among other things:
·
general economic conditions, because they may affect our ability to raise money
·
our ability to raise enough money to continue our operations
·
changes in regulatory requirements that adversely affect our business
·
changes in the prices for minerals that adversely affect our business
·
political changes in Chile, which could affect our interests there
·
other uncertainties, all of which are difficult to predict and many of which are beyond our control
We caution you not to place undue reliance on these forward-looking statements, which reflect our management’s view only as of the date of this report. We are not obligated to update these statements or publicly release the results of any revisions to them to reflect events or circumstances after the date of this report or to reflect the occurrence of unanticipated events. You should refer to, and carefully review, the information in future documents we file with the Securities and Exchange Commission.
General
You should read this discussion and analysis in conjunction with our interim unaudited consolidated financial statements and related notes included in this Form 10-Q and the audited consolidated financial statements and related notes included in our annual report on Form 10-K for the fiscal year ended January 31, 2013. The inclusion of supplementary analytical and related information may require us to make estimates and assumptions to enable us to fairly present, in all material respects, our analysis of trends and expectations with respect to our results of operations and financial position taken as a whole. Actual results may vary from the estimates and assumptions we make.
Overview
Red Metal Resources Ltd. (“Red Metal”, or “the Company”) is a mineral exploration company engaged in locating, and eventually developing, mineral resources in Chile. Our business strategy is to identify, acquire and explore prospective mineral claims with a view to either developing them ourselves or, more likely, finding a joint venture partner with the mining experience and financial means to undertake the development. All of our claims are in the Candelaria IOCG belt in the Chilean Coastal Cordillera.
On April 30, 2013, Minera Polymet Limitada, our Chilean subsidiary, granted Geoactiva SpA, a Chilean mining company (“Geoactiva”), an option to purchase 100% of our Perth property. To maintain the option and acquire the property, Geoactiva agreed to pay Minera Polymet $1,000,000 and incur $3,500,000 in exploration expenses over 48 months. For further information about this transaction, see the discussion titled “Option with Geoactiva SpA” included in the “Unproved Mineral Properties” section of this report. As of July 31, 2013, Geoactiva had not commenced exploration activities on the Perth property.
Aside from the above option to purchase, we have generated only minimal revenue from operations and are dependent upon the equity markets for our working capital. Despite the current market volatility, we are optimistic that we can raise equity capital under these market conditions. We completed an offering of 6,723,333 units on April 7, 2011 at $0.30 per unit. Each unit consisted of one share of our common stock and one warrant for the purchase of one share of common stock exercisable at $0.50 per share for two years. We have since reduced the exercise price of the warrants to $0.10 per share and extended the term to April 7, 2014. We realized net cash proceeds of $1,862,462 from this offering and the payment of $130,000 in debt.
8
On August 12, 2013, in an effort to reduce our debt we reached an agreement with certain debt holders to accept 15,000,000 shares of our common stock at a price of $0.05 per share as payment for an aggregate $750,000 of debt. $108,000 of the debt was initially owed to Richard Jeffs, the father of our CEO and the major shareholder, for loans made to us for working capital. The loans were evidenced by promissory notes, which were due on demand and accrued interest at the rate of 8%, compounded monthly. Mr. Jeffs assigned the right to payment of this debt, for value, to two unaffiliated entities. $560,000 of the debt represented invoices from Fladgate Exploration Consulting Corporation, a company controlled by two of our directors, for services rendered to us. This amount did not accrue interest. Fladgate Exploration Consulting Corporation assigned the right to payment of this amount, for value, to eight unaffiliated entities. $75,000 of the debt represented non-interest bearing advances made to us for working capital by Minera Farellon Limitada, a company owned by Richard Jeffs. Minera Farellon Limitada assigned the right to payment of this amount, for value, to an unaffiliated entity. We agreed to file a registration statement on Form S-1 to register the shares of common stock to be issued to the debt holders. The registration statement was filed on August 15, 2013, although it has not yet been declared effective. This information does not constitute an offer of any securities for sale. While the payment of $750,000 of debt with shares of our common stock will reduce the amount of money we owe and increase our working capital, because we have earned only limited revenues from our operations since our inception, we do not expect that the reduction in our debt will materially increase our overall liquidity.
Consistent with our historical practices, we continue to monitor our costs in Chile by reviewing our mineral claims to determine whether they possess the geological indicators to economically justify the capital to maintain or explore them. Currently, we have two employees in Chile and engage part time assistants during our exploration programs. Most of our support - such as vehicles, office and equipment - is supplied under short-term contracts. The only long-term commitments that we have are for royalty payments on two of our mineral claims - Farellon and Che. These royalties are payable once exploitation begins. We also are required to pay property taxes that are due annually on all the claims that are included in our properties.
The cost and timing of all planned exploration programs are subject to the availability of qualified mining personnel, such as consulting geologists and geo-technicians, and drillers and drilling equipment. Although Chile has a well-trained and qualified mining workforce from which to draw and few early-stage companies such as ours are competing for the available resources, if we are unable to find the personnel and equipment that we need when we need them and at the prices that we have estimated today, we might have to revise or postpone our plans.
Results of operations
SUMMARY OF FINANCIAL CONDITION
Table 1 summarizes and compares our financial condition at the six months ended July 31, 2013, to the year-ended January 31, 2013.
Table 1: Comparison of financial condition
|
|
| July 31, 2013 |
|
| January 31, 2013 |
| ||
| Working capital deficit |
| $ | (2,309,031 | ) |
| $ | (2,083,112 | ) |
| Current assets |
| $ | 5,173 |
|
| $ | 4,142 |
|
| Unproved mineral properties |
| $ | 872,789 |
|
| $ | 852,611 |
|
| Total liabilities |
| $ | 2,314,204 |
|
| $ | 2,087,254 |
|
| Common stock and additional paid in capital |
| $ | 5,996,058 |
|
| $ | 5,976,058 |
|
Deficit |
| $ | (7,384,256 | ) |
| $ | (7,085,429 | ) |
COMPARISON OF PRIOR QUARTERLY RESULTS
Table 2 and Table 3 present selected financial information for each of the past eight quarters.
Table 2: Summary of quarterly results (October 31, 2012 - July 31, 2013)
|
| October 31, 2012 | January 31, 2013 | April 30, 2013 | July 31, 2013 |
| Revenue | $ - | $ - | $ - | $ - |
| Net loss | $(250,578) | $(155,453) | $(147,484) | $(151,343) |
| Basic and diluted loss per share | $(0.01) | $(0.01) | $(0.01) | $(0.01) |
9
Table 3: Summary of quarterly results (October 31, 2011 - July 31, 2012)
|
| October 31, 2011 | January 31, 2012 | April 30, 2012 | July 31, 2012 |
| Revenue | $ - | $ - | $ 7,804 | $ - |
| Net loss | $(1,285,535) | $(574,536) | $(397,663) | $(296,729) |
| Basic and diluted loss per share | $(0.08) | $(0.03) | $(0.02) | $(0.02) |
During the quarters ended October 31, 2011, and January 31, 2012, our operating expenses were mainly associated with the drilling program on the Farellon property and exploration campaigns on other properties, including associated travel and geological consulting expenses incurred between May and September 2011, and subsequent data analysis. During the quarter ended October 31, 2011, we granted 1,040,000 stock options to certain directors, employees, and consultants that resulted in a non-cash expense of $527,318 (after adjustment taken on January 31, 2012), increasing our net loss. During the quarter ended January 31, 2012, we experienced higher legal costs as we explored the possibility of listing our shares on the TSX Venture Exchange. During the quarter ended April 30, 2012, we prepared an updated the NI 43-101 report on our Farellon property, which resulted in increased exploration expenses, and we continued with the due diligence review related to listing our common stock on the TSX Venture Exchange, which resulted in increased professional and regulatory fees. During the quarter ended July 31, 2012, we kept our exploration and due diligence activities at a moderate level, which resulted in a decrease in our net loss for the quarter. During the quarters ended October 31, 2012, January 31, 2013 and April 30, 2013, we continued maintaining our operations at a lower level; our net loss for the quarter ended October 31, 2012, was $174,345, excluding the written down unproved mineral claims totaling $76,233; net loss for the quarter ended January 31, 2013, amounted to $155,453, and net loss for the quarter ended April 30, 2013, was $141,484 excluding $6,000 we wrote off when we decided to drop certain generative claims. During the quarter ended July 31, 2013, we filed an amendment to our registration statement that was originally filed in May of 2011, which resulted in an increase to our legal fees; we continued to maintain all other day-to-day operations at a minimum level, resulting in a similar net loss for each of the past four quarters.
Selected Financial Results
THREE AND SIX MONTHS ENDED JULY 31, 2013 AND JULY 31, 2012
Our operating results for the three and six months ended July 31, 2013 and 2012, and the changes in the operating results between those periods are summarized in Table 4.
Table 4: Changes in operating results
|
| Three months ended July 31, | Changes between the periods ended July 31, 2013 | Six months ended July 31, | Changes between the periods ended July 31, 2013 | ||
|
| 2013 | 2012 | and 2012 | 2013 | 2012 | and 2012 |
| Revenue |
|
|
|
|
|
|
| Geological services | $ - | $ - | $ - | $ - | $ 7,804 | $ (7,804) |
|
|
|
|
|
|
|
|
| Operating Expenses |
|
|
|
|
|
|
| Administration | 14,043 | 10,086 | 3,957 | 25,742 | 20,201 | 5,541 |
| Advertising and promotion | 3,397 | 18,570 | (15,172) | 5,495 | 41,544 | (36,048) |
| Amortization | 857 | 1,171 | (314) | 1,751 | 2,407 | (656) |
| Automobile | 1,189 | 1,230 | (41) | 3,030 | 5,474 | (2,444) |
| Bank charges | 1,163 | 2,108 | (945) | 2,459 | 3,476 | (1,017) |
| Consulting fees | 30,000 | 79,410 | (49,411) | 65,972 | 160,122 | (94,151) |
| Interest on current debt | 27,565 | 60,642 | (33,077) | 54,565 | 75,674 | (21,109) |
| IVA expense | 621 | 811 | (190) | 1,508 | 3,164 | (1,656) |
| Mineral exploration costs | 28,318 | 52,376 | (24,058) | 30,131 | 183,196 | (153,065) |
| Office | 3,608 | 5,454 | (1,846) | 10,170 | 14,419 | (4,249) |
| Professional fees | 22,343 | 18,407 | 3,936 | 37,334 | 76,422 | (39,088) |
| Rent | 3,324 | 3,393 | (69) | 6,817 | 6,801 | 16 |
| Regulatory | 1,435 | 7,709 | (6,274) | 7,512 | 28,341 | (20,829) |
| Travel and entertainment | 176 | 7,880 | (7,704) | 3,385 | 29,534 | (26,149) |
| Salaries and wages | 13,620 | 21,464 | (7,844) | 37,520 | 45,059 | (7,539) |
| Foreign exchange loss | (316) | (909) | 593 | (564) | (565) | 1 |
| Write-down of unproved mineral properties | - | 6,927 | (6,927) | 6,000 | 6,927 | (927) |
| Total operating expenses | 151,343 | 296,729 | (145,386) | 298,827 | 702,196 | (403,369) |
Net loss | $ 151,343 | $ 296,729 | $ (145,386) | $ 298,827 | $ 694,392 | $(395,565) |
10
Revenue. Our revenue for the six months ended July 31, 2012 was $7,804; this revenue was generated from geological services that we provided to an unaffiliated company. We did not generate any revenue during the six months ended July 31, 2013. Due to the exploration rather than production nature of our business, we do not expect to have significant operating revenue within the next year.
Operating expenses. Our operating expenses decreased by $145,386 or 49%, from $296,729 for the three months ended July 31, 2012, to $151,343 for the three months ended July 31, 2013.
On a year-to-date basis, our operating expenses decreased by $403,369, or 57%, from $702,196 for the six months ended July 31, 2012, to $298,827 for the six months ended July 31, 2013.
The following are our most significant year-to-date changes:
·
During the six months ended July 31, 2012, we commissioned Micon International Limited to prepare an updated NI 43-101 report on our Farellon property; we also continued working on detailed mapping of the Farellon as well as the Mateo properties which resulted in mineral exploration expenditures of $183,196 as opposed to $30,131 during the same period of 2013, when we conducted only minimal exploration activities on the same properties.
·
Due to the substantial reduction in our mineral exploration activities during the six months ended July 31, 2013, we significantly decreased our advertising and travel budget which resulted in decreases of $36,049 or 87% and $26,149 or 89% in advertising and promotion, and travel and entertainment expenses, respectively.
·
During the six months ended July 31, 2012, we incurred $76,422 and $28,341 in professional and regulatory fees, respectively. The increased costs were associated with the continued due diligence review we undertook in determining whether to list our shares on the TSX Venture Exchange.
·
Due to the restructuring of our accounting and financial advisory operations during the year ended January 31, 2013, our consulting fees for the six months ended July 31, 2013 were reduced by $94,150, from $160,122 incurred during the six months ended July 31, 2012, to $65,971 incurred during the six months ended July 31, 2013.
Net loss. We had a net loss of $298,827 for the six months ended July31, 2013, compared to a net loss of $694,392 for the six months ended July 31, 2012. The $395,565 decrease in net loss during the period was mainly associated with the conclusion of our drilling and mapping programs on our Farellon and Mateo properties, which resulted in a decrease in mineral exploration expenses. Reduced advertising activity, a decrease in professional and regulatory fees and restructured consulting services further contributed to the decrease in our costs.
Liquidity
GOING CONCERN
The consolidated financial statements included in this quarterly report have been prepared on a going concern basis, which implies that we will continue to realize our assets and discharge our liabilities in the normal course of business. We have not generated any significant revenues from mineral sales since inception, have never paid any dividends and are unlikely to pay dividends or generate significant earnings in the immediate or foreseeable future. Our continuation as a going concern depends upon the continued financial support of our shareholders, our ability to obtain necessary debt or equity financing to continue operations, and the attainment of profitable operations. Our ability to achieve and maintain profitability and positive cash flow depends upon our ability to locate profitable mineral claims, generate revenue from mineral production and control our production costs. Based upon our current plans, we expect to incur operating losses in future periods, which we plan to mitigate by controlling our operating costs and sharing mineral exploration expenses through joint venture agreements, if possible. At July 31, 2013, we had a working capital deficit of $2,309,031 and accumulated losses of $7,384,256 since inception. These factors raise substantial doubt about our ability to continue as a going concern. We cannot assure you that we will be able to generate significant revenues in the future. Our consolidated financial statements do not give effect to any adjustments that would be necessary should we be unable to continue as a going concern and therefore be required to realize our assets and discharge our liabilities in other than the normal course of business and at amounts different from those reflected in our financial statements.
INTERNAL AND EXTERNAL SOURCES OF LIQUIDITY
To date we have funded our operations by selling our securities and borrowing funds, and, to a minor extent, from mining royalties, geological services and option payments.
11
Sources and uses of cash
SIX MONTHS ENDED JULY 31, 2013 AND 2012
Table 5 summarizes our sources and uses of cash for the six months ended July 31, 2013 and 2012.
Table 5: Summary of sources and uses of cash
|
| July 31, | |
|
| 2013 | 2012 |
| Net cash provided by financing activities | $ 29,773 | $ 310,692 |
| Net cash used in operating activities | (39,478) | (167,965) |
| Net cash used in investing activities | (39,048) | (112,283) |
| Effect of foreign currency exchange | 49,599 | (11,395) |
| Net increase in cash | $ 846 | $ 19,049 |
Net cash provided by financing activities. During the six months ended July 31, 2013, we borrowed $30,000 Cdn (approximately $29,773 US) from our CEO.
During the six months ended July 31, 2012, we received $150,000 on exercise of warrants for 500,000 shares at $0.30 per share and $120,301 when we issued 267,335 shares at $0.45. During the same period, we borrowed $57,000 from a shareholder and $40,000 Cdn (approximately $39,944 US) from our CEO, and repaid $56,553 in principal and accrued interest toward a loan made by a company owned by a significant shareholder.
Net cash used in operating activities. During the six months ended July 31, 2013, we used net cash of $39,478 in operating activities. We used $298,827 to cover operating costs and increased our prepaid expenses by $193. These uses of cash were offset by increases in our accounts payable and accrued interest on notes payable to related parties of $3,957 and $13,941, respectively. Our accrued liabilities increased by $53,454 mainly due to the recognition of property taxes payable on our mineral claims. We also increased our accounts payable to related parties by $160,439.
During the six months ended July 31, 2012, we used net cash of $167,965 in operating activities. We used $694,391 to cover operating costs. This use of cash was offset by increases in our accounts payable and accrued liabilities of $56,492 and $42,475, respectively. This increase was associated mainly with our exploration activities and preparation of the updated NI 43-101 report as well as due diligence to list our shares on the TSX Venture Exchange. We increased our accounts payable to related parties by $367,104 and recorded $9,774 in accrued interest on notes payable to related parties. Our prepaids and other receivables decreased by $41,248 which also contributed to a decrease in cash used in operations.
Net cash used in investing activities. During the six months ended July 31, 2013, we spent $76,548 acquiring mineral claims and paying property taxes associated with our mineral claims. During the same period we received $37,500 from Geoactiva pursuant to the Option Agreement described below.
During the six months ended July 31, 2012, we spent $112,283 acquiring mineral claims and paying property taxes associated with our mineral claims.
Since inception through July 31, 2013, we have invested $1,355,028 acquiring our mineral claims and $19,820 for acquisition of other capital assets.
Unproved mineral properties
We have three active properties which we have assembled since the beginning of 2007 - the Farellon, Perth, and Mateo. These properties consist of both mining and exploration claims and are grouped into two district areas - the Carrizal Alto area properties and the Vallenar area properties.
12
Active properties
Table 6: Active properties |
|
|
|
|
|
|
|
|
|
| Property | Percentage, type of claim |
| Hectares |
| |||||
|
|
| Gross area |
|
| Net area a |
| ||
| Carrizal Alto area |
| ||||||||
| Farellon |
|
|
|
|
|
|
|
|
|
| Farellon 1 - 8 claim | 100%, mensura |
|
| 66 |
|
|
|
|
|
| Farellon 3 claim | 100%, manifestacion |
|
| 300 |
|
|
|
|
|
| Cecil 1 - 49 claim | 100%, mensura |
|
| 230 |
|
|
|
|
|
| Teresita | 100%, mensura |
|
| 1 |
|
|
|
|
|
| Azucar 6 - 25 | 100%, mensura |
|
| 88 |
|
|
|
|
|
| Stamford 61 - 101 | 100%, mensura |
|
| 165 |
|
|
|
|
|
| Kahuna 1 - 40 | 100%, mensura |
|
| 200 |
|
|
|
|
|
|
|
|
|
| 1,050 |
|
|
| 1,050 |
|
| Perth |
|
|
|
|
|
|
|
|
|
| Perth 1 al 36 claim | 100%, mensura |
|
| 109 |
|
|
|
|
|
| Lancelot I 1 al 30 claim | 100%, mensura in process |
|
| 300 |
|
|
|
|
|
| Lancelot II 1 al 20 claim | 100%, mensura in process |
|
| 200 |
|
|
|
|
|
| Rey Arturo 1 al 30 claim | 100%, mensura in process |
|
| 300 |
|
|
|
|
|
| Merlin I 1 al 10 claim | 100%, mensura in process |
|
| 60 |
|
|
|
|
|
| Merlin I 1 al 24 claim | 100%, mensura in process |
|
| 240 |
|
|
|
|
|
| Galahad I 1 al 10 claim | 100%, mensura in process |
|
| 50 |
|
|
|
|
|
| Galahad IA 1 al 46 claim | 100%, mensura in process |
|
| 230 |
|
|
|
|
|
| Percival III 1 al 30 claim | 100%, mensura in process |
|
| 300 |
|
|
|
|
|
| Tristan II 1 al 30 claim | 100%, mensura in process |
|
| 300 |
|
|
|
|
|
| Tristan IIA 1 al 5 claim | 100%, mensura in process |
|
| 15 |
|
|
|
|
|
| Camelot claim | 100%, manifestacion |
|
| 300 |
|
|
|
|
|
|
|
|
|
| 2,404 |
|
|
|
|
|
| Overlapped claims a |
|
| (121 | ) |
|
| 2,283 |
| |
| Vallenar area |
| ||||||||
| Mateo |
|
|
|
|
|
|
|
|
|
| Margarita claim | 100%, mensura |
|
| 56 |
|
|
|
|
|
| Che 1 & 2 claims | 100%, mensura |
|
| 76 |
|
|
|
|
|
| Irene & Irene II claims | 100% ,mensura |
|
| 60 |
|
|
|
|
|
| Mateo 1, 2, 3, 9,10,12, 13, 14 claims | 100%, mensura in process |
|
| 1,371 |
|
|
|
|
|
| Mateo 4 and 5 claims | 100%, pedimento |
|
| 600 |
|
|
|
|
|
|
|
|
|
| 2,163 |
|
|
|
|
|
| Overlapped claims a |
|
| (469 | ) |
|
| 1,694 |
| |
|
|
|
|
|
|
|
|
|
| |
|
|
|
|
|
|
|
|
|
| |
|
|
|
|
|
|
|
| 5,027 |
| |
a Some pedimentos and manifestacions overlap other claims. The net area is the total of the hectares we have in each property (i.e. net of our overlapped claims).
Our active properties as of the date of this filing are set out in Table 6. These properties are accessible by road from Vallenar as illustrated in Figure 1.
13
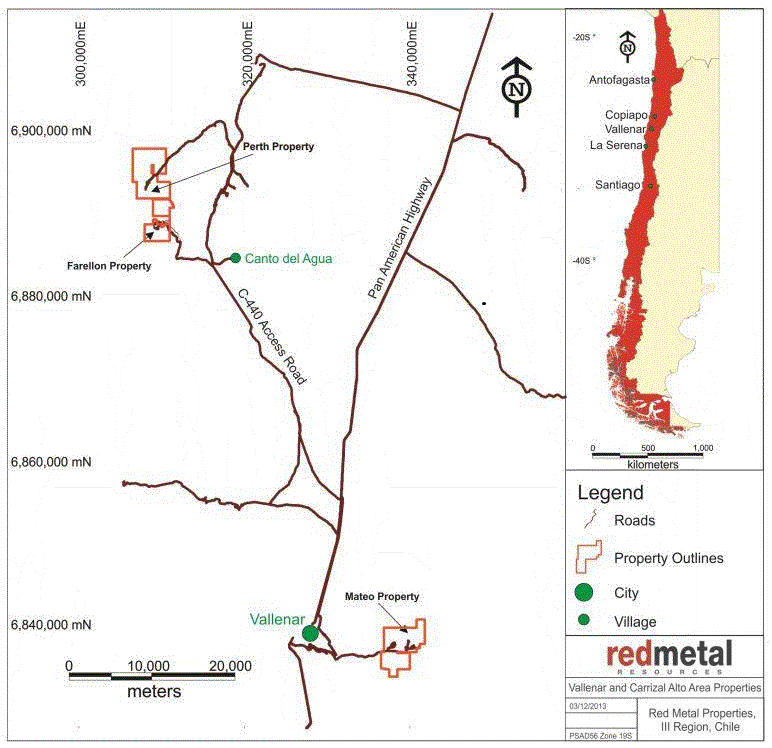
Figure 1: Location and access to active properties.
Option with Geoactiva SpA.
On April 30, 2013, we granted Geoactiva SpA an option to purchase 100% of the Perth property through the execution of a mining option purchase agreement (the “Option Agreement”). In order to maintain the option to purchase and to acquire the Perth property, Geoactiva must pay us the total amount of $1,000,000 and incur exploration expenses over 48 months as set out in the following table.
14
Date |
| Option payments |
|
| Exploration expenditures |
| ||
| April 30, 2013* |
| $ | 37,500 |
|
|
|
|
|
| October 30, 2013 |
|
| 37,500 |
|
|
|
|
|
| April 30, 2014 |
|
| 50,000 |
|
| $ | 500,000 |
|
| October 30, 2014 |
|
| 50,000 |
|
|
|
|
|
| April 30, 2015 |
|
| 100,000 |
|
|
| 1,000,000 |
|
| October 30, 2015 |
|
| 100,000 |
|
|
|
|
|
| April 30, 2016 |
|
| 125,000 |
|
|
| 1,000,000 |
|
| October 30, 2016 |
|
| 250,000 |
|
|
|
|
|
| April 30, 2017 |
|
| 250,000 |
|
|
| 1,000,000 |
|
|
| $ | 1,000,000 |
|
| $ | 3,500,000 |
|
*$37,500 was paid on April 30, 2013
All of the above option payments shall be made only if Geoactiva wishes to keep the Option Agreement in force and finally to exercise the option to purchase. If Geoactiva fails to incur the required exploration expenditures during a specific period it may fulfill its obligations by paying us the outstanding amount in cash.
Upon exercise of the Option Agreement and once the commercial production begins, Geoactiva will pay us NSR of 1.5% from the sale of gold, copper, and cobalt extracted from the Perth property. At any time after the exercise of the Option Agreement and Geoactiva’s fulfillment of the investment commitment of $3,500,000 in exploration expenditures, Geoactiva may purchase 100% of the NSR as follows:
Gold: paying $5 per inferred ounce of gold, according to the definition of Inferred Mineral Resource in the CIM Definition Standards on Mineral Resources and Mineral Reserves
Copper: $0.005 per inferred ounce of copper, according to the definition of Inferred Mineral Resource in the CIM Definition Standards on Mineral Resources and Mineral Reserves
Cobalt: If Geoactiva acquires the NSR with respect to gold, copper, or both, the NSR relating to cobalt will be terminated
As of July 31, 2013, Geoactiva had not commenced exploration activities on the Perth property.
Capital resources
Our ability to acquire and explore our Chilean claims is subject to our ability to obtain the necessary funding. We expect to raise funds through loans from private or affiliated persons and sales of our debt or equity securities. Aside from the Option Agreement with Geoactiva, which Geoactiva may decide not to maintain, we have no committed sources of capital. If we are unable to raise funds as and when we need them, we may be required to curtail, or even to cease, our operations.
Contingencies and commitments
We had no contingencies at July 31, 2013.
As of the date of filing this report we have the following long-term contractual obligations and commitments:
·
Farellon royalty. We are committed to paying the vendor a royalty equal to 1.5% on the net sales of minerals extracted from the Farellon claims up to a total of $600,000. The royalty payments are due monthly once exploitation begins and are subject to minimum payments of $1,000 per month. We have no obligation to pay the royalty if we do not commence exploitation.
·
Che royalty. We are committed to paying a royalty equal to 1% of the net sales of minerals extracted from the claims to a maximum of $100,000 to the former owner. The royalty payments are due monthly once exploitation begins, and are not subject to minimum payments.
·
Mineral property taxes payable of approximately $45,000 per annum.
Equity financing
To generate working capital, between February 1, 2011 and September 10, 2013 we issued 7,740,668 shares of our common stock and warrants for the purchase of 7,187,001 shares of our common stock to raise $2,303,401 under Regulations S and D promulgated under the Securities Act of 1933.
15
Based on our operating plan, we anticipate incurring operating losses in the foreseeable future and will require additional capital to support our operations and develop our business plan. If we succeed in completing future equity financings, the issuance of additional shares will result in dilution to our existing stockholders.
Debt financing
Between February 1, 2011 and September 10, 2013 we borrowed a total of $336,145 from related parties. Of this amount, $63,930 owed to the company controlled by Richard Jeffs has been repaid. $115,000 in notes payable and accrued interest owed to Richard Jeffs were reassigned to two unaffiliated entities in a private transaction. On August 12, 2013, we reached an agreement with the new debt holders to convert this debt into shares of our common stock at $0.05 per share. As of the date of this report, the shares have not yet been issued.
Challenges and risks
Other than revenue we generate from the Option Agreement with Geoactiva, we do not anticipate generating any revenue over the next twelve months. We plan to fund our operations through any combination of equity or debt financing from the sale of our securities, private loans, joint ventures or through the sale of part interest in our mineral properties. Although we have succeeded in raising funds as we needed them, we cannot assure you that this will continue in the future. Many things, such as the continued general downturn, worldwide, of the economy or a significant decrease in the price of minerals, could affect the willingness of potential investors to invest in risky ventures such as ours. In addition to our Option Agreement with Geoactiva, we may consider entering into a joint venture partnership with other resource companies to complete a mineral exploration program on other properties in Chile. If we enter into a joint venture arrangement, we would likely have to assign a percentage of our interest in our mineral claims to our joint venture partner in exchange for the funding.
Investments in and expenditures on mineral interests
Realization of our investments in mineral properties depends upon our maintaining legal ownership, producing from the properties or gainfully disposing of them.
Title to mineral claims involves risks inherent in the difficulties of determining the validity of claims as well as the potential for problems arising from the ambiguous conveyancing history characteristic of many mineral claims. Our contracts and deeds have been notarized, recorded in the registry of mines and published in the mining bulletin. We review the mining bulletin regularly to discover whether other parties have staked claims over our ground. We have discovered no such claims. To the best of our knowledge, we have taken the steps necessary to ensure that we have good title to our mineral claims.
Foreign exchange
We are subject to foreign exchange risk for transactions denominated in foreign currencies. Foreign currency risk arises from the fluctuation of foreign exchange rates and the degree of volatility of these rates relative to the United States dollar. We do not believe that we have any material risk due to foreign currency exchange.
Trends, events or uncertainties that may impact results of operations or liquidity
The economic crisis in the United States and the resulting economic uncertainty and market instability may make it harder for us to raise capital as and when we need it and have made it difficult for us to assess the impact of the crisis on our operations or liquidity and to determine if the prices we will receive on the sale of minerals will exceed the cost of mineral exploitation. If we are unable to raise cash, we may be required to cease our operations. Other than as discussed in this report, we know of no other trends, events or uncertainties that have or are reasonably likely to have a material impact on our short-term or long-term liquidity.
Off-balance sheet arrangements
We have no off-balance sheet arrangements and no non-consolidated, special-purpose entities.
Related-party transactions
Table 7 describes the amounts due to related parties that were incurred during the fiscal year ended January 31, 2013, and the period ended July 31, 2013.
16
| Table 7: Due to related parties |
| |||||||
|
|
| July 31, 2013 |
|
| January 31, 2013 |
| ||
| Due to Da Costa Management Corp. a |
| $ | 305,715 |
|
| $ | 269,097 |
|
| Due to Fladgate Exploration Consulting Corporation b |
|
| 389,687 |
|
|
| 894,377 |
|
| Due to Minera Farellon Limitada c |
|
| 77,255 |
|
|
| 94,588 |
|
| Due to Richard Jeffs d |
|
| 46,544 |
|
|
| 50,920 |
|
| Total due to related parties |
| $ | 819,201 |
|
| $ | 1,308,982 |
|
a During the six months ended July 31, 2013, we incurred $60,000 in consulting fees with Da Costa Management Corp., a company owned by our CFO and treasurer, of which $20,000 were donated to us. During the same period in 2012, we recorded $148,277, in consulting fees to Da Costa Management Corp. In addition to direct consulting fees we also reimbursed Da Costa Management Corp. for certain business related expenses paid on our behalf.
b During the six months ended July 31, 2013, we incurred $23,331 in mineral exploration expenses with Fladgate Exploration Consulting Corporation, a company controlled by two of our directors. During the six months ended July 31, 2012, we incurred $144,908 in mineral exploration expenses provided by the same company. In addition to direct mineral exploration fees we also reimbursed Fladgate Exploration Consulting Corporation for certain business related expenses they paid on our behalf.
c During the six months ended July 31, 2013 and 2012 we recorded $6,817 and $6,801, respectively, in rental fees with Minera Farellon Limitada, a company owned by Richard Jeffs, the father of our president and a holder of more than 5% of our shares of common stock.
Notes payable to related parties
Table 8 describes the promissory notes payable to related parties including accrued interest as at July 31, 2013 and January 31, 2013.
Table 8: Notes payable to related parties
|
|
| July 31, 2013 |
|
| January 31, 2013 |
| ||
| Notes payable to Richard Jeffs a |
| $ | 7,969 |
|
| $ | 118,797 |
|
| Notes payable to Caitlin Jeffs b |
|
| 168,873 |
|
|
| 136,532 |
|
| Notes payable to Fladgate Exploration Consulting Corporation b |
|
| 70,376 |
|
|
| 69,589 |
|
| Notes payable to John da Costa c |
|
| 9,581 |
|
|
| 9,210 |
|
| Total notes payable to related parties |
| $ | 256,799 |
|
| $ | 334,128 |
|
a The principle amount of the notes payable was $108,000. They were payable on demand, unsecured and bore interest at 8% per annum compounded monthly. On July 8, 2013, we received a letter from Richard Jeffs notifying us of the reassignment of $115,000 in debt owed to him to two unaffiliated entities. The remaining interest as of the July 8, 2013 continues to accrue interest at 8% per annum compounded monthly.
b The principle amounts of the notes payable to Caitlin Jeffs are $137,000 Cdn and $22,000 US, they are payable on demand, unsecured and bear interest at 8% per annum compounded monthly. Interest of $13,695 had accrued as at July 31, 2013. The principle amount of the note payable to Fladgate Exploration Consulting Corporation is $62,389 Cdn; it is payable on demand, unsecured and bears interest at 8% per annum compounded monthly. Interest of $9,728 had accrued as at July 31, 2013.
c The principle amount of the note payable to John da Costa is $8,500, it is payable on demand, unsecured and bears interest at 8% per annum compounded monthly. Interest of $1,081 had accrued as at July 31, 2013.
Critical Accounting Estimates
Preparing financial statements in conformity with U.S. Generally Accepted Accounting Principles requires management to make estimates and assumptions that affect certain of the reported amounts of assets and liabilities, disclosure of contingent assets and liabilities at the date of the financial statements and the reported amounts of revenues and expenses during the period. The Company regularly evaluates estimates and assumptions. The Company bases its estimates and assumptions on current facts, historical experience and various other factors it believes to be reasonable under the circumstances, the results of which form the basis for making judgments about the carrying values of assets and liabilities and the accrual of costs and expenses that are not readily apparent from other sources. The actual results experienced by the Company may differ materially and adversely from the Company’s estimates. To the extent there are material differences between the estimates and the actual results, future results of operations will be affected. The most significant estimates with regard to these financial statements relate to carrying values of unproved mineral properties, determination of fair values of stock-based transactions, and deferred income tax rates.
17
Reclassifications
Certain prior-period amounts in the accompanying consolidated financial statements have been reclassified to conform to the current period’s presentation. These reclassifications had no effect on the consolidated results of operations or financial position for any period presented.
Financial instruments
Our financial instruments include cash, accounts receivable, accounts payable, accrued liabilities, accrued professional fees and accrued mineral property costs. The fair value of these financial instruments approximates their carrying values due to their short maturities.
Recently Adopted Accounting Guidance
The Company has reviewed recently issued accounting pronouncements and plans to adopt those that are applicable to it. We do not expect the adoption of these pronouncements to have a material impact on our financial position, results of operations or cash flows.
Item 3. Quantitative and Qualitative Disclosures about Market Risk.
As a smaller reporting company, we are not required to provide this disclosure.
Item 4. Controls and Procedures.
(a) Disclosure Controls and Procedures
Caitlin Jeffs, our chief executive officer and president, and John da Costa, our chief financial officer, have evaluated the effectiveness of our disclosure controls and procedures (as the term is defined in Rules 13a-15 and 15d-15 under the Securities Exchange Act of 1934) as of the end of the period covered by this report (the “evaluation date”). Based on their evaluation, they have concluded that, as of the evaluation date, our disclosure controls and procedures are effective to ensure that information required to be disclosed by us in the reports that we file or submit under the Exchange Act is recorded, processed, summarized and reported within the time periods specified in the Securities and Exchange Commission’s rules and forms.
(b) Changes in internal control over financial reporting
During the period covered by this report, there were no changes to our internal control over financial reporting that have materially affected, or are reasonably likely to materially affect, our internal control over financial reporting.
18
PART II-OTHER INFORMATION
Item 1. Legal Proceedings.
We are not a party to any pending legal proceedings and, to the best of our knowledge, none of our properties or assets is the subject of any pending legal proceedings.
Item 1a. Risk Factors.
We incorporate by reference the Risk Factors included at Item 1A in the Annual Report on Form 10-K that we filed with the Securities and Exchange Commission on April 22, 2013.
Item 2. Unregistered Sales of Equity Securities and Use of Proceeds.
None
Item 3. Defaults upon Senior Securities.
None.
Item 4. Mine Safety Disclosures.
Not applicable.
Item 5. Other Information.
None
Item 6. Exhibits.
The following table sets out the exhibits either filed herewith or incorporated by reference.
| Exhibit | Description |
| 3.1.1 | Articles of Incorporation(1) |
| 3.1.2 | Certificate of Amendment to Articles of Incorporation(2) |
| 3.2 | By-laws(1) |
| 10.1 | Unilateral Purchase Option Contract For Mining Properties(3) |
| 31.1 | Certification pursuant to Rule 13a-14(a) and 15d-14(a) (4) |
| 31.2 | Certification pursuant to Rule 13a-14(a) and 15d-14(a) (4) |
| 32 | Certification pursuant to Section 1350 of Title 18 of the United States Code(4) |
| 101 | The following financial statements from the registrant’s Quarterly Report on Form 10-Q for the fiscal quarter ended July 31, 2013, formatted in XBRL: (i) Consolidated Balance Sheets; (ii) Consolidated Statements of Operations; (iii) Consolidated Statement of Stockholders’ Equity (iv) Consolidated Statements of Cash Flows; (v) Notes to the Consolidated Financial Statements. (4) |
(1) Incorporated by reference from the registrant’s registration statement on Form SB-2 filed with the Securities and Exchange Commission on May 22, 2006 as file number 333-134-363.
(2)Incorporated by reference from the registrant’s Quarterly report on Form 10-Q for the period ended October 31, 2010 and filed with the Securities and Exchange Commission on December 13, 2010.
(3)Incorporated by reference from the registrant’s Current Report on Form 8-K filed with the Securities and Exchange Commission on May 6, 2013.
(4)Filed herewith
19
SIGNATURES
Pursuant to the requirements of the Securities Exchange Act of 1934, the registrant has duly caused this report to be signed on its behalf by the undersigned thereunto duly authorized.
September 13, 2013
| RED METAL RESOURCES LTD. |
| |
|
|
|
|
| By: | /s/Caitlin Jeffs |
|
|
| Caitlin Jeffs, Chief Executive Officer and President |
|
|
|
|
|
|
|
|
|
| By: | /s/ Joao (John) da Costa |
|
|
| Joao (John) da Costa, Chief Financial Officer |
|
20