Attached files
| file | filename |
|---|---|
| EX-23.2 - EX-23.2 - Aramark | d574424dex232.htm |
| EX-21.1 - EX-21.1 - Aramark | d574424dex211.htm |
| EX-23.1 - EX-23.1 - Aramark | d574424dex231.htm |
| EX-10.67 - EX-10.67 - Aramark | d574424dex1067.htm |
Table of Contents
As filed with the Securities and Exchange Commission on September 9, 2013
Registration No. 333-
UNITED STATES
SECURITIES AND EXCHANGE COMMISSION
Washington, D.C. 20549
FORM S-1
REGISTRATION STATEMENT
UNDER
THE SECURITIES ACT OF 1933
ARAMARK Holdings Corporation
(Exact name of registrant as specified in its charter)
| Delaware | 5812 | 20-8236097 | ||
| (State or other jurisdiction of incorporation or organization) |
(Primary Standard Industrial Classification Code Number) |
(I.R.S. Employer Identification Number) |
ARAMARK Tower
1101 Market Street
Philadelphia, Pennsylvania 19107
(215) 238-3000
(Address, including zip code, and telephone number, including area code, of registrant’s principal executive offices)
Stephen R. Reynolds, Esq.
Executive Vice President, General Counsel and Secretary
ARAMARK Tower
1101 Market Street
Philadelphia, Pennsylvania 19107
(215) 238-3000
(Name, address, including zip code, and telephone number, including area code, of agent for service)
With copies to:
| Joseph H. Kaufman, Esq. Simpson Thacher & Bartlett LLP 425 Lexington Avenue New York, New York 10017-3954 (212) 455-2000 |
Daniel J. Zubkoff, Esq. Douglas S. Horowitz, Esq. Timothy B. Howell, Esq. Cahill Gordon & Reindel LLP 80 Pine Street New York, New York 10005 (212) 701-3000 |
Approximate date of commencement of proposed sale to the public: As soon as practicable after this Registration Statement is declared effective.
If any of the securities being registered on this Form are to be offered on a delayed or continuous basis pursuant to Rule 415 under the Securities Act of 1933, check the following box. ¨
If this Form is filed to register additional securities for an offering pursuant to Rule 462(b) under the Securities Act, please check the following box and list the Securities Act registration statement number of the earlier effective registration statement for the same offering. ¨
If this Form is a post-effective amendment filed pursuant to Rule 462(c) under the Securities Act, check the following box and list the Securities Act registration statement number of the earlier effective registration statement for the same offering. ¨
If this Form is a post-effective amendment filed pursuant to Rule 462(d) under the Securities Act, check the following box and list the Securities Act registration statement number of the earlier effective registration statement for the same offering. ¨
Indicate by check mark whether the registrant is a large accelerated filer, an accelerated filer, a non-accelerated filer, or a smaller reporting company. See the definitions of “large accelerated filer,” “accelerated filer” and “smaller reporting company” in Rule 12b-2 of the Exchange Act.
| Large accelerated filer |
¨ | Accelerated filer | ¨ | |||||||||
| Non-accelerated filer |
x | (Do not check if a smaller reporting company) | Smaller reporting company | ¨ |
CALCULATION OF REGISTRATION FEE
|
| ||||
| Title of Each Class of Securities to be Registered |
Proposed Maximum Aggregate Offering Price(1)(2) |
Amount of Registration Fee | ||
| Common Stock, par value $0.01 per share |
$100,000,000.00 | $13,640.00 | ||
|
| ||||
|
| ||||
| (1) | Includes shares to be sold upon exercise of the underwriters’ option. See “Underwriting.” |
| (2) | Estimated solely for the purpose of calculating the amount of the registration fee pursuant to Rule 457(o) under the Securities Act of 1933, as amended. |
The registrant hereby amends this Registration Statement on such date or dates as may be necessary to delay its effective date until the registrant shall file a further amendment which specifically states that this Registration Statement shall thereafter become effective in accordance with Section 8(a) of the Securities Act of 1933, as amended, or until the Registration Statement shall become effective on such date as the Securities and Exchange Commission, acting pursuant to said Section 8(a), may determine.
Table of Contents
The information in this prospectus is not complete and may be changed. Neither we nor the selling stockholders may sell these securities until the registration statement filed with the Securities and Exchange Commission is effective. This prospectus is not an offer to sell these securities and we are not soliciting offers to buy these securities in any jurisdiction where the offer or sale is not permitted.
Subject to Completion, Dated September 9, 2013
Shares

Common Stock
This is the initial public offering of shares of common stock of ARAMARK Holdings Corporation. We are selling of the shares to be sold in this offering. The selling stockholders named in this prospectus are selling an additional shares. We will not receive any proceeds from the sale of the shares being sold by the selling stockholders.
Prior to this offering, there has been no public market for our common stock. The initial public offering price of shares of our common stock is expected to be between $ and $ per share. We intend to apply for listing of shares of our common stock on the New York Stock Exchange under the symbol “ .”
After completion of this offering, certain stockholders will continue to beneficially own a majority of the voting power of all outstanding shares of our common stock. As a result, we will be a “controlled company” within the meaning of the corporate governance standards of the New York Stock Exchange. See “Principal and Selling Stockholders.”
| Per Share | Total | |||||||
| Initial public offering price |
$ | $ | ||||||
| Underwriting discounts and commissions |
$ | $ | ||||||
| Proceeds, before expenses, to ARAMARK Holdings Corporation |
$ | $ | ||||||
| Proceeds, before expenses, to selling stockholders |
$ | $ | ||||||
We and the selling stockholders have granted the underwriters an option to purchase up to additional shares of common stock at the initial public offering price, less the underwriting discount.
Investing in shares of our common stock involves risks. See “Risk Factors” beginning on page 16.
Neither the Securities and Exchange Commission nor any state securities commission has approved or disapproved of these securities or passed upon the adequacy or accuracy of this prospectus. Any representation to the contrary is a criminal offense.
The underwriters expect to deliver the shares on or about , 2013.
| Goldman, Sachs & Co. | J.P. Morgan | Credit Suisse | Morgan Stanley |
| Barclays | BofA Merrill Lynch | RBC Capital Markets | Wells Fargo Securities | |||
| Baird | PNC Capital Markets LLC | Rabo Securities | Ramirez & Co., Inc. | |||
| Santander | SMBC Nikko | The Williams Capital Group, L.P. |
The date of this prospectus is , 2013
Table of Contents
| Page | ||||
| 1 | ||||
| 16 | ||||
| 31 | ||||
| 32 | ||||
| 33 | ||||
| 34 | ||||
| 36 | ||||
| Management’s Discussion and Analysis of Financial Condition and Results of Operations |
39 | |||
| 69 | ||||
| 86 | ||||
| 134 | ||||
| 138 | ||||
| 140 | ||||
| 147 | ||||
| 155 | ||||
| Certain United States Federal Income and Estate Tax Considerations for Non-U.S. Holders |
158 | |||
| 161 | ||||
| 166 | ||||
| 166 | ||||
| 166 | ||||
| F-1 | ||||
Through and including , 2013 (the 25th day after the date of this prospectus), all dealers that effect transactions in these securities, whether or not participating in this offering, may be required to deliver a prospectus. This delivery requirement is in addition to the dealers’ obligation to deliver a prospectus when acting as an underwriter and with respect to an unsold allotment or subscription.
You should rely only on the information contained in this prospectus or in any free writing prospectuses we have prepared. We have not authorized anyone to provide you with different information and we and the underwriters take no responsibility for, and can provide no assurance as to the reliability of, any other information that others may give you. We are not, the selling stockholders are not, and the underwriters are not, making an offer to sell or seeking offers to buy these securities in any state or jurisdiction where an offer or sale is not permitted. You should not assume that the information contained in this prospectus is accurate as of any date other than the date on the front of this prospectus.
Table of Contents
STATEMENTS REGARDING FORWARD-LOOKING INFORMATION
This prospectus contains “forward-looking statements” within the meaning of the federal securities laws, including, without limitation, statements concerning the conditions in our industry, our operations, our economic performance and financial condition, including, in particular, statements relating to our business and growth strategy under “Prospectus Summary,” “Management’s Discussion and Analysis of Financial Condition and Results of Operations” and “Business.” You can identify forward-looking statements because they contain words such as “aim,” “anticipate,” “are confident,” “estimate,” “expect,” “will be,” “will continue,” “will likely result,” “project,” “intend,” “plan,” “believe” and other words and terms of similar meaning in connection with a discussion of future operating or financial performance. All statements we make relating to our estimated and projected earnings, costs, expenditures, cash flows, growth rates and financial results are forward-looking statements. In addition, we, through our senior management, from time to time make forward-looking public statements concerning our expected future operations and performance and other developments. These forward-looking statements are subject to risks and uncertainties that may change at any time, and, therefore, our actual results may differ materially from those that we expected. We derive many of our forward-looking statements from our operating budgets and forecasts, which are based upon many detailed assumptions. While we believe that our assumptions are reasonable, we caution that it is very difficult to predict the impact of known factors, and, of course, it is impossible for us to anticipate all factors that could affect our actual results. Important factors that could cause actual results to differ materially from our expectations (“cautionary statements”) are disclosed under “Risk Factors” and elsewhere in this prospectus, including, without limitation, in conjunction with the forward-looking statements included in this prospectus. All subsequent written and oral forward-looking statements attributable to us, or persons acting on our behalf, are expressly qualified in their entirety by the cautionary statements. Some of the factors that we believe could affect our results include:
| • | unfavorable economic conditions; |
| • | natural disasters, global calamities, sports strikes and other adverse incidents; |
| • | the failure to retain current clients, renew existing client contracts and obtain new client contracts; |
| • | a determination by clients to reduce their outsourcing or use of preferred vendors; |
| • | competition in our industries; |
| • | increased operating costs and obstacles to cost recovery due to the pricing and cancellation terms of our food and support services contracts; |
| • | the inability to achieve cost savings through our cost reduction efforts; |
| • | our expansion strategy; |
| • | the failure to maintain food safety throughout our supply chain, food-borne illness concerns and claims of illness or injury; |
| • | governmental regulations including those relating to food and beverages, the environment, wage and hour and government contracting; |
| • | liability associated with noncompliance with applicable law or other governmental regulations; |
| • | changes in, new interpretations of or changes in the enforcement of the government regulatory framework; |
| • | currency risks and other risks associated with international operations, including Foreign Corrupt Practices Act, U.K. Bribery Act and other anti-corruption law compliance; |
| • | continued or further unionization of our workforce; |
| • | liability resulting from our participation in multiemployer defined benefit pension plans; |
| • | risks associated with suppliers from whom our products are sourced; |
| • | disruptions to our relationship with, or to the business of, our primary distributor; |
i
Table of Contents
| • | the inability to hire and retain sufficient qualified personnel or increases in labor costs; |
| • | healthcare reform legislation; |
| • | the contract intensive nature of our business, which may lead to client disputes; |
| • | seasonality; |
| • | our leverage; |
| • | the inability to generate sufficient cash to service all of our indebtedness; |
| • | debt agreements that limit our flexibility in operating our business; |
| • | potential conflicts of interest between our Controlling Owners (as defined herein) and us; and |
| • | other factors set forth under the heading “Risk Factors” in this prospectus. |
We caution you that the foregoing list of important factors may not contain all of the material factors that are important to you. In addition, in light of these risks and uncertainties, the matters referred to in the forward-looking statements contained in this prospectus may not in fact occur. We undertake no obligation to publicly update or revise any forward-looking statement as a result of new information, future events or otherwise, except as otherwise required by law.
PRESENTATION OF FINANCIAL AND OTHER INFORMATION
Unless otherwise indicated or the context otherwise requires, references in this prospectus to “we,” “our,” “us,” “ARAMARK” and “the Company” and similar terms refer to ARAMARK Holdings Corporation and its subsidiaries and references to “Holdings” refer to ARAMARK Holdings Corporation and not any of its subsidiaries.
Our fiscal year ends on the Friday nearest September 30 in each year. In this prospectus, when we refer to our fiscal years, we say “fiscal” and the year number, as in “fiscal 2012,” which refers to our fiscal year ended September 28, 2012. In addition, “client” refers to those businesses and other organizations which engage us to provide services. “Consumers” refers to those consumers of our services, such as employees, students and patrons, to whom our clients provide us access.
We present Adjusted Net Income, Adjusted Operating Income and Adjusted EBITDA, as defined under “Prospectus Summary—Summary Consolidated Financial Data,” as non-U.S. Generally Accepted Accounting Principles, or non-GAAP, financial measures in various places throughout this prospectus. Adjusted Net Income, Adjusted Operating Income and Adjusted EBITDA are supplemental measures used by management to measure operating performance. Our presentation of Adjusted Net Income, Adjusted Operating Income and Adjusted EBITDA has limitations as an analytical tool, and should not be considered in isolation or as a substitute for analysis of our results as reported under generally accepted accounting principles in the United States (“U.S. GAAP”). We use Adjusted Net Income as a supplemental measure of our overall profitability because it excludes the impact of the non-cash amortization of certain intangible assets and depreciation of property and equipment that were created at the time of our 2007 going-private transaction (the “2007 Transaction”), non-cash share-based compensation expense and other costs that are not indicative of our ongoing operational performance. Similarly, we use Adjusted Operating Income and Adjusted EBITDA as supplemental measures of our operating profitability and to evaluate and control our cash operating costs because they exclude the impact of the items noted above relating to the calculation of Adjusted Net Income that are not indicative of our ongoing operational performance. We believe the presentation of Adjusted Net Income, Adjusted Operating Income and Adjusted EBITDA is appropriate to provide additional information to investors about our operating performance.
We also present Covenant EBITDA and Covenant Adjusted EBITDA as non-GAAP financial measures of ARAMARK Corporation and its restricted subsidiaries under “Management’s Discussion and Analysis of Financial Condition and Results of Operations—Liquidity and Capital Resources.” Our presentation of Covenant
ii
Table of Contents
EBITDA and Covenant Adjusted EBITDA has limitations as an analytical tool, and should not be considered in isolation or as a substitute for analysis of our results as reported under U.S. GAAP. In addition, Covenant EBITDA and Covenant Adjusted EBITDA are measures of ARAMARK Corporation and its restricted subsidiaries only and do not include the results of Holdings. We believe that the inclusion of Covenant EBITDA and Covenant Adjusted EBITDA in this prospectus is appropriate to provide additional information to investors about the calculation of certain financial measures in our senior secured credit facilities and the indenture governing our 5.75% Senior Notes due 2020, which we refer to as our senior notes. For instance, our senior secured credit facilities and the indenture governing our senior notes contain financial ratios that are calculated by reference to Covenant Adjusted EBITDA. Non-compliance with the financial ratio maintenance covenants contained in our senior secured credit facilities could result in the requirement to immediately repay all amounts outstanding under such facilities, while non-compliance with the debt incurrence ratio contained in our senior secured credit facilities and the indenture governing our senior notes would prohibit us from being able to incur additional indebtedness other than pursuant to specified exceptions.
Because Adjusted Net Income, Adjusted Operating Income, Adjusted EBITDA, Covenant EBITDA and Covenant Adjusted EBITDA are not measures determined in accordance with U.S. GAAP and are susceptible to varying calculations, we caution investors that these measures as presented may not be comparable to similarly titled measures of other companies. Under “Prospectus Summary—Summary Consolidated Financial Data” herein, we include a quantitative reconciliation of Adjusted Net Income, Adjusted Operating Income and Adjusted EBITDA to the most directly comparable U.S. GAAP financial performance measure, which is net income. Under “Management’s Discussion and Analysis of Financial Condition and Results of Operations—Liquidity and Capital Resources,” we include a quantitative reconciliation of Covenant EBITDA and Covenant Adjusted EBITDA to the most directly comparable U.S. GAAP financial performance measure, which is net income attributable to ARAMARK Corporation stockholder.
MARKET AND INDUSTRY DATA
The data included in this prospectus regarding our industry and market opportunity, including the size of certain sectors and geographies, our position and the position of our competitors within these sectors and geographies and the portion of the market opportunity that is currently outsourced, are based on our management’s knowledge and experience in the sectors and geographies in which we operate. We believe these estimates to be accurate as of the date of this prospectus. However, this information may prove to be inaccurate because of the method by which we obtained some of the data for the estimates or because this information cannot always be verified with complete certainty due to the limits on the availability and reliability of raw data, the voluntary nature of the data gathering process and other limitations and uncertainties. As a result, you should be aware that market, ranking and other similar industry data included in this prospectus, and estimates and beliefs based on that data, may not be reliable. While we believe internal company research is reliable, such research has not been verified by any independent source.
iii
Table of Contents
This summary does not contain all of the information that you should consider before making your investment decision. You should read the entire prospectus carefully, including the matters discussed under the caption “Risk Factors” and the detailed information and financial statements included in this prospectus.
Our Company
We are a leading global provider of food, facilities and uniform services to education, healthcare, business and industry and sports, leisure and corrections clients. Our core market is North America, which is supplemented by an additional 19-country footprint serving many of the fastest growing global geographies. We hold the #2 position in North America, a top 3 position in countries representing 98% of 2012 total sales, and are one of only 3 food and facilities competitors with the combination of scale, scope, and global reach. Through our established brand, broad geographic presence and approximately 267,000 employees, we anchor our business in our partnerships with thousands of education, healthcare, business, sports, leisure and corrections clients. Through these partnerships we serve millions of consumers including students, patients, employees, sports fans and guests worldwide. The scope and range of ARAMARK’s services are evidenced by the following:
| • | We provide services to 84% of the Fortune 500 |
| • | We serve over 500 million meals annually to approximately 5 million students at colleges, universities, and K-12 schools |
| • | We service over 2,000 healthcare facilities, collectively representing over 75 million patient days annually |
| • | We cater to approximately 100 million sports fans annually through our partnerships with over 150 professional and collegiate teams |
| • | We put over 2 million people in uniforms each day |
| • | We operate in 22 countries in North America, Europe, Asia and South America |
ARAMARK’s mission is to “Deliver experiences that enrich and nourish lives.” This mission is anchored in a set of core values that guide our execution in the marketplace:
| • | Sell and Serve with Passion. Placing clients and consumers at the center of all that we do by listening and responding to their needs with best-in-class quality, innovation and exceptional service |
| • | Set Goals. Act. Win. Maintaining a culture of accountability where performance matters and exhibiting leadership that achieves and exceeds expectations through industry-leading execution |
| • | Front-Line First. Providing our front-line employees with tools and training that empower them to deliver excellence at the “moment of truth”—at the time they are providing service to thousands of consumers and clients every day |
| • | Integrity and Respect Always. Doing the right things without exception is the cornerstone of the ARAMARK brand and helps us earn the trust of our key constituents |
ARAMARK is a well-recognized global brand, known for exceptional customer service and a compelling value proposition. We partner with clients on-site and integrate our employees within their operations, which enables us to obtain valuable consumer insights and innovate to satisfy each client’s unique needs and requirements. Our repeatable business model is founded on five core principles of excellence—selling, service, execution, marketing and operations—that allow us to deliver high quality service consistent with the values that the ARAMARK brand embodies. Our commitment to excellence has earned us numerous awards and recognitions; we have been named one of the “World’s Most Admired Companies” by Fortune Magazine every year since 1999 and we are recognized as one of the “World’s Most Ethical Companies” by the Ethisphere Institute.
1
Table of Contents
We operate our business in three reportable segments that share many of the same operating characteristics: Food and Support Services North America, or FSS North America, Food and Support Services International, or FSS International, and Uniform and Career Apparel, or Uniform. The following chart provides a brief overview of our reportable segments (dollars in millions):
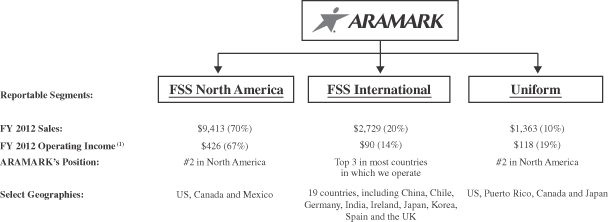
| (1) | Fiscal 2012 operating income excludes $51.8 million of unallocated corporate expenses. |
Within our reportable segments, our business is generally focused around key client types—Education, Healthcare, Business & Industry, Sports & Leisure and Corrections.
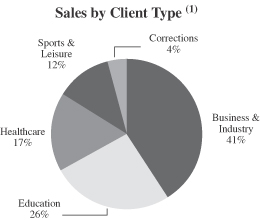
(1) Based on 2012 total sales.
Our broad range of services, diversified client base, global reach and repeatable business model position us well for continued growth and margin expansion opportunities. In fiscal 2012, we generated $13.5 billion of sales, and $1.1 billion of Adjusted EBITDA.
Our History and Recent Accomplishments
Since ARAMARK’s founding in 1959, we have broadened our service offerings and expanded our client base through a combination of organic growth and successful acquisitions, with the goal of further developing our food, facilities and uniform capabilities, as well as growing our international presence.
2
Table of Contents
On January 26, 2007, ARAMARK delisted from the NYSE in conjunction with a going-private transaction executed with investment funds affiliated with GS Capital Partners, CCMP Capital Advisors and J.P. Morgan Partners, Thomas H. Lee Partners and Warburg Pincus LLC as well as approximately 250 senior management personnel.
In May 2012, Eric Foss became the new CEO and President of our company. Previously, Mr. Foss was the CEO of Pepsi Beverages Company and was Chairman and CEO of the publicly-traded Pepsi Bottling Group. During his tenure with Pepsi Bottling Group, Mr. Foss implemented numerous growth and productivity initiatives designed to strengthen customer service and improve selling effectiveness, streamline operations, and rationalize supply chain infrastructure. Under Mr. Foss’ leadership at ARAMARK, we have sharpened our focus on achieving sustainable value creation through accelerating revenue and profit growth with expanding margins.
We continue to grow our existing business and win exciting new clients, including Airbus, the Ohio and Michigan departments of corrections, American University, the Minnesota Vikings, the Chicago Bears, and the Tampa Bay Buccaneers.
Our Market Opportunity
ARAMARK operates in large and highly fragmented markets with attractive industry dynamics. We believe that the global food and support services market and the North American uniform and career apparel market is approximately $900 billion. As only approximately 50% of this opportunity is outsourced, there is a substantial potential for growth by winning business with educational and healthcare institutions, businesses, sports and leisure facilities and correctional facilities that currently provide these services in-house. We expect that demand for increased outsourced services will continue to be driven by shifting client imperatives, including: the need to focus on core businesses, the desire to deliver a high level of consumer satisfaction, the pursuit of reduced costs and the attractiveness of consolidating services with a single provider. Our value-added provision of these services is increasingly important to our clients’ achievement of their own missions.
The food and support services market is highly fragmented, with the five largest competitors capturing only 9% of the global market. We expect larger service providers to continue to win a disproportionate amount of the business that is converted from self-operated services as clients are increasingly seeking services from partners with the scale and sophistication necessary to drive consumer satisfaction and increase operational efficiency.
Our core geographic market is North America, which we believe will remain a compelling opportunity due to the favorable underlying economic conditions, stability and opportunities for profitable growth, and growing trend towards outsourcing. We continue to focus on the Education and Healthcare sectors, which are only approximately 30% outsourced, and have increased as a percentage of GDP, representing significant growth opportunities. While cost reduction continues to be a key consideration, clients’ decisions are increasingly driven by the broader value proposition associated with outsourcing. Clients across sectors, from business to education to sports, recognize that providing higher quality, more efficient food and facilities services is critical to driving satisfaction of their key constituents: students and faculty, patients, employees and sports fans.
We also operate in select, high growth, emerging markets in Asia and South America. The GDP of the countries making up these markets grew at approximately 8.6% in 2012. The economic growth in these countries is driven by factors such as rising discretionary income and increased investment in growth sectors such as mining, education and healthcare. Additionally, we estimate emerging markets are approximately 70% self-operated, making them highly attractive opportunities for outsourcing expansion. Our operations in Europe are selectively centered around top 3 positions in Germany, the UK and Ireland and our exposure to southern Europe is limited to Spain, representing approximately 1% of our total sales.
3
Table of Contents
Our Strengths
We believe the following competitive strengths are key to our continued success:
Leader in a Large, Fragmented and Growing Market
We are a global market leader in the large, fragmented and growing food, facilities and uniform services industries. We hold the #2 position in North America and a top 3 position in countries representing 98% of 2012 total sales. We have developed these leadership positions primarily due to our commitment to helping build our clients’ success through leveraging our vast experience and sector knowledge while gaining deep consumer insight and providing a premier service offering to our clients. These leadership positions provide us with significant economies of scale, allow us to attract and retain top industry talent and position us to compete effectively for new business opportunities as clients are increasingly interested in service providers with a national or global reach, and a breadth of service offerings.
We estimate the combined addressable global food and support services market and the North American uniform and career apparel opportunity to be $900 billion collectively. We believe our market has the potential to grow in excess of GDP driven by the growing trend towards outsourcing. While the global food, facilities and uniform market is very large, it remains underpenetrated, with approximately 50% of the total opportunity currently outsourced. We expect to benefit disproportionately from the trend towards outsourcing as large service providers, such as ARAMARK, have had greater success in winning new client business relative to smaller outsourcing service providers. The global food and support services market’s highly fragmented nature, with the top three competitors accounting for only 7% of the market, enables additional opportunity for share gains and consolidation.
Favorable Geographic, Sector and Service Mix
We have the global reach and capability to deliver high quality services consistently and safely across 22 countries around the world, which represent approximately 65% of the world’s GDP. We believe that our strong and expanding presence in our core North American market will remain a principal growth driver. Also, utilizing the skills and experience we have developed over decades of service in the North American market, we have increasingly established our position in key, high growth, emerging markets in Asia and South America. Our sales in emerging markets have increased at an annual rate of approximately 14% over the last five years, and represent 7% of our sales in 2012 versus 4% in 2007. We believe that our expanding presence in these geographies will become increasingly important for our overall growth. We have a selective and stable position in Europe concentrated in Germany, the UK and Ireland with sales in southern Europe limited to Spain, which represents approximately 1% of our total sales. We believe our global footprint serves our clients in the most desirable geographies and provides a promising platform for further growth.
We serve a large and diversified client base across a wide range of sectors and businesses, including Education, Healthcare, Business & Industry and Sports, Leisure and Corrections, with no single client accounting for more than 1% of 2012 sales (other than collectively a number of U.S. government entities). The Education and Healthcare sectors, which together contributed 43% of our 2012 sales globally, are large, underpenetrated, and only approximately 30% outsourced, representing attractive growth opportunities for ARAMARK.
We believe that the breadth of our service capabilities and ability to innovate position ARAMARK well to meet evolving consumer needs and address our clients’ increasing desire to conduct business with an experienced single provider of multiple services. ARAMARK is a trusted partner across a variety of services, sectors and geographies, from offering safe living and working environments for miners in Latin America to patient transportation services for healthcare clients in China.
4
Table of Contents
Deep Client and Consumer Insight Leads to Attractive Growth Opportunities
ARAMARK’s leading positions, scale and breadth of product offering enable us to continue to grow our business through higher penetration into existing clients and cross-selling of additional services. We have long-lasting relationships with our clients due to our service excellence and our overall value proposition, which is evidenced by our approximately 95% annual retention rate and an average client relationship of approximately 10 years. We believe we are able to maintain these strong relationships year after year by providing value-added services which help our clients achieve their own mission and also improve satisfaction of their key constituencies: employees, students and faculty, patients and sports fans. This is increasingly important as, for example, businesses compete for employees, colleges compete for students and hospitals compete for patients. Given that only 9% of our current clients utilize both food and facilities services, we believe substantial opportunities remain for us to provide additional services to our existing client base. Further, we aim to increase the per capita spending of our target consumers and expand the participation rates of these populations in our existing service offering, through innovative marketing and merchandising programs.
We continuously innovate our existing services to better meet our clients’ evolving needs. We use ARAMARK’s consumer insights and other research to increase our awareness of market trends, client needs and consumer preferences. Annualized revenue from new clients contracted during 2012 was over $1.0 billion. Our recent wins span sectors and geographies, including Airbus, the Ohio and Michigan departments of corrections, American University, the Minnesota Vikings, the Chicago Bears and the Tampa Bay Buccaneers.
Improving Profitability with Resilient Cash Flow
We have and continue to implement a number of programs and tools to increase our profitability, including enhanced management of our key costs—food, labor and overhead—through SKU rationalization, portioning, waste control, enhanced labor scheduling, turn-over reduction and SG&A discipline, among others. Because of the leverage inherent in our business model, we believe the implementation of these measures will increase our profitability. Since instituting these new productivity initiatives in 2012, we have seen positive momentum in our performance. During the first nine months of fiscal 2013, we achieved year-over-year growth in our Adjusted Operating Income of 10% and sales growth of 3%.
We have a favorable business mix that allows us to deliver consistent profitability in most macroeconomic environments. We can react quickly to changing conditions in our day to day operations due to our highly variable cost structure. We generate strong and stable cash flow as a result of our consistent profitability and limited working capital and capital expenditure requirements. Our capital expenditures in the last 5 years have averaged only 2.4% of sales. In the economic downturn in 2009 for example, our cash flow actually increased as lower capital expenditures and a reduction in working capital more than offset a modest earnings decline. We believe that the low capital intensity of our business model positions us to continue to generate significant cash flow, which should give us the flexibility to reduce debt, pursue strategic acquisitions and return capital to our stockholders.
Strong Management Team with Diverse Experience
Our management team is a carefully constructed group of successful long-tenured leaders with significant industry and company experience blended with talented outside leaders with significant Fortune 500 management, consumer/retail and food industry experience. Our CEO and President, Eric Foss, is an experienced Fortune 500 public company CEO with a demonstrated multi-year track record of success and stockholder value creation. Since joining ARAMARK in 2012, he has further enhanced ARAMARK’s strong foundation with an integrated strategy focusing on growth, productivity, people and delivering on financial commitments. The average tenure of our principal operating leaders is 20 years, with individual tenure ranging from 33 years to less
5
Table of Contents
than one year. Our remaining senior management team and business unit presidents’ tenure averages 12 years. ARAMARK has a long history of broad management ownership dating back to the 1980s, and our management team collectively has a significant equity position in ARAMARK.
Our Strategies
Our core strategy is to provide the highest quality food, facilities and uniform services to our clients and consumers through a consistent, repeatable business model anchored around five core principles of excellence—selling, service, execution, marketing and operations. We will continue to build our core business in North America, and expand our emerging markets platform through the following growth and operational strategies:
Grow Our Base Business
• Drive Incremental Revenue from Existing Clients
We intend to increase penetration within our existing client base. We have implemented a framework that establishes high levels of excellence in service and execution across our food, facilities and uniform businesses. We leverage our extensive industry knowledge and decades of experience, which has allowed us to gain deep client and consumer insight in our efforts to provide the highest quality of service in the industry. We believe our ideas and innovations are a key differentiating factor for ARAMARK in winning new business at existing clients. Opportunities exist to increase penetration in each of our major service lines—food service, facilities service and uniform service. In each of our sectors we have identified the top items that drive demand and have established rigorous executional frameworks at the location level to maximize results. At our Major League Baseball venues where these programs have been introduced, per-capita expenditures by fans are 5.7% higher than last season.
Currently, 9% of our clients use both our food and facilities services. Having an on-site team successfully providing one service positions us well to expand the services we provide. An example of a recent success is American University, where we have been providing facilities services since 2001 and recently won the dining business from a competitor based on our strategic vision for the campus and the local management teams that have consistently delivered high quality services.
• Increase Client Retention Rates
ARAMARK has historically experienced high and consistent client retention rates. In 2012, our client retention rate was 95%. Our front-line focus and increased emphasis on providing world class service enables us to uphold excellence in all facets of our client-facing operations. Our service orientation is centered on creating a culture of excellence. We focus our consumer facing employees on adhering to stringent quality standards, which create an enhanced consumer experience. By delivering high quality, innovative and consistent service to our clients, we believe our attractive value proposition will drive client and consumer loyalty, enabling us to increase our retention rates and enhance profitability for our stockholders.
Grow New Business
• Expand New Business Through Selling Excellence
ARAMARK’s platform for achieving consistent selling excellence is centered on listening to and understanding our clients’ needs, creating innovative service offerings that meet those needs and selling our services with passion. Our market leadership and extensive industry experience position us to capitalize on the
6
Table of Contents
large, under-penetrated and growing food, facilities and uniform services markets. We believe that the current rate of penetration will accelerate as more businesses and organizations continue to see the benefits of outsourcing non-core activities.
We are particularly focused on the Education and Healthcare sectors due to their lower level of economic sensitivity and strong growth. Despite recent economic weakness, total spending on Education and Healthcare has increased as a percentage of total GDP. Additionally, we believe the addressable Education and Healthcare sectors represent opportunities of $87 billion and $31 billion, respectively, and are only approximately 30% outsourced to third party providers, which provides a significant opportunity for further growth.
• Increase Our Presence in Emerging Markets
The favorable growth characteristics and relatively low outsourcing rates in emerging market regions present a substantial opportunity for accelerated growth. Our emerging markets presence currently consists of 7 countries across Asia and South America. Our growth strategy in select emerging market geographies is focused on three initiatives: supporting existing clients as they expand into emerging markets, growing in geographies in which we already operate profitably, and entering new geographies where we have identified attractive prospects for profitable expansion. Over the last several years, our China business has experienced high double-digit organic growth and we are well positioned to utilize our deep industry and country knowledge to continue to expand in this key geography. Additionally, we have established a strong presence in South America and are focused on growing our presence in this region.
Given the scale and coordination required to successfully execute a multinational contract, we believe we are one of a very small group of global companies currently capable of competing for these highly attractive contracts within emerging markets.
• Pursue Strategic Acquisitions
We anticipate that continued consolidation in the global food, facilities and uniform services markets will create opportunities for us to acquire businesses with complementary geographic and service offering profiles. We intend to continue strengthening our existing business through selective, accretive acquisitions that will solidify our position, enhance and expand our service capabilities, further develop our differentiated positions, or allow us to enter into high growth geographies. We have a history of successful acquisitions, which we have successfully integrated into our existing operations while achieving targeted synergies with minimal client losses. For example, in fiscal 2012 we acquired Filterfresh, a leader in providing quality office refreshment services to employees in the workplace, and in fiscal 2011 we acquired Masterplan, a clinical technology management and medical equipment maintenance company, which expanded our capability to service all levels of hospital clinical technology and strengthened our position in a key sector within the North American market. Both acquisitions were integrated into larger, similar ARAMARK operations.
Accelerate Margin Expansion through Operational Excellence
Since the 2007 Transaction, we have delivered solid, consistent performance in Adjusted Operating Income as a percentage of sales, despite periods of instability in the global economy. During that time we have also implemented a disciplined process to achieve operational excellence and capture productivity for growth through a standard, repeatable business model. To achieve this, we are investing in the systems, tools and training utilized by our front-line employees, and establishing quality standards and processes to more efficiently manage our food, merchandise, labor, and above-unit costs. For example, we have implemented several productivity initiatives, including SKU rationalization, waste reduction, improved labor scheduling and menu standardization. Additionally, our scale and operating leverage allow us to effectively manage these costs, which together
7
Table of Contents
accounted for 77% of our operating costs in fiscal 2012. We are also incorporating automated, standardized and centralized processes that have resulted in the reduction of above-unit overhead costs through the elimination of redundancies in our finance and HR functions.
The successful implementation of these initiatives has led to increased profitability, a portion of which we are reinvesting in our business to achieve additional growth and margin expansion. This reinvestment is focused on two primary goals: improving the efficiency of standard tools and selling resources, and continuing to recruit, train and develop employees to maintain our culture of high performance. Through continued reinvestment in our business, we expect to both increase our ability to execute upon our core strategies and maintain our operational excellence.
Risks Relating to Our Business and This Offering
Participating in this offering involves substantial risk. Our ability to execute our strategies also is subject to certain risks. The risks described under the heading “Risk Factors” immediately following this summary may cause us not to realize the full benefits of our strengths or may cause us to be unable to successfully execute all or part of our strategies. Some of the more significant challenges and risks include the following:
| • | unfavorable economic conditions, as well as natural disasters, global calamities, sports strikes and other adverse incidents, have, and in the future could, adversely affect our results of operations and financial condition; |
| • | our failure to retain our current clients, renew our existing client contracts and obtain new clients could adversely affect our business; |
| • | we may be adversely affected if clients reduce their outsourcing or use of preferred vendors; |
| • | competition in our industries could adversely affect our results of operations; |
| • | increased operating costs and obstacles to cost recovery due to the pricing and cancellation terms of our FSS contracts may constrain our ability to make a profit; |
| • | our inability to achieve cost savings through our cost reduction efforts could impact our results of operations; |
| • | a failure to maintain food safety throughout our supply chain and food-borne illness concerns may result in reputational harm and claims of illness or injury that could adversely affect us; |
| • | governmental regulations, including those relating to food and beverages, the environment, wage and hour, anti-corruption and our government contracts, may subject us to significant liability; |
| • | our business may suffer if we are unable to hire and retain sufficient qualified personnel or if labor costs increase; |
| • | our leverage could adversely affect our ability to raise additional capital to fund our operations, limit our ability to react to changes in the economy or our industries, expose us to interest rate risk to the extent of our variable rate debt and prevent us from meeting our obligations; and |
| • | the other factors set forth under the “Risk Factors” in this prospectus. |
Before you participate in this offering, you should carefully consider all of the information in this prospectus, including those matters set forth under the heading “Risk Factors.”
8
Table of Contents
Company Information
ARAMARK Holdings Corporation is organized under the laws of the State of Delaware. Our business traces its history back to the 1930s.
Our executive offices are located at ARAMARK Tower, 1101 Market Street, Philadelphia, Pennsylvania 19107. Our website is www.aramark.com. Please note that our Internet website address is provided as an inactive textual reference only. Information on our website does not constitute part of this prospectus.
9
Table of Contents
The Offering
| Common stock offered by us |
shares |
| Common stock offered by the selling stockholders |
shares |
| Common stock to be outstanding after this offering |
shares ( shares if the underwriters exercise their option to purchase additional shares in full). |
| Option to purchase additional shares |
We and the selling stockholders have granted the underwriters an option to purchase up to additional shares. The underwriters could exercise this option at any time within 30 days from the date of this prospectus. |
| Use of proceeds |
We estimate that the net proceeds we will receive from the sale of shares of our common stock we are offering, after deducting underwriters’ discounts and commissions and estimated expenses payable by us, will be approximately $ million (or $ million if the underwriters exercise their option to purchase additional shares in full). This estimate assumes an initial public offering price of $ per share, the midpoint of the range set forth on the cover page of this prospectus. We will not receive any proceeds from the sale of shares of our common stock by the selling stockholders. For a sensitivity analysis as to the initial public offering price and other information, see “Use of Proceeds.” |
| We intend to use the net proceeds received by us from this offering to repay certain of our existing indebtedness, including a portion of the outstanding term loans due July 26, 2016 under our senior secured credit facilities. See “Description of Certain Indebtedness.” |
| Dividend policy |
Following completion of this offering, we intend to commence the payment of cash dividends on our common stock, subject to our compliance with applicable law, and depending on, among other things, our results of operations, financial condition, level of indebtedness, capital requirements, contractual restrictions, business prospects and other factors that our board of directors may deem relevant. Our ability to pay dividends on our common stock is limited by the covenants of our senior secured credit facilities and the indenture governing our senior notes and may be further restricted by the terms of any future debt or preferred securities. See “Dividend Policy” and “Description of Certain Indebtedness.” |
| Controlled company |
After the completion of this offering, certain stockholders will continue to control a majority of the voting power of our outstanding common stock. As a result, we will be a “controlled company” within the meaning of the NYSE corporate governance standards. |
10
Table of Contents
| Risk factors |
You should read the “Risk Factors” section of this prospectus for a discussion of factors that you should consider carefully before deciding to invest in our common stock. |
| New York Stock Exchange symbol |
We intend to apply for listing of shares of our common stock on the New York Stock Exchange under the symbol “ .” |
| Conflicts of interest |
Goldman, Sachs & Co. and J.P. Morgan Securities LLC and/or their respective affiliates each own in excess of 10% of our issued and outstanding common stock and it is expected that, by selling shares of common stock in this offering, they will collectively receive more than 5% of the net proceeds of the offering, not including underwriting compensation and as a result are deemed to have a “conflict of interest” with us within the meaning of Rule 5121 of the Financial Industry Regulatory Authority (“Rule 5121”). Therefore, this offering will be conducted in accordance with Rule 5121, which requires that Goldman, Sachs & Co. and J.P. Morgan Securities LLC will not make sales to discretionary accounts without the prior written consent of the account holder and that a qualified independent underwriter (“QIU”) as defined in Rule 5121 participate in the preparation of the registration statement of which this prospectus forms a part and perform its usual standard of due diligence with respect thereto and has agreed to act as QIU for this offering. |
| Certain of the underwriters or their affiliates are lenders or have committed to lend under our senior secured credit facility due July 26, 2016. As described under “Use of Proceeds”, the Company intends to repay outstanding amounts under such senior secured credit facility using a portion of the net proceeds of this offering received by the Company and will pay such amounts to the underwriters or their respective affiliates in proportion to their respective current commitments thereunder. |
The number of shares of our common stock to be outstanding following this offering is based on shares of common stock outstanding as of and excludes:
| • | shares issuable upon the exercise of options to purchase shares outstanding as of ; with an exercise price of $ per share; and restricted stock units, shares of restricted stock and director deferred stock units and |
| • | shares reserved for future issuance under our share-based compensation plans as of . |
Unless otherwise noted, the information in this prospectus reflects and assumes no exercise by the underwriters of their option to purchase additional shares.
11
Table of Contents
Summary Consolidated Financial Data
The following table sets forth summary consolidated financial data as of the dates and for the periods indicated. The summary consolidated financial data for the fiscal years 2012, 2011 and 2010 have been derived from our consolidated financial statements appearing elsewhere in this prospectus, which have been audited by KPMG LLP. The summary consolidated financial data as of October 1, 2010 has been derived from our consolidated financial statements that are not included in this prospectus, which have been audited by KPMG LLP.
The summary consolidated financial data as of June 28, 2013, and for the nine months ended June 28, 2013 and June 29, 2012, have been derived from our unaudited condensed consolidated financial statements appearing elsewhere in this prospectus. The summary consolidated financial data as of June 29, 2012 has been derived from our unaudited condensed consolidated financial statements that are not included in this prospectus. The unaudited financial data presented have been prepared on a basis consistent with our audited consolidated financial statements. In the opinion of management, such unaudited financial data reflect all adjustments, consisting only of normal and recurring adjustments, necessary for a fair presentation of the results for those periods. The results of operations for the interim periods are not necessarily indicative of the results to be expected for the full year or any future period.
The financial data set forth in this table should be read in conjunction with the section titled “Selected Consolidated Financial Data” and “Management’s Discussion and Analysis of Financial Condition and Results of Operations,” included elsewhere in this prospectus, as well as with our consolidated financial statements and related notes and our unaudited condensed consolidated financial statements and related notes that are also included elsewhere in this prospectus.
| Fiscal year(1) | Nine months ended | |||||||||||||||||||
| 2012 | 2011 | 2010 | June 28, 2013 |
June 29, 2012 |
||||||||||||||||
| (dollars in millions, except per share data) | (unaudited) | (unaudited) | ||||||||||||||||||
| Statement of operations data: |
||||||||||||||||||||
| Sales |
$ | 13,505 | $ | 13,082 | $ | 12,419 | $ | 10,430 | $ | 10,104 | ||||||||||
| Costs and expenses: |
||||||||||||||||||||
| Cost of services provided |
12,191 | 11,836 | 11,247 | 9,482 | 9,141 | |||||||||||||||
| Depreciation and amortization |
529 | 511 | 503 | 405 | 396 | |||||||||||||||
| Selling and general corporate expenses |
203 | 188 | 191 | 164 | 151 | |||||||||||||||
|
|
|
|
|
|
|
|
|
|
|
|||||||||||
| Operating income |
582 | 547 | 478 | 379 | 416 | |||||||||||||||
| Interest and other financing costs, net |
457 | 451 | 445 | 341 | 357 | |||||||||||||||
|
|
|
|
|
|
|
|
|
|
|
|||||||||||
| Income from continuing operations before income taxes |
125 | 96 | 33 | 38 | 59 | |||||||||||||||
| Provision (benefit) for income taxes |
18 | (1 | ) | 1 | 7 | 12 | ||||||||||||||
|
|
|
|
|
|
|
|
|
|
|
|||||||||||
| Income from continuing operations |
107 | 97 | 32 | 31 | 47 | |||||||||||||||
|
|
|
|
|
|
|
|
|
|
|
|||||||||||
| Loss from discontinued operations, net of tax(2) |
— | (12 | ) | (1 | ) | — | — | |||||||||||||
|
|
|
|
|
|
|
|
|
|
|
|||||||||||
| Net income |
107 | 85 | 31 | 31 | 47 | |||||||||||||||
|
|
|
|
|
|
|
|
|
|
|
|||||||||||
| Less: Net income attributable to noncontrolling interests |
3 | 1 | — | 1 | 2 | |||||||||||||||
|
|
|
|
|
|
|
|
|
|
|
|||||||||||
| Net income attributable to ARAMARK stockholders |
$ | 104 | $ | 84 | $ | 31 | $ | 30 | $ | 45 | ||||||||||
|
|
|
|
|
|
|
|
|
|
|
|||||||||||
12
Table of Contents
| Fiscal year(1) | Nine months ended | |||||||||||||||||||
| 2012 | 2011 | 2010 | June 28, 2013 |
June 29, 2012 |
||||||||||||||||
| (dollars in millions, except per share data) | (unaudited) | (unaudited) | ||||||||||||||||||
| Per Share Data: |
||||||||||||||||||||
| Basic: |
||||||||||||||||||||
| Income from continuing operations |
$ | 0.51 | $ | 0.47 | $ | 0.16 | $ | 0.15 | $ | 0.22 | ||||||||||
| Loss from discontinued operations |
0.00 | (0.06 | ) | (0.01 | ) | — | 0.00 | |||||||||||||
|
|
|
|
|
|
|
|
|
|
|
|||||||||||
| Net income attributable to ARAMARK stockholders |
$ | 0.51 | $ | 0.41 | $ | 0.15 | $ | 0.15 | $ | 0.22 | ||||||||||
| Diluted: |
||||||||||||||||||||
| Income from continuing operations |
$ | 0.49 | $ | 0.46 | $ | 0.16 | $ | 0.15 | $ | 0.21 | ||||||||||
| Loss from discontinued operations |
0.00 | (0.06 | ) | (0.01 | ) | — | 0.00 | |||||||||||||
|
|
|
|
|
|
|
|
|
|
|
|||||||||||
| Net income attributable to ARAMARK stockholders |
$ | 0.49 | $ | 0.40 | $ | 0.15 | $ | 0.15 | $ | 0.21 | ||||||||||
| Cash dividend per share(3) |
$ | — | $ | 3.50 | $ | — | $ | — | $ | — | ||||||||||
| Statement of cash flows data: |
||||||||||||||||||||
| Net cash provided by/(used in): |
||||||||||||||||||||
| Operating activities(4) |
$ | 692 | $ | 304 | $ | 634 | $ | 136 | $ | 137 | ||||||||||
| Investing activities |
(482 | ) | (363 | ) | (354 | ) | (252 | ) | (363 | ) | ||||||||||
| Financing activities(4) |
(287 | ) | 112 | (344 | ) | 77 | 114 | |||||||||||||
| Other financial data: |
||||||||||||||||||||
| Adjusted Net Income(5) |
$ | 209 | $ | 200 | $ | 130 | $ | 162 | $ | 124 | ||||||||||
| Adjusted Operating Income(5) |
750 | 717 | 640 | 596 | 544 | |||||||||||||||
| Adjusted EBITDA(5) |
1,126 | 1,075 | 1,002 | 885 | 826 | |||||||||||||||
| Capital expenditures, net of disposals |
343 | 272 | 264 | 255 | 219 | |||||||||||||||
| Balance sheet data (at period end): |
||||||||||||||||||||
| Cash and cash equivalents |
$ | 137 | $ | 213 | $ | 161 | $ | 98 | $ | 101 | ||||||||||
| Noncash working capital(4)(6) |
(105 | ) | (101 | ) | (321 | ) | 242 | 239 | ||||||||||||
| Total assets(4) |
10,487 | 10,523 | 10,222 | 10,127 | 10,431 | |||||||||||||||
| Total debt (including current portion of long term debt)(4)(7) |
6,009 | 6,232 | 5,402 | 6,217 | 6,377 | |||||||||||||||
| Total equity(3) |
967 | 882 | 1,397 | 829 | 927 | |||||||||||||||
| (1) | Fiscal years 2012, 2011 and 2010 refer to the fiscal years ended September 28, 2012, September 30, 2011 and October 1, 2010, respectively. All periods presented are 52-week periods. |
| (2) | During fiscal 2011, the Company completed the sale of its wholly-owned subsidiary, Galls, for approximately $75.0 million in cash. The transaction resulted in a pretax loss of approximately $1.5 million (after-tax loss of approximately $12.0 million). Galls is accounted for as a discontinued operation. Galls’ results of operations have been removed from the Company’s results of continuing operations for all periods presented. |
| (3) | During fiscal 2011, the Company paid a dividend of approximately $711 million to its stockholders. On October 29, 2012, we completed the spin-off of our majority interest in Seamless North America, LLC, an online and mobile food ordering service, to our stockholders in the form of a dividend. Each stockholder received one share of the common stock of Seamless Holdings, a newly formed company created to hold our former interest in Seamless North America, LLC, for each share of our common stock held as of the record date. |
| (4) | In the first quarter of fiscal 2011, the Company adopted the new authoritative accounting guidance regarding transfers of financial assets. The impact upon adoption resulted in the recognition of both the receivables securitized under the program and the borrowings they collateralize on the Consolidated Balance Sheet, which led to a $220.9 million increase in “Receivables” and “Long-Term Borrowings.” As a result of implementing the new guidance, funding under the agreement of $220.9 million on October 2, 2010 was reflected in the Company’s Consolidated Statement of Cash Flows as a use of cash from the securitization of accounts receivables under net cash provided by/(used in) operating activities and as a source of cash under net cash provided by/(used in) financing activities. |
13
Table of Contents
| (5) | We use Adjusted Net Income, Adjusted Operating Income and Adjusted EBITDA as supplemental measures to evaluate our performance. Adjusted Net Income, Adjusted Operating Income and Adjusted EBITDA are not measurements of financial performance under generally accepted accounting principles in the United States, or U.S. GAAP. Adjusted Net Income represents net income adjusted to eliminate the impact from discontinued operations, net of tax; the increased amortization of acquisition-related customer relationship intangible assets and depreciation of property and equipment resulting from the 2007 Transaction; the impact of changes in the fair value of our gasoline and diesel fuel derivative instruments; severance and other charges; and share-based compensation, less the tax impact of these adjustments. Adjusted Operating Income represents Adjusted Net Income further adjusted to exclude the impact from income taxes and interest and other financing costs. Adjusted EBITDA represents Adjusted Operating Income further adjusted to exclude the impact of all other depreciation and amortization expense. |
We use Adjusted Net Income as a supplemental measure of our overall profitability because it excludes the impact of the non-cash amortization of certain intangible assets and depreciation of property and equipment that were created at the time of the 2007 Transaction, non-cash share-based compensation expense and other items which are not indicative of our ongoing operational performance. Similarly, we use Adjusted Operating Income and Adjusted EBITDA as supplemental measures of our operating profitability and to evaluate and control our cash operating costs because they exclude the impact of the items noted above relating to the calculation of Adjusted Net Income that are not indicative of our ongoing operational performance. We believe the presentation of Adjusted Net Income, Adjusted Operating Income and Adjusted EBITDA is appropriate to provide additional information to investors about our operating performance.
Our presentation of these measures has limitations as an analytical tool, and should not be considered in isolation or as a substitute for analysis of our results as reported under U.S. GAAP. You should not consider these measures as alternatives to net income or operating income, determined in accordance with U.S. GAAP. Adjusted Net Income, Adjusted Operating Income and Adjusted EBITDA, as presented by us, may not be comparable to other similarly titled measures of other companies because not all companies use identical calculations. Moreover, our definition of Adjusted EBITDA as presented here, although similar, is not the same as Covenant EBITDA and Covenant Adjusted EBITDA, which are calculated for ARAMARK Corporation in connection with our financial covenants in the indenture governing our senior notes and in our senior secured credit facilities.
14
Table of Contents
A directly comparable U.S. GAAP measure to Adjusted Net Income, Adjusted Operating Income and Adjusted EBITDA is net income. Adjusted Net Income, Adjusted Operating Income and Adjusted EBITDA are reconciled from net income as follows:
| Fiscal year | Nine months ended | |||||||||||||||||||
| (unaudited, dollars in millions) | 2012 | 2011 | 2010 | June 28, 2013 |
June 29, 2012 |
|||||||||||||||
| Net Income (as reported) |
$ | 107 | $ | 85 | $ | 31 | $ | 31 | $ | 47 | ||||||||||
| Adjustment: |
||||||||||||||||||||
| Loss from Discontinued Operations, net of tax |
— | 12 | 1 | — | — | |||||||||||||||
| Increased Amortization of Acquisition-Related Customer Relationship Intangible Assets and Depreciation of Property and Equipment Resulting from the 2007 Transaction |
153 | 153 | 141 | 116 | 114 | |||||||||||||||
| Change in Fair Value of Gasoline and Diesel Fuel Derivative Instruments |
(1 | ) | — | — | 1 | 1 | ||||||||||||||
| Severance and Other Charges (a) |
— | — | — | 88 | — | |||||||||||||||
| Share-Based Compensation |
16 | 17 | 21 | 12 | 13 | |||||||||||||||
| Tax Impact of Adjustments to Adjusted Net Income (b) |
(66 | ) | (67 | ) | (64 | ) | (86 | ) | (51 | ) | ||||||||||
|
|
|
|
|
|
|
|
|
|
|
|||||||||||
| Adjusted Net Income |
$ | 209 | $ | 200 | $ | 130 | $ | 162 | $ | 124 | ||||||||||
| Adjustment: |
||||||||||||||||||||
| Tax Impact of Adjustments to Adjusted Net Income (b) |
66 | 67 | 64 | 86 | 51 | |||||||||||||||
| Provision (Benefit) for Income Taxes |
18 | (1 | ) | 1 | 7 | 12 | ||||||||||||||
| Interest and Other Financing Charges |
457 | 451 | 445 | 341 | 357 | |||||||||||||||
|
|
|
|
|
|
|
|
|
|
|
|||||||||||
| Adjusted Operating Income |
$ | 750 | $ | 717 | $ | 640 | $ | 596 | $ | 544 | ||||||||||
| Adjustment: |
||||||||||||||||||||
| Increased Amortization of Acquisition-Related Customer Relationship Intangible Assets and Depreciation of Property and Equipment Resulting from the 2007 Transaction |
(153 | ) | (153 | ) | (141 | ) | (116 | ) | (114 | ) | ||||||||||
| Depreciation and Amortization |
529 | 511 | 503 | 405 | 396 | |||||||||||||||
|
|
|
|
|
|
|
|
|
|
|
|||||||||||
| Adjusted EBITDA |
$ | 1,126 | $ | 1,075 | $ | 1,002 | $ | 885 | $ | 826 | ||||||||||
| (a) | Severance and Other Charges includes severance and related costs of $47.4 million, goodwill impairments of $11.7 million, asset write-offs of $11.4 million and costs related to transformation initiatives of $17.1 million for the nine months ended June 28, 2013. |
| (b) | Represents the tax benefit, using an effective tax rate of 39.5%, associated with the adjusted expenses. |
| (6) | Noncash working capital represents accounts receivable, net, plus inventories, prepayments and other current assets, minus accounts payable, accrued payroll and related expenses, and other accrued expenses and current liabilities, exclusive of assets held for sale. |
| (7) | During fiscal 2011, the Company completed a private placement of $600 million, net of a 1% discount, in aggregate principal amount of 8.625% / 9.375% Senior Notes due 2016. In the second quarter of fiscal 2013, the Company completed a refinancing, repurchasing ARAMARK Corporation’s outstanding 8.50% Senior Notes due 2015 and Senior Floating Rate Notes due 2015 and our 8.625% / 9.375% Senior Notes due 2016. The Company refinanced that debt with new term loan borrowings and the issuance of our senior notes. |
15
Table of Contents
An investment in our common stock involves a high degree of risk. You should carefully consider each of the following risks as well as the other information included in this prospectus, including “Selected Consolidated Financial Data,” “Management’s Discussion and Analysis of Financial Condition and Results of Operations” and our financial statements and related notes, before investing in our common stock. Any of the following risks could materially and adversely affect our business, financial condition or results of operations. In such a case, the trading price of the common stock could decline and you may lose all or part of your investment.
Risks Related to Our Business
Unfavorable economic conditions have, and in the future could, adversely affect our results of operations and financial condition.
A national or international economic downturn has, and in the future could, reduce demand for our services in each of our operating segments, which may result in the loss of business or increased pressure to contract for business on less favorable terms than our generally preferred terms. Economic hardship among our client base can also impact our business. For example, during the recent period of economic distress, certain of our businesses have been negatively affected by reduced employment levels at our clients’ locations and declining levels of business and consumer spending. In addition, insolvency experienced by clients, especially larger clients, has, and in the future could, make it difficult for us to collect amounts we are owed and could result in the voiding of existing contracts. Similarly, financial distress or insolvency, if experienced by our key vendors and service providers such as insurance carriers, could significantly increase our costs.
The portion of our food and support services business that provides services in public facilities such as convention centers and tourist and recreational attractions is particularly sensitive to an economic downturn, as expenditures to take vacations or hold or attend conventions are funded to a partial or total extent by discretionary income. A decrease in such discretionary income on the part of potential attendees at our clients’ facilities has, and in the future could, result in a reduction in our sales. Further, because our exposure to the ultimate consumer of what we provide is limited by our dependence on our clients to attract those consumers to their facilities and events, our ability to respond to such a reduction in attendance, and therefore our sales, is limited. There are many factors that could reduce the numbers of events in a facility or attendance at an event, including labor disruptions involving sports leagues, poor performance by the teams playing in a facility, number of playoff games, inclement weather and adverse economic conditions which would adversely affect sales and profits.
Natural disasters, global calamities, sport strikes and other adverse incidents could adversely affect our sales and operating results.
Natural disasters, including hurricanes and earthquakes, or global calamities have, and in the future could, affect our sales and operating results. In the past, ARAMARK experienced lost and closed client locations, business disruptions and delays, the loss of inventory and other assets, and the effect of the temporary conversion of a number of ARAMARK client locations to provide food and shelter to those left homeless by storms. In addition, any terrorist attacks, particularly against venues that we serve, and the national and global military, diplomatic and financial response to such attacks or other threats, also may adversely affect our sales and operating results. Sports strikes, particularly those that are for an extended time period, can reduce our sales and have an adverse impact on our results of operations. For example, in 2012, the collective bargaining agreement for the players in the National Hockey League expired. As a result, the 2012/2013 season was significantly shortened and our sales and profits were negatively impacted. Any decrease in the number of games played would mean a loss of sales and reduced profits at the venues we service.
16
Table of Contents
Our failure to retain our current clients, renew our existing client contracts and obtain new client contracts could adversely affect our business.
Our success depends on our ability to retain our current clients, renew our existing client contracts and obtain new business. Our ability to do so generally depends on a variety of factors, including the quality, price and responsiveness of our services, as well as our ability to market these services effectively and differentiate ourselves from our competitors. We cannot assure you that we will be able to obtain new business, renew existing client contracts at the same or higher levels of pricing or that our current clients will not turn to competitors, cease operations, elect to self-operate or terminate contracts with us. The failure to renew a significant number of our existing contracts would have a material adverse effect on our business and results of operations and the failure to obtain new business could have an adverse impact on our growth.
We may be adversely affected if clients reduce their outsourcing or use of preferred vendors.
Our business and growth strategies depend in large part on the continuation of a current trend toward outsourcing services. Clients will outsource if they perceive that outsourcing may provide quality services at a lower overall cost and permit them to focus on their core business activities. We cannot be certain that this trend will continue or not be reversed or that clients that have outsourced functions will not decide to perform these functions themselves.
In addition, labor unions representing employees of some of our current and prospective clients have occasionally opposed the outsourcing trend to the extent that they believed that current union jobs for their memberships might be lost. In these cases, unions typically seek to prevent public sector entities from outsourcing and if that fails, ensure that jobs that are outsourced continue to be unionized, which can reduce our pricing and operational flexibility with respect to such businesses.
We have also identified a trend among some of our clients toward the retention of a limited number of preferred vendors to provide all or a large part of their required services. We cannot be certain that this trend will continue or not be reversed or, if it does continue, that we will be selected and retained as a preferred vendor to provide these services. Unfavorable developments with respect to either outsourcing or the use of preferred vendors could have a material adverse effect on our business and results of operations.
Competition in our industries could adversely affect our results of operations.
There is significant competition in the food and support services business from local, regional, national and international companies, of varying sizes, many of which have substantial financial resources. Our ability to successfully compete depends on our ability to provide quality services at a reasonable price and to provide value to our clients and consumers. Certain of our competitors have been and may in the future be willing to underbid us or accept a lower profit margin or expend more capital in order to obtain or retain business. Also, certain regional and local service providers may be better established than we are within a specific geographic region. In addition, existing or potential clients may elect to self-operate their food and support services, eliminating the opportunity for us to serve them or compete for the account. While we have a significant international presence, certain of our competitors have more extensive portfolios of services and a broader geographic footprint than we do. Therefore, we may be placed at a competitive disadvantage for clients who require multiservice or multinational bids.
We have a number of major national competitors in the uniform rental industry with significant financial resources. In addition, there are regional and local uniform suppliers whom we believe may have strong client loyalty. While most clients focus primarily on quality of service, uniform rental also is a price-sensitive service and if existing or future competitors seek to gain clients or accounts by reducing prices, we may be required to lower prices, which would reduce our sales and profits. The uniform rental business requires investment capital for growth. Failure to maintain capital investment in this business would put us at a competitive disadvantage. In addition, due to competition in our uniform rental business, it has become increasingly important for us to source
17
Table of Contents
garments and other products overseas, particularly from Asia. To the extent we are not able to effectively source such products from Asia and gain the related cost savings, we may be at a further disadvantage in relation to some of our competitors.
Increased operating costs and obstacles to cost recovery due to the pricing and cancellation terms of our food and support services contracts may constrain our ability to make a profit.
Our profitability can be adversely affected to the extent we are faced with cost increases for food, wages, other labor related expenses (including workers’ compensation, state unemployment insurance and federal or state mandated health benefits and other healthcare costs), insurance, fuel, utilities, piece goods, clothing and equipment, especially to the extent we are unable to recover such increased costs through increases in the prices for our products and services, due to one or more of general economic conditions, competitive conditions or contractual provisions in our client contracts. Oil and natural gas prices have fluctuated significantly in the last several years. Substantial increases in the cost of fuel and utilities have historically resulted in substantial cost increases in our uniform rental business, and to a lesser extent in our food and support services segments. From time to time we have experienced increases in our food costs. While we believe a portion of these increases were attributable to fuel prices, we believe the increases also resulted from rising global food demand and the increased production of biofuels such as ethanol. In addition, food prices can fluctuate as a result of temporary changes in supply, including as a result of incidences of severe weather such as droughts, heavy rains and late freezes. We have two main types of contract in our food and facilities business: profit and loss contracts in which we bear all of the expenses of the contract but gain the benefit of the sales, and client interest contracts in which our clients share some or all of the expenses and gain some or all of the sales. Approximately 73% of our food and support services sales in fiscal 2012 are from profit and loss contracts under which we have limited ability to pass on cost increases to our clients. Therefore, in many cases, we will have to absorb any cost increases, which may adversely impact our operating results.
The amount of risk that we bear and our profit potential vary depending on the type of contract under which we provide food and support services. We may be unable to fully recover costs on contracts that limit our ability to increase prices. In addition, we provide many of our services under contracts of indefinite term, which are subject to termination on short notice by either party without cause. Some of our profit and loss contracts contain minimum guaranteed remittances to our client regardless of our sales or profit at the facility involved. If sales do not exceed costs under a contract that contains minimum guaranteed commissions, we will bear any losses which are incurred, as well as the guaranteed commission. Generally, our contracts also limit our ability to raise prices on the food, beverages and merchandise we sell within a particular facility without the client’s consent. In addition, some of our contracts exclude certain events or products from the scope of the contract, or give the client the right to modify the terms under which we may operate at certain events. The payment of guaranteed commissions to a client under a profit and loss contract that is not profitable, the refusal by individual clients to permit the sale of some products at their venues, the imposition by clients of limits on prices which are not economically feasible for us, or decisions by clients to curtail their use of the services we provide could adversely affect our sales and results of operations. For example, during the recent economic downturn, certain of our business and industry clients curtailed their employees’ use of catering, which had a negative effect on our sales and profits.
Our inability to achieve cost savings through our cost reduction efforts could impact our results of operations.
The achievement of the goals we set in our plans and our future financial performance is dependent, in part, on our efforts to reduce our cost structure through various cost reduction initiatives. One of our recent initiatives is the establishment of a North American business services center that will bring together certain back office operations that are currently dispersed in many areas. Successful execution of our cost reduction initiatives is not assured and there are several obstacles to success, including our ability to enable the information technology and business process required for these efforts, as well as the timing of the transition to our business services center. In addition, there can be no assurance that our efforts, if properly executed, will result in our desired outcome of improved financial performance.
18
Table of Contents
Our expansion strategy involves risks.
We may seek to acquire companies or interests in companies or enter into joint ventures that complement our business, and our inability to complete acquisitions, integrate acquired companies successfully or enter into joint ventures may render us less competitive. We may be evaluating acquisitions or engaging in acquisition negotiations at any given time. We cannot be sure that we will be able to continue to identify acquisition candidates or joint venture partners on commercially reasonable terms or at all. If we make acquisitions, we also cannot be sure that any benefits anticipated from the acquisitions will actually be realized. Likewise, we cannot be sure that we will be able to obtain necessary financing for acquisitions. Such financing could be restricted by the terms of our debt agreements or it could be more expensive than our current debt. The amount of such debt financing for acquisitions could be significant and the terms of such debt instruments could be more restrictive than our current covenants. In addition, our ability to control the planning and operations of our joint ventures and other less than majority-owned affiliates may be subject to numerous restrictions imposed by the joint venture agreements and majority stockholders. Our joint venture partners may also have interests which differ from ours.
The process of integrating acquired operations into our existing operations may result in operating, contract and supply chain difficulties, such as the failure to retain clients or management personnel and problems coordinating technology and supply chain arrangements. Also, in connection with any acquisition, we could fail to discover liabilities of the acquired company for which we may be responsible as a successor owner or operator in spite of any investigation we make prior to the acquisition. In addition, labor laws in certain countries may require us to retain more employees than would otherwise be optimal from entities we acquire. Such difficulties may divert significant financial, operational and managerial resources from our existing operations, and make it more difficult to achieve our operating and strategic objectives. The diversion of management attention, particularly in a difficult operating environment, may affect our sales. Similarly, our business depends on effective information technology systems and implementation delays or poor execution of the integration of different information technology systems could disrupt our operations and increase costs. Possible future acquisitions could result in the incurrence of additional debt and related interest expense or contingent liabilities and amortization expenses related to intangible assets, which could have a material adverse effect on our financial condition, operating results and/or cash flow. In addition, goodwill resulting from business combinations represents a significant portion of our assets. If the goodwill were deemed to be impaired, we would need to take a charge to earnings to write down the goodwill to its fair value.
A failure to maintain food safety throughout our supply chain and food-borne illness concerns may result in reputational harm and claims of illness or injury that could adversely affect us.
Food safety is a top priority for us and we dedicate substantial resources to ensuring that our consumers enjoy safe, quality food products. Claims of illness or injury relating to food quality or food handling are common in the food service industry, and a number of these claims may exist at any given time. Because food safety issues could be experienced at the source or by food suppliers or distributors, food safety could, in part, be out of our control. Regardless of the source or cause, any report of food-borne illness or other food safety issues such as food tampering or contamination at one of our locations could adversely impact our reputation, hindering our ability to renew contracts on favorable terms or to obtain new business, and have a negative impact on our sales. Even instances of food-borne illness, food tampering or contamination at a location served by one of our competitors could result in negative publicity regarding the food service industry generally and could negatively impact our sales. Future food product recalls and health concerns associated with food contamination may also increase our raw materials costs and, from time to time, disrupt our business.
Governmental regulations relating to food and beverages may subject us to significant liability.
The regulations relating to each of our food and support services segments are numerous and complex. A variety of regulations at various governmental levels relating to the handling, preparation and serving of food (including, in some cases, requirements relating to the temperature of food), and the cleanliness of food
19
Table of Contents
production facilities and the hygiene of food-handling personnel are enforced primarily at the local public health department level. We cannot assure you that we are in full compliance with all applicable laws and regulations at all times or that we will be able to comply with any future laws and regulations. Furthermore, legislation and regulatory attention to food safety is very high. Additional or amended regulations in this area may significantly increase the cost of compliance or expose us to liabilities.
We serve alcoholic beverages at many facilities, and must comply with applicable licensing laws, as well as state and local service laws, commonly called dram shop statutes. Dram shop statutes generally prohibit serving alcoholic beverages to certain persons such as an individual who is intoxicated or a minor. If we violate dram shop laws, we may be liable to the patron and/or third parties for the acts of the patron. Although we sponsor regular training programs designed to minimize the likelihood of such a situation, we cannot guarantee that intoxicated or minor patrons will not be served or that liability for their acts will not be imposed on us. There can be no assurance that additional regulation in this area would not limit our activities in the future or significantly increase the cost of regulatory compliance. We must also obtain and comply with the terms of licenses in order to sell alcoholic beverages in the states in which we serve alcoholic beverages. Some of our contracts require us to pay liquidated damages during any period in which our liquor license for the facility is suspended, and most contracts are subject to termination if we lose our liquor license for the facility.
If we fail to comply with requirements imposed by applicable law or other governmental regulations, we could become subject to lawsuits, investigations and other liabilities and restrictions on our operations that could significantly and adversely affect our business.
We are subject to governmental regulation at the federal, state, international, national, provincial and local levels in many areas of our business, such as employment laws, wage and hour laws, discrimination laws, immigration laws, human health and safety laws, import and export controls and customs laws, environmental laws, false claims or whistleblower statutes, minority, women and disadvantaged business enterprise statutes, tax codes, antitrust and competition laws, consumer protection statutes, public procurement regulations, intellectual property laws, food safety and sanitation laws, cost and accounting principles, the Foreign Corrupt Practices Act, the U.K. Bribery Act, other anti-corruption laws, lobbying laws, motor carrier safety laws, data privacy laws and alcohol licensing and service laws.
From time to time, both federal and state governmental agencies have conducted reviews of our billing practices as part of investigations or audits of providers of services under governmental contracts, or otherwise. We also receive requests for information from governmental agencies in connection with these reviews. While we attempt to comply with all applicable laws and regulations, we cannot assure you that we are in full compliance with all applicable laws and regulations or interpretations of these laws and regulations at all times or that we will be able to comply with any future laws, regulations or interpretations of these laws and regulations.
If we fail to comply with applicable laws and regulations, including those referred to above, we may be subject to investigations, criminal sanctions or civil remedies, including fines, penalties, damages, reimbursement, injunctions, seizures or debarments from government contracts or the loss of liquor licenses. The cost of compliance or the consequences of non-compliance, including debarments, could have a material adverse effect on our business and results of operations. In addition, governmental units may make changes in the regulatory frameworks within which we operate that may require either the corporation as a whole or individual businesses to incur substantial increases in costs in order to comply with such laws and regulations.
Changes in, new interpretations of or changes in the enforcement of the governmental regulatory framework may affect our contracts and contract terms and may reduce our sales or profits.
A portion of our sales, estimated to be approximately 11.7% in fiscal 2012, is derived from business with U.S. federal, state and local governments and agencies. Changes or new interpretations in, or changes in the
20
Table of Contents
enforcement of, the statutory or regulatory framework applicable to services provided under governmental contracts or bidding procedures, particularly by our food and support services businesses, could result in fewer new contracts or contract renewals, modifications to the methods we apply to price government contracts, or in contract terms of shorter duration than we have historically experienced. Any of these changes could result in lower sales or profits than we have historically achieved, which could have an adverse effect on our results of operations.
Environmental regulations may subject us to significant liability and limit our ability to grow.
We are subject to various environmental protection laws and regulations, including the U.S. federal Clean Water Act, Clean Air Act, Resource Conservation and Recovery Act, Comprehensive Environmental Response, Compensation, and Liability Act and similar state statutes and regulations governing the use, management, and disposal of chemicals and hazardous materials. In particular, industrial laundries in our uniform rental business use certain detergents and cleaning chemicals to launder garments and other merchandise. The residues from such detergents and chemicals and residues from soiled garments and other merchandise laundered at our facilities may result in potential discharges to air and to water (through sanitary sewer systems and publicly owned treatment works) and may be contained in waste generated by our wastewater treatment systems.
Our industrial laundries are subject to certain volume and chemical air and water pollution discharge limits, monitoring, permitting and recordkeeping requirements.
We own or operate aboveground and underground storage tank systems at some locations to store petroleum products for use in our or our clients’ operations. Certain of these storage tank systems also are subject to performance standards, periodic monitoring, and recordkeeping requirements. We also may use and manage chemicals and hazardous materials in our operations from time to time. In the course of our business, we may be subject to penalties and fines for non-compliance with environmental protection laws and regulations and we may settle, or contribute to the settlement of, actions or claims relating to the management of underground storage tanks and the handling and disposal of chemicals or hazardous materials. We may, in the future, be required to expend material amounts to rectify the consequences of any such events.
In addition, changes to environmental laws may subject us to additional costs or cause us to change aspects of our business. Under U.S. federal and state environmental protection laws, as an owner or operator of real estate we may be liable for the costs of removal or remediation of certain hazardous materials located on or in or emanating from our owned or leased property or our client’s properties, as well as related costs of investigation and property damage, without regard to our fault, knowledge, or responsibility for the presence of such hazardous materials. There can be no assurance that locations that we own, lease or otherwise operate, either for ourselves or for our clients, or that we may acquire in the future, have been operated in compliance with environmental laws and regulations or that future uses or conditions will not result in the imposition of liability upon us under such laws or expose us to third-party actions such as tort suits. In addition, such regulations may limit our ability to identify suitable sites for new or expanded facilities. In connection with our present or past operations and the present or past operations of our predecessors or companies that we have acquired, hazardous substances may migrate from properties on which we operate or which were operated by our predecessors or companies we acquired to other properties. We may be subject to significant liabilities to the extent that human health is adversely affected or the value of such properties is diminished by such migration.
Our international business faces risks different from those we face in the United States that could have an effect on our results of operations and financial condition.
A significant portion of our sales is derived from international business. During fiscal 2012, approximately 20% of our sales were generated outside of North America. We currently have a presence in 19 countries outside of North America with approximately 82,000 personnel. Our international operations are subject to risks that are different from those we face in the United States, including the requirement to comply with changing and
21
Table of Contents
conflicting national and local regulatory requirements; Foreign Corrupt Practices Act, U.K. Bribery Act and other anti-corruption law compliance matters; potential difficulties in staffing and labor disputes; differing local labor laws; managing and obtaining support and distribution for local operations; credit risk or financial condition of local clients; potential imposition of restrictions on investments; potentially adverse tax consequences, including imposition or increase of withholding, VAT and other taxes on remittances and other payments by subsidiaries; foreign exchange controls; and local political and social conditions. In addition, the operating results of our non-U.S. subsidiaries are translated into U.S. dollars and those results are affected by movements in foreign currencies relative to the U.S. dollar.
We intend to continue to develop our business in emerging countries over the long term. Emerging international operations present several additional risks, including greater fluctuation in currencies relative to the U.S. dollar; economic and governmental instability; civil disturbances; volatility in gross domestic production; and nationalization and expropriation of private assets.
There can be no assurance that the foregoing factors will not have a material adverse effect on our international operations or on our consolidated financial condition and results of operations.
Continued or further unionization of our workforce may increase our costs and work stoppages could damage our business.
Approximately 40,000 employees in our U.S. operations are represented by unions and covered by collective bargaining agreements. The continued or further unionization of a significantly greater portion of our workforce could increase our overall costs at the affected locations and adversely affect our flexibility to run our business in the most efficient manner to remain competitive or acquire new business. In addition, any significant increase in the number of work stoppages at our various operations could adversely affect our business, financial condition or results of operations.
We may incur significant liability as a result of our participation in multiemployer defined benefit pension plans.
We operate at a number of locations under collective bargaining agreements. Under some of these agreements, we are obligated to participate in and contribute to multiemployer defined benefit pension plans. As a contributing employer to such plans, should ARAMARK withdraw, either totally or trigger a “partial withdrawal,” we would be subject to withdrawal liability (or partial withdrawal liability) for our proportionate share of any unfunded vested benefits. In addition, if a multiemployer defined benefit pension plan fails to satisfy the minimum funding standards, we could be liable to increase our contributions to meet minimum funding standards. Also, if a participating employer withdraws from the plan or experiences financial difficulty, including bankruptcy, our obligation could increase. The financial status of certain of the plans in which ARAMARK participates has deteriorated in the recent past and continues to deteriorate. In addition, any increased funding obligations for underfunded multiemployer defined benefit pension plans could have a financial impact on us.
Risks associated with the suppliers from whom our products are sourced could adversely affect our results of operations.
The raw materials we use in our business and the finished products we sell are sourced from a wide variety of domestic and international suppliers. We seek to require our suppliers to comply with applicable laws and otherwise be certified as meeting our supplier standards of conduct. Our ability to find qualified suppliers who meet our standards, and to access raw materials and finished products in a timely and efficient manner is a challenge, especially with respect to suppliers located and goods sourced outside the United States. In addition, insolvency experienced by suppliers could make it difficult for us to source the items we need to run our business. Political and economic stability in the countries in which foreign suppliers are located, the financial stability of suppliers, suppliers’ failure to meet our supplier standards, labor problems experienced by our
22
Table of Contents
suppliers, the availability of raw materials to suppliers, currency exchange rates, transport availability and cost, inflation and other factors relating to the suppliers and the countries in which they are located are beyond our control. In addition, United States foreign trade policies, tariffs and other impositions on imported goods, trade sanctions imposed on certain countries, the limitation on the importation of certain types of goods or of goods containing certain materials from other countries and other factors relating to foreign trade are beyond our control. In addition, if one of our suppliers were to violate the law, our reputation may be harmed simply due to our association with that supplier. These and other factors affecting our suppliers and our access to raw materials and finished products could adversely affect our results of operations.
In fiscal 2012, one distributor distributed approximately 60% of our food and non-food products in the United States and Canada, and if our relationship or their business were to be disrupted, we could experience disruptions to our operations and cost structure.
Although we negotiate the pricing and other terms for the majority of our purchases of food and related products in the U.S. and Canada directly with national manufacturers, we purchase these products and other items through SYSCO Corporation and other distributors. SYSCO, the main U.S. and Canadian distributor of our food and non-food products, and other distributors are responsible for tracking our orders and delivering products to our specific locations. If our relationship with, or the business of, SYSCO were to be disrupted, we would have to arrange alternative distributors and our operations and cost structure could be adversely affected in the short term. Similarly, a sudden termination of the relationship with a significant provider in other geographic areas could in the short term adversely affect our ability to provide services and disrupt our client relationships in such areas.
Our business may suffer if we are unable to hire and retain sufficient qualified personnel or if labor costs increase.
From time to time, we have had difficulty in hiring and retaining qualified management personnel, particularly at the entry management level. We will continue to have significant requirements to hire such personnel. In the past, at times when the United States or other geographic regions have periodically experienced reduced levels of unemployment, there has been a shortage of qualified workers at all levels. Given that our workforce requires large numbers of entry level and skilled workers and managers, low levels of unemployment when such conditions exist or mismatches between the labor markets and our skill requirements can compromise our ability in certain areas of our businesses to continue to provide quality service or compete for new business. We also regularly hire a large number of part-time and seasonal workers, particularly in our food and support services segments. Any difficulty we may encounter in hiring such workers could result in significant increases in labor costs, which could have a material adverse effect on our business, financial condition and results of operations. Competition for labor has at times resulted in wage increases in the past and future competition could substantially increase our labor costs. Due to the labor intensive nature of our businesses and the fact that 73% of our food and support services segments’ sales are from profit and loss contracts under which we have limited ability to pass along cost increases, a shortage of labor or increases in wage levels in excess of normal levels could have a material adverse effect on our results of operations.
Healthcare reform legislation could have an impact on our business.
During 2010, the Patient Protection and Affordable Care Act and the Health Care and Education Reconciliation Act of 2010 were signed into law in the United States. Certain of the provisions that have increased our healthcare costs include the removal of annual plan limits and the mandate that health plans provide 100% coverage on expanded preventative care. In addition, our healthcare costs could increase as the new legislation and accompanying regulations require us to apply new eligibility rules, which could potentially cover more variable hour employees than we do currently or pay penalty amounts in the event that employees do not elect our offered coverage. While much of the cost of the recent healthcare legislation enacted will occur after 2014 due to provisions of the legislation being delayed and phased in over time, changes to our healthcare cost structure could have an impact on our business and operating costs.
23
Table of Contents
Our business is contract intensive and may lead to client disputes.
Our business is contract intensive and we are parties to many contracts with clients all over the world. Our client interest contracts provide that client billings, and for some contracts the sharing of profits and losses, are based on our determinations of costs of service. Contract terms under which we base these determinations and, for certain government contracts, regulations governing our cost determinations, may be subject to differing interpretations which could result in disputes with our clients from time to time. Clients generally have the right to audit our contracts, and we periodically review our compliance with contract terms and provisions. If clients were to dispute our contract determinations, the resolution of such disputes in a manner adverse to our interests could negatively affect sales and operating results. While we do not believe any reviews, audits or other such matters should result in material adjustments, if a large number of our client arrangements were modified in response to any such matter, the effect could be materially adverse to our business or results of operations.
Our operations are seasonal and quarter to quarter comparisons may not be a good indicator of our performance.
In our first and second fiscal quarters, within the FSS North America segment, there historically has been a lower level of sales at the sports, entertainment and recreational clients, which is partly offset by increased activity in educational operations. In our third and fourth fiscal quarters, there historically has been a significant increase in sales at the sports, entertainment and recreational clients, which is partially offset by the effect of summer recess in educational operations. For these reasons, a quarter to quarter comparison is not a good indication of our performance or how we will perform in the future.
Risks Related to Our Indebtedness
Our leverage could adversely affect our ability to raise additional capital to fund our operations, limit our ability to react to changes in the economy or our industries, expose us to interest rate risk to the extent of our variable rate debt and prevent us from meeting our obligations.
We are highly leveraged. As of June 28, 2013, our outstanding indebtedness was $6,217.1 million, including amounts outstanding under our credit facilities, senior notes and receivables facility. We also had additional availability of approximately $447.0 million under our revolving credit facility at that date.
This degree of leverage could have important consequences, including:
| • | exposing us to the risk of increased interest rates as certain of our borrowings, including borrowings under our senior secured credit facilities and our receivables facility, are at variable rates of interest; |
| • | making it more difficult for us to make payments on our indebtedness; |
| • | increasing our vulnerability to general economic and industry conditions; |
| • | requiring a substantial portion of cash flow from operations to be dedicated to the payment of principal and interest on our indebtedness, thereby reducing our ability to use our cash flow to fund our operations, capital expenditures and future business opportunities; |
| • | restricting us from making strategic acquisitions or causing us to make non-strategic divestitures; |
| • | limiting our ability to obtain additional financing for working capital, capital expenditures, debt service requirements, acquisitions and general corporate or other purposes; and |
| • | limiting our ability to adjust to changing market conditions and placing us at a competitive disadvantage compared to our competitors who are less highly leveraged. |
We and our subsidiaries may be able to incur substantial additional indebtedness in the future, subject to the restrictions contained in our senior secured credit facilities and the indenture governing our senior notes. If new indebtedness is added to our current debt levels, the related risks that we now face could increase.
24
Table of Contents
If our financial performance were to deteriorate, we may not be able to generate sufficient cash to service all of our indebtedness and may be forced to take other actions to satisfy our obligations under our indebtedness, which may not be successful.
Our ability to make scheduled payments on or to refinance our debt obligations depends on our financial condition and operating performance, which is subject to prevailing economic and competitive conditions and to certain financial, business and other factors beyond our control. While we believe that we currently have adequate cash flows to service our indebtedness, if our financial performance were to deteriorate significantly, we might be unable to maintain a level of cash flows from operating activities sufficient to permit us to pay the principal, premium, if any, and interest on our indebtedness.
If, due to such a deterioration in our financial performance, our cash flows and capital resources were to be insufficient to fund our debt service obligations, we may be forced to reduce or delay investments and capital expenditures, or to sell assets, seek additional capital or restructure or refinance our indebtedness. These alternative measures may not be successful and may not permit us to meet our scheduled debt service obligations. In addition, if we were required to raise additional capital in the current financial markets, the terms of such financing, if available, could result in higher costs and greater restrictions on our business. In addition, although a significant amount of our long-term borrowings do not mature until 2016 and later, if we were to need to refinance our existing indebtedness, the conditions in the financial markets at that time could make it difficult to refinance our existing indebtedness on acceptable terms or at all. If such alternative measures proved unsuccessful, we could face substantial liquidity problems and might be required to dispose of material assets or operations to meet our debt service and other obligations. Our senior secured credit agreement and the indenture governing our senior notes restrict our ability to dispose of assets and use the proceeds from any disposition of assets and to refinance our indebtedness. We may not be able to consummate those dispositions or to obtain the proceeds that we could realize from them and these proceeds may not be adequate to meet any debt service obligations then due.
Our debt agreements contain restrictions that limit our flexibility in operating our business.
Our senior secured credit agreement and the indenture governing our senior notes contain various covenants that limit our ability to engage in specified types of transactions. These covenants limit our and our restricted subsidiaries’ ability to, among other things:
| • | incur additional indebtedness, refinance or restructure indebtedness or issue certain preferred shares; |
| • | pay dividends on, repurchase or make distributions in respect of our capital stock, make unscheduled payments on our notes, repurchase or redeem our notes or make other restricted payments; |
| • | make certain investments; |
| • | sell certain assets; |
| • | create liens; |
| • | consolidate, merge, sell or otherwise dispose of all or substantially all of our assets; and |
| • | enter into certain transactions with our affiliates. |
In addition, our senior secured revolving credit facility requires us to satisfy and maintain specified financial ratios and other financial condition tests. Our ability to meet those financial ratios and tests can be affected by events beyond our control, and in the event of a significant deterioration of our financial performance, we cannot assure you that we will satisfy those ratios and tests. A breach of any of these covenants could result in a default under the senior secured credit agreement. Upon our failure to maintain compliance with these covenants that is not waived by the lenders under the revolving credit facility, the lenders under the senior secured credit facilities could elect to declare all amounts outstanding under the senior secured credit facilities to be immediately due and payable and terminate all commitments to extend further credit under such facilities. If we were unable to repay
25
Table of Contents
those amounts, the lenders under the senior secured credit facilities could proceed against the collateral granted to them to secure that indebtedness. We have pledged a significant portion of our assets as collateral under the senior secured credit agreement. If the lenders under the senior secured credit facilities accelerate the repayment of borrowings, we cannot assure you that we will have sufficient assets to repay those borrowings, as well as our unsecured indebtedness. If our senior secured indebtedness was accelerated by the lenders as a result of a default, our senior notes may become due and payable as well. Any such acceleration may also constitute an amortization event under our receivables facility, which could result in the amount outstanding under that facility becoming due and payable.
Risks Related to this Offering and Ownership of Our Common Stock
There is no existing market for our common stock and an active, liquid trading market may not develop.
Prior to this offering, there has not been a public market for our common stock. We cannot predict the extent to which investor interest in our company will lead to the development of a trading market on the New York Stock Exchange, or NYSE, or otherwise or how active and liquid that market may become. If an active and liquid trading market does not develop, you may have difficulty selling any of our common stock that you purchase. The initial public offering price for the shares of our common stock will be determined by negotiations between us, the selling stockholders and the underwriters and may not be indicative of prices that will prevail in the open market following this offering. The market price of our common stock may decline below the initial offering price, and you may not be able to sell your shares of our common stock at or above the price you paid in this offering, or at all.
You will incur immediate and substantial dilution in the net tangible book value of the shares you purchase in this offering.
Prior investors have paid substantially less per share of our common stock than the price in this offering. The initial public offering price of our common stock is substantially higher than the net tangible book value per share outstanding prior to completion of the offering. Based on our net tangible book deficit as of June 28, 2013 and upon the issuance and sale of shares of common stock by us at an assumed initial public offering price of $ per share (the midpoint of the initial public offering price range indicated on the cover of this prospectus), if you purchase our common stock in this offering, you will pay more for your shares than the amounts paid by our existing stockholders for their shares and you will suffer immediate dilution of approximately $ per share in net tangible book value. We also have a large number of outstanding stock options to purchase shares of common stock with exercise prices that are below the estimated initial offering price of shares of our common stock. To the extent that these options are exercised, you will experience further dilution.
Our share price may change significantly following the offering, and you could lose all or part of your investment as a result.
The trading price of our common stock is likely to be highly volatile and could fluctuate due to a number of factors such as those listed in “—Risks Related to Our Business” and the following, some of which are beyond our control:
| • | quarterly variations in our results of operations; |
| • | results of operations that vary from the expectations of securities analysts and investors; |
| • | results of operations that vary from those of our competitors; |
| • | changes in expectations as to our future financial performance, including financial estimates by securities analysts and investors; |
| • | announcements by us, our competitors or our vendors of significant contracts, acquisitions, joint marketing relationships, joint ventures or capital commitments; |
26
Table of Contents
| • | announcements by third parties of significant claims or proceedings against us; |
| • | future sales of our common stock; |
| • | general domestic and international economic conditions; and |
| • | unexpected and sudden changes in senior management. |
Furthermore, the stock market has experienced extreme volatility that, in some cases, has been unrelated or disproportionate to the operating performance of particular companies. These broad market and industry fluctuations may adversely affect the market price of our common stock, regardless of our actual operating performance.
In the past, following periods of market volatility, stockholders have instituted securities class action litigation. If we were involved in securities litigation, it could have a substantial cost and divert resources and the attention of executive management from our business regardless of the outcome of such litigation.
Certain stockholders’ shares are restricted from immediate resale but may be sold into the market in the near future. This could cause the market price of our common stock to drop significantly.
After the completion of this offering, we will have million shares of common stock outstanding ( million shares of common stock if the underwriters exercise their option to purchase additional shares in full). This number includes million shares of common stock that are being sold in this offering, which may be resold immediately in the public market.
We and the selling stockholders, our directors and executive officers and certain of our principal stockholders have agreed not to offer or sell, dispose of or hedge, directly or indirectly, any of our common stock without the permission of for a period of 180 days from the date of this prospectus, subject to certain exceptions and automatic extensions in certain circumstances. See “Shares Eligible for Future Sale.” In addition, pursuant to our Registration Rights Agreement, stockholders who hold more than 20% of our then-outstanding shares, or Joseph Neubauer, have the right to require us to file a registration statement with the SEC for the resale of our common stock at any time after the consummation of an initial public offering. These shares may also be sold pursuant to Rule 144 under the Securities Act of 1933, as amended, which we refer to as the Securities Act, depending on their holding period and subject to restrictions in the case of shares held by persons deemed to be our affiliates. As restrictions on resale end or if these stockholders exercise their registration rights, the market price of our common stock could decline if the holders of restricted shares sell them or are perceived by the market as intending to sell them. See “Certain Relationships and Related Party Transactions.”
We also have outstanding options to purchase our common stock with exercise prices that are below the estimated initial offering price of our common stock. To the extent that these options are exercised, you will experience further dilution. We also intend to file a registration statement on Form S-8 under the Securities Act covering all of the common stock subject to outstanding equity awards, as well as options and shares reserved for future issuance, under our stock incentive plans. Once we register these shares, they can be freely sold in the public market upon issuance and vesting, subject to the lock-up agreements described in the “Underwriting” section of this prospectus and contained in the terms of such plans, or unless they are held by “affiliates,” as that term is defined in Rule 144 of the Securities Act. Sales of a substantial number of shares of these shares could cause the market price of our common stock to decline.
The availability of shares for sale in the future could reduce the market price of our common stock.
In the future, we may issue securities to raise cash for acquisitions or otherwise. We may also acquire interests in other companies by using a combination of cash and common stock or just common stock. We may also issue securities convertible into our common stock. Any of these events may dilute your ownership interest in our company and have an adverse impact on the price of our common stock.
27
Table of Contents
In addition, sales of a substantial amount of our common stock in the public market, or the perception that these sales may occur, could reduce the market price of our common stock. This could also impair our ability to raise additional capital through the sale of our securities.
We cannot assure you that we will pay dividends on our common stock, and our indebtedness could limit our ability to pay dividends on our common stock.
Following completion of this offering, we intend to commence the payment of cash dividends on our common stock, subject to our compliance with applicable law, and depending on, among other things, our results of operations, financial condition, level of indebtedness, capital requirements, contractual restrictions, business prospects and other factors that our board of directors may deem relevant. Our senior secured credit facilities and the indenture governing our senior notes contain, and the terms of any future indebtedness we or our subsidiaries incur may contain, limitations on our ability to pay dividends. For more information, see “Dividend Policy.” There can be no assurance that we will pay a dividend in the future or continue to pay any dividend if we do commence paying dividends.
Our Controlling Owners can significantly influence our business and affairs and may have conflicts of interest with us in the future.
Following the completion of this offering, investment funds associated with or designated by GS Capital Partners, CCMP Capital Advisors, J.P. Morgan Partners, Thomas H. Lee Partners and Warburg Pincus, which we refer to as the Sponsors, and Joseph Neubauer, who, together with the Sponsors, we refer to as the Controlling Owners, will collectively own approximately % of our common stock (or % if the underwriters exercise their option to purchase additional shares in full). As a result, the Controlling Owners have the ability to prevent any transaction that requires the approval of stockholders, including the election of directors, mergers and takeover offers, regardless of whether others believe that approval of those matters is in our best interests. In addition, the Sponsors are in the business of making investments in companies and may from time to time acquire and hold interests in businesses that compete directly or indirectly with us. One or more of the Sponsors may also pursue acquisition opportunities that may be complementary to our business and, as a result, those acquisition opportunities may not be available to us. So long as the Controlling Owners, or funds controlled by or associated with the Sponsors, continue to own a significant amount of the outstanding shares of our common stock, even if such amount is less than 50%, the Controlling Owners will continue to be able to strongly influence us.
Anti-takeover provisions in our organizational documents could delay or prevent a change of control.
Certain provisions of our amended and restated certificate of incorporation and amended and restated bylaws may have an anti-takeover effect and may delay, defer or prevent a merger, acquisition, tender offer, takeover attempt or other change of control transaction that a stockholder might consider in its best interest, including those attempts that might result in a premium over the market price for the shares held by our stockholders.
These provisions provide for, among other things:
| • | the ability of our board of directors to issue one or more series of preferred stock; |
| • | advance notice for nominations of directors by stockholders and for stockholders to include matters to be considered at our annual meetings; |
| • | certain limitations on convening special stockholder meetings; |
| • | the removal of directors only upon the affirmative vote of the holders of at least 75% in voting power of all the then-outstanding common stock of the company entitled to vote thereon, voting together as a single class, if the Controlling Owners and their affiliates beneficially own, in the aggregate, less than a majority in voting power of the common stock of the Company entitled to vote generally in the election of directors; and |
28
Table of Contents
| • | that certain provisions may be amended only by the affirmative vote of the holders of at least 75% in voting power of all the then-outstanding common stock of the company entitled to vote thereon, voting together as a single class, if the Controlling Owners and their affiliates beneficially own, in the aggregate, less than 50% in voting power of the common stock of the Company entitled to vote generally in the election of directors. |
These anti-takeover provisions could make it more difficult for a third-party to acquire us, even if the third-party’s offer may be considered beneficial by many of our stockholders. As a result, our stockholders may be limited in their ability to obtain a premium for their shares. See “Description of Capital Stock.”
We are a “controlled company” within the meaning of the New York Stock Exchange rules and, as a result, will qualify for, and intend to rely on, exemptions from certain corporate governance requirements. You will not have the same protections afforded to stockholders of companies that are subject to such requirements.
After completion of this offering, certain stockholders will continue to beneficially own a majority of the voting power of all outstanding shares of our common stock. Under New York Stock Exchange corporate governance standards, a company of which more than 50% of the voting power is held by an individual, group or another company is a “controlled company” and may elect not to comply with certain corporate governance requirements, including:
| • | the requirement that a majority of the board of directors consist of “independent directors” as defined under the rules of the NYSE; |
| • | the requirement that we have a nominating/corporate governance committee that is composed entirely of independent directors with a written charter addressing the committee’s purpose and responsibilities; |
| • | the requirement that we have a compensation committee that is composed entirely of independent directors with a written charter addressing the committee’s purpose and responsibilities; and |
| • | the requirement for an annual performance evaluation of the nominating/corporate governance and compensation committees. |
Following this offering, we intend to utilize these exemptions. As a result, we may not have a majority of independent directors, our nominating and corporate governance committee and compensation committee may not consist entirely of independent directors and such committees may not be subject to annual performance evaluations. Accordingly, you will not have the same protections afforded to stockholders of companies that are subject to all of the corporate governance requirements of the New York Stock Exchange.
We will incur increased costs and our management will face increased demands as a result of operating as a listed company.
As a listed company, we will incur significant legal, accounting and other expenses that we did not incur as a private company. In addition, our administrative staff will be required to perform additional tasks. For example, in anticipation of becoming a listed company, we will need to adopt additional internal controls and disclosure controls and procedures and bear all of the internal and external costs of preparing and distributing periodic public reports in compliance with our obligations under applicable securities laws.
In addition, changing laws, regulations and standards relating to corporate governance and public disclosure, including the Sarbanes-Oxley Act, the Dodd-Frank Act and related regulations implemented by the Securities and Exchange Commission, or the SEC, and the stock exchanges are creating uncertainty for public companies, increasing legal and financial compliance costs and making some activities more time-consuming. We are currently evaluating and monitoring developments with respect to new and proposed rules and cannot predict or estimate the amount of additional costs we may incur or the timing of such costs. These laws, regulations and standards are subject to varying interpretations, in many cases due to their lack of specificity, and, as a result,
29
Table of Contents
their application in practice may evolve over time as new guidance is provided by regulatory and governing bodies. This could result in continuing uncertainty regarding compliance matters and higher costs necessitated by ongoing revisions to disclosure and governance practices.
We intend to invest resources to comply with evolving laws, regulations and standards, and this investment may result in increased general and administrative expenses and a diversion of management’s time and attention from revenue-generating activities to compliance activities. If our efforts to comply with new laws, regulations and standards differ from the activities intended by regulatory or governing bodies due to ambiguities related to practice, regulatory authorities may initiate legal proceedings against us and our business may be harmed. We also expect that being a listed company and these new rules and regulations will make it more expensive for us to obtain director and officer liability insurance, and we may be required to accept reduced coverage or incur substantially higher costs to obtain coverage. These factors could also make it more difficult for us to attract and retain qualified members of our board of directors, particularly to serve on our audit committee and compensation committee, and attract and retain qualified executive officers.
The increased costs associated with operating as a listed company may decrease our net income, and may cause us to reduce costs in other areas of our business or increase the prices of our products or services to offset the effect of such increased costs. Additionally, if these requirements divert our management’s attention from other business concerns, they could have a material adverse effect on our business, financial condition and results of operations.
If securities or industry research analysts do not publish or cease publishing research or reports about our business or if they issue unfavorable commentary or downgrade our common stock, our share price and trading volume could decline.
The trading market for our common stock will rely in part on the research and reports that securities and industry research analysts publish about us, our industry, our competitors and our business. We do not have any control over these analysts. Our share price and trading volumes could decline if one or more securities or industry analysts downgrade our common stock, issue unfavorable commentary about us, our industry or our business, cease to cover our company or fail to regularly publish reports about us, our industry or our business.
30
Table of Contents
We estimate that the net proceeds we will receive from the sale of shares of our common stock we are offering, after deducting underwriters’ discounts and commissions and estimated expenses payable by us, will be approximately $ million (or $ million if the underwriters exercise the option to purchase additional shares in full). This estimate assumes an initial public offering price of $ per share, the midpoint of the range set forth on the cover page of this prospectus. A $1.00 increase (decrease) in the assumed initial public offering price of $ per share would increase (decrease) the net proceeds to us from this offering by $ million, assuming the number of shares offered by us, as set forth on the cover page of this prospectus, remains the same and after deducting the estimated underwriting discounts and commissions and estimated expenses payable by us. A one million share increase (decrease) in the number of shares offered by us in this offering would increase (decrease) the net proceeds to us by approximately $ million, assuming an initial public offering price of $ per share, after deducting the estimated underwriting discounts and commissions and estimated expenses payable by us. We will not receive any proceeds from the sale of shares of our common stock by the selling stockholders.
We intend to use the net proceeds received by us from this offering to repay certain of our existing indebtedness, including a portion of the outstanding term loans due July 26, 2016 under our senior secured credit facilities. As of June 28, 2013, our senior secured credit facilities included term loan facilities consisting of $3,286.8 million of term loans maturing on July 26, 2016 and $1,400.0 million of term loans maturing on September 7, 2019, exclusive of the original issue discount. The term loans maturing in July 2016 have applicable margins of 3.50% for eurocurrency (LIBOR) term loan borrowings and 2.50% for base rate term loan borrowings. The term loans maturing in September 2019 have applicable margins of 3.00% for eurocurrency (LIBOR) term loan borrowings, subject to a LIBOR floor of 1.00%, and 2.00% for base-rate borrowings, subject to minimum base rate of 2.00%. See “Description of Certain Indebtedness.”
To the extent we raise more proceeds in this offering than currently estimated, we intend to use such proceeds to repay certain other of our existing indebtedness, as will be determined following completion of this offering, and for general corporate purposes.
Affiliates of certain of the underwriters are lenders under our senior secured credit agreement and, accordingly, may receive a portion of the net proceeds from this offering through repayment of such indebtedness. See “Underwriting—Conflicts of Interest.”
31
Table of Contents
Following completion of this offering, we intend to commence the payment of cash dividends on our common stock, subject to our compliance with applicable law, and depending on, among other things, our results of operations, financial condition, level of indebtedness, capital requirements, contractual restrictions, business prospects and other factors that our board of directors may deem relevant. In addition, our ability to pay dividends is limited by covenants in our senior secured credit facilities and the indenture governing our senior notes. Future agreements may also limit our ability to pay dividends. See “Description of Certain Indebtedness.”
On April 18, 2011, we declared a dividend to our stockholders of approximately $711 million. The dividend was funded with the net proceeds from the private offering of our 8.625% / 9.375% Senior Notes due 2016 and dividends from our subsidiaries. The 8.625% / 9.375% Senior Notes due 2016 were repurchased through a cash tender offer in March 2013. In addition, on October 29, 2012, we completed the spin-off of our majority interest in Seamless North America, LLC, an online and mobile food ordering service, to our stockholders in the form of a dividend. Each stockholder received one share of the common stock of Seamless Holdings, a newly formed company created to hold our former interest in Seamless North America, LLC, for each share of our common stock held as of the record date. See “Management’s Discussion and Analysis of Financial Condition and Results of Operations,” our audited consolidated financial statements and related notes and our unaudited condensed consolidated financial statements and related notes included elsewhere in this prospectus.
32
Table of Contents
The following table sets forth our cash and cash equivalents and capitalization as of June 28, 2013 (1) on a historical basis and (2) on an as adjusted basis to give effect to the issuance of approximately shares of our common stock offered by us hereby and the use of proceeds therefrom. The information in this table should be read in conjunction with “Management’s Discussion and Analysis of Financial Condition and Results of Operations,” “Use of Proceeds,” “Prospectus Summary—Summary Consolidated Financial Data,” the audited consolidated financial statements and related notes and the unaudited condensed consolidated financial statements and related notes appearing elsewhere in this prospectus.
| As of June 28, 2013 | ||||||||
| (in millions) |
Actual | As Adjusted | ||||||
| Cash and cash equivalents |
$ | 97.8 | $ | |||||
|
|
|
|
|
|||||
| Senior secured credit facilities: |
||||||||
| Revolving credit facility(1) |
$ | 142.0 | $ | |||||
| Term loan facility(2) |
4,678.7 | |||||||
| 5.75% senior notes due 2020 |
1,000.0 | |||||||
| Receivables facility |
300.0 | |||||||
| Capital leases |
54.3 | |||||||
| Other existing debt(3) |
42.1 | |||||||
|
|
|
|
|
|||||
| Total debt |
6,217.1 | |||||||
| Common stock subject to repurchase and other |
163.8 | |||||||
| Stockholders’ equity: |
||||||||
| Common stock, 600,000,000 shares authorized, actual; 218,751,738 shares issued and 201,364,511 shares outstanding, actual; shares authorized, as adjusted; and shares issued and outstanding, as adjusted |
2.2 | |||||||
| Capital surplus |
1,686.3 | |||||||
| Accumulated deficit |
(518.1 | ) | ||||||
| Accumulated other comprehensive loss |
(93.9 | ) | ||||||
| Treasury stock |
(247.2 | ) | ||||||
|
|
|
|
|
|||||
| Total stockholders’ equity |
829.3 | |||||||
|
|
|
|
|
|||||
| Total capitalization |
$ | 7,210.2 | $ | |||||
|
|
|
|
|
|||||
| (1) | Consists of a $555.0 million revolving credit facility available to the Company in U.S. dollars and a $50.0 million revolving credit facility available to the Company and a Canadian subsidiary in U.S. dollars and Canadian dollars. U.S. dollar borrowings under the revolving credit facilities have an applicable margin of 3.25% for eurocurrency (LIBOR) borrowings and 2.25% for base-rate borrowings and an unused commitment fee of 0.50% per annum. Canadian dollar borrowings have an applicable margin of 3.25% for BA (bankers’ acceptance) rate borrowings and 2.25% for base-rate borrowings and an unused commitment fee of 0.50% per annum. The final maturity date of the Canadian revolving loan commitments and $505.0 million of the $555.0 million U.S. revolving loan commitments is January 26, 2017, provided, however, that the maturity date accelerates to April 26, 2016 if any term loans, other than the term loans due on September 7, 2019 and any other term loans with a maturity at least 91 days after January 26, 2017, remain outstanding on April 26, 2016. The final maturity date of the remaining $50.0 million in revolving loan commitments is January 26, 2015. See “Description of Certain Indebtedness.” |
| (2) | As of June 28, 2013, term loans with an aggregate principal amount of $4,686.8 million (recorded at $4,678.7 million to reflect original issue discount) were outstanding. The maturity date for $3,285.4 million of term loans is July 26, 2016. The maturity date for the remaining $1,393.3 million of term loans is September 7, 2019. The senior secured credit agreement also includes a $200.0 million synthetic letter of credit facility. The maturity date of $159.3 million of deposits securing the synthetic letter of credit facility is July 26, 2016. The maturity date for $40.7 million of deposits securing the letter of credit facility is January 26, 2014. As of June 28, 2013, there were approximately $142.0 million of issued letters of credit under the synthetic letter of credit facility. See “Description of Certain Indebtedness.” |
| (3) | Consists of borrowings by our foreign subsidiaries. |
33
Table of Contents
If you invest in our common stock, your interest will be immediately diluted to the extent of the difference between the initial public offering price per share and the net tangible book value per share after this offering. Dilution results from the fact that the initial public offering price per share is substantially in excess of the net tangible book value per share attributable to the existing stockholders for our presently outstanding shares of common stock. We calculate net tangible book value per share by dividing the net tangible book value (total consolidated tangible assets less total consolidated liabilities) by the number of outstanding shares of common stock.
Our net tangible book value (deficit) as of June 28, 2013 was $(5,060,023), or $(0.03) per share, based on 201,364,511 shares of common stock outstanding.
Without taking into account any other changes in such net tangible book value after June 28, 2013, after giving effect to the sale by us of shares of common stock in this offering assuming an initial public offering price of $ per share, which is the mid-point of the estimated offering price range set forth on the cover page of this prospectus, less the underwriting discounts and commissions and the estimated offering expenses payable by us, our pro forma as adjusted net tangible book value at June 28, 2013 would have been $ , or $ per share. This represents an immediate increase in net tangible book value of $ per share to the existing stockholders and an immediate dilution in net tangible book value of $ per share, to investors purchasing shares of our common stock in this offering. The following table illustrates this per share dilution:
| Assumed initial public offering price per share |
$ | |||
| Net tangible book value (deficit) per share as of June 28, 2013 |
||||
| Pro forma net tangible book value per share after giving effect to this offering |
||||
| Amount of dilution in net tangible book value per share to new investors in this offering |
If the underwriters were to fully exercise the underwriters’ option to purchase additional shares of common stock from us, the pro forma net tangible book value per share after giving effect to the offering would be $ per share. This represents an increase in adjusted net tangible book value of $ per share to existing stockholders and dilution in pro forma net tangible book value of $ per share to new investors.
A $1.00 increase (decrease) in the assumed initial public offering price of $ per share would increase (decrease) our pro forma net tangible book value after giving to the offering by $ million, or by $ per share, assuming no change to the number of shares of common stock offered by us as set forth on the cover page of this prospectus, and after deducting the estimated underwriting discounts and estimated expenses payable by us. A 10% increase (decrease) in the number of shares of common stock offered by us would increase (decrease) our pro forma net tangible book value after giving to the offering by $ million, or by $ per share, after deducting the estimated underwriting discounts and estimated expenses payable by us.
The following table summarizes, on a pro forma basis as of June 28, 2013, the total number of shares of our common stock purchased from us, the total cash consideration paid to us by existing stockholders and by new investors purchasing shares of our common stock in this offering.
| Shares of Common
Stock Purchased |
Total Consideration | Average Price Per Share |
||||||||||||||||
| Number | Percent | Amount | Percent | |||||||||||||||
| Existing stockholders |
% | $ | % | $ | ||||||||||||||
| New investors |
% | $ | % | $ | ||||||||||||||
|
|
|
|
|
|
|
|
|
|
||||||||||
| Total |
% | $ | % | $ | ||||||||||||||
|
|
|
|
|
|
|
|
|
|
||||||||||
34
Table of Contents
If the underwriters were to fully exercise the underwriters’ option to purchase additional shares of common stock from us, the percentage of shares of our common stock held by existing stockholders would be %, and the percentage of shares of our common stock held by new investors would be %.
To the extent that we grant equity awards to our employees in the future under our stock incentive plans, and those equity awards vest and/or are exercised, as the case may be, or other issuances of shares of our common stock are made, there will be further dilution to new investors.
35
Table of Contents
SELECTED CONSOLIDATED FINANCIAL DATA
Set forth below is selected consolidated financial data of the Company, as of the dates and for the periods indicated. The selected consolidated financial data as of September 28, 2012 and September 30, 2011, and for the fiscal years 2012, 2011 and 2010 have been derived from our consolidated financial statements appearing elsewhere in this prospectus, which have been audited by KPMG LLP. The selected consolidated financial data as of October 1, 2010 have been derived from our consolidated financial statements that are not included in this prospectus, which have been audited by KPMG LLP. The selected consolidated financial data as of October 2, 2009 and October 3, 2008 and for the fiscal years 2009 and 2008 have been derived from our unaudited consolidated financial statements that are not included in this prospectus. Consolidated financial statements for our indirect wholly-owned subsidiary, ARAMARK Corporation, have been audited for such periods.
The selected consolidated financial data as of June 28, 2013, and for the nine months ended June 28, 2013 and June 29, 2012 have been derived from our unaudited condensed consolidated financial statements appearing elsewhere in this prospectus. The unaudited financial data presented have been prepared on a basis consistent with our audited consolidated financial statements. In the opinion of management, such unaudited financial data reflect all adjustments, consisting only of normal and recurring adjustments, necessary for a fair presentation of the results for those periods. The results of operations for the interim periods are not necessarily indicative of the results to be expected for the full year or any future period.
The selected consolidated financial data set forth below should be read in conjunction with, and are qualified by reference to, the section titled “Management’s Discussion and Analysis of Financial Condition and Results of Operations,” as well as with our consolidated financial statements and related notes and our unaudited condensed consolidated financial statements and related notes that are also included in this prospectus.
| Fiscal year(1) | Nine months ended | |||||||||||||||||||||||||||
| 2012 | 2011 | 2010 | 2009 | 2008 | June 28, 2013 |
June 29, 2012 |
||||||||||||||||||||||
| (dollars in millions, except per share data) | (unaudited) | (unaudited) | (unaudited) | (unaudited) | ||||||||||||||||||||||||
| Statement of operations data: |
||||||||||||||||||||||||||||
| Sales |
$ | 13,505 | $ | 13,082 | $ | 12,419 | $ | 12,138 | $ | 13,252 | $ | 10,430 | $ | 10,104 | ||||||||||||||
| Costs and expenses: |
||||||||||||||||||||||||||||
| Cost of services provided |
12,191 | 11,836 | 11,247 | 11,009 | 12,011 | 9,482 | 9,141 | |||||||||||||||||||||
| Depreciation and amortization |
529 | 511 | 503 | 497 | 506 | 405 | 396 | |||||||||||||||||||||
| Selling and general corporate expenses |
203 | 188 | 191 | 183 | 177 | 164 | 151 | |||||||||||||||||||||
|
|
|
|
|
|
|
|
|
|
|
|
|
|
|
|||||||||||||||
| Operating income |
582 | 547 | 478 | 449 | 558 | 379 | 416 | |||||||||||||||||||||
| Interest and other financing costs, net |
457 | 451 | 445 | 473 | 515 | 341 | 357 | |||||||||||||||||||||
|
|
|
|
|
|
|
|
|
|
|
|
|
|
|
|||||||||||||||
| Income (loss) from continuing operations before income taxes |
125 | 96 | 33 | (24 | ) | 43 | 38 | 59 | ||||||||||||||||||||
| Provision (benefit) for income taxes |
18 | (1 | ) | 1 | (24 | ) | 9 | 7 | 12 | |||||||||||||||||||
|
|
|
|
|
|
|
|
|
|
|
|
|
|
|
|||||||||||||||
| Income from continuing operations |
107 | 97 | 32 | — | 34 | 31 | 47 | |||||||||||||||||||||
|
|
|
|
|
|
|
|
|
|
|
|
|
|
|
|||||||||||||||
| Income (loss) from discontinued operations, net of tax(2) |
— | (12 | ) | (1 | ) | (7 | ) | 5 | — | — | ||||||||||||||||||
|
|
|
|
|
|
|
|
|
|
|
|
|
|
|
|||||||||||||||
| Net income (loss) |
107 | 85 | 31 | (7 | ) | 39 | 31 | 47 | ||||||||||||||||||||
|
|
|
|
|
|
|
|
|
|
|
|
|
|
|
|||||||||||||||
| Less: Net income attributable to noncontrolling interests |
3 | 1 | — | — | — | 1 | 2 | |||||||||||||||||||||
|
|
|
|
|
|
|
|
|
|
|
|
|
|
|
|||||||||||||||
| Net income (loss) attributable to ARAMARK stockholders |
$ | 104 | $ | 84 | $ | 31 | $ | (7 | ) | $ | 39 | $ | 30 | $ | 45 | |||||||||||||
|
|
|
|
|
|
|
|
|
|
|
|
|
|
|
|||||||||||||||
36
Table of Contents
| Fiscal year(1) | Nine months ended | |||||||||||||||||||||||||||
| 2012 | 2011 | 2010 | 2009 | 2008 | June 28, 2013 |
June 29, 2012 |
||||||||||||||||||||||
| (dollars in millions, except per share data) | (unaudited) | (unaudited) | (unaudited) | (unaudited) | ||||||||||||||||||||||||
| Per Share Data: |
||||||||||||||||||||||||||||
| Basic: |
||||||||||||||||||||||||||||
| Income (loss) from continuing operations |
$ | 0.51 | $ | 0.47 | $ | 0.16 | $ | (0.00 | ) | $ | 0.17 | $ | 0.15 | $ | 0.22 | |||||||||||||
| Income (loss) from discontinued operations |
0.00 | (0.06 | ) | (0.01 | ) | (0.03 | ) | 0.03 | — | 0.00 | ||||||||||||||||||
|
|
|
|
|
|
|
|
|
|
|
|
|
|
|
|||||||||||||||
| Net income (loss) attributable to ARAMARK stockholders |
$ | 0.51 | $ | 0.41 | $ | 0.15 | $ | (0.03 | ) | $ | 0.20 | $ | 0.15 | $ | 0.22 | |||||||||||||
| Diluted: |
||||||||||||||||||||||||||||
| Income (loss) from continuing operations |
$ | 0.49 | $ | 0.46 | $ | 0.16 | $ | (0.00 | ) | $ | 0.16 | $ | 0.15 | $ | 0.21 | |||||||||||||
| Income (loss) from discontinued operations |
0.00 | (0.06 | ) | (0.01 | ) | (0.03 | ) | 0.03 | — | 0.00 | ||||||||||||||||||
|
|
|
|
|
|
|
|
|
|
|
|
|
|
|
|||||||||||||||
| Net income (loss) attributable to ARAMARK stockholders |
$ | 0.49 | $ | 0.40 | $ | 0.15 | $ | (0.03 | ) | $ | 0.19 | $ | 0.15 | $ | 0.21 | |||||||||||||
| Cash dividend per share(3) |
$ | — | $ | 3.50 | $ | — | $ | — | $ | — | $ | — | $ | — | ||||||||||||||
| Statement of cash flows data: |
||||||||||||||||||||||||||||
| Net cash provided by/(used in): |
||||||||||||||||||||||||||||
| Operating activities(4) |
$ | 692 | $ | 304 | $ | 634 | $ | 707 | $ | 494 | $ | 136 | $ | 137 | ||||||||||||||
| Investing activities |
(482 | ) | (363 | ) | (354 | ) | (465 | ) | (405 | ) | (252 | ) | (363 | ) | ||||||||||||||
| Financing activities(4) |
(287 | ) | 112 | (344 | ) | (167 | ) | (24 | ) | 77 | 114 | |||||||||||||||||
| Other financial data: |
||||||||||||||||||||||||||||
| Capital expenditures, net of disposals |
343 | 272 | 264 | 330 | 350 | 255 | 219 | |||||||||||||||||||||
| Balance sheet data (at period end): |
||||||||||||||||||||||||||||
| Cash and cash equivalents |
$ | 137 | $ | 213 | $ | 161 | $ | 225 | $ | 149 | $ | 98 | $ | 101 | ||||||||||||||
| Noncash working capital(4)(5) |
(105 | ) | (101 | ) | (321 | ) | (236 | ) | (139 | ) | 242 | 239 | ||||||||||||||||
| Total assets(4) |
10,487 | 10,523 | 10,222 | 10,327 | 10,523 | 10,127 | 10,431 | |||||||||||||||||||||
| Total debt (including current portion of long term debt)(4)(6) |
6,009 | 6,232 | 5,402 | 5,722 | 5,860 | 6,217 | 6,377 | |||||||||||||||||||||
| Total equity(3) |
967 | 882 | 1,397 | 1,360 | 1,340 | 829 | 927 | |||||||||||||||||||||
| (1) | Fiscal years 2012, 2011, 2010, 2009 and 2008 refer to the fiscal years ended September 28, 2012, September 30, 2011, October 1, 2010, October 2, 2009 and October 3, 2008, respectively. Fiscal years 2012, 2011, 2010 and 2009 were each 52-week periods. Fiscal 2008 was a 53-week period. |
| (2) | During fiscal 2011, the Company completed the sale of its wholly-owned subsidiary, Galls, for approximately $75.0 million in cash. The transaction resulted in a pretax loss of approximately $1.5 million (after-tax loss of approximately $12.0 million). Galls is accounted for as a discontinued operation. Galls’ results of operations have been removed from the Company’s results of continuing operations for all periods presented. |
| (3) | During fiscal 2011, the Company paid a dividend of approximately $711 million to its stockholders. On October 29, 2012, we completed the spin-off of our majority interest in Seamless North America, LLC, on online and mobile food ordering service, to our stockholders in the form of a dividend. Each stockholder received one share of the common stock or Seamless Holdings, a newly formed company created to hold our former interest in Seamless North America, LLC, for each share of our common stock held as of the record date. |
| (4) | In the first quarter of fiscal 2011, the Company adopted the new authoritative accounting guidance regarding transfers of financial assets. The impact upon adoption resulted in the recognition of both the receivables securitized under the program and the borrowings they collateralize on the Consolidated Balance Sheet, which led to a $220.9 million increase in “Receivables” and “Long-Term Borrowings.” As a result of implementing the new guidance, funding under the agreement of $220.9 million on October 2, 2010 was reflected in the Company’s Consolidated Statement of Cash Flows as a use of cash from the securitization of accounts receivables under net cash provided by/(used in) operating activities and as a source of cash under net cash provided by/(used in) provided by financing activities. |
| (5) | Noncash working capital represents accounts receivable, net, plus inventories, prepayments and other current assets, minus accounts payable, accrued payroll and related expenses, and other accrued expenses and current liabilities, exclusive of assets held for sale. |
37
Table of Contents
| (6) | During fiscal 2011, the Company completed a private placement of $600 million, net of a 1% discount, in aggregate principal amount of 8.625% / 9.375% Senior Notes due 2016. In the second quarter of fiscal 2013, the Company completed a refinancing, repurchasing ARAMARK Corporation’s outstanding 8.50% Senior Notes due 2015 and Senior Floating Rate Notes due 2015 and our 8.625% / 9.375% Senior Notes due 2016. The Company refinanced that debt with new term loan borrowings and the issuance of our senior notes. |
38
Table of Contents
MANAGEMENT’S DISCUSSION AND ANALYSIS OF FINANCIAL CONDITION AND
RESULTS OF OPERATIONS
The following discussion and analysis of our financial condition and results of operations for the fiscal years ended September 28, 2012, September 30, 2011 and October 1, 2010, and for the three and nine months ended June 28, 2013 and June 29, 2012, should be read in conjunction with Selected Consolidated Financial Data, our consolidated financial statements and the notes to those statements and our unaudited condensed consolidated financial statements and the notes to those statements.
Our discussion contains forward-looking statements based upon current expectations that involve risks and uncertainties, such as our plans, objectives, opinions, expectations, anticipations, intentions and beliefs. Actual results and the timing of events could differ materially from those anticipated in those forward-looking statements as a result of a number of factors, including those set forth under “Risk Factors,” “Statements Regarding Forward-looking Information” and “Business” sections and elsewhere in this prospectus. In the following discussion and analysis of financial condition and results of operations, certain financial measures may be considered “non-GAAP financial measures” under Securities and Exchange Commission (“SEC”) rules. These rules require supplemental explanation and reconciliation, which is provided elsewhere in this prospectus.
Overview
We are a leading global provider of food, facilities and uniform services to education, healthcare, business and industry, and sports, leisure and corrections clients. Our core market is North America, which is supplemented by an additional 19-country footprint serving many of the fastest growing global geographies. We hold the #2 position in North America, a top 3 position in countries representing 98% of total 2012 sales, and are one of only 3 food and facilities competitors with the combination of scale, scope, and global reach. Through our established brand, broad geographic presence and approximately 267,000 employees, we anchor our business in our partnerships with thousands of education, healthcare, business, sports, leisure and corrections clients. Through these partnerships we serve millions of consumers including students, patients, employees, sports fans and guests worldwide.
The Company operates its business in three reportable segments:
| • | Food and Support Services North America (“FSS North America”)—Food, refreshment, specialized dietary and support services, including facility maintenance and housekeeping, provided to business, educational and healthcare institutions and in sports, entertainment, recreational and other facilities serving the general public in the United States, Canada and Mexico. |
| • | Food and Support Services International (“FSS International”)—Food, refreshment, specialized dietary and support services, including facility maintenance and housekeeping, provided to business, educational and healthcare institutions and in sports, entertainment, recreational and other facilities serving the general public. We have operations in 19 countries outside North America. Our largest international operations are in the United Kingdom, Germany, Chile and Ireland, and in each of these countries we are one of the leading food service providers. We also have operations in emerging market geographies, such as South America and China, and we own 50% of AIM Services Co., Ltd., a leader in providing outsourced food services in Japan. |
| • | Uniform and Career Apparel (“Uniform”)—Rental, sale, cleaning, maintenance and delivery of personalized uniform and career apparel and other textile items on a contract basis and direct marketing of personalized uniforms and career apparel and accessories to businesses, public institutions and individuals. We also provide walk-off mats, cleaning cloths, disposable towels and other environmental control items. |
Our Food and Support Services operations focus on serving clients in four principal sectors: Education, Healthcare, Business & Industry and Sports, Leisure and Corrections. Our FSS North America segment serves these client sectors, which are distinguished by the types of consumers served and types of services offered. Our
39
Table of Contents
FSS International segment provides a similar range of services as those provided to our FSS North America segment clients and operates in the same sectors although this segment is more heavily weighted towards Business & Industry. In fiscal 2012, our FSS North America segment generated $9.4 billion in sales, or 70% of our total sales, and our FSS International segment generated $2.7 billion in sales, or 20% of our total sales. Our Uniform segment provides uniforms, career and image apparel, work clothes and accessories to meet the needs of clients in a wide range of industries in the United States, Puerto Rico and Canada, including manufacturing, transportation, construction, restaurants and hotels, healthcare and pharmaceutical industries and many others. We supply garments, other textile and paper products and other accessories through rental and direct purchase programs to businesses, government agencies and individuals. In fiscal 2012, our Uniform segment generated $1.4 billion in sales, or 10% of our total sales. Administrative expenses not allocated to our three reportable segments are presented separately as corporate expenses and are not included in our segment results.
Our operating results continue to be affected by the economic uncertainty being experienced in the countries in which we operate. We anticipate that economic conditions, specifically in Europe, and unemployment levels will continue to remain challenging.
We are planning and executing both growth and cost control initiatives and are working to streamline and improve the efficiency and effectiveness of our general and administrative functions through increased standards, process improvements, and consolidation. As a result, we recorded certain costs during the second and third quarters of fiscal 2013 and estimate that we will incur an additional $40 to $65 million of costs over the next 18 months.
Seasonality
Our sales and operating results have varied, and we expect them to continue to vary, from quarter to quarter, as a result of different factors. Within our FSS North America segment, historically there has been a lower level of activity during our first and second fiscal quarters in operations that provide services to sports, entertainment and recreational clients. This lower level of activity historically has been partially offset during our first and second fiscal quarters by the increased activity in our educational operations. Conversely, historically there has been a significant increase in the provision of services to sports, entertainment and recreational clients during our third and fourth fiscal quarters, which is partially offset by the effect of summer recess at colleges, universities and schools on our educational operations.
Sources of Sales
Our clients engage us, generally through written contracts, to provide our services at their locations. Depending on the type of client and service, we are paid either by our client or directly by the consumer to whom we have been provided access by our client. We use two general contract types in our FSS North America and FSS International segments: profit and loss contracts and client interest contracts. These contracts differ in their provision for the amount of financial risk that we bear and, accordingly, the potential compensation, profits or fees we may receive. Under profit and loss contracts, we receive all of the revenue from, and bear all of the expenses of, the provision of our services at a client location. For fiscal 2012, approximately 73% of our FSS North America and FSS International sales were derived from profit and loss contracts. Client interest contracts include management fee contracts, under which our clients reimburse our operating costs and pay us a management fee, which may be calculated as a fixed dollar amount or a percentage of sales or operating costs. Some management fee contracts entitle us to receive incentive fees based upon our performance under the contract, as measured by factors such as sales, operating costs and customer satisfaction surveys. For fiscal 2012, approximately 27% of our FSS North America and FSS International sales were derived from client interest contracts.
For our Uniform segment, we typically serve our rental clients under written service contracts for an initial term of three to five years. Because the majority of our clients purchase on a recurring basis, our backlog of orders at
40
Table of Contents
any given time consists principally of orders in the process of being filled. With the exception of certain governmental bid business, most of our direct marketing business is conducted under invoice arrangement with repeat clients. Our direct marketing business is, to a large degree, relationship-centered. While we have long term relationships with some of our larger clients, we generally do not have contracts with these clients.
Costs and Expenses
Our costs and expenses are comprised of cost of services provided, depreciation and amortization and selling and general corporate expenses. Cost of services provided consists of direct expenses associated with our operations, including food costs, wages, other labor related expenses (including workers’ compensation, state unemployment insurance and federal or state mandated health benefits and other healthcare costs), insurance, fuel, utilities, piece goods and clothing and equipment. Depreciation and amortization mainly relate to assets used in generating sales. Selling and general corporate expenses include expenses related to commissions, marketing, share-based compensation and other costs related to administrative functions including compensation and benefits, professional services and information technology.
Interest and Other Financing Costs, net
Interest and other financing costs, net relates primarily to interest expense on long-term borrowings. Interest and other financing costs, net also includes third-party costs associated with long-term borrowings that were capitalized as deferred financing costs and are being amortized over the term of the borrowing.
Provision for Income Taxes
The provision for income taxes represents federal, foreign, state and local income taxes. Our effective tax rate differs from the statutory U.S. income tax rate due to the effect of state and local income taxes, tax rates in foreign jurisdictions and certain nondeductible expenses. Our effective tax rate will change from quarter to quarter based on recurring and nonrecurring factors including, but not limited to, the geographical mix of earnings, enacted tax legislation, including certain business tax credits, state and local income taxes, tax audit settlements and the interaction of various global tax strategies. Changes in judgment from the evaluation of new information resulting in the recognition, derecognition or remeasurement of a tax position taken in a prior annual period are recognized separately in the quarter of the change.
Foreign Currency Fluctuations
The impact from foreign currency translation assumes constant foreign currency exchange rates based on the rates in effect for the current year period were used in translation for the comparable prior year period. We believe that providing the impact of fluctuations in foreign currency rates on certain financial results can facilitate analysis of period-to-period comparisons of business performance.
41
Table of Contents
RESULTS OF OPERATIONS
The following tables present our sales and operating income from continuing operations, and related percentages, attributable to each operating segment for the three and nine months ended June 28, 2013 and June 29, 2012 (dollars in millions).
| Three Months Ended | Nine Months Ended | |||||||||||||||||||||||||||||||
| June 28, 2013 | June 29, 2012 | June 28, 2013 | June 29, 2012 | |||||||||||||||||||||||||||||
| Sales by Segment |
$ | % | $ | % | $ | % | $ | % | ||||||||||||||||||||||||
| FSS North America |
$ | 2,405.9 | 69 | % | $ | 2,319.6 | 70 | % | $ | 7,217.8 | 69 | % | $ | 7,053.4 | 70 | % | ||||||||||||||||
| FSS International |
727.5 | 21 | % | 673.9 | 20 | % | 2,154.6 | 21 | % | 2,030.5 | 20 | % | ||||||||||||||||||||
| Uniform |
356.6 | 10 | % | 342.6 | 10 | % | 1,057.3 | 10 | % | 1,020.4 | 10 | % | ||||||||||||||||||||
|
|
|
|
|
|
|
|
|
|
|
|
|
|
|
|
|
|||||||||||||||||
| $ | 3,490.0 | 100 | % | $ | 3,336.1 | 100 | % | $ | 10,429.7 | 100 | % | $ | 10,104.3 | 100 | % | |||||||||||||||||
|
|
|
|
|
|
|
|
|
|
|
|
|
|
|
|
|
|||||||||||||||||
| Three Months Ended | Nine Months Ended | |||||||||||||||||||||||||||||||
| June 28, 2013 | June 29, 2012 | June 28, 2013 | June 29, 2012 | |||||||||||||||||||||||||||||
| Operating Income by Segment |
$ | % | $ | % | $ | % | $ | % | ||||||||||||||||||||||||
| FSS North America |
$ | 73.1 | 59 | % | $ | 74.1 | 64 | % | $ | 298.9 | 79 | % | $ | 301.4 | 72 | % | ||||||||||||||||
| FSS International |
28.7 | 23 | % | 23.0 | 20 | % | 37.9 | 10 | % | 65.8 | 16 | % | ||||||||||||||||||||
| Uniform |
35.4 | 29 | % | 30.4 | 27 | % | 89.8 | 24 | % | 87.0 | 21 | % | ||||||||||||||||||||
|
|
|
|
|
|
|
|
|
|
|
|
|
|
|
|
|
|||||||||||||||||
| 137.2 | 111 | % | 127.5 | 111 | % | 426.6 | 113 | % | 454.2 | 109 | % | |||||||||||||||||||||
| Corporate |
(13.6 | ) | -11 | % | (12.3 | ) | -11 | % | (47.5 | ) | -13 | % | (38.4 | ) | -9 | % | ||||||||||||||||
|
|
|
|
|
|
|
|
|
|
|
|
|
|
|
|
|
|||||||||||||||||
| $ | 123.6 | 100 | % | $ | 115.2 | 100 | % | $ | 379.1 | 100 | % | $ | 415.8 | 100 | % | |||||||||||||||||
|
|
|
|
|
|
|
|
|
|
|
|
|
|
|
|
|
|||||||||||||||||
Three and Nine Months Ended June 28, 2013 Compared to Three and Nine Months Ended June 29, 2012
Consolidated Overview
Sales of $3.5 billion for the third quarter of fiscal 2013 and $10.4 billion for the nine month period represented an increase of 5% and 3% over the prior year periods, respectively. This increase is primarily attributable to growth in the Healthcare and Education sectors and the facilities business in the Business & Industry sector of the FSS North America segment, growth in Ireland, China, Chile and Argentina in our FSS International segment and growth in the uniform rental business in our Uniform segment. This increase was partially offset by a sales decline in the U.K. in our FSS International segment. Sales for the nine month period of fiscal 2013 were negatively impacted as a result of the National Hockey League (“NHL”) lockout and the impact of Hurricane Sandy in our FSS North America segment.
Operating income for the third quarter of fiscal 2013 was $123.6 million compared to $115.2 million in the prior year period as profit growth in our Business & Industry and Education sectors more than offset severance and related costs of approximately $6.6 million (see Note 4 to our unaudited condensed consolidated financial statements) and approximately $4.5 million of costs related to transformation initiatives. Operating income for the nine month period of fiscal 2013 was $379.1 million compared to $415.8 million in the prior year period. The decline in operating income for the nine month period of fiscal 2013 was primarily due to $47.4 million of severance and related costs as a result of the series of actions the Company initiated in the second quarter of fiscal 2013 to drive efficiency through the consolidation and centralization of its operations (see Note 4 to our unaudited condensed consolidated financial statements). During the nine month period of fiscal 2013, the Company also recorded approximately $11.7 million of goodwill impairment charges (see Note 5 to our unaudited condensed consolidated financial statements), other asset write-downs of approximately $11.4 million primarily related to the write-offs of certain client contractual investments and approximately $17.1 million of costs related to transformation initiatives. In addition, the nine month period of fiscal 2013 was also negatively affected by the NHL lockout and Hurricane Sandy. This profit decline was partially offset by profit growth in our Business & Industry and Education sectors and other income recognized of approximately $14.0 million relating to the recovery of the
42
Table of Contents
Company’s investment (possessory interest) at one of the National Park Service (“NPS”) sites in the Sports, Leisure and Corrections sector, which was terminated in the current year. The nine month period of fiscal 2012 includes a favorable risk insurance adjustment of $7.4 million related to favorable claims experience, of which $5.7 million relates to our uniform rental business, transition and integration costs of $4.3 million related to the Filterfresh acquisition and severance related charges of $6.1 million in the Uniform segment and FSS International segment.
Interest and Other Financing Costs, net, for the three and nine month periods of fiscal 2013 decreased approximately by $20.7 million and $15.0 million when compared to the prior year periods, respectively. The decrease in the three month period of fiscal 2013 was primarily due to the repurchase of the 8.625% / 9.375% Senior Notes due 2016 (“Holdings Notes”), 8.50% senior notes due 2015 (“Fixed Rate Notes”) and senior floating rate notes due 2015 (“Floating Rate Notes”) (see Note 6 to our unaudited condensed consolidated financial statements). The decrease in the nine month period of fiscal 2013 was primarily due to the maturity of interest rate swaps during fiscal 2012. Interest and Other Financing Costs, net, for the nine months ended June 28, 2013 includes charges of $39.8 million in connection with the tender offer and repayment of the Holdings Notes, Fixed Rate Notes and Floating Rate Notes (see Note 6 to our unaudited condensed consolidated financial statements), consisting of $12.9 million of third-party costs for the tender offer premium and $26.9 million of non-cash charges for the write-off of deferred financing costs. Interest and Other Financing Costs, net, for the nine month period of fiscal 2013 also includes approximately $11.6 million of third-party costs incurred related to Amendment Agreement No. 3 to the senior secured credit agreement and approximately $3.2 million of hedge ineffectiveness related to the repayment of the Canadian subsidiary’s term loan with a maturity date of January 26, 2014. Interest and Other Financing Costs, net, for the nine month period of fiscal 2012 includes $10.5 million of third-party costs related to Amendment Agreement No. 2 and the amendment of the Company’s Canadian subsidiary cross currency swap.
The Company recorded a provision for income taxes of $14.7 million on pretax income of $42.7 million for the three months ended June 28, 2013 as compared to a benefit for income taxes of $(1.0) million on pretax income of $13.6 million in the prior year period. The change in the three months ended June 28, 2013 is primarily due to the tax benefit of discrete items included in the income tax provision in the third quarter of fiscal 2012. The effective income tax rate for the nine months of fiscal 2013 was 17.2% compared to 20.0% in the prior year period.
Net income for the three and nine month periods of fiscal 2013 was $28.0 million and $31.3 million, respectively, compared to $14.5 million and $47.8 million in the prior year periods, respectively. Net income attributable to noncontrolling interests for the three and nine month periods of fiscal 2013 was $0.2 million and $0.8 million, respectively, compared to $0.6 million and $2.4 million in the prior year periods, respectively.
43
Table of Contents
Segment Results
The following tables present a comparison of segment sales and operating income from continuing operations for the three and nine months ended June 28, 2013 and June 29, 2012 together with the amount of and percentage change between periods (dollars in millions).
| Sales by Segment |
Three Months Ended | Nine Months Ended | ||||||||||||||||||||||||||||||
| June 28, 2013 |
June 29, 2012 |
Change | June 28, 2013 |
June 29, 2012 |
Change | |||||||||||||||||||||||||||
| $ | % | $ | % | |||||||||||||||||||||||||||||
| FSS North America |
$ | 2,405.9 | $ | 2,319.6 | $ | 86.3 | 4 | % | $ | 7,217.8 | $ | 7,053.4 | $ | 164.4 | 2 | % | ||||||||||||||||
| FSS International |
727.5 | 673.9 | 53.6 | 8 | % | 2,154.6 | 2,030.5 | 124.1 | 6 | % | ||||||||||||||||||||||
| Uniform |
356.6 | 342.6 | 14.0 | 4 | % | 1,057.3 | 1,020.4 | 36.9 | 4 | % | ||||||||||||||||||||||
|
|
|
|
|
|
|
|
|
|
|
|
|
|||||||||||||||||||||
| $ | 3,490.0 | $ | 3,336.1 | $ | 153.9 | 5 | % | $ | 10,429.7 | $ | 10,104.3 | $ | 325.4 | 3 | % | |||||||||||||||||
|
|
|
|
|
|
|
|
|
|
|
|
|
|||||||||||||||||||||
| Operating Income by Segment |
Three Months Ended | Nine Months Ended | ||||||||||||||||||||||||||||||
| June 28, 2013 |
June 29, 2012 |
Change | June 28, 2013 |
June 29, 2012 |
Change | |||||||||||||||||||||||||||
| $ | % | $ | % | |||||||||||||||||||||||||||||
| FSS North America |
$ | 73.1 | $ | 74.1 | $ | (1.0 | ) | -1 | % | $ | 298.9 | $ | 301.4 | $ | (2.5 | ) | -1 | % | ||||||||||||||
| FSS International |
28.7 | 23.0 | 5.7 | 25 | % | 37.9 | 65.8 | (27.9 | ) | * | * | |||||||||||||||||||||
| Uniform |
35.4 | 30.4 | 5.0 | 16 | % | 89.8 | 87.0 | 2.8 | 3 | % | ||||||||||||||||||||||
| Corporate |
(13.6 | ) | (12.3 | ) | (1.3 | ) | 11 | % | (47.5 | ) | (38.4 | ) | (9.1 | ) | 24 | % | ||||||||||||||||
|
|
|
|
|
|
|
|
|
|
|
|
|
|||||||||||||||||||||
| $ | 123.6 | $ | 115.2 | $ | 8.4 | 7 | % | $ | 379.1 | $ | 415.8 | $ | (36.7 | ) | -9 | % | ||||||||||||||||
|
|
|
|
|
|
|
|
|
|
|
|
|
|||||||||||||||||||||
| ** | —Not meaningful |
FSS North America Segment
FSS North America segment sales for the three and nine month periods of fiscal 2013 increased 4% and 2% over the prior year periods, respectively, primarily due to growth in the Healthcare and Education sectors and in the facilities business in the Business & Industry sector. Sales for the three month period of fiscal 2013 were positively impacted by the timing of the Easter holiday. Sales for the nine month period of fiscal 2013 were negatively impacted by the NHL lockout and Hurricane Sandy. The negative impact of acquisitions and divestitures was approximately -1% in the three and nine month periods. The Business & Industry sector had flat sales for the third quarter and low-single digit sales decline for the nine month period of fiscal 2013 primarily due to the spin-off of Seamless North America, LLC (“Seamless”) in October 2012 and the impact of Hurricane Sandy on our business dining operations offset by growth in our facilities business. The Education sector had high-single digit sales growth for the third quarter and mid-single digit sales growth for the nine month period of fiscal 2013, due to base and net new business growth in our Higher Education and K-12 food and facilities businesses. The Healthcare sector had mid-single digit sales growth for the third quarter and low-single digit sales growth for the nine month period of fiscal 2013 primarily due to base business growth. The Sports, Leisure and Corrections sector had low-single digit sales growth for the third quarter due to growth in our Major League Baseball venues. For the nine month period of fiscal 2013, sales in the Sports, Leisure and Corrections sector were flat as growth in our Major League Baseball venues were offset by the effect of the NHL lockout.
Operating income for the three and nine month periods of fiscal 2013 was $73.1 million and $298.9 million compared to $74.1 million and $301.4 million in the prior year periods, respectively. The decrease in the third quarter of fiscal 2013 is due to approximately $6.6 million for severance and related costs and approximately $3.3 million of costs related to transformation initiatives, which more than offset the profit growth in our Business & Industry and Education sectors. The nine month period of fiscal 2013 was negatively affected by approximately $33.7 million of severance and related costs, $6.8 million of asset write-offs and approximately $14.4 million of costs related to transformation initiatives, which more than offset the profit growth in our Business & Industry and Education sectors and the other income recognized of approximately $14.0 million
44
Table of Contents
relating to the recovery of the Company’s investment (possessory interest) at one of the NPS sites in the Sports, Leisure and Corrections sector, which was terminated in the current year. The nine month period of fiscal 2013 was also negatively affected by the NHL lockout and Hurricane Sandy. Operating income for the nine month period of fiscal 2012 includes $4.3 million of transition and integration costs related to the Filterfresh acquisition.
FSS International Segment
Sales in the FSS International segment for the three and nine month periods of fiscal 2013 increased 8% and 6% compared to the prior year periods, respectively, as growth in Germany, Ireland, Chile, Argentina and China more than offset the sales decline in the U.K.
Operating income for the third quarter of fiscal 2013 was $28.7 million compared to $23.0 million in the prior year period. This increase was due to the profit growth in Germany, Chile and Spain offset by the negative impact of foreign currency translation (approximately -3%) and $1.2 million of costs related to transformation initiatives. Operating income for the nine month period of fiscal 2013 was $37.9 million compared to $65.8 million in the prior year period. The nine month period of fiscal 2013 was negatively affected by $12.8 million of severance and related costs, $16.3 million of goodwill impairment charges and other asset write-offs and $2.6 million of costs related to transformation initiatives as well as the negative impact of foreign currency translation (approximately -1%). Operating income for the nine month period of fiscal 2012 includes a favorable adjustment of $1.5 million related to a non-income tax settlement in the U.K. and $2.1 million of severance related expenses.
Uniform Segment
Uniform segment sales increased 4% for the three and nine month periods of fiscal 2013 compared to both prior year periods primarily due to growth in our uniform rental base business.
Operating income for the third quarter of fiscal 2013 was $35.4 million compared to $30.4 million in the prior year period. Operating income for the nine month period of fiscal 2013 was $89.8 million compared to $87.0 million in the prior year period. Operating income for the three and nine month periods of fiscal 2013 benefited from growth in the uniform rental business and operational efficiencies across the segment. Operating income for the nine month period of fiscal 2013 includes severance related expenses of $3.7 million and a net charge of approximately $3.5 million related to a multiemployer pension withdrawal and a preliminary settlement of wage and hour claims, net of a favorable risk insurance adjustment. Operating income for the nine month period of fiscal 2012 includes severance related charges of $4.0 million and a favorable risk insurance adjustment of $5.7 million.
Corporate
Corporate expenses, those administrative expenses not allocated to the business segments, were $13.6 million for the third quarter of fiscal 2013 compared to $12.3 million for the prior year period. The increase is primarily due to the reversal in the prior year period of share-based compensation expense previously recognized for the performance-based options. For the nine month period of fiscal 2013, corporate expenses were $47.5 million compared to $38.4 million for the prior year period. The nine month period of fiscal 2013 includes an accounting charge related to the retirement obligation to our current Chairman and former Chief Executive Officer and $0.9 million of severance and related costs.
45
Table of Contents
The following tables present our sales and operating income from continuing operations, and the related percentages, attributable to each operating segment, for the fiscal years 2012, 2011 and 2010 (dollars in millions). On September 30, 2011, the Company sold its wholly-owned subsidiary, Galls (see Note 2 to our consolidated financial statements). Accordingly, operating results for this business are reported as discontinued operations.
| Fiscal Year
Ended September 28, 2012 |
Fiscal Year
Ended September 30, 2011 |
Fiscal Year Ended October 1, 2010 |
||||||||||||||||||||||
| Sales by Segment |
$ | % | $ | % | $ | % | ||||||||||||||||||
| FSS North America |
$ | 9,413.2 | 70 | % | $ | 9,019.0 | 69 | % | $ | 8,654.7 | 70 | % | ||||||||||||
| FSS International |
2,729.5 | 20 | % | 2,723.3 | 21 | % | 2,437.7 | 20 | % | |||||||||||||||
| Uniform |
1,362.7 | 10 | % | 1,340.1 | 10 | % | 1,326.7 | 10 | % | |||||||||||||||
|
|
|
|
|
|
|
|
|
|
|
|
|
|||||||||||||
| $ | 13,505.4 | 100 | % | $ | 13,082.4 | 100 | % | $ | 12,419.1 | 100 | % | |||||||||||||
|
|
|
|
|
|
|
|
|
|
|
|
|
|||||||||||||
| Fiscal Year
Ended September 28, 2012 |
Fiscal Year Ended September 30, 2011 |
Fiscal Year Ended October 1, 2010 |
||||||||||||||||||||||
| Operating Income by Segment |
$ | % | $ | % | $ | % | ||||||||||||||||||
| FSS North America |
$ | 425.6 | 73 | % | $ | 400.5 | 73 | % | $ | 350.6 | 73 | % | ||||||||||||
| FSS International |
89.9 | 15 | % | 79.9 | 15 | % | 75.3 | 16 | % | |||||||||||||||
| Uniform |
118.1 | 21 | % | 117.3 | 21 | % | 102.7 | 22 | % | |||||||||||||||
|
|
|
|
|
|
|
|
|
|
|
|
|
|||||||||||||
| 633.6 | 109 | % | 597.7 | 109 | % | 528.6 | 111 | % | ||||||||||||||||
| Corporate |
(51.8 | ) | -9 | % | (50.6 | ) | -9 | % | (51.1 | ) | -11 | % | ||||||||||||
|
|
|
|
|
|
|
|
|
|
|
|
|
|||||||||||||
| $ | 581.8 | 100 | % | $ | 547.1 | 100 | % | $ | 477.5 | 100 | % | |||||||||||||
|
|
|
|
|
|
|
|
|
|
|
|
|
|||||||||||||
Fiscal 2012 Compared to Fiscal 2011
Consolidated Overview
Sales of $13.5 billion for fiscal 2012 represented an increase of 3% over the prior year. This increase is primarily attributable to growth in the Higher Education business and Business & Industry sector of the FSS North America segment, growth in Ireland, Germany, China, Chile and Argentina in our FSS International segment, growth in the uniform rental business in our Uniform segment and the impact of acquisitions (approximately 1%). Sales were also positively impacted from our role as the exclusive food service provider in the Athletes’ Villages for the London Olympics in the U.K. in our FSS International segment. This increase more than offset the sales decline in Spain in our FSS International segment and the negative impact of foreign currency translation (approximately -1%).
Operating income was $581.8 million for fiscal 2012 compared to $547.1 million for the prior year. This increase is primarily attributable to profit growth in our Higher Education business, our Healthcare sector and in the U.K., Ireland and Chile, offset by the negative impact of foreign currency translation (approximately -1%). Fiscal 2012 also includes other income recognized of $6.7 million relating to the recovery of the Company’s investment (possessory interest) at one of the National Park Service (“NPS”) sites in the Sports, Leisure and Corrections sector, which was terminated during fiscal 2012, a favorable risk insurance adjustment of $7.4 million related to favorable claims experience, of which $5.7 million relates to our uniform rental business, transition and integration costs of $4.9 million related to the Filterfresh acquisition and severance related charges of $6.9 million. Fiscal 2011 included a gain of approximately $7.7 million on the sale of the Company’s 67% ownership interest in the security business of its Chilean subsidiary, favorable non-income tax settlements of approximately $5.3 million in the U.K., a goodwill and other intangible assets impairment charge of $5.3 million, severance related charges of approximately $22.8 million, other income of approximately $7.8 million related to
46
Table of Contents
a compensation agreement signed with the NPS under which the NPS agreed to pay down a portion of our investment (possessory interest) in certain assets at one of our NPS sites in our Sports, Leisure and Corrections sector and a favorable risk insurance adjustment of $5.7 million.
Interest and Other Financing Costs, net, for fiscal 2012 increased approximately $5.7 million from the prior year primarily due to the impact of a full year of interest expense on the Holdings Notes compared to the prior year period, which more than offset the positive impact of interest rate swaps that matured during fiscal 2012. Interest and Other Financing Costs, net, for fiscal 2012 includes $7.5 million of third-party costs incurred related to the March 2012 amendment that extended the U.S. dollar equivalent of approximately $1,231.6 million of the Company’s term loans and approximately $3.6 million of hedge ineffectiveness incurred related to the Company’s amendment of its cross currency swaps. Interest and Other Financing Costs, net, for fiscal 2011 includes interest income related to $14.1 million of favorable non-income tax settlements in the U.K. recorded in the second quarter of fiscal 2011 and a write-off of deferred financing fees of $2.1 million related to the amendment that extended the U.S. dollar denominated portion of the revolving credit facility.
The effective income tax rate for fiscal 2012 was 14.5% compared to (0.8%) in the prior year. The higher effective income tax rate in fiscal 2012 is due to a reduction of approximately $17.0 million in reserves in fiscal 2011 related to the remeasurement of an uncertain tax position.
Income from continuing operations for fiscal 2012 was $106.9 million compared to $96.7 million in the prior year. Income (loss) from discontinued operations during fiscal 2012 was $0.3 million compared to $(11.7) million in fiscal 2011. Fiscal 2011 included the pretax loss of approximately $1.5 million (after-tax loss of approximately $12.0 million) related to the sale of the Company’s wholly-owned subsidiary, Galls, for approximately $75.0 million in cash (see Note 2 to our consolidated financial statements). Net income attributable to noncontrolling interests for fiscal 2012 was $3.6 million compared to $1.1 million in the prior year.
Segment Results
The following tables present a fiscal 2012/2011 comparison of segment sales and operating income from continuing operations together with the amount of and percentage change between periods (dollars in millions).
| Sales by Segment |
Fiscal Year Ended September 28, 2012 |
Fiscal Year Ended September 30, 2011 |
$ | % | ||||||||||||
| FSS North America |
$ | 9,413.2 | $ | 9,019.0 | $ | 394.2 | 4 | % | ||||||||
| FSS International |
2,729.5 | 2,723.3 | 6.2 | — | % | |||||||||||
| Uniform |
1,362.7 | 1,340.1 | 22.6 | 2 | % | |||||||||||
|
|
|
|
|
|
|
|||||||||||
| $ | 13,505.4 | $ | 13,082.4 | $ | 423.0 | 3 | % | |||||||||
|
|
|
|
|
|
|
|||||||||||
| Operating Income by Segment |
Fiscal Year Ended September 28, 2012 |
Fiscal Year Ended September 30, 2011 |
$ | % | ||||||||||||
| FSS North America |
$ | 425.6 | $ | 400.5 | $ | 25.1 | 6 | % | ||||||||
| FSS International |
89.9 | 79.9 | 10.0 | 13 | % | |||||||||||
| Uniform |
118.1 | 117.3 | 0.8 | 1 | % | |||||||||||
| Corporate |
(51.8 | ) | (50.6 | ) | (1.2 | ) | 2 | % | ||||||||
|
|
|
|
|
|
|
|||||||||||
| $ | 581.8 | $ | 547.1 | $ | 34.7 | 6 | % | |||||||||
|
|
|
|
|
|
|
|||||||||||
FSS North America Segment
FSS North America segment sales for fiscal 2012 increased 4% over the prior year primarily due to growth in the Higher Education business, the Sports, Leisure and Corrections and Business & Industry sectors and the positive impact of acquisitions (approximately 2%), which more than offset the negative impact of foreign
47
Table of Contents
currency translation (approximately -1%). The Business & Industry sector had high-single digit sales growth for fiscal 2012 primarily due to base business growth in our refreshment services and facilities businesses and the Filterfresh acquisition. This growth more than offset the sales decline in our business dining operations due to the impact of lost business. The Education sector had mid-single digit sales growth for fiscal 2012, due to base and net new business growth in our Higher Education food and facilities services businesses which more than offset the sales decline in K-12 due to the impact of lost business. The Healthcare sector had low-single digit sales growth for fiscal 2012 primarily due to base business growth and the full year effect of the 2011 acquisition of Masterplan within the Healthcare Technologies business. The Sports, Leisure and Corrections sector had low-single digit sales growth for fiscal 2012 primarily related to growth at our National Hockey League and Major League Baseball venues.
Operating income for fiscal 2012 was $425.6 million compared to $400.5 million in the prior year. The increase is due to profit growth in our Higher Education business and Healthcare sector and other income recognized of $6.7 million relating to the recovery of the Company’s investment (possessory interest) at one of the NPS sites in the Sports, Leisure and Corrections sector, which was terminated in the current year. This profit growth more than offset the negative impact of foreign currency translation (approximately -1%), the profit decline in our Business & Industry sector and the transition and integration costs of $4.9 million related to the Filterfresh acquisition. Fiscal 2011 included other income recognized in the first quarter of fiscal 2011 of $7.8 million related to a compensation agreement signed with the NPS under which the NPS agreed to pay down a portion of our investment (possessory interest) in certain assets at one of our NPS sites in our Sports, Leisure and Corrections sector and severance related charges of $6.2 million.
FSS International Segment
Sales in the FSS International segment for fiscal 2012 were flat compared to the prior year as growth in Ireland, Germany, China, Chile and Argentina and sales related to the London Olympics were offset by the negative impact of foreign currency translation (approximately -5%), divestitures (approximately -1%) and the sales decline in Spain.
Operating income for fiscal 2012 was $89.9 million compared to $79.9 million in the prior year. This increase is primarily attributable to profit growth in the U.K., Ireland and Chile and a reduction in severance related expenses, which more than offset the profit decline in Belgium and in our equity method investee in Japan and the negative impact of foreign currency translation (approximately -4%). Operating income for fiscal 2011 included a gain of $7.7 million related to the divestiture of the Company’s 67% ownership interest in the security business of its Chilean subsidiary, favorable non-income tax settlements in the U.K. of $5.3 million, a goodwill and other intangible assets impairment charge of $5.3 million and severance related expenses of $11.4 million.
Uniform Segment
Uniform segment sales increased 2% for fiscal 2012 compared to the prior year, resulting primarily from growth in our uniform rental business.
Operating income for fiscal 2012 was $118.1 million compared to $117.3 million in the prior year as the increase in favorable risk insurance adjustments compared to the prior year and a reduction in severance related expenses more than offset the fiscal 2012 increased investment in our growing sales force and higher energy costs. Operating income for fiscal 2012 includes a favorable risk insurance adjustment of $5.7 million compared to $4.8 million in the prior year. Operating income for fiscal 2012 also includes severance related charges of $2.6 million compared to $3.9 million in the prior year.
Corporate
Corporate expenses, those administrative expenses not allocated to the business segments, were $51.8 million in fiscal 2012, compared to $50.6 million for the prior year. The increase is mainly due to costs related to the hiring of our new Chief Executive Officer and President in May 2012, which more than offset the decrease in share-based compensation expense related to performance-based options (see Note 10 to our consolidated financial statements), gains due to the change in fair value on gasoline and diesel fuel agreements and prior year charges for headcount reductions.
48
Table of Contents
Fiscal 2011 Compared to Fiscal 2010
Consolidated Overview
Sales of $13.1 billion for fiscal 2011 represented an increase of 5% over the prior year. This increase is attributable to growth in the Education and Healthcare sectors of our FSS North America segment, growth in Ireland, Germany, Spain, Chile, Argentina and China in our FSS International segment, growth in the uniform rental business in our Uniform segment and the positive impact of foreign currency translation (approximately 1%). This increase more than offset the sales decline in our Sports, Leisure and Corrections sector of our FSS North America segment and in the U.K. and Korea in our FSS International segment.
Operating income was $547.1 million for fiscal 2011 compared to $477.5 million for the prior year. The increase in operating income in fiscal 2011 was attributable to profit growth in the Education and Healthcare sectors, operational efficiencies in our uniform rental business and the positive impact of foreign currency translation (approximately 2%), which more than offset the profit decline in our Business & Industry sector. Fiscal 2011 also includes a gain of approximately $7.7 million on the sale of the Company’s 67% ownership interest in the security business of its Chilean subsidiary, favorable non-income tax settlements of approximately $5.3 million in the U.K., a goodwill and other intangible assets impairment charge of $5.3 million, severance related charges of approximately $22.8 million, other income of approximately $7.8 million related to a compensation agreement signed with the NPS under which the NPS agreed to pay down a portion of our investment (possessory interest) in certain assets at one of our NPS sites in our Sports, Leisure and Corrections sector and a favorable risk insurance adjustment of $5.7 million.
Interest and other financing costs, net, for fiscal 2011 increased approximately $6.6 million from the prior year primarily due to interest expense on the Holdings Notes that were issued in April 2011 and the increase in interest rates mainly due to the amendment that extended $1,407.4 million of outstanding U.S. denominated term loan in the second quarter of fiscal 2010 (see Note 5 to our consolidated financial statements). These increases were partially offset by the increase in interest income related to the $14.1 million of favorable non-income tax settlements in the U.K. recorded in the second quarter of fiscal 2011 and $8.5 million of third-party costs incurred during fiscal 2010 related to the amendment that extended $1,407.4 million of outstanding U.S. denominated term loan.
The Company recorded a benefit for income taxes of $(0.7) million on pretax income of $96.0 million for fiscal 2011 as compared to a provision for income taxes of $0.7 million on pretax income of $33.0 million for fiscal 2010. The changes in both periods principally reflects the relative mix and amount of U.S. and non-U.S. income or loss and the impact of tax credits relative to pretax amounts. The benefit for income taxes in fiscal 2011 included a reduction of approximately $17.0 million in reserves in fiscal 2011 related to the remeasurement of an uncertain tax position.
Income from continuing operations for fiscal 2011 was $96.7 million, compared to $32.3 million in fiscal 2010. Loss from discontinued operations during fiscal 2011 was $(11.7) million compared to $(1.6) million in fiscal 2010. Fiscal 2011 includes the pretax loss of approximately $1.5 million (after-tax loss of approximately $12.0 million) related to the sale of the Company’s wholly-owned subsidiary, Galls, for approximately $75.0 million in cash (see Note 2 to the consolidated financial statements).
Net income attributable to noncontrolling interest for fiscal 2011 was $1.1 million.
49
Table of Contents
Segment Results
The following tables present a 2011/2010 comparison of segment sales and operating income from continuing operations together with the amount of and percentage change between periods (dollars in millions).
| Sales by Segment |
Fiscal Year Ended September 30, 2011 |
Fiscal Year Ended October 1, 2010 |
$ | % | ||||||||||||
| FSS North America |
$ | 9,019.0 | $ | 8,654.7 | $ | 364.3 | 4 | % | ||||||||
| FSS International |
2,723.3 | 2,437.7 | 285.6 | 12 | % | |||||||||||
| Uniform |
1,340.1 | 1,326.7 | 13.4 | 1 | % | |||||||||||
|
|
|
|
|
|
|
|||||||||||
| $ | 13,082.4 | $ | 12,419.1 | $ | 663.3 | 5 | % | |||||||||
|
|
|
|
|
|
|
|||||||||||
| Operating Income by Segment |
Fiscal Year Ended September 30, 2011 |
Fiscal Year Ended October 1, 2010 |
$ | % | ||||||||||||
| FSS North America |
$ | 400.5 | $ | 350.6 | $ | 49.9 | 14 | % | ||||||||
| FSS International |
79.9 | 75.3 | 4.6 | 6 | % | |||||||||||
| Uniform |
117.3 | 102.7 | 14.6 | 14 | % | |||||||||||
| Corporate |
(50.6 | ) | (51.1 | ) | 0.5 | -1 | % | |||||||||
|
|
|
|
|
|
|
|||||||||||
| $ | 547.1 | $ | 477.5 | $ | 69.6 | 15 | % | |||||||||
|
|
|
|
|
|
|
|||||||||||
FSS North America Segment
FSS North America segment sales for fiscal 2011 were $9.0 billion, an increase of 4% compared to the prior year as growth in the Education and Healthcare sectors more than offset the decline in the Sports, Leisure and Corrections sector. The Business & Industry sector had a low-single digit sales increase for fiscal 2011 as base business growth in our food and facilities services businesses more than offset the one-time sales in the prior year related to the contract to provide support services, including temporary accommodations and food, for the Canadian security detail that served the G-8 and G-20 meetings in Toronto. The Education sector had high-single digit sales growth for fiscal 2011 due to base and net new business growth in our Higher Education food and facilities services businesses. The Education sector also benefited from net new business growth in our K-12 food and facilities services businesses. In our Healthcare sector, we had high-single digit sales growth for fiscal 2011, primarily due to base business growth across the sector and the acquisition of Masterplan. Our Sports, Leisure and Corrections sector had a low-single digit sales decline for fiscal 2011 as growth in our National Hockey League venues and in our stadiums was more than offset by a reduction in the number of events in our amphitheaters, the impact of prior year lost business and sales in the prior year related to the Winter Olympics.
Operating income in the FSS North America segment was $400.5 million for fiscal 2011 compared to $350.6 million in the prior year as profit growth in our Education and the Healthcare sectors, the positive impact of foreign currency translation (approximately 1%) and other income recognized of $7.8 million related to a compensation agreement signed with the NPS under which the NPS agreed to pay down a portion of our investment (possessory interest) in certain assets at one of our NPS sites in our Sports, Leisure and Corrections sector more than offset the profit decline in our Business & Industry sector and severance related charges of $6.2 million.
FSS International Segment
Sales in the FSS International segment for fiscal 2011 were $2.7 billion, an increase of 12% compared to the prior year, as growth in base and net new business in Ireland, Germany, Spain, Chile, and China and the positive impact of foreign currency translation (approximately 5%) more than offset the sales declines in the U.K. and Korea.
50
Table of Contents
Operating income for fiscal 2011 was $79.9 million, an increase of 6% over the prior year period as profit growth in Germany and Ireland and the positive impact of foreign currency translation (approximately 6%) more than offset the profit declines in China and Chile. In addition, severance related charges of approximately $11.4 million and the goodwill and other intangible assets impairment charge of $5.3 million more than offset the approximately $7.7 million gain on the sale of our 67% ownership interest in a security business in our Chilean subsidiary, favorable non-income tax settlements of $5.3 million in the U.K. and the $1.7 million gain on the sale of land in Chile.
Uniform Segment
In the Uniform segment, sales for fiscal 2011 were $1.3 billion, up 1% from the prior year, resulting primarily due to growth in our uniform rental base business.
Operating income for fiscal 2011 was $117.3 million compared to $102.7 million in the prior year, primarily due to profit growth in our uniform rental business and operational efficiencies across the segment. Operating income in fiscal 2011 also benefited from a gain of $2.6 million related to a property settlement of an eminent domain claim and a favorable risk insurance adjustment of $4.8 million based on favorable claims experience, which more than offset severance related charges of approximately $3.9 million.
Corporate
Corporate expenses, those administrative expenses not allocated to the business segments, were $50.6 million in fiscal 2011, compared to $51.1 million for the prior year. The decrease is mainly due to the decrease in share-based compensation expense related to performance-based options (see Note 10 to our consolidated financial statements) which was partially offset by charges for headcount reductions.
Quarterly Financial Data
The following table presents select historical quarterly consolidated statements of operations data for fiscal 2011, fiscal 2012 and the nine months ended June 28, 2013.
This quarterly information has been prepared using our unaudited condensed consolidated financial statements and only includes all normal recurring adjustments necessary for a fair presentation of the results of the interim periods.
| (in millions) | Quarter Ended | |||||||||||||||||||||||||||||||||||||||||||
| December 31, 2010 |
April 1, 2011 |
July 1, 2011 |
September 30, 2011 |
December 30, 2011 |
March 30, 2012 |
June 29, 2012 |
September 28, 2012 |
December 28, 2012 |
March 29, 2013 |
June 28, 2013 |
||||||||||||||||||||||||||||||||||
| Sales |
$ | 3,284 | $ | 3,220 | $ | 3,286 | $ | 3,292 | $ | 3,423 | $ | 3,345 | $ | 3,336 | $ | 3,401 | $ | 3,536 | $ | 3,404 | $ | 3,490 | ||||||||||||||||||||||
| Operating Income |
164 | 122 | 109 | 152 | 167 | 134 | 115 | 166 | 175 | 80 | 124 | |||||||||||||||||||||||||||||||||
| Net income (loss) attributable to ARAMARK stockholders |
$ | 39 | $ | 20 | $ | (8 | ) | $ | 33 | $ | 30 | $ | 1 | $ | 14 | $ | 59 | $ | 43 | $ | (40 | ) | $ | 27 | ||||||||||||||||||||
Liquidity and Capital Resources
Overview
Our principal sources of liquidity are cash generated from operating activities, funds from borrowings and existing cash on hand. As of June 28, 2013, we had $97.8 million of cash and cash equivalents and approximately $447.0 million of availability under our senior secured revolving credit facility.
We believe that our cash and cash equivalents and the unused portion of our committed credit availability under our senior secured revolving credit facility will be adequate to meet anticipated cash requirements to fund working capital, capital spending, debt service obligations, refinancings and other cash needs. We believe we enjoy a strong liquidity position overall and we will continue to seek to invest strategically but prudently in certain sectors and geographies. Over time, the Company has repositioned its service portfolio so that today a significant portion of the operating income in our
51
Table of Contents
FSS North America segment comes from sectors and businesses such as Education, Healthcare and corrections, which we believe to be economically less sensitive. In addition, we have worked to further diversify our international business by geography and sector. The Company routinely monitors its cash flow and the condition of the capital markets in order to be prepared to respond to changing conditions.
The table below summarizes our cash activity (in millions):
| Nine Months Ended | Fiscal Year | |||||||||||||||||||
| June 28, 2013 | June 29, 2012 | 2012 | 2011 | 2010 | ||||||||||||||||
| Net cash provided by operating activities |
$ | 136.3 | $ | 136.7 | $ | 691.8 | $ | 303.6 | $ | 634.0 | ||||||||||
| Net cash used in investing activities |
(252.1 | ) | (363.4 | ) | (481.6 | ) | (363.1 | ) | (353.5 | ) | ||||||||||
| Net cash (used in) provided by financing activities |
76.8 | 114.3 | (286.8 | ) | 112.0 | (344.2 | ) | |||||||||||||
Reference to the Condensed Consolidated Statements of Cash Flows and Consolidated Statements of Cash Flows will facilitate understanding of the discussion that follows.
Cash Flows Provided by Operating Activities
For the nine months ended June 28, 2013, the decrease in the total of net income and noncash charges results mainly from the results of operations of the Company as discussed above. As expected and consistent with historical patterns, working capital was a use of cash for us during the nine month period of fiscal 2013. The change in working capital requirements relates principally to changes in Accounts Receivable (approximately $14.2 million) primarily due to business growth and the timing of collections, Prepayments (approximately $22.9 million) due to the timing of estimated tax payments and Accounts Payable (approximately $10.8 million) primarily due to business growth and the timing of disbursements, offset by changes in Inventory (approximately $23.0 million) due to less inventory purchases in our Uniform segment and seasonality within some of our businesses. The “Other, net” caption reflects adjustments to net income in the current year and prior year periods related to nonoperating gains and losses, which are primarily non-cash and include goodwill impairments and other financing related charges and write-offs.
During fiscal 2012, the increase in the total of net income and noncash charges results mainly from the overall growth of the business and higher results of operations of the Company, as discussed above. A portion of the net change in cash provided by operating activities was driven by the new accounting treatment for the Company’s accounts receivable securitization agreement. On October 2, 2010, the Company adopted new accounting guidance that affected the presentation of its accounts receivables securitization program, through which the Company sells eligible accounts receivables on a revolving basis. As a result of implementing the new guidance, funding under the agreement of $220.9 million on October 2, 2010 was reflected in the Company’s Consolidated Statement of Cash Flows as a use of cash from the securitization of accounts receivables under net cash provided in operating activities and as a source of cash under net cash (used in) provided by financing activities in fiscal 2011. As expected and consistent with historical patterns, working capital was a source of cash for us during fiscal 2012. The change in working capital requirements relates principally to changes in Accounts Receivable (approximately $66.7 million), primarily due to the improvement and timing of collections offset by the overall growth in the business, Accounts Payable (approximately $57.0 million), due to the timing of disbursements and Prepayments (approximately $41.4 million), primarily due to the timing of income tax payments, partially offset by changes in Inventory (approximately $24.3 million), primarily due to the growth of the business. The increase in the “Other, net” caption is primarily due to $34.9 million of cash distributions received in fiscal 2012 versus $10.5 million in fiscal 2011 from our 50% ownership interest in AIM Services Co., Ltd. The “Other, net” caption also reflects adjustments to net income in the current year and prior year periods related to nonoperating gains and losses.
During fiscal 2011, the increase in the total of net income and noncash charges results mainly from the overall growth of the business and higher results of operations of the Company, as discussed above. Cash flows provided by operating activities include an increase in accounts receivable of $220.9 million associated with the
52
Table of Contents
Company’s adoption of the new authoritative accounting guidance related to the transfer of financial assets in the first quarter of fiscal 2011. Effective October 2, 2010, the periodic transfers of undivided interests in accounts receivable no longer qualify for sale accounting treatment in accordance with the new accounting guidance and are now accounted for as secured borrowings. Cash flows after October 2, 2010 associated with the receivables facility are presented as financing activities. During fiscal 2011, the Company’s accounts receivable increased by $220.9 million resulting in a cash outflow being reported in the operating section of the Consolidated Statement of Cash Flows and the secured borrowings associated with the Receivables Facility increased by $225.9 million resulting in a cash inflow being reported in the financing section of the Consolidated Statement of Cash Flows. As expected, working capital was a use of cash during fiscal 2011. The change in working capital requirements relates principally to changes in Accounts Receivable (approximately $42.6 million), primarily due to the overall growth of the business and timing of collections, Inventory (approximately $44.9 million) due to growth of the business, Accounts Payable (approximately $47.7 million) due to timing of disbursements and Accrued Expenses (approximately $35.7 million) due to the timing of commissions and income tax payments as compared to the prior year period. The “Other, net” caption reflects adjustments to net income related to nonoperating gains and losses.
During fiscal 2010, the increase in the total of net income and noncash charges results mainly from the improved results of operations of the Company. The change in working capital requirements relates principally to changes in Accounts Receivable (approximately $238.8 million), primarily due to the improvement in collection efforts in fiscal 2009 that created a large source of cash, whereas fiscal 2010 has been a normal use of cash, and Inventory (approximately $54.4 million), primarily due to inventory reductions in the Uniform segment and other Company-wide inventory control measures in fiscal 2009, partially offset by changes in Accounts Payable (approximately $149.5 million), due to timing of disbursements, and Accrued Expenses (approximately $43.2 million) due to an increase in accrued commissions and timing of advanced payments. The “Other, net” caption decreased primarily due to $24.2 million of cash distributions received in fiscal 2009 versus $8.2 million in fiscal 2010 from our 50% ownership interest in AIM Services Co., Ltd. and fluctuations in certain noncurrent liabilities (retirement plans and insurance).
Cash Flows Used in Investing Activities
For the nine months ended June 28, 2013, the Company received proceeds of approximately $15.3 million related to the recovery of our investment (possessory interest) in certain assets at one of our NPS sites in our Sports, Leisure and Corrections sector, which was terminated in the current year.
During fiscal 2012, ARAMARK Refreshment Services, LLC, a subsidiary of the Company, acquired all of the outstanding shares of common stock of Van Houtte USA Holdings, Inc. (doing business as “Filterfresh”), a refreshment services company, for approximately $145.2 million. The acquisition was financed with cash on hand and borrowings under the Company’s revolving credit facility. Under the terms of the purchase agreement, if a certain significant customer relationship was not maintained within a specific timeframe, the Company was entitled to a refund of a portion of the purchase price. During fiscal 2012, the Company received a refund of approximately $7.4 million related to the termination of this customer relationship. During fiscal 2012, the Company received $5.5 million in cash related to the settlement of indemnity claims filed against the former owners of Masterplan. During fiscal 2012, the Company received proceeds of approximately $7.3 million related to the recovery of our investment (possessory interest) at one of our NPS sites in our Sports, Leisure and Corrections sector which was terminated in the current year.
During fiscal 2011, ARAMARK Clinical Technology Services, LLC, a subsidiary of the Company, purchased the common stock of the ultimate parent company of Masterplan, a clinical technology management and medical equipment maintenance company, for cash consideration of approximately $154.2 million. During fiscal 2011, the Company completed the sale of its wholly-owned subsidiary, Galls, for approximately $75.0 million in cash. The Company, also during fiscal 2011, completed the sale of the Company’s 67% ownership interest in a security business in its Chilean subsidiary for approximately $11.6 million in cash. During fiscal
53
Table of Contents
2011, the Company received proceeds of $7.8 million related to a compensation agreement signed with the NPS under which the NPS agreed to pay down a portion of our investment (possessory interest) in certain assets at one of our NPS sites in our Sports, Leisure and Corrections sector.
During fiscal 2010, the Company completed the acquisition of the facilities management and property management businesses of Veris plc, an Irish company, for consideration of approximately $74.3 million in cash.
Cash Flows Provided by (Used in) Financing Activities
During the nine months ended June 28, 2013, the Company completed the spin-off of its majority interest in Seamless to its stockholders. In the spin-off, ARAMARK Corporation distributed all of the issued and outstanding shares of the common stock of Seamless Holdings Corporation (“Seamless Holdings”), an entity formed for the purpose of completing the spin-off and whose assets primarily consist of the Company’s former interest in Seamless, to its parent company and sole stockholder, ARAMARK Intermediate Holdco Corporation (“ARAMARK Intermediate”). Thereafter, ARAMARK Intermediate distributed such shares to the Company, its parent company and sole stockholder, who then distributed all of the shares of Seamless Holdings on a pro rata basis to the holders of ARAMARK Holdings common stock as of October 26, 2012, the record date, through a tax-free stock dividend. Each ARAMARK Holdings stockholder received one share of Seamless Holdings common stock for each share of ARAMARK Holdings common stock held as of the record date. The Company distributed cash of approximately $47.4 million to Seamless prior to the spin-off.
On February 22, 2013, ARAMARK Corporation amended the senior secured credit agreement (“Amendment Agreement No. 4”) to provide for, among other things, additional term loans and the extension of a portion of the revolving credit facility. On March 7, 2013, ARAMARK Corporation borrowed $1,400 million of term loans pursuant to Amendment Agreement No. 4. The new term loans were borrowed by ARAMARK Corporation with an original issue discount of 0.50% and mature on September 7, 2019. During the second quarter of fiscal 2013, approximately $14.0 million of third-party costs directly attributable to the term loans borrowed pursuant to Amendment Agreement No. 4 were capitalized and are included in “Other Assets” in the Condensed Consolidated Balance Sheets, of which approximately $6.2 million were paid to entities affiliated with GS Capital Partners and J.P. Morgan Partners. Amendment Agreement No. 4 also provided for the extension, from January 26, 2015 to January 26, 2017, of the maturity of $500 million in revolving lender commitments of the existing $550 million revolving credit facility. Third-party costs directly attributable to the revolving credit facility of approximately $2.8 million were capitalized and are included in “Other Assets” in the Condensed Consolidated Balance Sheets, of which approximately $0.6 million were paid to entities affiliated with GS Capital Partners and J.P. Morgan Partners.
On December 20, 2012, ARAMARK Corporation amended the senior secured credit agreement (“Amendment Agreement No. 3”) to, among other things, borrow $670 million of new term loans with a maturity date of July 26, 2016. The proceeds of the new term loans were used primarily to repay approximately $650 million of existing term loans with a maturity date of January 26, 2014 and to fund certain discounts, fees and costs associated with the amendment. During the first quarter of fiscal 2013, approximately $11.6 million of third-party costs directly attributable to the amendment were expensed and are included in “Interest and Other Financing Costs, net” in the Condensed Consolidated Statements of Income. Approximately $4.6 million of the third-party costs were paid to entities affiliated with GS Capital Partners and J.P. Morgan Partners.
On March 7, 2013, ARAMARK Corporation issued $1,000 million of 5.75% Senior Notes due 2020 (the “Senior Notes”) pursuant to a new indenture, dated as of March 7, 2013 (the “Indenture”), entered into by ARAMARK Corporation. During the second quarter of fiscal 2013, approximately $13.8 million of third-party costs directly attributable to the Senior Notes were capitalized and are included in “Other Assets” in the Condensed Consolidated Balance Sheets. Approximately $7.3 million of the third-party costs were paid to entities affiliated with GS Capital Partners and J.P. Morgan Partners.
54
Table of Contents
In February 2013, ARAMARK Corporation and the Company commenced a tender offer to purchase for cash any and all of the Holdings Notes, the Fixed Rate Notes and the Floating Rate Notes (collectively, the “Notes”). On March 7, 2013, ARAMARK Corporation used a portion of the aggregate proceeds of the Senior Notes offering and the borrowings under the new term loans pursuant to Amendment Agreement No. 4 to purchase all Notes tendered by March 6, 2013, the early tender date. On March 7, 2013, ARAMARK Corporation issued redemption notices for the portions of ARAMARK Corporation’s Fixed Rate Notes and Floating Rate Notes that remained outstanding, including accrued and unpaid interest, as of March 7, 2013, which provided for the redemption of such notes on April 6, 2013 at prices of 100% of the principal amount thereof. On March 7, 2013, the Company issued a redemption notice for the portion of the Holdings Notes that remained outstanding as of March 7, 2013, including accrued and unpaid interest, which notices provided for the redemption of the Holdings Notes on May 1, 2013 at a price of 101% of the principal amount thereof. On March 7, 2013, ARAMARK Corporation and the Company deposited sufficient funds in trust with the trustee under the indenture governing the Notes in full and complete satisfaction and discharge of the remaining aggregate principal amount of such notes, including accrued and unpaid interest (the “Satisfaction and Discharge”). As a result of the Satisfaction and Discharge, the trustee became the primary obligor for payment of the remaining Notes on or about the redemption notice date of March 7, 2013. ARAMARK Corporation and the Company had a contingent obligation for payment of the Notes were the trustee to default on its payment obligations. The Company believed the risk of such default was remote and therefore did not record a related liability. The remaining Fixed Rate Notes and Floating Rate Notes were redeemed by the trustee on April 6, 2013. The remaining Holdings Notes were redeemed by the trustee on May 1, 2013. In connection with the tender offer and Satisfaction and Discharge of the Notes, the Company recorded $39.8 million of charges to “Interest and Other Financing Costs, net” in the Condensed Consolidated Statements of Income for the nine months ended June 28, 2013, consisting of $12.9 million cash charges for the tender offer premium and $26.9 million of non-cash charges for the write-off of deferred financing costs.
During fiscal 2012, the Company’s 5.00% Senior Notes, contractually due in June 2012, were paid in full. The Company, also during fiscal 2012, paid an amendment fee of approximately $3.2 million and third-party costs of approximately $7.5 million related to Amendment Agreement No. 2 to the senior secured credit agreement, which extended the maturity date of an aggregate U.S. dollar equivalent of approximately $1,231.6 million of the Company’s term loans and $66.7 million of letter of credit deposits securing the Company’s synthetic letter of credit facility to July 26, 2016. Approximately $4.5 million of the third-party costs were paid to entities affiliated with GS Capital Partners and J.P. Morgan Partners.
During fiscal 2011, the Company paid commitment fees and third-party costs of approximately $7.2 million, of which approximately $3.9 million were paid to entities affiliated with GS Capital Partners and J.P. Morgan Partners, related to an Amendment Agreement to the senior secured credit agreement that extended, from January 2013 to January 2015, the maturity of, and increased, from $435 million to $500 million, the U.S. dollar denominated portion of its existing revolving credit facility. In addition, during fiscal 2011, the Company paid third-party costs of approximately $14.6 million, of which approximately $8.3 million were paid to entities affiliated with GS Capital Partners and J.P. Morgan Partners, related to the private placement of $600 million, net of a 1% discount, in aggregate principal amount of the Holdings Notes. The Company used the net proceeds from the offering of the Holdings Notes, along with $132.7 million in borrowings under the extended U.S. dollar revolving credit facility, to pay an approximately $711 million dividend to the Company’s stockholders and to pay fees and expenses related to the issuance of the Holdings Notes. During fiscal 2011, the Company sold a noncontrolling ownership interest in Seamless North America, LLC, an online and mobile food ordering service, for consideration of $50.0 million in cash.
In June 2010 and September 2010, the Company made optional prepayments of outstanding un-extended U.S. dollar term loan of $150.0 million and $150.0 million, respectively. In addition, during fiscal 2010, the Company paid consenting lenders a one-time amendment fee of approximately $1.9 million in the aggregate on their total loan commitments and approximately $8.5 million of third-party costs related to the amended and restated senior secured credit agreement, which among other things, (i) extended the maturity date of $1,407.4
55
Table of Contents
million of the Company’s U.S. denominated term loan and $92.6 million of the letter of credit deposits securing the Company’s synthetic letter of credit facility to July 26, 2016, (ii) permits future extensions and refinancings of the maturity date of the Company’s term loans, letter of credit deposits and revolving credit commitments under the Restated Credit Agreement, (iii) establishes a sub-limit of $250 million for letters of credit under the Restated Credit Agreement’s revolving credit facility, and (iv) permits the Company to refinance term loans in the future with the proceeds of unsecured or secured notes issued by the Company; provided that any such secured notes are subject to a customary first- or second-lien intercreditor agreement, as applicable.
Our Indebtedness
Senior Secured Credit Facilities
Our senior secured credit facilities currently provide:
| • | a total of $4,686.8 million in term loan facilities comprised of various tranches denominated in U.S. Dollars, Canadian dollars, euros, yen and pounds sterling; |
| • | a revolving credit facility of up to $605.0 million available for loans denominated in U.S. Dollars, $50.0 million of which is also available in Canadian dollars; and |
| • | a synthetic letter of credit facility of up to $200.0 million. |
The primary borrower under the senior secured credit facilities is ARAMARK Corporation. In addition, certain subsidiaries of ARAMARK Corporation are borrowers under certain tranches of the term loan facility and/or the revolving credit facility. Holdings is not a guarantor under the senior secured credit facilities and is not subject to the covenants or obligations under the senior secured credit agreement.
The revolving credit facility currently consists of the following subfacilities:
| • | a revolving credit facility available for loans in U.S. dollars to ARAMARK Corporation with aggregate commitments of $555.0 million; and |
| • | a revolving credit facility available for loans in Canadian dollars or U.S. dollars to ARAMARK Canada, Ltd. or ARAMARK Corporation with aggregate commitments of $50.0 million. |
The final maturity date of $505.0 million of the $555.0 million U.S. revolving loan commitments and of all of the Canadian revolving loan commitments is January 26, 2017, provided, however, that the maturity date accelerates to April 26, 2016 if any term loans, other than the term loans due September 7, 2019 and any other term loans with a maturity at least 91 days after January 26, 2017, remain outstanding on April 26, 2016. The final maturity date of the $50.0 million of remaining U.S. dollar revolving loan commitments is January 26, 2015.
Our revolving credit facility includes a $250.0 million sublimit for letters of credit and includes borrowing capacity available for short-term borrowings referred to as swingline loans subject to a sublimit.
The senior secured credit facilities provide that we have the right at any time to request up to $675.0 million of incremental commitments in the aggregate under one or more incremental term loan facilities and/or synthetic letter of credit facilities and/or revolving credit facilities and/or by increasing commitments under the revolving credit facility. The lenders under these facilities are not under any obligation to provide any such incremental facilities or commitments, and any such addition of or increase in facilities or commitments will be subject to pro forma compliance with an incurrence-based financial covenant and customary conditions precedent. Our ability to obtain extensions of credit under these incremental facilities or commitments is subject to the same conditions as extensions of credit under the existing credit facilities.
As of June 28, 2013, outstanding term loan borrowings were $4,678.7 million and outstanding revolving credit borrowings were $142.0 million.
56
Table of Contents
Senior Notes
On March 7, 2013, ARAMARK Corporation issued $1,000 million of 5.75% Senior Notes due 2020 (the “senior notes”) pursuant to the indenture, dated as of March 7, 2013 (the “Indenture”), among the ARAMARK Corporation, the guarantors named therein and The Bank of New York Mellon, as trustee.
The senior notes are unsecured obligations of ARAMARK Corporation. The senior notes rank equal in right of payment to all of ARAMARK Corporation’s existing and future senior debt and senior in right of payment to all of ARAMARK Corporation’s existing and future debt that is expressly subordinated in right of payment to the senior notes. Each of the guarantors named in the Indenture (each a “ Senior Notes Guarantor”) is providing an unconditional guarantee of the senior notes which ranks equal in right of payment to all of the senior obligations of such Senior Notes Guarantor. The senior notes and the guarantees are effectively subordinated to ARAMARK Corporation’s existing and future secured debt and that of the Senior Notes Guarantors, including all indebtedness under our senior secured credit facilities, to the extent of the value of the assets securing that indebtedness. The senior notes and guarantees are structurally subordinated to all of the liabilities of any of ARAMARK Corporation’s subsidiaries that do not guarantee the senior notes.
Interest on the senior notes is payable on March 15 and September 15 of each year, commencing on September 15, 2013. Interest on the senior notes will accrue from March 7, 2013. Interest will be calculated on the basis of a 360-day year of twelve 30-day months. The senior notes mature on March 15, 2020.
Holdings does not currently guarantee the senior notes and is not subject to the covenants that apply to ARAMARK Corporation or its restricted subsidiaries under the senior notes. Following completion of this offering, it is intended that Holdings will guarantee the senior notes for purposes of financial reporting, but will not become subject to any covenants under the senior notes.
Receivables Facility
We have in place an agreement whereby ARAMARK Receivables, LLC (“ARAMARK Receivables”), a wholly-owned, bankruptcy-remote subsidiary of ARAMARK Corporation, purchases accounts receivable generated by certain of our operating subsidiaries using funding provided through the sale of an interest in such accounts receivable and other related assets to Wells Fargo Bank, N.A. (“Wells Fargo”) and a commercial paper conduit (the “Commercial Paper Conduit”) sponsored by Coöperatieve Centrale Raiffeisen-Boerenleenbank B.A., New York Branch (“Rabobank”). This receivables facility provides an amount of funding up to a maximum of $300.0 million. The availability of funding under the facility depends on the amount of receivables eligible for funding under the receivables facility and satisfaction of other customary conditions. As of June 28, 2013, we had outstanding borrowings under the receivables facility of $300.0 million.
Availability of funding under the receivables facility depends primarily upon the outstanding accounts receivable balance of our subsidiaries that participate in the facility. Aggregate availability is determined by using a formula that reduces the gross receivables balance by factors that take into account, among other things, historical default and dilution rates, excessive obligor concentrations and average days outstanding and the costs of the facility.
The Commercial Paper Conduit may discontinue funding the receivables facility at any time for any reason. If it does, Rabobank will be obligated to fund the Commercial Paper Conduit’s proportion of the receivables facility.
Twenty-three of our subsidiaries participate in the receivables facility program all of which are domestic subsidiaries in our FSS North America segment.
Covenant Compliance
The senior secured credit agreement contains a number of covenants that, among other things, restrict our ability to: incur additional indebtedness; issue preferred stock or provide guarantees; create liens on assets;
57
Table of Contents
engage in mergers or consolidations; sell assets; pay dividends, make distributions or repurchase our capital stock; make investments, loans or advances; repay or repurchase any notes, except as scheduled or at maturity; create restrictions on the payment of dividends or other amounts to us from our restricted subsidiaries; make certain acquisitions; engage in certain transactions with affiliates; amend material agreements governing the notes (or any indebtedness that refinances the notes); and fundamentally change the Company’s business. The indenture governing our senior notes contains similar provisions. As of June 28, 2013, we were in compliance with these covenants.
Under the senior secured credit agreement and the indenture governing our senior notes we are required to satisfy and maintain specified financial ratios and other financial condition tests and covenants. Our continued ability to meet those financial ratios, tests and covenants can be affected by events beyond our control, and we cannot assure you that we will meet those ratios, tests and covenants.
These financial ratios, tests and covenants involve the calculation of certain measures that we refer to in this discussion as “Covenant EBITDA” and “Covenant Adjusted EBITDA.” Covenant EBITDA and Covenant Adjusted EBITDA are not measurements of financial performance under U.S. GAAP. Covenant EBITDA is defined as net income (loss) of ARAMARK Corporation and its restricted subsidiaries plus interest and other financing costs, net, provision (benefit) for income taxes, and depreciation and amortization. Covenant Adjusted EBITDA is defined as Covenant EBITDA, further adjusted to give effect to adjustments required in calculating covenant ratios and compliance under our senior secured credit agreement and the indenture.
Covenant EBITDA and Covenant Adjusted EBITDA are included in this section to provide additional information to investors about the calculation of certain financial measures in the senior secured credit agreement and the indenture governing our senior notes that are calculated by reference to Covenant Adjusted EBITDA. Our presentation of these measures has limitations as an analytical tool, and should not be considered in isolation or as a substitute for analysis of our results as reported under U.S. GAAP. You should not consider these measures as alternatives to net income or operating income determined in accordance with U.S. GAAP. Covenant EBITDA and Covenant Adjusted EBITDA, as presented by us, may not be comparable to other similarly titled measures of other companies because not all companies use identical calculations.
58
Table of Contents
The following is a reconciliation of net income attributable to ARAMARK Corporation stockholder, which is a U.S. GAAP measure of ARAMARK Corporation’s operating results, to Covenant Adjusted EBITDA as defined in our debt agreements. The terms and related calculations are defined in the senior secured credit agreement and the indenture governing our senior notes. Covenant EBITDA and Covenant Adjusted EBTIDA are measures of ARAMARK Corporation and its restricted subsidiaries only and do not include the results of Holdings.
| (dollars in millions) | Twelve Months Ended June 28, 2013 |
Twelve Months Ended June 29, 2012 |
Twelve Months Ended September 28, 2012 |
Twelve Months Ended September 30, 2011 |
Twelve Months Ended October 1, 2010 |
|||||||||||||||
| Net income attributable to ARAMARK Corporation stockholder |
$ | 130.0 | $ | 113.0 | $ | 138.3 | $ | 100.1 | $ | 30.7 | ||||||||||
| Interest and other financing costs, net |
377.0 | 426.2 | 401.7 | 426.3 | 444.5 | |||||||||||||||
| Provision for income taxes |
37.3 | 14.3 | 38.8 | 9.0 | 0.7 | |||||||||||||||
| Depreciation and amortization |
537.7 | 524.0 | 529.2 | 510.5 | 502.9 | |||||||||||||||
|
|
|
|
|
|
|
|
|
|
|
|||||||||||
| Covenant EBITDA |
1,082.0 | 1,077.5 | 1,108.0 | 1,045.9 | 978.8 | |||||||||||||||
| Share-based compensation expense |
15.4 | 18.1 | 15.7 | 17.3 | 21.3 | |||||||||||||||
| Unusual or non-recurring (gains)/losses(1) |
2.0 | 10.7 | (6.7 | ) | 1.8 | 6.4 | ||||||||||||||
| Pro forma EBITDA for equity method investees(2) |
22.7 | 25.8 | 26.0 | 23.6 | 22.2 | |||||||||||||||
| Pro forma EBITDA for certain transactions(3) |
— | 3.1 | (0.1 | ) | 2.0 | 1.8 | ||||||||||||||
| Seamless North America, LLC EBITDA(4) |
(7.3 | ) | (15.7 | ) | (17.5 | ) | (17.2 | ) | — | |||||||||||
| Other(5) |
58.3 | 16.8 | 10.3 | 26.8 | 5.4 | |||||||||||||||
|
|
|
|
|
|
|
|
|
|
|
|||||||||||
| Covenant Adjusted EBITDA |
$ | 1,173.1 | $ | 1,136.3 | $ | 1,135.7 | $ | 1,100.2 | $ | 1,035.9 | ||||||||||
|
|
|
|
|
|
|
|
|
|
|
|||||||||||
| (1) | The twelve months ended June 28, 2013 includes: goodwill impairment charges in Spain and Korea, asset write-downs mainly related to client contract investments and other income related to the Company’s investments (possessory interest) at two of our terminated National Park Service (“NPS”) client sites. Fiscal 2012 includes other income recognized related to our investment (possessory interest) at one of our NPS sites which was terminated in the prior year. Fiscal 2011 includes the after-tax loss on the sale of our Galls business, the gain on the sale of our 67% ownership interest in a security business in Chile, goodwill and other intangible assets impairment charge and other income related to a compensation agreement signed with the NPS under which the NPS agreed to pay down a portion of our investment (possessory interest) in certain assets at one of our NPS sites. |
| (2) | Represents our estimated share of EBITDA from our AIM Services Co., Ltd. equity method investment not already reflected in Covenant EBITDA. EBITDA for this equity method investee is calculated in a manner consistent with Covenant EBITDA but does not represent cash distributions received from this investee. |
| (3) | Represents the annualizing of estimated EBITDA from acquisitions and divestitures made during the period. |
| (4) | During fiscal 2011, the Company sold a noncontrolling ownership interest in Seamless North America, LLC. In connection with the sale, we designated Seamless North America, LLC as an Unrestricted Subsidiary under the senior secured credit agreement, and as a result, its EBITDA for all periods presented are excluded from Covenant Adjusted EBITDA. |
| (5) | Other includes certain other miscellaneous items (primarily severance related expenses). |
59
Table of Contents
Our covenant requirements and actual ratios for the twelve months ended June 28, 2013 are as follows:
| Covenant Requirements |
Actual Ratios |
|||||||
| Maximum Consolidated Secured Debt Ratio(1) |
5.75x | 4.35x | ||||||
| Interest Coverage Ratio (Fixed Charge Coverage Ratio)(2) |
2.00x | 3.46x | ||||||
| (1) | Our senior secured credit agreement requires us to maintain a maximum Consolidated Secured Debt Ratio, defined as consolidated total indebtedness secured by a lien to Covenant Adjusted EBITDA, of 5.875x, being reduced over time to 5.125x by the end of 2016. Consolidated total indebtedness secured by a lien is defined in the senior secured credit agreement as total indebtedness outstanding under the senior secured credit agreement, capital leases, advances under the receivables facility and any other indebtedness secured by a lien reduced by the lesser of the amount of cash and cash equivalents on our balance sheet that is free and clear of any lien and $75 million. Non-compliance with the maximum Consolidated Secured Debt Ratio could result in the requirement to immediately repay all amounts outstanding under such agreement, which, if the Company’s revolving credit facility lenders failed to waive any such default, would also constitute a default under our indenture. |
| (2) | Our senior secured credit agreement establishes an incurrence-based minimum Interest Coverage Ratio, defined as Covenant Adjusted EBITDA to consolidated interest expense, the achievement of which is a condition for us to incur additional indebtedness and to make certain restricted payments. If we do not maintain this minimum Interest Coverage Ratio calculated on a pro forma basis for any such additional indebtedness or restricted payments, we could be prohibited from being able to incur additional indebtedness, other than the additional funding provided for under the senior secured credit agreement and pursuant to specified exceptions, and make certain restricted payments, other than pursuant to certain exceptions. The minimum Interest Coverage Ratio is 2.00x for the term of the senior secured credit agreement. Consolidated interest expense is defined in the senior secured credit agreement as consolidated interest expense excluding interest income, adjusted for acquisitions and dispositions, further adjusted for certain non-cash or nonrecurring interest expense and our estimated share of interest expense from one equity method investee. The indenture governing our senior notes includes a similar requirement which is referred to as a Fixed Charge Coverage Ratio. |
The Company and its subsidiaries, affiliates or significant stockholders may from time to time, in their sole discretion, purchase, repay, redeem or retire any of the Company’s outstanding debt securities (including any publicly issued debt securities), in privately negotiated or open market transactions, by tender offer or otherwise, or extend or refinance any of the Company’s outstanding indebtedness.
60
Table of Contents
Contractual Obligations
The following table summarizes the Company’s future obligations for debt repayments, capital leases, estimated interest payments, future minimum rental and similar commitments under noncancelable operating leases as well as contingent obligations related to outstanding letters of credit and guarantees as of September 28, 2012 (dollars in thousands):
| Payments Due by Period | ||||||||||||||||||||
| Contractual Obligations as of September 28, 2012 | Total | Less than 1 year |
1-3 years | 3-5 years | More than 5 years |
|||||||||||||||
| Long-term borrowings(1)(5) |
$ | 5,963,697 | $ | 26,187 | $ | 2,743,119 | $ | 3,194,391 | $ | — | ||||||||||
| Capital lease obligations(5) |
49,584 | 11,275 | 21,441 | 10,571 | 6,297 | |||||||||||||||
| Estimated interest payments(2)(5) |
927,000 | 317,900 | 490,200 | 118,900 | — | |||||||||||||||
| Operating leases |
583,068 | 205,009 | 163,898 | 112,137 | 102,024 | |||||||||||||||
| Purchase obligations(3) |
254,593 | 135,277 | 74,900 | 10,607 | 33,809 | |||||||||||||||
| Other long-term liabilities reflected on the balance sheet(4) |
261,500 | 7,200 | 9,700 | 5,300 | 239,300 | |||||||||||||||
|
|
|
|
|
|
|
|
|
|
|
|||||||||||
| $ | 8,039,442 | $ | 702,848 | $ | 3,503,258 | $ | 3,451,906 | $ | 381,430 | |||||||||||
|
|
|
|
|
|
|
|
|
|
|
|||||||||||
| Total Amounts Committed |
Amount of Commitment Expiration Per Period | |||||||||||||||||||
| Other Commercial Commitments as of September 28, 2012 | Less than 1 year |
1-3 years | 3-5 years | More than 5 years |
||||||||||||||||
| Letters of credit |
$ | 181,729 | $ | 181,729 | $ | — | $ | — | $ | — | ||||||||||
| Guarantees |
— | — | — | — | — | |||||||||||||||
|
|
|
|
|
|
|
|
|
|
|
|||||||||||
| $ | 181,729 | $ | 181,729 | $ | — | $ | — | $ | — | |||||||||||
|
|
|
|
|
|
|
|
|
|
|
|||||||||||
| (1) | Excludes the $4.5 million discount on the Holdings Notes and presumes repayment of the $1.28 billion of the Fixed Rate Notes and $500 million of the Floating Rate Notes by October 31, 2014 and the extended $2.6 billion U.S. and non-U.S. denominated term loan on July 26, 2016. |
| (2) | These amounts represent future interest payments related to our existing debt obligations based on fixed and variable interest rates specified in the associated debt agreements. Payments related to variable debt are based on applicable rates at September 28, 2012 plus the specified margin in the associated debt agreements for each period presented. The amounts provided relate only to existing debt obligations and do not assume the refinancing or replacement of such debt. The average debt balance for each fiscal year from 2013 through 2016 is $5,678,300, $5,235,500, $3,802,700, and $2,555,200, respectively. The average interest rate (after giving effect to interest rate swaps) for each fiscal year from 2013 through 2016 is 5.60%, 5.59%, 5.12% and 4.49%, respectively. Refer to Note 5 to the consolidated financial statements for the terms and maturities of existing debt obligations. |
| (3) | Represents commitments for capital projects and client contract investments to help finance improvements or renovations at the facilities from which the Company operates. |
| (4) | Includes certain unfunded employee retirement obligations. |
61
Table of Contents
| (5) | During the second quarter of fiscal 2013, the Company had a material change to its debt structure in which the Company replaced the Holding Notes, the Fixed Rate Notes and the Floating Notes with $1,400 million of new term loan borrowings and the issuance of $1,000 million of 5.75% Senior Notes due 2020. The below table provides the effect of this debt refinancing on the Company’s future debt payments (excluding the original debt discounts on the senior secured term loan facilities) and estimated interest payments as of June 28, 2013 (in thousands): |
| Payments Due by Period | ||||||||||||||||||||
| As of June 28, 2013 | Total | Less than 1 year |
1-3 years | 3-5 years | More than 5 years |
|||||||||||||||
| Long-term borrowings |
$ | 6,170,935 | $ | 59,006 | $ | 400,580 | $ | 3,374,349 | $ | 2,337,000 | ||||||||||
| Capital lease obligations |
54,248 | 12,133 | 16,269 | 13,131 | 12,715 | |||||||||||||||
| Estimated interest payments |
1,215,200 | 260,100 | 500,100 | 295,000 | 160,000 | |||||||||||||||
The Company has excluded from the table above uncertain tax liabilities due to the uncertainty of the amount and period of payment. As of September 28, 2012, the Company has gross uncertain tax liabilities of $32.0 million (see Note 8 to our consolidated financial statements). During fiscal 2012, the Company made contributions totaling $20.6 million into our defined benefit pension plans and benefit payments of $11.7 million out of these plans. Estimated contributions to our defined benefit pension plans in fiscal 2013 are $20.8 million and estimated benefit payments out of these plans in fiscal 2013 are $11.7 million (see Note 7 to our consolidated financial statements).
Pursuant to the Stockholders Agreement dated January 26, 2007, as amended (the “Stockholders Agreement”), upon termination of employment from the Company or one of its subsidiaries, members of the Company’s management (other than Mr. Neubauer) who hold shares of common stock can cause the Company to repurchase all of their initial investment shares (as defined) or shares acquired as a result of the exercise of installment stock purchase opportunities at appraised fair market value. Generally, payment for shares repurchased could be, at the Company’s option, in cash or installment notes. The amount of common stock subject to repurchase as of June 28, 2013 and September 28, 2012 was $153.6 million and $167.5 million, which is based on approximately 9.5 million and 11.0 million shares of common stock valued at $16.21 and $15.17 per share, respectively. The Stockholders Agreement, the senior secured credit agreement and the indenture governing our senior notes contain limitations on the amount that can be expended for such share repurchases.
The Company’s business activities do not include the use of unconsolidated special purpose entities, and there are no significant business transactions that have not been reflected in the accompanying financial statements. The Company is self-insured for a limited portion of the risk retained under its general liability and workers’ compensation arrangements. Self-insurance reserves are recorded based on actuarial analyses.
Critical Accounting Policies and Estimates
The Company’s significant accounting policies are described in the notes to the consolidated financial statements included in this prospectus. As described in such notes, the Company recognizes sales in the period in which services are provided pursuant to the terms of our contractual relationships with our clients. Sales from direct marketing activities are recognized upon shipment.
In preparing our financial statements, management is required to make estimates and assumptions that, among other things, affect the reported amounts of assets, liabilities, sales and expenses. These estimates and assumptions are most significant where they involve levels of subjectivity and judgment necessary to account for highly uncertain matters or matters susceptible to change, and where they can have a material impact on our financial condition and operating performance. We discuss below the more significant estimates and related assumptions used in the preparation of our consolidated financial statements. If actual results were to differ materially from the estimates made, the reported results could be materially affected.
62
Table of Contents
Asset Impairment Determinations
Goodwill and the ARAMARK trade name are indefinite-lived intangible assets that are not amortizable and are subject to an impairment test that we conduct annually or more frequently if a change in circumstances or the occurrence of events indicates that potential impairment exists, using discounted cash flows. The Company performs its assessment of goodwill at the reporting unit level. Within the FSS International segment, each country is evaluated separately since such operating units are relatively autonomous and separate goodwill balances have been recorded for each entity. The Company completed its annual goodwill and trade names impairment tests for fiscal 2012, which did not result in an impairment charge. While at the date of our annual goodwill impairment test the estimated fair value of each reporting unit exceeded its corresponding carrying amount, including goodwill, a prolonged economic decline in certain of the European countries in which we operate could put the Company at risk of not achieving future growth assumptions, which could result in an impairment of goodwill or other long-lived assets within the FSS International segment. During the second quarter of fiscal 2013, the Company recorded an impairment charge of approximately $11.7 million in the FSS International segment to write-off all of the goodwill associated with its reporting units in Spain and Korea. The impairment charge results from continued economic weakness in Spain and recent reductions in government support for the Healthcare and Education sectors, two of the primary sectors of the Spanish reporting unit. In Korea, the Company undertook a recent strategic analysis of the Korean reporting unit, which prompted the impairment analysis in the second quarter.
With respect to our other long-lived assets, we are required to test for asset impairment whenever events or circumstances indicate that the carrying value of an asset may not be recoverable. If indicators of impairment are present, the Company compares the sum of the future expected cash flows from the asset, undiscounted and without interest charges, to the asset’s carrying value. If the sum of the future expected cash flows from the asset is less than the carrying value, an impairment would be recognized for the difference between the estimated fair value and the carrying value of the asset.
In making future cash flow analyses of various assets, the Company makes assumptions relating to the following:
| • | the intended use of assets and the expected future cash flows resulting directly from such use; |
| • | comparable market valuations of businesses similar to ARAMARK’s business segments; |
| • | industry specific economic conditions; |
| • | competitor activities and regulatory initiatives; and |
| • | client and consumer preferences and behavior patterns. |
We believe that an accounting estimate relating to asset impairment is a critical accounting estimate because the assumptions underlying future cash flow estimates are subject to change from time to time and the recognition of an impairment could have a significant impact on our consolidated statement of income.
Environmental Loss Contingencies
Accruals for environmental loss contingencies (i.e., environmental reserves) are recorded when it is probable that a liability has been incurred and the amount can reasonably be estimated. Management views the measurement of environmental reserves as a critical accounting estimate because of the considerable uncertainty surrounding estimation, including the need to forecast well into the future. We are involved in legal proceedings under federal, state, local and foreign environmental laws in connection with our operations or businesses conducted by our predecessors or companies that we have acquired. The calculation of environmental reserves is based on the evaluation of currently available information, prior experience in the remediation of contaminated sites and assumptions with respect to government regulations and enforcement activity, changes in remediation technology and practices, and financial obligations and creditworthiness of other responsible parties and insurers.
63
Table of Contents
Litigation and Claims
From time to time, the Company and its subsidiaries are party to various legal actions, proceedings and investigations involving claims incidental to the conduct of their business, including those brought by clients, consumers, employees, government entities and third parties under, among others, federal, state, international, national, provincial and local employment laws, wage and hour laws, discrimination laws, immigration laws, human health and safety laws, import and export controls and customs laws, environmental laws, false claims or whistleblower statutes, minority, women and disadvantaged business enterprise statutes, tax codes, antitrust and competition laws, consumer protection statutes, procurement regulations, intellectual property laws, food safety and sanitation laws, cost and accounting principles, the Foreign Corrupt Practices Act, the U.K. Bribery Act, other anti-corruption laws, lobbying laws, motor carrier safety laws, data privacy laws and alcohol licensing and service laws, or alleging negligence and/or breaches of contractual and other obligations. Management considers the measurement of litigation reserves as a critical accounting estimate because of the significant uncertainty in some cases relating to the outcome of potential claims or litigation and the difficulty of predicting the likelihood and range of potential liability involved, coupled with the material impact on our results of operations that could result from litigation or other claims. In determining legal reserves, management considers, among other issues:
| • | interpretation of contractual rights and obligations; |
| • | the status of government regulatory initiatives, interpretations and investigations; |
| • | the status of settlement negotiations; |
| • | prior experience with similar types of claims; |
| • | impact to the Company’s brand or reputation; |
| • | whether there is available insurance; and |
| • | advice of counsel. |
Allowance for Doubtful Accounts
We encounter risks associated with sales and the collection of the associated accounts receivable. We record a provision for accounts receivable that are considered to be uncollectible. In order to calculate the appropriate provision, management analyzes the creditworthiness of specific clients and the aging of client balances. Management also considers general and specific industry economic conditions, industry concentrations, such as exposure to small and medium-sized businesses, the non-profit healthcare sector and the automotive, airline and financial services industries, and contractual rights and obligations. Management believes that the accounting estimate related to the allowance for doubtful accounts is a critical accounting estimate because the underlying assumptions used for the allowance can change from time to time and uncollectible accounts could potentially have a material impact on our results of operations.
Inventory Obsolescence
We record an inventory obsolescence reserve for obsolete, excess and slow-moving inventory, principally in the Uniform segment. In calculating our inventory obsolescence reserve, management analyzes historical and projected data regarding client demand within specific product categories and makes assumptions regarding economic conditions within client specific industries, as well as style and product changes. Management believes that its accounting estimate related to inventory obsolescence is a critical accounting estimate because client demand in certain of our businesses can be variable and changes in our reserve for inventory obsolescence could materially affect our results of operations.
Income Taxes
We use the asset and liability method of accounting for income taxes. Under this method, income tax expense is recognized for the amount of taxes payable or refundable for the current year and for deferred tax liabilities and assets for the future tax consequences of events that have been recognized in our consolidated financial statements or tax returns. We must make assumptions, judgments and estimates to determine our
64
Table of Contents
current provision for income taxes and also our deferred tax assets and liabilities and any valuation allowance to be recorded against a deferred tax asset. Our assumptions, judgments and estimates relative to the current provision for income taxes take into account current tax laws, our interpretation of current tax laws and possible outcomes of current and future audits conducted by foreign and domestic tax authorities. Changes in tax law or our interpretation of tax laws and the resolution of current and future tax audits could significantly impact the amounts provided for income taxes in our consolidated financial statements. Our assumptions, judgments and estimates relative to the amount of deferred income taxes take into account estimates of the amount of future taxable income, and actual operating results in future years could render our current assumptions, judgments and estimates inaccurate. Any of the assumptions, judgments and estimates mentioned above could cause our actual income tax obligations to differ from our estimates.
Share-Based Compensation
Under the ARAMARK Holdings Corporation 2007 Management Stock Incentive Plan, as amended (the “Plan”), incentive awards may be granted to employees or directors of, or consultants to, the Company or one of its affiliates in the form of non-qualified stock options (time- and performance-based), installment stock purchase opportunities (“ISPOs”) and deferred stock units (only to non-employee directors). In June 2013, the Plan was amended and now additionally provides for the grant of restricted stock units and restricted stock. The compensation committee also approved a new form of non-qualified stock option award agreement which provides for 100% time-based vesting rather than earlier forms of non-qualified discretionary stock option agreements which had provided for 50% time-based vesting and 50% performance-based vesting. Finally, in June 2013, the Company offered to holders of outstanding ISPOs the ability to exchange such awards for restricted stock and non-qualified stock options (the “Award Exchange”).
We value our non-qualified stock option and ISPO awards using the Black-Scholes option valuation model. The Black-Scholes option valuation model uses assumptions of expected volatility, the expected dividend yield of our stock, the expected term of the awards and the risk-free interest rate, as well as our estimated fair value of our common stock. Since our stock has not been publicly traded, the expected volatility is based on an average of the historical volatility of our competitors’ stocks over the expected term of the share-based awards. The dividend yield assumption is based on our history and expected future dividend payouts, excluding dividends that resulted from activities we deemed to be one-time in nature. The expected term of share-based awards represents the weighted-average period the share-based award is expected to remain outstanding. The expected term was calculated using the simplified method, as permitted under SEC rules and regulations due to the lack of history, which uses the midpoint between an option’s vesting date and contractual term. The risk-free interest rate assumption is based upon the rate applicable to the U.S. Treasury security with a maturity equal to the expected term of the option on the grant date. All other employee share-based awards and non-employee director awards are valued based on the fair value of our common stock on the date of grant.
Share-based compensation expense is recognized in our results of operations for the awards that are expected to vest. For time-based options, restricted stock and restricted stock units, share-based compensation expense is recognized over the period during which an employee is required to provide service in exchange for the award, usually the vesting period. For performance-based options, management must assess the probability of the achievement of the earnings before interest and taxes (“EBIT”) targets, as defined in the Plan. If the EBIT targets are not probable of achievement, changes in the recognition of share-based compensation expense may occur. Management makes its probability assessments based on the Company’s actual and projected results of operations. As share-based compensation expense recognized in the Company’s results of operations is based on awards ultimately expected to vest, it has been reduced for estimated forfeitures. Forfeitures are estimated at the time of each grant and revised, if necessary, in subsequent periods if actual forfeitures differ from those estimates. Forfeitures were estimated based on our historical experience.
65
Table of Contents
For the nine months ended June 28, 2013 and June 29, 2012, share-based compensation expense was approximately $12.3 million and $12.5 million, respectively. During fiscal 2012, fiscal 2011 and fiscal 2010, share-based compensation expense was approximately $15.7 million, $17.3 million and $21.3 million, respectively. We expect to continue to grant share-based awards in the future, and to the extent that we do, our actual share-based compensation expense recognized will likely increase.
Valuation of our Common Stock
The following table presents the grant dates, timing of valuations performed relative to the date of grant and the number of underlying shares and related exercise prices of awards granted to employees and non-employee directors of the Company, from June 1, 2012 through the date of this filing, as well as the estimated fair value of the underlying common stock per share on the grant date.
| Grant Date | Date of Valuation | Number of Options Granted |
Original Exercise Price |
Fair Value per share of Common Stock |
||||||||||
| June 2, 2012(a) |
June 1, 2012 |
3,340 | $ | 14.96 | ||||||||||
| June 6, 2012 |
June 1, 2012 |
2,040,000 | $ | 14.96 | $ | 14.96 | ||||||||
| September 5, 2012 |
September 1, 2012 |
150,000 | $ | 15.17 | $ | 15.17 | ||||||||
| October 29, 2012(a) |
September 1, 2012 |
17,066 | $ | 14.23 | ||||||||||
| December 5, 2012 |
December 1, 2012 |
1,150,000 | $ | 14.99 | $ | 14.99 | ||||||||
| March 2, 2013(a) |
March 1, 2013 |
25,396 | $ | 15.75 | ||||||||||
| March 7, 2013 |
March 1, 2013 |
125,000 | $ | 15.75 | $ | 15.75 | ||||||||
| June 20, 2013 |
June 1, 2013 |
1,247,638 | $ | 16.21 | $ | 16.21 | ||||||||
| June 20, 2013(b) |
June 1, 2013 |
271,438 | $ | 16.21 | ||||||||||
| July 9, 2013 |
June 1, 2013 |
3,059,626 | $ | 16.21 | $ | 16.21 | ||||||||
| July 9, 2013(b) |
June 1, 2013 |
975,618 | $ | 16.21 | ||||||||||
| July 31, 2013(c) |
June 1, 2013 |
1,108,738 | $ | 16.21 | $ | 16.21 | ||||||||
| July 31, 2013(c) |
June 1, 2013 |
225,262 | $ | 16.21 | ||||||||||
| September 4, 2013 |
September 1, 2013 |
80,341 | $ | 16.88 | $ | 16.88 | ||||||||
| September 4, 2013(b) |
September 1, 2013 |
26,219 | $ | 16.88 | ||||||||||
| (a) | Represents Deferred Stock Units issued to non-employee members of the board of directors. Value of deferred stock units is based on the fair value of the Company's common stock on date of grant. |
| (b) | Represents grants of restricted stock units. |
| (c) | As a result of the Award Exchange, a total of 1,334,000 outstanding ISPOs were exchanged for 225,262 restricted stock awards and 1,108,738 replacement stock option awards. The offer to holders of outstanding ISPOs relating to the Award Exchange commenced on June 28, 2013 and, following an offer period of 20 business days, the Award Exchange was completed on July 31, 2013. |
For each award grant, a contemporaneous valuation (within the meaning of such term under the American Institute of Certified Public Accountants (the “AICPA”) Practice Aid) was performed. At each grant date, the applicable committee of the board of directors considered whether any events or circumstances occurred between the date of the valuation and the date of the grant that would indicate a significant change in the fair value of our common stock per share during that period. The decline in market value from September 5, 2012 to October 29, 2012 was a result of the spin-off of our majority interest in Seamless North America, LLC, an online and mobile food ordering service, to our stockholders in the form of a dividend. Each stockholder received one share of Seamless Holdings, a newly formed company created to hold our former interest in Seamless North America, LLC, for each share of our common stock held as of the record date.
We have been a private company with no active public market for our common stock. Management, with authority delegated by the board of directors, estimates the fair value of our common stock per share, which includes consideration of a contemporaneous valuation by an independent third-party valuation firm in accordance with the guidelines outlined in the AICPA Practice Aid, Valuation of Privately-Held Company Equity Securities Issued as Compensation. A valuation of the Company’s common stock per share is performed on a regular quarterly
66
Table of Contents
basis as of the beginning of the month when share-based awards are expected to be granted. Our valuations consider a number of objective and subjective factors that we believe market participants would consider, including understanding the financial condition, future prospects and projected operations of the Company, a review of the history and nature of the Company, a review of the financial data bearing upon recent and prospective operations, a review of certain other publicly available financial data for certain companies deemed comparable to the Company and capital market information deemed relevant to the assessment of the investment risk return attributes of the Company’s common stock. In making a determination of the fair value of common stock per share, the Company considers the independent third-party valuation firm’s utilization of the market-comparable approach and the income approach. The market-comparable approach estimates the value of a company by applying market multiples of publicly traded companies in the same or similar lines of business to the results and projected results of the company being valued. The income approach involves applying an appropriate risk-adjusted discount rate to projected cash flows based on forecasted sales and costs. When estimating an enterprise value at each valuation date and the corresponding value of the common stock per share, the Company equally weights the market-comparable approach and income approach.
Management believes that the accounting estimate related to the expense of share-based awards is a critical accounting estimate because the underlying assumptions can change from time to time and, as a result, the compensation expense that we record in future periods may differ significantly from what we have recorded in the current period with respect to similar instruments.
Fair Value of Financial Assets and Financial Liabilities
Fair value is defined as the price that would be received to sell an asset or paid to transfer a liability in an orderly transaction between market participants at the measurement date. Assets and liabilities recorded at fair value are classified based upon the level of judgment associated with the inputs used to measure their fair value. The hierarchical levels related to the subjectivity of the valuation inputs are defined as follows:
| • | Level 1—inputs to the valuation methodology are quoted prices (unadjusted) for identical assets or liabilities in active markets |
| • | Level 2—inputs to the valuation methodology include quoted prices for similar assets and liabilities in active markets, and inputs that are observable for the asset or liability, either directly or indirectly, for substantially the full term of the financial instrument |
| • | Level 3—inputs to the valuation methodology are unobservable and significant to the fair value measurement |
Management believes that the carrying value of cash and cash equivalents, accounts receivable and accounts payable are representative of their respective fair values. The fair value of the Company’s debt was computed using market quotes, if available, or based on discounted cash flows using market interest rates as of the end of the period. The fair values for interest rate swap agreements, foreign currency forward exchange contracts and natural gas, gasoline and diesel fuel agreements are based on quoted market prices from various banks for similar instruments, adjusted for the Company and the counterparties’ credit risk. The Company performs an independent review of these values to determine if they are reasonable. The fair value of our derivative instruments are impacted by changes in interest rates, foreign exchange rates, and the prices of natural gas, gasoline and diesel fuel. The fair value of our common stock subject to repurchase is derived principally from unobservable inputs. Management believes that the accounting estimate related to the fair value of our financial assets and financial liabilities is a critical accounting estimate due to its complexity and the significant judgments and estimates involved in determining fair value in the absence of quoted market prices.
*****
Critical accounting estimates and the related assumptions are evaluated periodically as conditions warrant, and changes to such estimates are recorded as new information or changed conditions require.
67
Table of Contents
New Accounting Standard Updates
See Note 13 to our unaudited condensed consolidated financial statements for a full description of recent accounting standard updates, including the expected dates of adoption.
Quantitative and Qualitative Disclosure About Market Risk
We are exposed to the impact of interest rate changes and manage this exposure through the use of variable-rate and fixed-rate debt and by utilizing interest rate swaps. We do not enter into contracts for trading purposes and do not use leveraged instruments. The information below summarizes our market risks associated with debt obligations and other significant financial instruments as of June 28, 2013 (See Notes 6 and 7 to our unaudited condensed consolidated financial statements). Fair values were computed using market quotes, if available, or based on discounted cash flows using market interest rates as of the end of the respective periods. For debt obligations, the table presents principal cash flows and related interest rates by contractual fiscal year of maturity. Variable interest rates disclosed represent the weighted-average rates of the portfolio at June 28, 2013. For interest rate swaps, the table presents the notional amounts and related weighted-average interest rates by the fiscal year of maturity. The variable rates presented are the average forward rates for the term of each contract.
| Expected Fiscal Year of Maturity | ||||||||||||||||||||||||||||||||
| As of June 28, 2013 |
2013 | 2014 | 2015 | 2016 | 2017 | Thereafter | Total | Fair Value | ||||||||||||||||||||||||
| (US$ equivalent in millions) | ||||||||||||||||||||||||||||||||
| Debt: |
||||||||||||||||||||||||||||||||
| Fixed rate |
$ | 3 | $ | 15 | $ | 10 | $ | 7 | $ | 6 | $ | 1,013 | (a) | $ | 1,054 | $ | 1,074 | |||||||||||||||
| Average interest rate |
5.0 | % | 5.0 | % | 5.0 | % | 5.0 | % | 5.0 | % | 5.7 | % | 5.7 | % | ||||||||||||||||||
| Variable rate |
$ | 28 | (b) | $ | 43 | (b) | $ | 350 | (b)(c) | $ | 3,246 | (b) | $ | 156 | (b)(d) | $ | 1,348 | (b) | $ | 5,171 | $ | 5,161 | ||||||||||
| Average interest rate |
8.9 | % | 4.4 | % | 2.0 | % | 3.8 | % | 4.5 | % | 4.0 | % | 3.8 | % | ||||||||||||||||||
| Interest Rate Swaps: |
||||||||||||||||||||||||||||||||
| Receive variable/pay fixed |
$ | 582 | $ | 574 | $ | 150 | $ | 150 | $ | 1,456 | $ | (54 | ) | |||||||||||||||||||
| Average pay rate |
3.5 | % | 2.8 | % | 1.0 | % | 1.6 | % | ||||||||||||||||||||||||
| Average receive rate |
0.3 | % | 0.3 | % | 0.3 | % | 0.3 | % | ||||||||||||||||||||||||
| (a) | Balance includes $1,000 million of senior notes callable by us at any time with any applicable prepayment penalty. |
| (b) | Balance includes $35 million for fiscal 2014, $47 million for fiscal 2015, $3,243 million for fiscal 2016, $14 million for fiscal 2017 and $1,348 million thereafter of senior secured term loan facilities callable by us at any time. |
| (c) | Balance includes $300 million of borrowings under the receivables facility. |
| (d) | Balance includes $142 million of senior secured revolving credit facility. |
As of June 28, 2013, the Company had foreign currency forward exchange contracts outstanding with notional amounts of €88.4 million, and £44.2 million to mitigate the risk of changes in foreign currency exchange rates on short-term intercompany loans to certain international subsidiaries. As of June 28, 2013, the fair value of these foreign exchange contracts is $1.2 million, which is included in “Prepayments and Other Current Assets” in our unaudited Condensed Consolidated Balance Sheets.
The Company entered into a series of pay fixed/receive floating gasoline and diesel fuel agreements based on the Department of Energy weekly retail on-highway index in order to limit its exposure to price fluctuations for gasoline and diesel fuel. As of June 28, 2013, the Company has contracts for approximately 1.3 million gallons outstanding for fiscal 2013 and fiscal 2014. As of June 28, 2013, the fair value of the Company’s gasoline and diesel fuel hedge agreements is $0.1 million, which is included in “Prepayments and Other Current Assets” in our unaudited Condensed Consolidated Balance Sheets.
68
Table of Contents
Our Company
We are a leading global provider of food, facilities and uniform services to education, healthcare, business and industry, and sports, leisure and corrections clients. Our core market is North America, which is supplemented by an additional 19-country footprint serving many of the fastest growing global geographies. We hold the #2 position in North America, a top 3 position in countries representing 98% of 2012 total sales, and are one of only 3 food and facilities competitors with the combination of scale, scope, and global reach. Through our established brand, broad geographic presence and approximately 267,000 employees, we anchor our business in our partnerships with thousands of education, healthcare, business, sports, leisure and corrections clients. Through these partnerships we serve millions of consumers including students, patients, employees, sports fans and guests worldwide. The scope and range of ARAMARK’s services are evidenced by the following:
| • | We provide services to 84% of the Fortune 500 |
| • | We serve over 500 million meals annually to approximately 5 million students at colleges, universities, and K-12 schools |
| • | We service over 2,000 healthcare facilities, collectively representing over 75 million patient days annually |
| • | We cater to approximately 100 million sports fans annually through our partnerships with over 150 professional and collegiate teams |
| • | We serve approximately 50 million visitors annually to convention centers, national and state parks |
| • | We maintain and enhance the environment in over 800 million square feet of client facility space |
| • | We put over 2 million people in uniforms each day |
| • | We operate in 22 countries in North America, Europe, Asia and South America |
| • | We provide refreshment services to over 100,000 offices in North America |
| • | We provide food and commissary services to correctional facilities housing over 250,000 inmates |
| • | We provide food and facilities services to over 160 mining and off-shore and in-shore oil & gas drilling operations around the world |
We operate our business in three reportable segments that share many of the same operating characteristics: FSS North America, FSS International and Uniform. Both FSS North America and Uniform have significant scale and hold the #2 position in North America while all of our reportable segments hold a top 3 position in countries representing 98% of 2012 total sales. The following chart shows a breakdown of our sales and operating income by our reportable segments:
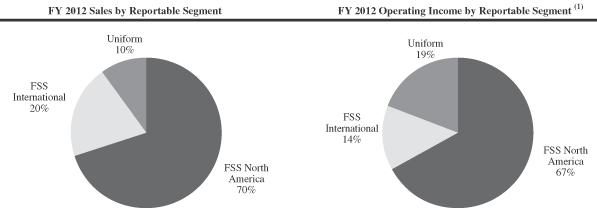
| (1) | Fiscal 2012 operating income excludes $51.8 million of unallocated corporate expenses. |
69
Table of Contents
Our broad range of services, diversified client base, global reach and repeatable business model position us well for continued growth and margin expansion opportunities. In fiscal 2012, we generated $13.5 billion of sales, $581.8 million of operating income, $750.0 million of Adjusted Operating Income and $1.1 billion of Adjusted EBITDA.
Our Mission
ARAMARK’s mission is to “Deliver experiences that enrich and nourish lives.” This mission is anchored in a set of core values that guide our execution in the marketplace:
| • | Sell and Serve with Passion. Placing clients and consumers at the center of all that we do by listening and responding to their needs with best-in-class quality, innovation and exceptional service |
| • | Set Goals. Act. Win. Maintaining a culture of accountability where performance matters and exhibiting leadership that achieves and exceeds expectations through industry-leading execution |
| • | Front-Line First. Providing our front-line employees with tools and training that empower them to deliver excellence at the “moment of truth” —at the time they are providing service to thousands of consumers and clients every day |
| • | Integrity and Respect Always. Doing the right things without exception is the cornerstone of the ARAMARK brand and helps us earn the trust of our key constituents |
ARAMARK is a well-recognized global brand, known for exceptional customer service and a compelling value proposition. We partner with clients on-site and integrate our employees within their operations, which enables us to obtain valuable consumer insights and innovate to satisfy each client’s unique needs and requirements. Our repeatable business model is founded on five core principles of excellence—selling, service, execution, marketing and operations—that allow us to deliver high quality service consistent with the values that the ARAMARK brand embodies. Our commitment to excellence has earned us numerous awards and recognitions; we have been named one of the “World’s Most Admired Companies” by Fortune Magazine every year since 1999 and we are recognized as one of the “World’s Most Ethical Companies” by the Ethisphere Institute.
Our History and Recent Accomplishments
Since ARAMARK’s founding in 1959, we have broadened our service offerings and expanded our client base through a combination of organic growth and successful acquisitions, with the goal of further developing our food, facilities and uniform capabilities, as well as growing our international presence.
In 1984, we completed a management buyout, after which our management and employees increased their Company ownership to approximately 90% of our equity capital leading up to our December 2001 public offering.
On January 26, 2007, ARAMARK delisted from the NYSE in conjunction with a going-private transaction executed with investment funds affiliated with GS Capital Partners, CCMP Capital Advisors, J.P. Morgan Partners, Thomas H. Lee Partners and Warburg Pincus LLC as well as approximately 250 senior management personnel.
In May 2012, Eric Foss became the new CEO and President of our company. Previously, Mr. Foss was the CEO of Pepsi Beverages Company and was Chairman and CEO of the publicly-traded Pepsi Bottling Group. During his tenure with Pepsi Bottling Group, Mr. Foss implemented numerous growth and productivity initiatives designed to strengthen customer service and improve selling effectiveness, streamline operations, and rationalize supply chain infrastructure. Under Mr. Foss’ leadership at ARAMARK, we have sharpened our focus on achieving sustainable value creation through accelerating revenue and profit growth with expanding margins.
70
Table of Contents
We continue to grow our existing business and win exciting new clients, including Airbus, the Ohio and Michigan departments of corrections, American University, the Minnesota Vikings, the Chicago Bears, and the Tampa Bay Buccaneers.
Our Market Opportunity
ARAMARK operates in large and highly fragmented markets with attractive industry dynamics. We believe that the global food and support services market and the North American uniform and career apparel market is approximately $900 billion. As only approximately 50% of this opportunity is outsourced, there is a substantial potential for growth by winning business with educational and healthcare institutions, businesses, sports and leisure facilities and correctional facilities that currently provide these services in-house. We expect that demand for increased outsourced services will continue to be driven by shifting client imperatives, including: the need to focus on core businesses, the desire to deliver a high level of consumer satisfaction, the pursuit of reduced costs and the attractiveness of consolidating services with a single provider. Our value-added provision of these services is increasingly important to our clients’ achievement of their own missions.
The food and support services market is highly fragmented, with the five largest competitors capturing only 9% of the global market. We expect larger service providers to continue to win a disproportionate amount of the business that is converted from self-operated services as clients are increasingly seeking services from partners with the scale and sophistication necessary to drive consumer satisfaction and increase operational efficiency.
Our core geographic market is North America, which we believe will remain a compelling opportunity due to the favorable underlying economic conditions, stability and opportunities for profitable growth, and growing trend towards outsourcing. We continue to focus on the Education and Healthcare sectors, which are only approximately 30% outsourced, and have increased as a percentage of GDP, representing significant growth opportunities. While cost reduction continues to be a key consideration, clients’ decisions are increasingly driven by the broader value proposition associated with outsourcing. Clients across sectors, from business to education to sports, recognize that providing higher quality, more efficient food and facilities services is critical to driving satisfaction of their key constituents: students and faculty, patients, employees, and sports fans.
We also operate in select, high growth, emerging markets in Asia and South America. The GDP of the countries making up these markets grew at approximately 8.6% in 2012. The economic growth in these countries is driven by factors such as rising discretionary income, and increased investment in growth sectors such as mining, education and healthcare. Additionally, we estimate emerging markets are approximately 70% self-operated, making them highly attractive opportunities for outsourcing expansion. Our operations in Europe are selectively centered around top 3 positions in Germany, the UK and Ireland and our exposure to southern Europe is limited to Spain, representing approximately 1% of our total sales.
Our Strengths
We believe the following competitive strengths are key to our continued success:
Leader in a Large, Fragmented and Growing Market
We are a global market leader in the large, fragmented and growing food, facilities and uniform services industries. We hold the #2 position in North America and a top 3 position in countries representing 98% of 2012 total sales. We have developed these leadership positions primarily due to our commitment to helping build our clients’ success through leveraging our vast experience and sector knowledge while gaining deep consumer insight and providing a premier service offering to our clients. These leadership positions provide us with significant economies of scale, allow us to attract and retain top industry talent and position us to compete effectively for new business opportunities as clients are increasingly interested in service providers with a national or global reach, and a breadth of service offerings.
71
Table of Contents
We estimate the combined addressable global food and support services market and the North American uniform and career apparel opportunity to be $900 billion collectively. We believe our market has the potential to grow in excess of GDP driven by the growing trend towards outsourcing. While the global food, facilities and uniform market is very large, it remains underpenetrated, with approximately 50% of the total opportunity currently outsourced. We expect to benefit disproportionately from the trend towards outsourcing as large service providers, such as ARAMARK, have had greater success in winning new client business relative to smaller outsourcing service providers. The global food and support services market’s highly fragmented nature, with the top three competitors accounting for only 7% of the market, enables additional opportunity for share gains and consolidation.
Favorable Geographic, Sector and Service Mix
We have the global reach and capability to deliver high quality services consistently and safely across 22 countries around the world, which represent approximately 65% of the world’s GDP. We believe that our strong and expanding presence in our core North American market will remain a principal growth driver. Also, utilizing the skills and experience we have developed over decades of service in the North American market, we have increasingly established our position in key, high growth, emerging markets in Asia and South America. Our sales in emerging markets have increased at an annual rate of approximately 14% over the last five years, now representing 7% of sales in 2012 versus 4% in 2007, and we believe that our expanding presence in these geographies will become increasingly important for our overall growth. We have a selective and stable position in Europe concentrated in Germany, the UK and Ireland with sales in southern Europe limited to Spain which represents approximately 1% of our total sales. We believe our global footprint serves our clients in the most desirable geographies and provides a promising platform for further growth.
We serve a large and diversified client base across a wide range of sectors and businesses, including Education, Healthcare, Business & Industry, and Sports, Leisure and Corrections, with no single client accounting for more than 1% of 2012 sales (other than collectively a number of U.S. government entities). The Education and Healthcare sectors, which together contributed 43% of our 2012 sales globally, are large, underpenetrated, and only approximately 30% outsourced, representing attractive growth opportunities for ARAMARK.
We believe that the breadth of our service capabilities and ability to innovate position ARAMARK well to meet evolving consumer needs and address our clients’ increasing desire to conduct business with an experienced single provider of multiple services. An example of a recent success is American University, where we have been providing facilities services since 2001 and recently won the dining business from a competitor based on our strategic vision for the campus and the local management teams that have consistently delivered high quality services. ARAMARK is a trusted partner across a variety of services, sectors and geographies, from offering safe living and working environments for miners in Latin America, to patient transportation services for healthcare clients in China.
Deep Client and Consumer Insight Leads to Attractive Growth Opportunities
ARAMARK’s leading positions, scale and breadth of product offering enable us to continue to grow our business through higher penetration into existing clients and cross-selling of additional services. We have long-lasting relationships with our clients due to our service excellence and our overall value proposition, which is evidenced by our approximately 95% annual retention rate and an average client relationship of approximately 10 years. We believe we are able to maintain these strong relationships year after year by providing value-added services which help our clients achieve their own mission and also improve satisfaction of their key constituencies: employees, students and faculty, patients and sports fans. This is increasingly important as, for example, businesses compete for employees, colleges compete for students and hospitals compete for patients. Given that only 9% of our current clients utilize both food and facilities services, we believe substantial opportunities remain for us to provide additional services to our existing client base. Further, we aim to increase the per capita spending of our target consumers, and expand the participation rates of these populations in our existing service offering, through innovative marketing and merchandising programs.
72
Table of Contents
We continuously innovate our existing services to better meet our clients’ evolving needs. We use ARAMARK’s consumer insights and other research to increase our awareness of market trends, client needs and consumer preferences. Annualized revenue from new clients contracted during 2012 was over $1.0 billion. Our recent wins span sectors and geographies, including Airbus, the Ohio and Michigan departments of corrections, American University, the Minnesota Vikings, the Chicago Bears, and the Tampa Bay Buccaneers.
Improving Profitability with Resilient Cash Flow
We have and continue to implement a number of programs and tools to increase our profitability, including enhanced management of our key costs—food, labor and overhead—through SKU rationalization, portioning, waste control, enhanced labor scheduling, turn-over reduction and SG&A discipline, among others. Because of the leverage inherent in our business model, we believe the implementation of these measures will increase our profitability. Since instituting these new productivity initiatives in 2012, we have seen positive momentum in our performance. During the first nine months of fiscal 2013, we achieved year-over-year growth in our Adjusted Operating Income of 10% and sales growth of 3%.
We have a favorable business mix that allows us to deliver consistent profitability in most macroeconomic environments. We can react quickly to changing conditions in our day to day operations due to our highly variable cost structure. We generate strong and stable cash flow as a result of our consistent profitability and limited working capital and capital expenditure requirements. Our capital expenditures in the last 5 years have averaged only 2.4% of sales. In the economic downturn in 2009 for example, our cash flow actually increased as lower capital expenditures and a reduction in working capital more than offset a modest earnings decline. We believe that the low capital intensity of our business model positions us to continue to generate significant cash flow, which should give us the flexibility to reduce debt, pursue strategic acquisitions and return capital to our stockholders.
Strong Management Team with Diverse Experience
Our management team is a carefully constructed group of successful long-tenured leaders with significant industry and company experience blended with talented outside leaders with significant Fortune 500 management, consumer/retail and food industry experience. Our CEO and President, Eric Foss, is an experienced Fortune 500 public company CEO with a demonstrated multi-year track record of success and stockholder value creation. Since joining ARAMARK in 2012, he has further enhanced ARAMARK’s strong foundation with an integrated strategy focusing on growth, productivity, people and delivering on financial commitments. The average tenure of our principle operating leaders is 20 years, with individual tenure ranging from 33 years to less than one year. Our remaining senior management team and business unit presidents’ tenure averages 12 years. ARAMARK has a long history of broad management ownership dating back to the 1980s, and our management team collectively has a significant equity position in ARAMARK.
Our Strategies
Our core strategy is to provide the highest quality food, facilities and uniform services to our clients and consumers through a consistent, repeatable business model anchored around five core principles of excellence—selling, service, execution, marketing and operations. We will continue to build our core business in North America, and expand our emerging markets platform through the following growth and operational strategies:
Grow Our Base Business
Drive Incremental Revenue from Existing Clients
We intend to increase penetration within our existing client base. We have implemented a framework that establishes high levels of excellence in service and execution across our food, facilities and uniform businesses.
73
Table of Contents
We leverage our extensive industry knowledge and decades of experience, which has allowed us to gain deep client and consumer insight in our efforts to provide the highest quality of service in the industry. We believe our ideas and innovations are a key differentiating factor for ARAMARK in winning new business at existing clients. Opportunities exist to increase penetration in each of our major service lines—food service, facilities service and uniform services. In each of our sectors we have identified the top items that drive demand and have established rigorous executional frameworks at the location level to maximize results. At our Major League Baseball venues where these programs have been introduced, per-capita expenditures by fans are 5.7% higher than last season.
Currently, 9% of our clients use both our food and facilities services. Having an on-site team successfully providing one service positions us well to expand the services we provide.
Increase Client Retention Rates
ARAMARK has historically experienced high and consistent client retention rates. In 2012, our client retention rate was 95%. Our front-line focus and increased emphasis on providing world class service enables us to uphold excellence in all facets of our client-facing operations. Our service orientation is centered on creating a culture of excellence. We focus our consumer facing employees on adhering to stringent quality standards, which create an enhanced consumer experience. By delivering high quality, innovative and consistent service to our clients, we believe our attractive value proposition will drive client and consumer loyalty, enabling us to increase our retention rates and enhance profitability for our stockholders.
Grow New Business
Expand New Business Through Selling Excellence
ARAMARK’s platform for achieving consistent selling excellence is centered on listening to and understanding our clients’ needs, creating innovative service offerings that meet those needs and selling our services with passion. Our market leadership and extensive industry experience position us to capitalize on the large, under-penetrated and growing food, facilities and uniform services markets. We believe that the current rate of penetration will accelerate as more businesses and organizations continue to see the benefits of outsourcing non-core activities. For example, we recently achieved new business wins from converting self-operated accounts, including the Ohio and Michigan departments of corrections.
We are particularly focused on the Education and Healthcare sectors due to their lower level of economic sensitivity and strong growth. Despite recent economic weakness, total spending on Education and Healthcare has increased as a percentage of total GDP. Additionally, we believe the addressable Education and Healthcare sectors represent opportunities of $87 billion and $31 billion, respectively, and are only approximately 30% outsourced to third-party providers, which provides a significant opportunity for further growth.
Increase our Presence in Emerging Markets
The favorable growth characteristics and relatively low outsourcing rates in emerging market regions present a substantial opportunity for accelerated growth. Our emerging markets presence currently consists of 7 countries across Asia and South America. Our growth strategy in select emerging market geographies is focused on three initiatives: supporting existing clients as they expand into emerging markets, growing in geographies in which we already operate profitably, and entering new geographies where we have identified attractive prospects for profitable expansion. Over the last several years, our China business in particular has experienced high double-digit organic growth and we are well positioned to utilize our deep industry and country knowledge to
74
Table of Contents
continue to expand in this key geography. We currently serve some of the largest hospitals in the region including Severance Hospital in Korea with 3,700 beds and Gulou Hospital in China with 3,642 beds. Additionally, we have established a strong presence in South America and are focused on growing our presence in this region.
Given the scale and coordination required to successfully execute a multinational contract, we believe we are one of a very small group of global companies currently capable of competing for these highly attractive contracts within emerging markets.
Pursue Strategic Acquisitions
We anticipate that continued consolidation in the global food, facilities and uniform services markets will create opportunities for us to acquire businesses with complementary geographic and service offering profiles. We intend to continue strengthening our existing business through selective, accretive acquisitions that will solidify our position, enhance and expand our service capabilities, further develop our differentiated positions, or allow us to enter into high growth geographies. We have a history of successful acquisitions, which we have successfully integrated into our existing operations while achieving targeted synergies with minimal client losses. For example, in fiscal 2012 we acquired Filterfresh, a leader in providing quality office refreshment services to employees in the workplace, and in fiscal 2011 we acquired Masterplan, a clinical technology management and medical equipment maintenance company, which expanded our capability to service all levels of hospital clinical technology and strengthened our position in a key sector within the North American market. Both acquisitions were integrated into larger, similar ARAMARK operations.
Accelerate Margin Expansion through Operational Excellence
Since the 2007 Transaction, we have delivered solid, consistent performance in Adjusted Operating Income as a percentage of sales, despite periods of instability in the global economy. During that time we have also implemented a disciplined process to achieve operational excellence and capture productivity for growth through a standard, repeatable business model. To achieve this, we are investing in the systems, tools and training utilized by our front-line employees, and establishing quality standards and processes to more efficiently manage our food, merchandise, labor, and above-unit costs. For example, we have implemented several productivity initiatives, including SKU rationalization, waste reduction, improved labor scheduling and menu standardization. Additionally, our scale and operating leverage allow us to effectively manage these costs, which together accounted for 77% of our operating costs in fiscal 2012. We are also incorporating automated, standardized and centralized processes that have resulted in the reduction of above-unit overhead costs through the elimination of redundancies in our finance and HR functions.
The successful implementation of these initiatives has led to increased profitability, a portion of which we are reinvesting in our business to achieve additional growth and margin expansion. This reinvestment is focused on two primary goals: improving the efficiency of standard tools and selling resources, and continuing to recruit, train and develop employees to maintain our culture of high performance. Through continued reinvestment in our business, we expect to both increase our ability to execute upon our core strategies and maintain our operational excellence.
Food and Support Services
Our Food and Support Services segments manage a number of interrelated services—including food, hospitality and facility services—for school districts, colleges and universities, healthcare facilities, businesses, sports, entertainment and recreational venues, conference and convention centers, national and state parks and correctional institutions. Our Food and Support Services segments holds the #2 position in North America and a top 3 position in most countries in which FSS operates.
75
Table of Contents
We are the exclusive provider of food and beverage services at most of the locations we serve and are responsible for hiring, training and supervising substantially all of the food service personnel in addition to ordering, receiving, preparing and serving food and beverage items sold at those facilities. Our facilities services capabilities are broad, and include plant operations and maintenance, custodial/housekeeping, energy management, clinical equipment maintenance, grounds keeping, capital project management and building commissioning. In governmental, business, educational and healthcare facilities (for example, offices and industrial plants, schools and universities and hospitals), our clients provide us with a captive client base through their on-site employees, students and patients. At sports, entertainment and recreational facilities, our clients attract patrons to their site, usually for specific events such as sporting events and conventions.
We manage our Food and Support Services business in two geographic operating segments split between our North American and International operations. In fiscal 2012, our FSS North America segment generated $9.4 billion in sales, or 70% of our total sales, and our FSS International segment generated $2.7 billion in sales, or 20% of our total sales. No individual client represents more than 1% of our 2012 total sales, other than, collectively, a number of U.S. government agencies. See note 13 to our consolidated financial statements for information on revenue, profit and total assets for the FSS North America segment and the FSS International segment.
Clients and Services
Our Food and Support Services segments serves a number of client sectors across 22 countries around the world, distinguished by the types of consumers served and types of services offered. Our Food and Support Services operations focus on serving clients in four principal sectors:
| Sector | Types of Clients | Food Services | Facilities Services | |||
| Education |
• Colleges and universities • Public school districts and systems • Private schools |
• Dining services • Catering • Food service management • Retail operations |
• Facilities management • Custodial services • Grounds • Energy management • Construction management • Capital project management • Building commissioning | |||
| Healthcare |
• Hospitals • Nursing homes |
• Food and nutrition services • Retail operations |
• Clinical equipment maintenance • Environmental services • Laundry and linen distribution • Plant operations • Energy management • Strategic and technical services • Supply chain management • Purchasing • Central transportation | |||
| Business & Industry |
• Manufacturing plants • Corporate cafeterias • Mining operations • Oil & Gas drilling operations |
• Dining services • On-site restaurants • Catering • Convenience stores • Executive dining rooms • Coffee and vending • Drinking water filtration |
• Housekeeping management • Plant operations/maintenance • Energy management • Groundskeeping • Landscaping • Transportation • Capital program management • Commissioning services • Building operations consulting | |||
| Sports, Leisure and Corrections |
• Professional and collegiate stadiums and arenas • Concert venues • National and state parks • Convention and civic centers • Correctional facilities |
• Concessions • Banquet and catering • Retail and merchandise sales • Food and nutrition services |
• Recreational and lodging services • Commissary services • Laundry and linen management • Property room management |
76
Table of Contents
Education. Within the Education sector we serve Higher Education and K-12 clients. We deliver a wide range of food and facility services at more than 1,400 colleges, universities, school systems and districts and private schools. We offer our education clients a single source provider for managed service solutions, including dining, catering, food service management, convenience-oriented retail operations, grounds and facilities maintenance, custodial, energy management, construction management, capital project management and building commissioning.
Healthcare. We provide a wide range of non-clinical support services to approximately 1,100 healthcare clients and more than 2,000 facilities across our global footprint. We offer healthcare organizations a single source provider for managed service solutions, which include food services such as patient food and nutrition services and retail food services, and facilities services such as clinical equipment maintenance, environmental services, laundry and linen distribution, plant operations, energy management, strategic/technical services, supply chain management, purchasing and central transportation.
Business & Industry. We provide a comprehensive range of business dining services, including on-site restaurants, catering, convenience stores and executive dining.
We also provide coffee and vending services to business and industry clients at thousands of locations. Our service and product offerings include a full range of coffee and beverage offerings, “grab and go” food operations, convenience stores and a proprietary drinking water filtration system.
We also offer a variety of facility management services to business and industry clients. These services include the management of housekeeping, plant operations and maintenance, energy management, laundry and linen, groundskeeping, landscaping, transportation, capital program management and commissioning services and other facility consulting services relating to building operations.
We also offer remote services which include facility and business support services primarily for mining and oil operations.
Sports, Leisure and Corrections. We administer concessions, banquet and catering services, retail services and merchandise sales, recreational and lodging services and facility management services at sports, entertainment and recreational facilities. We serve 158 professional (including minor league affiliates) and college sports teams, including 41 teams in Major League Baseball, the National Basketball Association, the National Football League and the National Hockey League. We also serve 26 convention and civic centers, 16 national and state parks and other resort operations, plus numerous concert venues, entertainment complexes and other popular tourist attractions in the United States and Canada. Additionally, we provide correctional food services, operate commissaries, laundry facilities and property rooms and provide food and facilities management services for parks.
Our FSS International segment provides a similar range of services as those provided to our FSS North America segment clients and operates in all of our sectors. We have operations in 19 countries outside North America. Our largest international operations are in the United Kingdom, Germany, Chile and Ireland, and in each of these countries we are one of the leading food service providers. We also have operations in emerging market countries, such as China, and a strong presence in Japan through our 50% ownership of AIM Services Co., Ltd., a leader in providing outsourced food services in Japan. In addition to the core Business & Industry sector, our FSS International segment serves many soccer stadiums across Europe, and numerous educational institutions, correctional institutions and convention centers globally. There are particular risks attendant with our international operations. Please see “Risk Factors.”
Purchasing
We negotiate the pricing and other terms for the majority of our purchases of food and related products in the United States and Canada directly with national manufacturers. We purchase these products and other items
77
Table of Contents
through SYSCO Corporation and other distributors. We have a master distribution agreement with SYSCO that covers a significant amount of our purchases of these products and items in the United States and another distribution agreement with SYSCO that covers our purchases of these products in Canada. Our distributors are responsible for tracking our orders and delivering products to our specific locations. Due to our ability to negotiate favorable terms with our suppliers, we receive vendor consideration, including rebates, allowances and volume discounts. See “Types of Contracts” below. Our location managers also purchase a number of items, including bread, dairy products and alcoholic beverages from local suppliers, and we purchase certain items directly from manufacturers.
Our relationship with SYSCO is important to our operations—we have had distribution agreements in place for more than 20 years. In fiscal 2012, SYSCO distributed approximately 60% of our food and non-food products in the United States and Canada, and we believe that we are one of their largest clients. However, we believe that the products acquired through SYSCO can, in significant cases, be purchased through other sources and that termination of our relationship with them or any disruption of their business would cause only short-term disruptions to our operations.
Our agreements with our distributors are generally for an indefinite term, subject to termination by either party after a notice period, which is generally 60 to 120 days. The pricing and other financial terms of these agreements are renegotiated periodically. Our current agreement with SYSCO is terminable by either party with 180 days notice.
In our international segment, our approach to purchasing is substantially similar. On a country-by-country basis, we negotiate pricing and other terms for a majority of our purchases of food and related products with manufacturers operating in the applicable country, and we purchase these products and other items through distributors in that country. Due to our ability to negotiate favorable terms with our suppliers, we receive vendor consideration, including rebates, allowances and volume discounts. See “Types of Contracts” below. As in North America, our location managers also purchase a number of items, including bread, dairy products and alcoholic beverages from local suppliers, and we purchase certain items directly from manufacturers. Our agreements with our distributors are subject to termination by either party after a notice period, which is generally 60 days. The pricing and other financial terms of these agreements are renegotiated periodically.
Our relationship with distributors in the countries outside the United States and Canada is important to our operations, but from an overall volume standpoint, no distributor outside the United States and Canada distributes a significant volume of products. We believe that products we acquire from our distributors in countries outside the United States and Canada can, in significant cases, be purchased from other sources, and that the termination of our relationships with our distributors outside the United States and Canada, or the disruption of their business operations, would cause only short-term disruption to our operations.
Sales and Marketing
We maintain selling and marketing excellence by focusing on the execution of a common selling process as well as optimal resource allocation and deployment. Our business development functions are aligned directly with the sectors and services in which we have leadership positions, and we combine our targeted business development strategies with our strong client relationships to deliver differentiated and innovative solutions. We have clear insight into the factors that influence client choice and tailor our client interactions to maximize impact and create a demonstrable growth trajectory. Our sales and marketing platform has created a common toolkit and a repeatable process to deliver both improved retention as well as cross-selling opportunities.
The effectiveness of our approach has been demonstrated through our improved growth trajectory. Net new business (the annualized sales of new clients acquired less the annualized sales of clients lost) during fiscal year 2012 was 259% of the previous three year average and for the last nine months, our performance is 65% greater than the comparable period in fiscal 2012.
78
Table of Contents
Types of Contracts
We use contracts that allow us to manage our potential upside and downside risk in connection with our various business interactions with clients. Our contracts may require that the client’s consent be obtained in order to raise prices on the food, beverages and merchandise we sell within a particular facility. The length of contracts that we enter into with clients varies. Contracts generally are for fixed terms, many of which are in excess of one year. Client contracts for sports, entertainment and recreational services typically require larger capital investments, but have correspondingly longer and fixed terms, usually from five to fifteen years.
When we enter into new contracts, or extend or renew existing contracts, particularly those for stadiums, arenas, convention centers, colleges and universities, we are sometimes contractually required to make some form of up-front or future capital investment to help finance improvement or renovation, typically to the food and beverage facilities of the venue from which we operate. Contractually required capital expenditures typically take the form of investment in leasehold improvements, food service equipment and/or grants to clients. At the end of the contract term or upon its earlier termination, assets such as equipment and leasehold improvements typically become the property of the client, but generally the client must reimburse us for any undepreciated or unamortized capital investments.
Food and Support Services contracts are generally obtained and renewed either through a competitive process or on a negotiated basis, although contracts in the public sector are frequently awarded on a competitive bid basis, as required by applicable law. Contracts for Food and Support Services with school districts and correctional clients are typically awarded through a formal bid process. Contracts in the private sector may be entered into on a less formal basis, but we and other companies will often compete in the process leading up to the award or the completion of contract negotiations. Typically, after the award, final contract terms are negotiated and agreed upon.
We use two general contract types in our Food and Support Services segments: profit and loss contracts and client interest contracts. These contracts differ in their provision for the amount of financial risk that we bear and, accordingly, the potential compensation, profits or fees we may receive. Commission rates and management fees, if any, may vary significantly among contracts based upon various factors, including the type of facility involved, the term of the contract, the services we provide and the amount of capital we invest.
Profit and Loss Contracts. Under profit and loss contracts, we receive all of the revenue from, and bear all of the expenses of, the provision of our services at a client location. Expenses under profit and loss contracts sometimes include commissions paid to the client, typically calculated as a fixed or variable percentage of various categories of sales, and, in some cases, require minimum guaranteed commissions. We benefit from greater upside potential with a profit and loss contract, although we do consequently bear greater downside risk than with a client interest contract. For fiscal 2012, approximately 73% of our Food and Support Services sales were derived from profit and loss contracts.
Client Interest Contracts. Client interest contracts include management fee contracts, under which our clients reimburse our operating costs and pay us a management fee, which may be calculated as a fixed dollar amount or a percentage of sales or operating costs. Some management fee contracts entitle us to receive incentive fees based upon our performance under the contract, as measured by factors such as sales, operating costs and client satisfaction surveys. Client interest contracts also include limited profit and loss contracts, under which we receive a percentage of any profits earned from the provision of our services at the facility and we generally receive no payments if there are losses. As discussed above under “Purchasing,” we receive vendor consideration, including rebates, allowances and volume discounts that we retain except in those cases and to the extent that, under certain arrangements, they are passed through to our clients. For our client interest contracts, both our upside potential and downside risk are reduced compared to our profit and loss contracts. For fiscal 2012, approximately 27% of our Food and Support Services sales were derived from client interest contracts.
79
Table of Contents
Competition
There is significant competition in the Food and Support Services business from local, regional, national and international companies, as well as from the businesses, healthcare institutions, colleges and universities, correctional facilities, school districts and public assembly facilities that decide to provide these services themselves. Institutions may decide to operate their own services or outsource to one of our competitors following the expiration or termination of contracts with us. Clients do not necessarily choose the lowest cost provider, and tend to place a premium on the total value proposition offered. In our FSS North America segment, our external competitors include other multi-regional food and support service providers, such as Centerplate, Inc., Compass Group plc, Delaware North Companies Inc. and Sodexo SA. Internationally, our external food service and support service competitors include Compass Group plc, Elior SA, International Service System A/S and Sodexo SA. We also face competition from many regional and local service providers.
We believe that the following competitive factors are the principal drivers of our success:
| • | quality and breadth of services and management talent; |
| • | service innovation; |
| • | reputation within the industry; |
| • | pricing; and |
| • | financial strength and stability. |
Seasonality
Our sales and operating results have varied, and we expect them to continue to vary, from quarter to quarter as a result of different factors. Within our FSS North America segment, historically there has been a lower level of activity during our first and second fiscal quarters in the sports, entertainment and recreational services. This lower level of activity historically has been partially offset during our first and second fiscal quarters by the increased activity in our educational operations. Conversely, historically there has been a significant increase in the provision of sports, entertainment and recreational services during our third and fourth fiscal quarters, which is partially offset by the effect of summer recess at colleges, universities and schools.
Uniform
Our Uniform segment provides uniforms and other garments and work clothes and ancillary items such as mats and shop towels in the United States, Puerto Rico, Canada and through a joint venture in Japan. We hold the #2 position in the North American uniform services market. We operate approximately 2,600 routes nationally, giving us a broad reach to service our clients’ needs.
Clients use our uniforms to meet a variety of needs, including:
| • | establishing corporate identity and brand awareness; |
| • | projecting a professional image; |
| • | protecting workers—work clothes can help protect workers from difficult environments such as heavy soils, heat, flame or chemicals; and |
| • | protecting products—uniforms can help protect products against contamination in the food, pharmaceutical, electronics, health care and automotive industries. |
We provide a full service employee uniform solution, including design, sourcing and manufacturing, delivery, cleaning and maintenance. We rent uniforms, work clothing, outerwear, particulate-free garments and non-garment items and related services, including industrial towels, floor mats, mops, linen products, and paper
80
Table of Contents
products to businesses in a wide range of industries, including manufacturing, food services, automotive, healthcare, construction, utilities, repair and maintenance services, restaurant and hospitality. In fiscal 2012, our Uniform segment generated $1.4 billion in sales, or 10% of our total sales. See note 13 to the Company’s consolidated financial statements for information on revenue, profit and total assets for the Uniform segment.
Clients and Services
We serve businesses of all sizes in many different industries. We have a diverse client base, serving clients in all 50 states, Puerto Rico and one Canadian province, from over 200 service location and distribution centers across the United States and one service center in Ontario, Canada. None of our clients individually represents a material portion of our sales. We typically visit our clients’ sites weekly, delivering clean, finished uniforms and, at the same time, removing the soiled uniforms or other items for cleaning, repair or replacement. We also offer products for direct sale.
Our cleanroom service offers advanced static dissipative garments, barrier apparel, sterile garments and cleanroom application accessories for clients with contamination-free operations in the technology, food, healthcare and pharmaceutical industries.
We conduct our direct marketing business through three primary brands—WearGuard, Crest and ARAMARK. We design, source or manufacture and distribute distinctive image apparel to workers in a wide variety of industries through the Internet at www.shoparamark.com, dedicated sales representatives and telemarketing sales channels. We customize and embroider personalized uniforms and logos for clients through an extensive computer assisted design center and distribute work clothing, outerwear, business casual apparel and footwear throughout the United States, Puerto Rico and Canada.
Operations
We operate our uniform rental business as a network of 78 laundry plants and 148 satellite plants and depots supporting over 2,600 pick-up and delivery routes. We operate a fleet of service vehicles that pick up and deliver uniforms for cleaning and maintenance. We conduct our direct marketing activities principally from our facilities in Salem, Virginia; Norwell, Massachusetts; and Reno, Nevada. We market our own brands of apparel and offer a variety of customized personalization options such as embroidery and logos. We also source uniforms and other products to our specifications from a number of domestic and international suppliers and also manufacture a significant portion of our uniform requirements. We purchase uniform and textile products as well as equipment and supplies from domestic and international suppliers. The loss of any one supplier would not have a significant impact on us. We also operate a cutting and sewing plant in Mexico, which satisfies a substantial amount of our standard uniform inventory needs.
Sales and Marketing
Our sales representatives and route sales drivers are responsible for selling our services to current and potential clients and developing new accounts through the use of an extensive, proprietary database of pre-screened and qualified business prospects. We build our brand identity through local advertising, promotional initiatives and through our distinctive service vehicles. Our clients frequently come to us through client referrals, either from our uniform rental business or from our other service sectors. Our customer service representatives generally interact on a weekly basis with their clients, while our support personnel are charged with expeditiously handling client requirements regarding the outfitting of new client employees and other customer service needs.
Types of Contracts
We typically serve our rental clients under written service contracts for an initial term of three to five years. While clients are not required to make an up-front investment for their uniforms, in the case of nonstandard
81
Table of Contents
uniforms and certain specialty programs, clients typically agree to reimburse us for our costs if they terminate their agreement early. With the exception of certain governmental bid business, most of our direct marketing business is conducted under invoice arrangement with repeat clients.
Competition
Although the United States rental industry has experienced some consolidation, there is significant competition in all the areas that we serve, and such competition varies across geographies. Although many competitors are smaller local and regional firms, we also face competition from other large national firms such as Cintas Corporation, G&K Services, Inc. and UniFirst Corporation. We believe that the primary competitive factors that affect our operations are quality, service, design, consistency of product, and distribution capability, particularly for large multi-location clients, and price. We believe that our ability to compete effectively is enhanced by the quality and breadth of our product line as well as our nationwide reach.
Employees
As of June 28, 2013, we had a total of approximately 267,000 employees, including seasonal workers, consisting of approximately 164,000 full-time and approximately 103,000 part-time employees in our three business segments. The number of part-time employees varies significantly from time to time during the year due to seasonal and other operating requirements. We generally experience our highest level of employment during the fourth fiscal quarter. The approximate number of employees by segment is as follows: FSS North America: 172,000; FSS International: 82,000; Uniform: 13,000. In addition, the ARAMARK corporate staff is approximately 200 employees. Approximately 40,000 employees in the United States are covered by collective bargaining agreements. We have not experienced any material interruptions of operations due to disputes with our employees and consider our relations with our employees to be satisfactory.
Properties
Our principal executive offices are located at ARAMARK Tower, 1101 Market Street, Philadelphia, Pennsylvania 19107. Our principal real estate is primarily comprised of Uniform facilities. As of June 28, 2013, we operated 248 service facilities in our Uniform segment, consisting of industrial laundries, cleanroom laundries, warehouses, distribution centers, satellites, depots, and stand-alone garages that are located in 40 states, Mexico, Canada and Puerto Rico. Of these, approximately 50% are leased and approximately 50% are owned. In addition, we operate one cutting and sewing plant in Mexico. We own 11 buildings that we use in our FSS North America segment, including two office buildings, three hotels and several office/warehouse spaces, and we lease 152 premises, consisting of offices, office/warehouses and distribution centers. In addition, we own a distribution center and four other properties and lease 99 facilities throughout the world that we use in our FSS International segment. We also maintain other real estate and leasehold improvements, which we use in the Uniform and FSS segments. No individual parcel of real estate owned or leased is of material significance to our total assets.
Legal Proceedings
Our business is subject to various federal, state and local laws and regulations governing, among other things, the generation, handling, storage, transportation, treatment and disposal of water wastes and other substances. We engage in informal settlement discussions with federal, state, local and foreign authorities regarding allegations of violations of environmental laws in connection with our operations or businesses conducted by our predecessors or companies that we have acquired, the aggregate amount of which and related remediation costs we do not believe should have a material adverse effect on our financial condition or results of operations.
82
Table of Contents
From time to time, the Company and its subsidiaries are party to various legal actions, proceedings and investigations involving claims incidental to the conduct of their business, including those brought by clients, consumers, employees, government entities and third parties under, among others, federal, state, international, national, provincial and local employment laws, wage and hour laws, discrimination laws, immigration laws, human health and safety laws, import and export controls and customs laws, environmental laws, false claims or whistleblower statutes, minority, women and disadvantaged business enterprise statutes, tax codes, antitrust and competition laws, consumer protection statutes, procurement regulations, intellectual property laws, food safety and sanitation laws, cost and accounting principles, the Foreign Corrupt Practices Act, the U.K. Bribery Act, other anti-corruption laws, lobbying laws, motor carrier safety laws, data privacy laws and alcohol licensing and service laws, or alleging negligence and/or breaches of contractual and other obligations. Based on information currently available, advice of counsel, available insurance coverage, established reserves and other resources, the Company does not believe that any such actions, proceedings or investigations are likely to be, individually or in the aggregate, material to its business, financial condition, results of operations or cash flows. However, in the event of unexpected further developments, it is possible that the ultimate resolution of these matters, or other similar matters, if unfavorable, may be materially adverse to the Company’s business, financial condition, results of operations or cash flows.
Governmental Regulation
We are subject to various governmental regulations, such as environmental, labor, employment, immigration, health and safety laws and liquor licensing and dram shop laws. In addition, our facilities and products are subject to periodic inspection by federal, state and local authorities. We have established, and periodically update, various internal controls and procedures designed to maintain compliance with these regulations. Our compliance programs are subject to changes in federal or state legislation, or changes in regulatory interpretation, implementation or enforcement. From time to time both federal and state government agencies have conducted audits of certain of our practices as part of routine investigations of providers of services under government contracts, or otherwise. Like others in our business, we receive requests for information from governmental agencies in connection with these audits. If we fail to comply with applicable laws, we may be subject to investigations, criminal sanctions or civil remedies, including fines, penalties, damages, reimbursement, injunctions, seizures, debarments from government contracts or loss of liquor licenses.
Our operations are subject to various governmental regulations, including those governing:
| • | the service of food and alcoholic beverages; |
| • | collection of sales tax; |
| • | minimum wage, overtime, wage payment and employment discrimination; |
| • | immigration; |
| • | governmentally funded entitlement programs; |
| • | environmental protection; |
| • | human health and safety; |
| • | customs, import and export control laws; |
| • | the Foreign Corrupt Practices Act, the U.K. Bribery Act and other anti-bribery laws; |
| • | minority business enterprise and women owned business enterprise statutes; |
| • | federal motor carrier safety; and |
| • | privacy and client data security. |
There are a variety of regulations at various governmental levels relating to the handling, preparation and serving of food, including in some cases requirements relating to the temperature of food, the cleanliness of the
83
Table of Contents
kitchen, and the hygiene of personnel, which are enforced primarily at the local public health department level. While we attempt to comply with applicable laws and regulations, we cannot assure you that we are in full compliance at all times with all of the applicable laws and regulations referenced above. Furthermore, legislation and regulatory attention to food safety is very high. Additional or amended regulations in this area may significantly increase the cost of compliance.
In addition, various federal, state and provincial agencies impose nutritional guidelines and other requirements on us at certain of the healthcare, education and corrections facilities we serve. We may also be subject to regulations that limit or restrict the use of trans fats in the food we serve or other requirements relating to ingredient or nutrient labeling. There can be no assurance that federal or state legislation, or changes in regulatory implementation or interpretation of government regulations, would not limit our activities in the future or significantly increase the cost of regulatory compliance.
Because we serve alcoholic beverages at many sports, entertainment and recreational facilities, including convention centers and national and state parks, we also hold liquor licenses incidental to our contract food service business and are subject to the liquor license requirements of the jurisdictions in which we hold a liquor license. As of June 28, 2013, our subsidiaries held liquor licenses in 41 states and the District of Columbia, three Canadian provinces and certain other countries. Typically, liquor licenses must be renewed annually and may be revoked or suspended for cause at any time. Alcoholic beverage control regulations relate to numerous aspects of our operations, including minimum age of patrons and employees, hours of operation, advertising, wholesale purchasing, inventory control and handling, and storage, dispensing and service of alcoholic beverages. We have not encountered any material problems relating to alcoholic beverage licenses to date. The failure to receive or retain a liquor license in a particular location could adversely affect our ability to obtain such a license elsewhere. Some of our contracts require us to pay liquidated damages during any period in which our liquor license for the facility is suspended, and most contracts are subject to termination if we lose our liquor license for the facility. Our service of alcoholic beverages is also subject to state, provincial and local service laws, commonly called dram shop statutes. Dram shop statutes generally prohibit serving alcoholic beverages to minors or visibly intoxicated persons. If we violate dram shop laws, we may be liable to the patron or to third parties for the acts of the patron. We sponsor regular training programs designed to minimize the likelihood of such a situation. However, we cannot guarantee that intoxicated or minor patrons will not be served or that liability for their acts will not be imposed on us.
Our uniform rental business and our food and support service business are subject to various environmental protection laws and regulations, including the U.S. federal Clean Water Act, Clean Air Act, Resource Conservation and Recovery Act, Comprehensive Environmental Response, Compensation, and Liability Act and similar state and local statutes and regulations governing the use, management, shipping and disposal of chemicals and hazardous materials. In particular, industrial laundries use certain detergents and cleaning chemicals to launder garments and other merchandise. The residues from such detergents and chemicals and residues from soiled garments and other merchandise laundered at our facilities may result in potential discharges to air and to water (through sanitary sewer systems and publicly owned treatment works) and may be contained in waste generated by our wastewater treatment systems. Our industrial laundries are subject to certain volume and chemical air and water pollution discharge limits, monitoring, permitting and recordkeeping requirements. We own or operate aboveground and underground storage tank systems at some locations to store petroleum products for use in our or our clients’ operations. Certain of these storage tank systems also are subject to performance standards, periodic monitoring and recordkeeping requirements. We also may use and manage chemicals and hazardous material in our operations from time to time. We are mindful of the environmental concerns surrounding the use, management, shipping and disposal of these chemicals and hazardous materials, and have taken and continue to take measures to maintain compliance with environmental protection laws and regulations. Given the regulated nature of our operations, we could face penalties and fines for non-compliance. In the past, we have settled, or contributed to the settlement of, actions or claims relating to the management of underground storage tanks and the handling and disposal of chemicals or hazardous materials, either on or off-site. We may, in the future, be required to expend material amounts to rectify the consequences of any such events. Under environmental laws, we may be liable for the costs
84
Table of Contents
of removal or remediation of certain hazardous materials located on or in or emanating from our owned or leased property or our clients’ properties, as well as related costs of investigation and property damage. Such laws may impose liability without regard to our fault, knowledge or responsibility for the presence of such hazardous substances. We may not know whether our clients’ properties or our acquired or leased properties have been operated in compliance with environmental laws and regulations or that our future uses or conditions will not result in the imposition of liability upon us under such laws or expose us to third-party actions such as tort suits.
We do not anticipate any capital expenditures for environmental remediation that would have a material effect on our financial condition.
Intellectual Property
We have the patents, trademarks, trade names and licenses that are necessary for the operation of our business. Other than the ARAMARK brand, we do not consider our patents, trademarks, trade names and licenses to be material to the operation of our business in any material respect.
85
Table of Contents
Executive Officers and Directors
The following table sets forth certain information regarding our executive officers and directors as of June 28, 2013:
| Name |
Age | Position |
With the company since |
|||||||
| Joseph Neubauer |
71 | Chairman of the Board and Director | 1979 | |||||||
| Eric J. Foss |
55 | Chief Executive Officer and President and Director | 2012 | |||||||
| Lynn B. McKee |
57 | Executive Vice President, Human Resources and Communications | 1980 | |||||||
| Christina Morrison |
46 | Senior Vice President, Finance | 2013 | |||||||
| Joseph Munnelly |
49 | Senior Vice President, Controller and Chief Accounting Officer | 2007 | |||||||
| Stephen Reynolds |
54 | Executive Vice President, General Counsel and Secretary | 2012 | |||||||
| L. Frederick Sutherland |
61 | Executive Vice President and Chief Financial Officer | 1983 | |||||||
| Karen A. Wallace |
46 | Vice President and Treasurer | 2004 | |||||||
| Todd M. Abbrecht |
44 | Director | 2007 | |||||||
| Lawrence T. Babbio, Jr. |
68 | Director | 1999 | |||||||
| Leonard S. Coleman, Jr. |
64 | Director | 1999 | |||||||
| Thomas H. Kean |
78 | Director | 1994 | |||||||
| James E. Ksansnak |
73 | Director | 1986 | |||||||
| Kewsong Lee |
47 | Director | 2007 | |||||||
| Sanjeev Mehra |
54 | Director | 2007 | |||||||
| Stephen P. Murray |
50 | Director | 2007 | |||||||
Joseph Neubauer has been our Chairman of the Board since April 1984. He served as our Chief Executive Officer from February 1983 to December 2003 and from September 2004 to May 2012. From January 2004 to September 2004, he served as our Executive Chairman. He was our President from April 1981 to May 1997. He currently is a director of Verizon Communications Inc. and Macy’s, Inc. and was a director of Wachovia Corporation from 1996 to 2008.
Eric J. Foss has been our Chief Executive Officer and President since May 2012. Before joining us, Mr. Foss served as Chief Executive Officer of Pepsi Beverages Company from 2010 until December 2011. Prior to that Mr. Foss served as Chairman and Chief Executive Officer of The Pepsi Bottling Group from 2008 until 2010; President and Chief Executive Officer from 2006 until 2007; and Chief Operating Officer from 2005 until 2006. Mr. Foss serves on the board of UDR, Inc. and CIGNA Corporation.
Lynn B. McKee has been our Executive Vice President, Human Resources and Communications since August 2012 and previously served as our Executive Vice President, Human Resources from May 2004 to August 2012. From January 2004 to May 2004, she was our Senior Vice President of Human Resources and from September 2001 to December 2003, she served as Senior Vice President of Human Resources for our Food and Support Services Group. From August 1998 to August 2001, she served as our Staff Vice President, Executive Development and Compensation. Ms. McKee serves on the board of directors of Bryn Mawr Bank Co.
86
Table of Contents
Christina Morrison joined us in June 2013 as our Senior Vice President, Finance. Before joining us, Ms. Morrison served as Senior Vice President, Business and Financial Planning of Merck & Co., Inc. from 2009 to 2013. Prior to that, Ms. Morrison served as Senior Vice President, Chief Financial Officer of Wyeth Pharmaceuticals from 2007 to 2009 and as Vice President, U.S. Chief Financial Officer from 2005 to 2007; she served as Wyeth’s Vice President, New Business, Women’s Health Care from 2004 to 2005. From 2003 to 2004 Ms. Morrison was Executive Director, Strategic Planning of The Rouse Company. From 1989 to 2002 Ms. Morrison served in various capacities at Deutsche Bank’s Mergers and Acquisitions and Health Care Groups.
Joseph Munnelly joined us in September 2007 as Senior Vice President and Deputy Controller and was elected as our Senior Vice President and appointed Controller and Chief Accounting Officer effective March 2008. Prior to joining us, he served as Vice President and Corporate Controller at Unisys Corporation, a worldwide information technology services and solutions company, since 2005. Prior to that, he served as a partner at KPMG LLP in the Audit and Risk Advisory Services Practice. Prior to his tenure at KPMG, he spent 16 years with Arthur Andersen LLP, most recently as a partner in the Audit and Business Advisory practice.
Stephen R. Reynolds was appointed our Executive Vice President, General Counsel and Secretary, effective September 2012. Before joining us, Mr. Reynolds was an executive with Alcatel-Lucent for seven years, having most recently served as Senior Vice President and General Counsel from January 2006 to August 2012.
L. Frederick Sutherland became our Chief Financial Officer in May 1997. He has served as an Executive Vice President since May 1993. He served as Group Executive, ARAMARK Uniform and Career Apparel from June 2009 to August 2012. From May 1993 to May 1997, he also served as President of our Uniform Services division and from February 1991 to May 1993, he served as our Senior Vice President of Finance and Corporate Development. Mr. Sutherland served as our Treasurer from February 1984 to February 1991. Mr. Sutherland is a director of Consolidated Edison, Inc.
Karen A. Wallace became our Vice President and Treasurer in May 2012. From November 2010 to May 2012, she served as Staff Vice President and Assistant Treasurer. She joined us in December 2004 and was elected Assistant Treasurer in February 2005 and served in that role until November 2010. Before joining us, Ms. Wallace served as Assistant Treasurer of Armstrong World Industries.
Todd M. Abbrecht is a Managing Director of Thomas H. Lee Partners, L.P. Prior to joining Thomas H. Lee Partners in 1992, Mr. Abbrecht was in the Mergers and Acquisitions department of Credit Suisse First Boston. Mr. Abbrecht previously served on the board of directors of Warner Chilcott plc and Dunkin’ Brands Group, Inc.
Lawrence T. Babbio, Jr. is currently retired. He most recently served as a Senior Advisor to Warburg Pincus, a private equity firm, from June 2007 until March 2012. Previously, Mr. Babbio served as Vice Chairman and President of Verizon Communications, Inc., a telecommunications company, from 2000 until his retirement in April 2007. Mr. Babbio also served as Vice Chairman of Bell Atlantic Corporation, a telecommunications company, from 1995 until the formation of Verizon through the merger of Bell Atlantic and GTE Corporation, another telecommunications company, in 2000; as President and Chief Operating Officer of Bell Atlantic from 1994 to 1995; and Chairman, Chief Executive Officer and President of Bell Atlantic Enterprises International, Inc. from 1991 to 1994. Mr. Babbio previously served on the board of directors of Hewlett-Packard Company and Verizon Communications, Inc.
Leonard S. Coleman, Jr. is currently retired. Mr. Coleman most recently served as a Senior Advisor to Major League Baseball from 1999 to December 2005. Mr. Coleman served as President of The National League of Professional Baseball Clubs from 1994 to 1999, having served since 1992 as Executive Director, Market Development of Major League Baseball. Previously, Mr. Coleman was a municipal finance banker for Kidder,
87
Table of Contents
Peabody & Company. Mr. Coleman is a director of Avis Budget Group, Inc., Omnicom Group Inc., Churchill Downs Incorporated and Electronic Arts Inc. He previously served on the board of directors of H.J. Heinz Company.
Governor Thomas H. Kean served as the Governor of the State of New Jersey from 1982 until 1990. Since July 2005, he has served as President, THK Consulting, LLC. He was President of Drew University from 1990 until July 2005. He previously served on the board of directors of Hess Corporation and Franklin Resources, Inc.
James E. Ksansnak is currently retired. Mr. Ksansnak served as Chairman of the board of directors of Tasty Baking Company from May 2003 until May 2011. He was our vice chairman from May 1997 until March 2000. From February 1991 to May 1997, he was our executive vice president; from May 1986 to February 1991, he was our senior vice president; and from May 1986 to May 1997, he was our chief financial officer. Previously, Mr. Ksansnak also served on the board of directors of CSS Industries, Inc.
Kewsong Lee has served as a member and managing director of Warburg Pincus LLC and a general partner of Warburg Pincus & Co. since January 1997. He has been employed at Warburg Pincus since 1992. Prior to joining Warburg Pincus, Mr. Lee was a consultant at McKinsey & Company, Inc. from 1990 to 1992. He currently serves on the board of directors of MBIA Inc., The Neiman Marcus Group, Inc. and Arch Capital Group, Ltd. He formerly served on the board of directors of Knoll, Inc.
Sanjeev Mehra has been a Managing Director of Goldman, Sachs & Co.’s Principal Investment Area of its Merchant Banking Division since 1996 and is currently Co-Head of the U.S. private equity business. He serves on the board of directors of Sungard Data Systems, Inc., Interline Brands, Inc. and KAR Auction Services, Inc. Mr. Mehra previously served on the board of directors of Hawker Beechcraft, Inc. and Burger King Holdings, Inc.
Stephen P. Murray has been the President and Chief Executive Officer of CCMP Capital Advisors, LLC (“CCMP”) since March 2007. Currently, he serves on the board of directors of Generac Holdings, Inc. Previously, Mr. Murray also served on the board of directors of AMC Entertainment Inc., Warner Chilcott plc and Cabela’s Incorporated.
Our executive officers are elected annually by the board of directors and serve at its discretion or until their successors are duly elected and qualified.
Composition of the Board of Directors
Our business and affairs are managed under the direction of our board of directors. Following the completion of this offering, we expect our board of directors to consist of 10 directors, at least 3 of whom will be considered independent under NYSE corporate governance standards.
Background and Experience of Directors
When considering whether directors and nominees have the experience, qualifications, attributes or skills, taken as a whole, to enable our board of directors to satisfy its oversight responsibilities effectively in light of our business and structure, the board of directors focused primarily on each person’s background and experience as reflected in the information discussed in each of the directors’ individual biographies set forth above. We believe that our directors provide an appropriate mix of experience and skills relevant to the size and nature of our business. In particular, the members of our board of directors considered the following important characteristics, among others:
Mr. Neubauer—our board considered his extensive history with and knowledge of the Company, his business experience both before and after he joined the Company and his experience serving on the boards of other public companies.
88
Table of Contents
Mr. Foss—our board considered his extensive knowledge of the Company through his service as CEO and President, his business experience and his experience serving on boards of other public companies.
Mr. Abbrecht—our board considered his financial acumen and business leadership skills gained during his tenure at Thomas H. Lee and his experience serving on the boards of a number of other public companies, including his past performance as a board member of the Company.
Mr. Babbio—our board considered his strong business skills and experience, extensive knowledge of financial and operational matters and his service on boards of other public companies, including his long history of service as a board member of the Company.
Mr. Coleman—our board considered his leadership roles, his long history of board service to the Company, his extensive experience as a board member of other public companies and his sports industry background.
Governor Kean—our board considered his varied experience in government, education and the private sector and his extensive history with the Company, as well as his prior service on boards of other public companies.
Mr. Ksansnak—our board considered his extensive financial and business background, his food industry background, his long history with the Company, and his experience serving on the board of a number of public companies, including his past performance as a board member of the Company.
Mr. Lee—our board considered his financial acumen and business leadership skills gained during his tenure at Warburg Pincus and his experience serving on the boards of a number of other public companies, including his past performance as a board member of the Company.
Mr. Mehra—our board considered his financial acumen and business leadership skills gained during his tenure at Goldman Sachs and his experience serving on the boards of a number of other public companies, including his past performance as a board member of the Company.
Mr. Murray—our board considered his financial acumen and business leadership skills gained during his tenure at CCMP, and prior to that, at JP Morgan Partners, and his experience serving on the boards of a number of other public companies, including his past performance as a board member of the Company.
Role of Board in Risk Oversight
The board of directors has extensive involvement in the oversight of risk management related to us and our business and accomplishes this oversight through the regular reporting by the Audit Committee. The Audit Committee represents the board of directors by periodically reviewing our accounting, reporting and financial practices, including the integrity of our financial statements, the surveillance of administrative and financial controls and our compliance with legal and regulatory requirements. Through its regular meetings with management, including the accounting, finance, legal, and internal audit functions, the Audit Committee reviews and discusses all significant areas of our business and summarizes for the board of directors all areas of risk and the appropriate mitigating factors. In addition, our board of directors receives periodic detailed operating performance reviews from management.
Controlled Company Exception
After the completion of this offering, certain stockholders will continue to beneficially own a majority of the voting power of all outstanding shares of our common stock. Under the NYSE corporate governance standards, a company of which more than 50% of the voting power is held by an individual, group or another company is a “controlled company” and may elect not to comply with certain corporate governance standards, including (1) the requirement that a majority of the board of directors consist of independent directors, (2) the requirement that we have a compensation committee that is composed entirely of independent directors with a written charter addressing the committee’s purpose and responsibilities, (3) the requirement that we have a nominating and corporate governance committee that is composed entirely of independent directors with a written charter
89
Table of Contents
addressing the committee’s purpose and responsibilities and (4) the requirement for an annual performance evaluation of the nominating and corporate governance and compensation committees. Following this offering, we intend to utilize certain of these exemptions. As a result, following this offering, we will not have a majority of independent directors on our board of directors; and we will not have a nominating and corporate governance committee or a compensation committee that is composed entirely of independent directors. Also, such committees will not be required to be subject to annual performance evaluations. Accordingly, you will not have the same protections afforded to stockholders of companies that are subject to all of the NYSE corporate governance requirements. In the event that we cease to be a “controlled company,” we will be required to comply with these provisions within the transition periods specified in the NYSE corporate governance rules.
Board Committees
After the completion of this offering, our board of directors will have five standing committees: the Audit and Corporate Practices Committee (the “Audit Committee”), the Compensation and Human Resources Committee (the “Compensation Committee”), the Nominating and Corporate Governance Committee (the “Nominating Committee”), the Finance Committee and the Stock Committee.
Each of our standing committees operates under a written charter approved by our board of directors. The charters of each of our standing committees will be available on our website upon completion of this offering. The board and each of our standing committees other than the Stock Committee, perform self-evaluations on an annual basis.
Our chief executive officer and president and other executive officers regularly report to the non-executive directors and the Audit, the Compensation, the Nominating and the Finance Committees to ensure effective and efficient oversight of our activities and to assist in proper risk management and the ongoing evaluation of management controls. The vice president of internal audit reports functionally and administratively to our chief financial officer and directly to the Audit Committee. We believe that the leadership structure of our board of directors provides appropriate risk oversight of our activities given the controlling interests held by certain of our stockholders.
Audit Committee
Upon the completion of this offering, we expect to have an Audit Committee, consisting of Messrs. Ksansnak (Chairman), Neubauer, Abbrecht, Coleman and Murray. Messrs. Ksansnak and Coleman, qualify as independent directors under the NYSE corporate governance standards and the independence requirements of Rule 10A-3 of the Securities Exchange Act of 1934, as amended (the “Exchange Act”). Following this offering, our board of directors will determine which member of our Audit Committee qualifies as an “audit committee financial expert” as such term is defined in Item 407(d)(5) of Regulation S-K.
The purpose of the Audit Committee is to prepare the audit committee report required by the SEC to be included in our proxy statement and to assist our board of directors in overseeing and monitoring (1) the quality and integrity of our financial statements, (2) our compliance with legal and regulatory requirements, (3) our independent registered public accounting firm’s qualifications and independence, (4) the performance of our internal audit function and (5) the performance of our independent registered public accounting firm.
Compensation and Human Resources Committee
Upon the completion of this offering, we expect to have a Compensation and Human Resources Committee, consisting of Messrs. Murray (Chairman), Neubauer, Babbio, Coleman, Kean and Mehra.
90
Table of Contents
The purpose of the Compensation and Human Resources Committee is to assist our board of directors in discharging its responsibilities relating to (1) setting our compensation program and compensation of our executive officers and directors, (2) monitoring our incentive and equity-based compensation plans, (3) preparing the compensation committee report required to be included in our proxy statement under the rules and regulations of the SEC and (4) reviewing our contribution policy and practices for our retirement benefit plans.
Nominating and Corporate Governance Committee
Upon the completion of this offering, we expect to have a Nominating and Corporate Governance Committee, consisting of Messrs. Mehra (Chairman), Neubauer, Coleman, Kean and Lee.
The purpose of our Nominating and Corporate Governance Committee is to assist our board of directors in discharging its responsibilities relating to (1) identifying individuals qualified to become new members of the board of directors, consistent with criteria approved by the board of directors, subject to the Stockholders Agreement; (2) reviewing the qualifications of incumbent directors to determine whether to recommend them for reelection and selecting, or recommending that the board of directors select, the director nominees for the next annual meeting of stockholders; (3) identifying board of directors members qualified to fill vacancies on any board of directors committee and recommending that the board of directors appoint the identified member or members to the applicable committee, subject to the Stockholders Agreement; (4) reviewing and recommending to the board of directors corporate governance principles applicable to us; (5) overseeing the evaluation of the board of directors and management; and (6) handling such other matters that are specifically delegated to the committee by the board of directors from time to time.
Finance Committee
Upon completion of this offering, we expect to have a Finance Committee, consisting of Messrs. Lee (Chairman), Neubauer, Abbrecht, Babbio and Ksansnak.
The purpose of our Finance Committee is to assist our board of directors in discharging its responsibilities relating to the review of our long-term business direction and goals and the strategy for maintaining that direction and achieving those goals. In connection with its fulfillment of this responsibility, the Finance Committee reviews with management and recommends to the board of directors our overall financial plans, including capital expenditures, acquisitions and divestitures, securities issuances and incurrences of debt, and reviews the performance of our retirement benefit plans. It will also recommend to our board of directors specific transactions involving these matters, and it has been empowered by our board of directors to approve certain financial commitments and acquisitions and divestitures by us up to specified levels.
Stock Committee
Upon completion of this offering, we expect to have a Stock Committee, consisting of Messrs. Coleman and Kean.
The Stock Committee has authority to approve specific transactions involving our equity compensation plans and common stock between our officers and directors and us. The Stock Committee also approves performance targets under our Senior Executive Annual Performance Bonus Plan.
Code of Ethics
We have adopted a Business Conduct Policy that applies to all of our directors, officers and employees, including our principal executive officer, principal financial officer and principal accounting officer, which is available on the Investor Relations section of our website at www.aramark.com. Our Business Conduct Policy contains a “code of ethics,” as defined in Item 406(b) of Regulation S-K. Please note that our Internet website
91
Table of Contents
address is provided as an inactive textual reference only. We will make any legally required disclosures regarding amendments to, or waivers of, provisions of our code of ethics on our Internet website.
Executive Compensation
Compensation Discussion and Analysis
Background
Fiscal 2012 was a year of significant change for the Company. Joseph Neubauer, who had served as our Chairman and Chief Executive Officer for almost thirty years, stepped down as our Chief Executive Officer effective May 7, 2012. On May 7, 2012, our board approved the appointment of Eric J. Foss as our Chief Executive Officer and President after an exhaustive search for Mr. Neubauer’s successor. This compensation discussion and analysis provides information regarding our executive compensation programs for the following executive officers in fiscal 2012:
| • | Joseph Neubauer, our Chairman and former Chief Executive Officer |
| • | Eric J. Foss, our Chief Executive Officer and President |
| • | L. Frederick Sutherland, our Executive Vice President and Chief Financial Officer |
| • | Lynn B. McKee, our Executive Vice President, Human Resources and Communications |
| • | Joseph Munnelly, our Senior Vice President, Controller and Chief Accounting Officer |
| • | Karen A. Wallace, our Vice President and Treasurer |
Mr. Foss’ Employment Arrangements
After extensive negotiations, we entered into an employment letter agreement with Mr. Foss in connection with his appointment as Chief Executive Officer and President of the Company that provides for a total annual compensation package to Mr. Foss based on a total annual compensation value at the 75th percentile of the Company’s market peer group of companies. Mr. Foss’ compensation package consists of the following elements:
| • | an annual base salary of $1,350,000 until December 2012, subject to periodic review by the compensation committee; |
| • | a guaranteed bonus of $1,012,500 for fiscal 2012, which is equal to his target bonus, prorated for six months; |
| • | a target bonus for fiscal 2013 that will be equal to 150% of his annual base salary; |
| • | a one-time signing bonus of $500,000 that was intended to cover commuting and relocation expenses; |
| • | eligibility to participate in all retirement, welfare and perquisite programs applicable to senior executives of the Company at benefit levels applicable to senior executives; |
| • | a $2,000 per month car allowance; |
| • | an installment stock purchase opportunity, or ISPO, to purchase 500,000 shares of our common stock; |
| • | a nonqualified stock option to purchase 1,450,000 shares of our common stock; |
| • | severance arrangements if we terminate Mr. Foss without cause or if he resigns for good reason (as defined in his employment letter agreement); |
| • | a commitment that Mr. Foss will receive an equity grant in June 2013 in accordance with the 75th percentile target discussed above. |
92
Table of Contents
Under his employment letter agreement, Mr. Foss agreed to invest $3,750,000 through the purchase of our common stock. He also agreed to exercise one hundred percent of the first installment of ISPO grant and purchase the 100,000 shares in that tranche. Mr. Foss will be required to hold our common stock having a fair market value equal to six times his base salary. During his employment term and for a period of two years thereafter, Mr. Foss will be subject to restrictions on competition with the Company.
Amendment to Mr. Neubauer’s Employment Agreement
On November 14, 2012, our board approved the third amendment to Mr. Neubauer’s employment agreement. The amendment provides that Mr. Neubauer will remain an employee of the Company until December 31, 2013 at an annual base salary of $700,000 commencing on January 1, 2013, which is equal to the portion of his salary he would receive under his supplemental executive retirement benefit. Under the amendment, Mr. Neubauer’s fiscal 2012 bonus will be no less than $1.95 million (equal to his 2009 bonus) and his fiscal 2013 bonus will be equal to 50% of his average bonus for fiscal 2010, 2011 and 2012, which is equal to the portion of his bonus he would receive under his supplemental executive retirement benefit. The amendment also provides that following Mr. Neubauer’s termination of employment for any reason, all of his stock options and installment stock purchase opportunities will continue to vest as if his employment had not been terminated based upon passage of time and, his performance-based options will vest, based upon actual achievement of performance targets. In addition, all of Mr. Neubauer’s stock options and installment stock purchase opportunities will remain exercisable for their stated term, rather than expiring after a certain period following termination of employment (customarily 90 days or one year, depending on the reason for termination). The definition of “good reason” under Mr. Neubauer’s employment agreement was amended to remove “material reduction in duties or authority” and replace it with “material diminution of his title as Chairman.” Finally, the amendment provides that for purposes of calculating Mr. Neubauer’s annual supplemental retirement benefit, his salary will be deemed fixed at $1.4 million and his average bonus will be equal to the average of his bonuses for fiscal 2010, 2011 and 2012 ($2,233,333). Mr. Neubauer will continue to be entitled to some of the perquisites that he had previously, including secretarial support and use of an office, a Company-provided car and driver and the Company airplane, subject to availability.
Equity Compensation Background
Each of our named executive officers holds a number of stock options he or she was granted in connection with our 2007 Transaction (or, in the case of Messrs. Foss and Munnelly, following the commencement of their employment with us) and in connection with later management realignments and compensatory grants. These stock options have historically served as a substantial component of our compensation program for our named executive officers and have provided significant motivation and retention value to us for two reasons:
| • | As a private company, the investment in our common stock generally was illiquid while our named executive officers remained employed by us, subject only to the specified rights of the Company to repurchase stock following a termination of employment and the executive’s right to cause such repurchase under certain circumstances following termination of employment or in specified amounts at specified times with respect to shares originally bought in connection with the 2007 Transaction. Our named executive officers will be subject to restrictions on transfer for a period of (subject to reduction to the extent the Sponsors reduce their ownership of the Company) and stock ownership guidelines going forward. |
| • | Historically, one-half of all stock options granted (other than ISPOs) have had a time-based vesting schedule and vest over a four-year period, provided that the employee continues to be employed by us. The other half of the stock options (other than ISPOs) have been performance-based and require that we achieve specified financial targets before those stock options will vest. Each ISPO award is divided into 5 installments that vest over a period of between four and five years. See “Components of Executive Compensation—Equity Incentives.” |
93
Table of Contents
New Equity Compensation Program
In fiscal 2013, the compensation committee reviewed our equity program and determined to align it more closely to that of public companies, by utilizing restricted stock, time-based stock options and restricted stock units and discontinuing the grant of ISPOs. In connection with that determination, the Company commenced an exchange offer in June 2013 whereby holders of outstanding ISPO awards had the ability to exchange such awards for new grants of restricted stock and non-qualified stock options, as further described below under “Components of Executive Compensation—Equity Incentives.”
Our Executive Compensation Policy
Our compensation programs are designed to support our overall commitment to continued growth and the provision of quality services to our clients and consumers. Our programs are focused on three important goals:
| • | Attraction and Retention—to enable us to recruit and retain the best performers; |
| • | Company and Individual Performance—to provide compensation levels consistent with the executive’s level of contribution and degree of accountability; and |
| • | Alignment and Stockholder Value Creation—to use performance measures consistent with our goals and to include a significant portion of incentive compensation to motivate business results and strengthen the connection between the long-term interests of our executives and the interests of stockholders by encouraging each executive to maintain a significant ownership interest in us. |
Attraction and Retention
Our compensation programs are an integral part of attracting and retaining our named executive officers. In November 2012, the compensation committee’s consultant, Frederic W. Cook & Co., Inc. confirmed to the compensation committee that these programs are competitive with those of others in our industry and are well balanced to provide annual and longer-term capital accumulation opportunities by way of salary, annual incentives and equity interests. As described below under “Components of Executive Compensation,” with regard to cash compensation for our named executive officers, we aim to be between the median and 75th percentile in our industry, and our total cash compensation generally is in line with that target. Equity awards for our management committee members are targeted from the median to the 75th percentile of peer companies. All of our stock options, including both time-based and performance-based options, generally vest over four years. Our ISPOs are divided into 5 installments, vest over a period of between four and five years and have set exercise periods.
Company and Individual Performance
Our business requires us to deliver exceptional, value-driven experiences to our clients and consumers. Our compensation programs, particularly our bonus plans, are designed to reward all executives, including our named executive officers, who perform to or exceed our standards by recognizing each executive’s scope of responsibilities, and management capabilities, and providing incentives to him or her to optimize Company-wide financial results including, among other measures, earnings before interest and taxes, or EBIT.
Alignment and Stockholder Value Creation
We attempt to align our named executive officers’ and other executives’ goals with those of our clients, consumers and stockholders. As a result of our 2007 Transaction, our named executive officers’ and other executives’ interests have been strongly aligned with our stockholders since a significant amount of our named executive officers’ and other executives’ personal capital has been invested in the Company. In addition, because historically 50% of stock options granted have been subject to performance-based vesting, if we perform well and satisfy the EBIT targets for performance vesting of stock options as described below in “Components of
94
Table of Contents
Executive Compensation—Equity Incentives,” portions of the total number of stock options held by our named executive officers will vest. Therefore, if any executive helps us to achieve corporate EBIT growth, he or she can have a direct impact on the vesting of a portion of his or her equity. This emphasis on long-term compensation underscores the importance of maintaining our executives’ focus on creating long-term success and sustained stockholder value.
Role of Compensation Consultants
The compensation committee originally engaged Frederic W. Cook & Co., Inc. as its compensation consultant in October 2007 and has reengaged Frederic W. Cook & Co., Inc. each fiscal year since that time. Prior to that engagement, from time to time, the compensation committee had consulted with Frederic W. Cook & Co., Inc. and our Human Resources Services department had discussed with Frederic W. Cook & Co., Inc. the design of programs that affect executive officer compensation. Ms. McKee, our Executive Vice President, Human Resources, participated in the selection of and discussions with representatives from Frederic W. Cook & Co., Inc. None of our other executive officers has participated in the selection of any particular compensation consultant. Frederic W. Cook & Co., Inc. has provided us with market intelligence and guidance on compensation trends, along with general views on specific compensation programs being designed by our Human Resources management. Management consulted with both Frederic W. Cook & Co., Inc. and Towers Watson regarding the design of the equity compensation programs and other compensation issues in connection with the 2007 Transaction. While only the compensation committee may formally engage compensation consultants with respect to the compensation of executive officers and directors, our management may seek the advice of these or other compensation consultants from time to time with the approval of our compensation committee chairman. In addition, only the compensation committee has the right to terminate Frederic W. Cook & Co., Inc., its compensation consultant.
The compensation committee re-engaged Frederic W. Cook & Co., Inc. in November 2011 to assist in the evaluation of compensation for our named executive officers (other than Mr. Foss and Ms. Wallace) and our board of directors, as well as other compensation-related matters for fiscal 2011. In March 2012, the compensation committee called upon Frederic W. Cook & Co., Inc. to assist in the evaluation and recommendation of compensation (including equity compensation) for Mr. Foss in connection with his appointment as our Chief Executive Officer and President in May 2012. In connection with its own assessment of our compensation risk, in September 2012, the compensation committee asked Frederic W. Cook & Co., Inc. to assist it in its review of our compensation policies and practices for the purpose of making a determination regarding whether risks arising from those policies or practices are reasonably likely to have a material adverse effect on us. In addition, the compensation committee asked Frederic W. Cook & Co., Inc. to review the compensation of the named executive officers other than Mr. Munnelly and Ms. Wallace and to make recommendations for those officers’ fiscal 2012 bonus and calendar 2013 salary. In early 2013, Frederic W. Cook & Co., Inc. assisted the compensation committee with the redesign of the Company’s equity compensation program and recommendations for equity awards to our named executive officers.
In October 2008, Frederic W. Cook & Company, Inc. assisted the compensation committee with the reconfiguration of our peer group of companies to which the compensation committee benchmarks compensation for our named executive officers. Since 2008, our peer group has consisted of Cintas, Compass Group PLC, Darden Restaurants, FedEx, Hertz, Manpower, Marriott, McDonald’s, RR Donnelley, Ryder System, Starbucks, SYSCO, Tyco International, UPS, Waste Management and Yum Brands. In terms of size, our revenues approximate the median of the peer companies, our enterprise value approximates the 25th percentile and the number of our employees is above the 75th percentile. Total cash compensation paid to our named executive officers in fiscal 2012 was generally between the median and the 75th percentile, which is consistent with our competitive positioning. Base salaries paid to our named executive officers in fiscal 2012 generally approximated the 75th percentile of peer companies and target bonus as a percentage of base salary generally approximated the median.
95
Table of Contents
Role of Compensation Committee and Executive Officers
The compensation committee is responsible for the oversight of our executive compensation program. The compensation committee or its subcommittee makes or approves all decisions concerning compensation awarded to our named executive officers. The stock committee approves transactions (including equity grants) with our executive officers. Although Mr. Neubauer is a member of the compensation committee, he recuses himself from compensation committee discussions regarding his own compensation.
Messrs. Neubauer, Foss and Sutherland and Ms. McKee are members of our management committee. Compensation decisions for the management committee are made differently than those for our other executive officers. Decisions with regard to Mr. Foss’ initial compensation were made in connection with his recruitment and were subject to a different process. These distinctions are described in more detail below.
Mr. Foss
Ms. McKee negotiated Mr. Foss’ initial compensation package on behalf of the Company, with input from the compensation committee and our board and assistance from Frederic W. Cook & Co., Inc. and outside legal counsel. Frederic W. Cook & Co., Inc. was engaged to provide assistance with the Company’s offer to Mr. Foss and the subsequent negotiation of that offer, which was based on benchmarking data with regard to compensation paid to other chief executive officers in our peer group and general market survey data. Representatives of Frederic W. Cook & Co., Inc. prepared an initial term sheet for review by the compensation committee, which reflected the Company’s goal of maintaining its existing compensation structure and supporting the Company’s philosophy of stockholders maintaining a substantial investment in the Company. To that end, the Company determined to offer Mr. Foss minimum equity grants that were consistent with the 75th percentile of our peer companies, which follows our current philosophy with regard to the management committee. In addition, his total annual compensation was targeted to the 75th percentile of the Company’s market peer group. Mr. Foss was asked to invest $3,750,000 in shares of our common stock, as well as to exercise his 100,000 ISPOs that vested immediately upon grant so that he would have a substantial amount of his personal wealth invested in the Company, consistent with the other members of the management committee. The agreement by Mr. Foss to retain shares of our common stock equal to six times his base salary also reflects the Company’s emphasis on management stockholders maintaining a substantial investment in the Company. The compensation committee felt that Mr. Foss’ perquisites should be consistent with what other senior executives at the Company receive, also consistent with the goal of maintaining the Company’s existing compensation structure.
Under his employment agreement, Mr. Foss is entitled to an equity grant in 2013 such that his total compensation would be equal to the 75th percentile of our market peer group of companies. In June 2013, the compensation committee and the stock committee determined to give Mr. Foss an equity grant with a value of $11,000,015, which exceeded the 75th percentile of our market peer group of companies.
Messrs. Neubauer and Sutherland and Ms. McKee
For fiscal 2012, our Human Resources department initially prepared a tally sheet for use by Frederic W. Cook & Co., Inc. in its analysis of the compensation of our management committee members. The tally sheet contains the following information for each of our management committee members: current base salary, bonus target and prior year’s bonus award, current year option grant and current equity holdings. Frederic W. Cook & Co., Inc. used the information contained in the tally sheet along with market data (relating to our peer group plus several additional companies with whom we compete for talent, as well as general industry data) to prepare a report and recommendation to the compensation committee, which it provided directly to the chairman of the compensation committee. Frederic W. Cook & Co., Inc. then provided the report to Ms. McKee and discussed the report with the chairman of the compensation committee and Ms. McKee. With regard to bonus awards, our Human Resources department also prepared a report containing hypothetical bonus amounts that the management committee members could have received under the Management Incentive Bonus Plan based on business results, including revenue, EBIT and cash flow and, for Mr. Sutherland, new sales and client retention for the business for which he is responsible.
96
Table of Contents
For 2012 base salary recommendations, which were determined in November 2011, Ms. McKee engaged in discussions with Mr. Neubauer regarding Mr. Sutherland’s calendar 2012 base salary. Following this consultation, Mr. Neubauer presented a recommendation for Ms. McKee’s base salary and Ms. McKee presented the recommendations for Messrs. Neubauer’s and Sutherland’s base salaries, to the compensation committee for its consideration. Going forward, Mr. Foss will be involved in base salary recommendations. For 2012 bonuses, which were determined in November 2012, Ms. McKee engaged in discussions with Mr. Foss regarding a bonus recommendation for Mr. Sutherland, which she presented to the compensation committee. Mr. Foss presented a bonus recommendation for Ms. McKee directly to the compensation committee. There was no additional deliberation with regard to Mr. Foss’ fiscal 2012 bonus since it had been guaranteed according to the terms of his employment letter agreement. Ms. McKee consulted with Frederic W. Cook & Co., Inc. with regard to Mr. Neubauer’s fiscal 2012 bonus, understanding that Mr. Neubauer’s bonus could not be less than $1.95 million (pursuant to the amendment to Mr. Neubauer’s employment agreement), and presented a recommendation to the compensation committee. The compensation committee then used this information to make the final decisions regarding executive compensation for our management committee members, including Mr. Neubauer. The compensation committee met in executive session without Mr. Neubauer present when it made decisions with regard to Mr. Neubauer’s compensation.
In July 2013, Mr. Sutherland and Ms. McKee received equity grants consisting of time-based stock options and restricted stock units. The equity grants were generally targeted at the 50th percentile of our market peer group of companies. In making the July 2013 grants the compensation committee was presented with a recommended grant level and delegated to a subcommittee the authority to make individual grants to employees (subject to stock committee approval in the case of executive officers), including the named executive officers, after consultation with management regarding, among other things, individual grant amounts, aggregate amount of equity to be awarded to management, and the effects of stockholder dilution and accounting expense. The stock committee ultimately approved the grants to Mr. Sutherland, Ms. McKee and other executive officers. Mr. Neubauer did not receive an equity grant in July 2013.
Mr. Munnelly and Ms. Wallace
For executives below the management committee level, including Mr. Munnelly and Ms. Wallace, our Human Resources department sends requests for salary and bonus target recommendations to supervisors in October for compensation decisions that will be effective the following year. Mr. Sutherland is Mr. Munnelly’s supervisor and Christopher Holland, our former treasurer, was Ms. Wallace’s supervisor until her promotion in May 2012, when Mr. Sutherland became her supervisor. Supervisors are allotted an annual increase pool (described below) to allocate at their discretion across all of the employees who report directly to them. A portion of that pool is intended for promotions, new hires, market adjustments or equity adjustments that may have occurred throughout the year, but, at the supervisor’s discretion, can be used for on-cycle increases to existing employees. For fiscal 2012, the total pool to be allocated was 2.0% of the total of salaries and bonus targets for the executives that the supervisor oversees, with an additional 0.5% of that total intended for promotions, new hires and market adjustments or equity adjustments. Once the 2012 recommendations were received by the Human Resources department, the recommendations were sent to Ms. McKee and Mr. Neubauer for review and approval. Mr. Neubauer and Ms. McKee were able to make changes to the recommendations based on their assessments of individual performance, in consultation with the particular supervisor. The recommendations were then submitted to the compensation committee for review and the compensation committee used this information to make the final decisions regarding executive compensation for our executives below the management committee level.
In connection with the July 2013 grants described above, Mr. Munnelly and Ms. Wallace were also awarded grants consisting of time-based stock options and restricted stock units, which were generally targeted at the 50th percentile of our market peer group of companies.
The Compensation Committee’s Processes
The compensation committee generally makes its cash compensation decisions at its November meetings. New hires and promotions and other compensation adjustments are considered at its meetings throughout the
97
Table of Contents
year. Annual base salary decisions are made in early November and are effective at the beginning of the next calendar year, while bonus awards earned by our named executive officers generally are determined in late November for the immediately preceding fiscal year. In addition, the bonus pool under the Senior Executive Annual Performance Bonus Plan (the “Bonus Plan”) for the current fiscal year is set at the late November meeting. The compensation committee makes its decisions after review and discussion of recommendations made by Ms. McKee, with input from the chief executive officer, and materials prepared by Frederic W. Cook & Co., Inc., and in the case of bonus recommendations, by our Human Resources department. In addition, with regard to participants in the Bonus Plan, our chief executive officer provides the compensation committee with qualitative assessments of the other management committee members’ performance, including individual business results (with regard to Mr. Sutherland, who oversees our uniform business) and his review of their performance, before it makes its compensation decisions.
Historically, stock options were granted in 2007 to certain of our named executive officers who were employed at that time in connection with their individual investments in the Company. Since that time, stock options have generally been granted in connection with new employment, management realignments and changes in responsibility and from time to time at the discretion of the compensation committee. For fiscal 2012, Mr. Munnelly and Ms. Wallace each received grants of stock options in December 2011 and Mr. Foss received a stock option and ISPO grant in June 2012 in connection with his commencement of employment with us. For fiscal 2013, after consultation with Frederic W. Cook & Co., Inc. and management, each of the named executive officers other than Mr. Neubauer received a grant of time-based stock options and restricted stock units, as more fully described below in “Components of Executive Compensation—Equity Incentives.” The compensation committee is entitled to exercise its discretion with regard to any element of compensation and does exercise negative discretion with regard to bonuses under the Bonus Plan.
Components of Executive Compensation
The principal components of our executive compensation program are base salary, bonus and equity incentives. We also provide employee and post-employment benefits and perquisites.
Base Salary
We use base salary to reflect the value of a particular position—to us and the marketplace—and the value the individual contributes to us. Salary levels for our executives are reviewed at least annually.
Mr. Foss
Mr. Foss’ annual base salary was negotiated in connection with his total compensation package and is $1,350,000 for calendar 2012. While the Company has agreed that Mr. Foss’ total compensation for fiscal 2013 will be at the 75th percentile of chief executive officers in the Company’s peer group, the focus of Mr. Foss’ compensation is equity and therefore, the cash components of Mr. Foss’ compensation (including base salary, which may be increased at the compensation committee’s discretion) may, and often will, be lower than the 75th percentile of our peer companies. Mr. Foss’ base salary was intended to be adjusted in small increments annually. For calendar 2013, the compensation committee raised Mr. Foss’ annual base salary by 3% to $1,390,500, after consultation with Frederic W. Cook & Co., Inc. and based upon market data (benchmarked against salary increases for both chief executive officers in our peer group and chief executive officers in the broader market).
Messrs. Neubauer and Sutherland and Ms. McKee
The specific salary increase for each of our management committee members is typically based upon a review of his or her individual performance along with a comparison to published market data relating to over 500 companies, as well as a review of the peer companies described above. For 2012, salaries for Mr. Sutherland and Ms. McKee were reviewed by Mr. Neubauer. Ms. McKee participated in reviews for Messrs. Neubauer and
98
Table of Contents
Sutherland. Ms. McKee reviewed Mr. Neubauer’s salary with the compensation committee and the compensation committee then met in executive session to make its determination with regard to Mr. Neubauer’s salary. The market and peer group survey of competitive salaries is conducted and recommendations are made to the compensation committee for its review and approval. Salary adjustments generally are effective at the beginning of the following calendar year. Salary increases or decreases also can be recommended and approved in connection with a promotion or a significant change in responsibilities. Base salaries for our management committee members other than Mr. Foss for calendar 2012 were as follows: for Mr. Neubauer, $1,400,000, for Mr. Sutherland, $800,000 and for Ms. McKee, $625,000. For calendar 2013, base salaries are as follows: for Mr. Neubauer, $700,000, for Mr. Sutherland, $824,000, and for Ms. McKee, $643,750. Mr. Sutherland and Ms. McKee received salary increases of 3% for 2013, which is consistent with market increases for similarly situated executives.
Mr. Munnelly and Ms. Wallace
For executives below the management committee level, including Mr. Munnelly and Ms. Wallace, our Human Resources department sends out requests for salary recommendations to supervisors in October for compensation decisions to be effective the following calendar year. Supervisors (Mr. Sutherland is Mr. Munnelly’s and Ms. Wallace’s supervisor and prior to Ms. Wallace’s promotion, Mr. Holland, our former Senior Vice President, Finance and Treasurer, served as Ms. Wallace’s supervisor) were allotted an annual increase pool (2.0% of the total salaries they oversaw for fiscal 2012) to allocate at their discretion across all of the employees who report directly to them. An additional 0.5% of the pool was intended for promotions, new hires or market adjustments that may occur throughout the year. Mr. Munnelly’s and Ms. Wallace’s supervisors evaluated their responsibilities and job performance and made recommendations to the Human Resources department. Recommendations were then sent to Ms. McKee and Mr. Neubauer for review and final approval. Mr. Neubauer and Ms. McKee, in consultation with Mr. Munnelly’s and Ms. Wallace’s supervisors, were able to make changes to the recommendations based upon their assessments of individual performance. The recommendations were then submitted to the compensation committee for approval. The compensation committee then used this information to make the final decisions regarding executive compensation for Mr. Munnelly and Ms. Wallace.
For fiscal 2012, Mr. Munnelly’s base salary was $354,000 from October 2011 through December 2011 and his base salary increased to $361,000 on January 1, 2012. Ms. Wallace’s base salary was $210,000 from October 2011 through December 2011 and was increased to $215,000 on January 1, 2012. Ms. Wallace received another salary increase on May 11, 2012 to $240,000 in connection with her promotion to Treasurer. Mr. Munnelly’s base salary for calendar 2013 is $368,220 and Ms. Wallace’s base salary for calendar 2013 is $244,800. Mr. Munnelly and Ms. Wallace received base salary increases of 2%, which were consistent with the increases allocated by supervisors under their respective pools.
In April 2013, Mr. Sutherland asked the Human Resources department to benchmark Ms. Wallace’s cash compensation against market peer group data for similar positions. After a review of the benchmarking results, Mr. Sutherland determined to recommend an increase in Ms. Wallace’s salary by 15% to $282,500, retroactive to January 1, 2013. He recommended that her bonus target remain at 35% of her base salary. Mr. Foss and Ms. McKee agreed with Mr. Sutherland’s determination and recommended the increase to the compensation committee. The compensation committee approved the adjustment in Ms. Wallace’s cash compensation at its May 2013 meeting.
Bonus
Mr. Foss
Pursuant to Mr. Foss’s Employment Agreement, he was guaranteed a bonus of $1,012,500 for fiscal 2012, which is equal to his target bonus (which is $2,025,000), pro-rated for six months. Even though Mr. Foss was employed by the company for slightly less than five months in fiscal 2012, the board determined to guarantee
99
Table of Contents
one half of his target bonus. In addition, Mr. Foss received a $500,000 signing bonus that was intended to compensate him for expenses relating to commuting and relocating. For fiscal 2013 and beyond, Mr. Foss will have a target bonus that is determined annually by the compensation committee, with the initial target equal to 150% of his base salary, payable upon the Company’s achievement of certain performance targets established annually by the compensation committee under the Bonus Plan, which is described in more detail below. For fiscal 2013, Mr. Foss’ target bonus is $2,085,750, which is equal to 150% of his base salary for 2013.
Messrs. Neubauer and Sutherland and Ms. McKee
In fiscal 2012, Messrs. Neubauer and Sutherland and Ms. McKee participated in the Bonus Plan. Under the Bonus Plan, the compensation committee approved in November 2011 the establishment of a bonus pool that was funded based on 1.15% of adjusted EBIT. This pool method was chosen to satisfy the requirements of the performance-based pay exception to Section 162(m) of the Internal Revenue Code (when we were subject to Section 162(m) prior to the 2007 Transaction), which limits tax deductions for compensation paid to a public company’s named executive officers (other than the chief financial officer) to $1,000,000. Although we are not currently subject to the Section 162(m) compensation deduction limit, following our initial public offering and any applicable phase-in period, we will become subject to the Section 162(m) compensation deduction limit. Therefore, we have continued to operate our Bonus Plan to comply with Section 162(m). For purposes of the Bonus Plan and the formula used to determine the bonus pool approved by the compensation committee, adjusted EBIT is income from both continuing and discontinued operations before income taxes, if any, and before interest expense and other financing costs, in each case as shown on our consolidated financial statements and notes thereto. In addition, the compensation committee adjusted the calculation of adjusted EBIT for purposes of the Bonus Plan to exclude share-based compensation expense and incremental customer relationship amortization and incremental depreciation that resulted from the 2007 Transaction. These adjustments were made to normalize the adjusted EBIT number so that it does not reflect certain non-operational items. For fiscal 2012, our adjusted EBIT under the Bonus Plan was $750,204,000. The following percentages of adjusted EBIT for each of our management committee members represent the maximum amount that could have been awarded to him or her for fiscal 2012: for Mr. Neubauer, 0.70% (up to the plan maximum of $4,500,000), for Mr. Sutherland, 0.3182%, and for Ms. McKee, 0.2545%. The potential bonus amounts under the Bonus Plan for fiscal 2012 based upon the percentages of adjusted EBIT were as follows: for Mr. Neubauer, $4,500,000, for Mr. Sutherland, $2,387,000, and for Ms. McKee, $1,909,000. For fiscal 2012, the compensation committee exercised negative discretion with regard to the actual bonus amounts awarded to our management committee members and those actual bonus amounts are as follows: for Mr. Neubauer, $2,100,000, for Mr. Sutherland, $625,000 and for Ms. McKee, $460,000. For fiscal 2013, the compensation committee approved the following percentages of adjusted EBIT for each of our management committee members, which represent the maximum amount that can be awarded to him or her in respect of his or her fiscal 2013 bonus: for Mr. Foss, 0.70%, for Mr. Sutherland, 0.30%, for Ms. McKee, 0.25%. Under the third amendment to Mr. Neubauer’s employment agreement, his fiscal 2013 bonus will be a fixed amount of $1,116,667, which is equal to 50% of his average bonus for fiscal 2010, 2011 and 2012.
Bonuses are designed to encourage and reward performance that is consistent with our financial objectives and individual performance goals and targets. In determining the actual bonuses paid to our management committee members other than Messrs. Foss and Neubauer, the compensation committee considers the maximum bonus amount based on the above adjusted EBIT formula and then considers as reference points, in the case of Mr. Sutherland, the individual results of his business, based upon sales, EBIT, managed cash flow (as defined below) and client retention. Other factors include our Company-wide results, based upon sales, EBIT, and managed cash flow (in the case of the management committee members, other than Messrs. Foss and Neubauer), the bonuses awarded by our peer companies to comparable officers and the management committee member’s historical bonus awards. Ms. McKee presented these reference points, along with a specific recommendation based on the analysis performed by Frederic W. Cook & Co., Inc. (at the 75th percentile), except with respect to herself and Mr. Neubauer, to Mr. Foss for his review. After consultation with Mr. Foss, who considers the individual contributions of the management committee members other than himself and Mr. Neubauer (including individual
100
Table of Contents
business results (with regard to Mr. Sutherland) and execution of business strategy), final bonus recommendations for management committee members, other than Messrs. Foss and Neubauer, are made to the compensation committee. The recommendations for fiscal 2012 represented less than the amounts derived from the formula described above. The compensation committee considers the reference points and recommendations and, to the extent that the amount awarded is lower than the maximum bonus payable based on the adjusted EBIT formula, exercises negative discretion to determine the bonus amounts for our management committee members, other than Messrs. Foss and Neubauer. The compensation committee also considers a target amount which represents the compensation committee’s view of a market competitive award based upon a competitive review by Frederic W. Cook and Co., Inc. at the 75th percentile of our peer companies. For fiscal 2012, as determined in November 2011, the bonus targets were $650,000 for Mr. Sutherland and $480,000 for Ms. McKee. For fiscal 2013, as determined in November 2012, bonus targets are $659,200 for Mr. Sutherland and $515,000 for Ms. McKee.
In determining the actual bonus paid to Mr. Neubauer, the compensation committee considered the maximum bonus amount based on the above Bonus Plan formula and considered as reference points the bonuses awarded by our peer companies to their chief executive officers, as well as Mr. Neubauer’s historical bonus awards and Company-wide results, the fact that Mr. Neubauer did not serve as chief executive officer for the entire fiscal year and the Company’s agreement that Mr. Neubauer’s 2012 bonus would not be less than $1.95 million. The chairman of the compensation committee engaged in a discussion with a representative of Frederic W. Cook & Co., Inc., who provided a recommendation of a bonus range for Mr. Neubauer based on a view of bonuses paid to chief executive officers of our peer companies and discussed the recommendation with Ms. McKee. The chairman of the compensation committee then consulted with each of the compensation committee members and received their input. The compensation committee also considered a target amount, which represents the compensation committee’s view of a market competitive award (for fiscal 2012, Mr. Neubauer’s target bonus amount was $2.4 million). The chairman of the compensation committee presented Mr. Neubauer’s bonus recommendation to the compensation committee. The recommendation for fiscal 2012 represented less than the amount derived from the Bonus Plan formula described above. The compensation committee considered the reference points and recommendation and, to the extent that the amount awarded was lower than the maximum bonus payable based on the adjusted EBIT formula, exercised negative discretion to determine the bonus amount for Mr. Neubauer. Mr. Neubauer was not involved in the determination of his bonus for fiscal 2012. For fiscal 2012, Mr. Neubauer was awarded a bonus of $2.1 million which is equal to 46.67% of his maximum bonus potential for fiscal 2012 and is equal to 150% of his base salary. Mr. Neubauer ‘s bonus for 2013 will not be discretionary and will be $1,116,667, which is equal to 50% of his average bonus for fiscal 2012, 2011 and 2010.
Mr. Munnelly and Ms. Wallace
Mr. Munnelly and Ms. Wallace participate in the Amended and Restated Executive Leadership Council Management Incentive Bonus Plan (the “MIB”), which provides annual cash bonuses to eligible executives for the achievement of explicit performance objectives established for each fiscal year. Each November (or at another time during the year in the case of a promotion), the compensation committee sets a bonus target in dollars for each executive who participates in the MIB, which, for fiscal 2012, was composed of two parts: a financial portion representing 70% of the overall potential MIB award, with individual objectives (15%) and employee engagement (7.5%) and training (7.5%) objectives representing the remaining 30%. The financial portion of the MIB award for Mr. Munnelly and Ms. Wallace was based on Company-wide financial targets for fiscal 2012, specifically, sales of $13,637,499,000, adjusted EBIT of $781,631,000 (which excluded incremental customer relationship amortization and incremental depreciation from the 2007 Transaction, currency translation and stock compensation expense) and managed cash flow of $733,968,000, each of which excluded the impact of the NBA and NHL lockouts. Actual adjusted sales for purposes of the MIB of $13,505,860,000 for fiscal 2012 excluded the charges associated with the settlement of a client dispute. Actual adjusted EBIT for purposes of the MIB of $755,907,000 for fiscal 2012 excluded incremental customer relationship amortization and incremental depreciation from the 2007 Transaction and stock compensation expense and excluded charges recorded for various multi-employer pension plan withdrawal liabilities, a tax adjustment at one of our joint ventures and the charges associated with the settlement of a client dispute. Managed cash flow consisted of EBITDA excluding stock compensation expense, less capital
101
Table of Contents
expenditures, minus the change in accounts receivable, minus the change in inventories, plus the change in deferred income and was $729,915,000 for fiscal 2012 and excluded charges recorded for various multi-employer pension plan withdrawal liabilities, a tax adjustment at one of our joint ventures and the charges associated with the settlement of a client dispute. MIB participants are also evaluated on the percentage completion of required training for their particular groups (for Mr. Munnelly and Ms. Wallace, the departments comprising the corporate overhead finance group) and the employee engagement of those groups as measured by survey results. Finally, for fiscal 2012, MIB participants were rated on the achievement of individual objectives, which are established by the executives and approved by their supervisors and are based upon job responsibilities. For fiscal 2012, Mr. Munnelly’s individual objectives that were considered in calculating his bonus award included the successful completion of various Company projects for which he provides leadership, the successful transition of our payment services function to a shared service center and various process improvements. Ms. Wallace’s individual objectives that were considered in calculating her bonus award included the successful extension of our Senior Secured Term Loan, the extension of and increase in our Accounts Receivable Securitization Facility and the completion of the spin-off of our interest in our majority-owned subsidiary, Seamless North America, LLC, to our stockholders, which was completed on October 29, 2012.
The following table describes the threshold, targets and maximum for each of the components of the MIB award in fiscal 2012:
| Business Performance | Payout | |||||||||||||||||||||||
| (Percentage of Target Performance) | (Percentage of Target Payout) | |||||||||||||||||||||||
| Measure |
Threshold | Target | Maximum | Threshold | Target | Maximum | ||||||||||||||||||
| EBIT (25%) |
87.5 | 100 | 110 | 25 | 100 | 200 | ||||||||||||||||||
| Sales (25%) |
90 | 100 | 110 | 25 | 100 | 200 | ||||||||||||||||||
| Managed Cash Flow (20%) |
87.5 | 100 | 110 | 25 | 100 | 150 | ||||||||||||||||||
| Individual Objectives (15%) |
— | 100 | 150 | — | 100 | 150 | ||||||||||||||||||
| Training (7.5%) |
10 | 6 | 3 | 25 | 100 | 150 | ||||||||||||||||||
| Employee Engagement (7.5%) |
3.25 | 3.75 | 4.25 | 25 | 100 | 150 | ||||||||||||||||||
As the table illustrates, the Company must attain a threshold, or minimum, performance on each financial measure for the participant to receive any payout for the measure. If the threshold performance is achieved, the participant will receive 25% of the payout for that measure, which increases to 100% when 100% of the measure is attained. If greater than 100% of the target for a particular measure is achieved, the participant will receive more than 100% payout on that measure up to the maximum amount set forth in the table. Therefore, if the maximum performance of all measures was achieved, Mr. Munnelly and Ms. Wallace could have received up to 175% of their respective target bonus amounts.
For Mr. Munnelly and Ms. Wallace, our human resources department sent out requests for bonus target recommendations to their supervisors in October 2011 for compensation decisions to be effective for fiscal 2012. Mr. Munnelly’s and Ms. Wallace’s supervisors received market data on the total cash compensation for the positions reporting to them that enabled them to determine whether an increase in the bonus target for Mr. Munnelly and Ms. Wallace was warranted and the amount of that increase. The market data consisted of general industry surveys of compensation for similar positions. Mr. Neubauer and Ms. McKee were able to make changes to the recommendations, in consultation with Mr. Munnelly’s and Ms. Wallace’s supervisors, based upon their assessments of Mr. Munnelly’s and Ms. Wallace’s individual performance and the competitiveness of their total cash compensation. The recommendations were then submitted to the compensation committee for review. The compensation committee used this information to make the final decisions regarding bonus targets for our executives, including Mr. Munnelly and Ms. Wallace.
Mr. Munnelly’s bonus target for fiscal 2012 was $178,000. For fiscal 2012, Ms. Wallace had a bonus target of $69,000 from October 2011 through May 2012, when she was promoted to Treasurer. Ms. Wallace’s bonus target from May 2012 through September 2012 was increased to $85,000 in connection with her promotion and based upon market survey data.
102
Table of Contents
The actual award of bonuses under the MIB is based on the mechanical calculation of the financial target (for the 70% financial portion), the achievement of a certain percentage completion of training for the executive’s predetermined group, employee engagement results for the executive’s predetermined group and the supervisor’s assessment of the executive’s achievement of his or her predetermined individual objectives. For fiscal 2012, Mr. Munnelly received a bonus of $174,000 and Ms. Wallace received a bonus of $73,000, which was prorated to reflect her two bonus targets in effect in fiscal 2012. For fiscal 2013, bonus targets will be as follows: for Mr. Munnelly, $181,560, and for Ms. Wallace, $86,700.
For fiscal 2012, our named executive officers’ (other than Mr. Neubauer and Mr. Foss) actual bonus amounts paid ranged from 30.4% to 78.1% of their base salaries.
For fiscal 2013, the compensation committee approved an Amended and Restated Executive Leadership Council Management Incentive Bonus Plan (the “Amended MIB”) in November 2012 to place a greater focus on top-line and bottom line performance (sales and adjusted EBIT) and a functional or business group measure, such as cash flow. The Amended MIB provides for a revised mix of targets: a financial portion representing 80% of the overall potential award and functional or business group objectives representing the remaining 20%. The financial portion of the Amended MIB is based on Company-wide financial targets for fiscal 2013, specifically, a sales target representing 39% of the total target and an adjusted EBIT portion representing 41% of the total target.
Equity Incentives
Historical Grants
Historically, stock options were granted in 2007 to certain of our named executive officers who were employed at that time in connection with their individual investments in the Company. Since that time, stock options have generally been granted in connection with new employment, management realignments and changes in responsibility and from time to time at the discretion of the compensation committee. For fiscal 2012, Mr. Munnelly and Ms. Wallace each received grants of stock options in December 2011 and Mr. Foss received a stock option and ISPO grant in June 2012 in connection with his commencement of employment with us. For fiscal 2013, after consultation with Frederic W. Cook & Co., Inc. and management, each of the named executive officers other than Mr. Neubauer received a grant of time-based stock options and restricted stock units, as more fully described in “Components of Executive Compensation—Equity Incentives.”
As was negotiated with the sponsors in connection with the 2007 Transaction, half of all of the stock options granted through fiscal 2012 had a time-based vesting schedule and vest over a four-year period, while half of all stock options granted through fiscal 2012 were intended to have a performance-based vesting schedule and require that we achieve specified financial targets in addition to the four-year vesting period before those options will vest, subject to the compensation committee’s discretion to accelerate vesting. The 2012 EBIT target of $834.83 million was not achieved as the Company’s adjusted EBIT for fiscal 2012 was $790.1 million and therefore, options whose vesting was or will be subject to the achievement of the 2012 EBIT did not or will not vest unless one of the alternative vesting provisions is later satisfied.
In June 2011, the compensation committee approved amendments to the Management Stock Incentive Plan to permit the issuance of ISPOs, a specialized form of stock option for new hires and promoted employees. The total ISPO award is divided into five equal installments. The first installment, which consists of the option to purchase 20% of the shares in the total award at an exercise price equal to the fair market value on the date of grant, vests immediately upon grant. Any portion of this first installment that is not exercised will be canceled on the first anniversary of the grant date. The holder of the ISPO must exercise at least 25% of this first installment prior to the first anniversary or the remaining ISPO grant will be canceled. Twenty percent of the ISPO grant will vest in each subsequent year on the 15th of December, beginning in December following the grant date anniversary. Assuming the holder exercises at least 25% of the first installment, on each applicable vesting date,
103
Table of Contents
the holder may exercise up to the portion of the grant that has vested during the applicable designated exercise period, which will be the 31-day period beginning with the second installment vesting date (December 15th until the immediately following January 15th). The holder must exercise ISPOs for a minimum of 100 shares in any installment or the exercise will not be valid. Any subsequent vested installments that are not exercised during the relevant exercise period will be canceled, but the holder will still be able to exercise subsequent installments following their vesting in future years (subject to the exercise requirements of the first installment as described above).
New Equity Program
After review of our equity compensation program, which consisted of ISPOs as a vehicle for investment in the Company and stock options, 50% of which were subject to time-based vesting and 50% of which vested based upon the Company’s achievement of annual or cumulative EBIT targets, the compensation committee determined to change our equity program to make it more like the equity programs of large public companies. The new equity program generally consists of time-based stock options and restricted stock units and may in the future include other stock-based awards, including performance-based restricted stock units and stock options.
On June 20, 2013, the compensation committee approved a Fourth Amended and Restated ARAMARK Holdings Corporation 2007 Management Stock Incentive Plan (the “Amended Stock Incentive Plan”). Like its predecessors, the Amended Stock Incentive Plan provides for the issuance of shares of common stock of the Company (“shares”). The Amended Stock Incentive Plan authorizes the compensation committee to make grants of restricted stock units and restricted stock and contains a corresponding provision that restricted stock units or shares of restricted stock that are redeemed, canceled or terminated or are repurchased by the Company (or the shares issued in respect of those instruments that are purchased by the Company) will become available for future equity awards under the Amended Stock Incentive Plan. The compensation committee also approved new forms of award agreements for stock options and restricted stock units, which provide for 100% time-based vesting, with 25% of the award vesting on each of the first four anniversaries of the date of grant, subject to the participant’s continued employment with the Company or one of its subsidiaries through each such anniversary. If the participant’s service with the Company or any of its subsidiaries terminates due to death, disability or retirement (as disability and retirement are defined in the Amended Stock Incentive Plan), the installment of stock options or restricted stock units that is scheduled to vest on the next vesting date following such termination will immediately vest, and all remaining unvested restricted stock units will be forfeited. In the event of a change of control (as defined in the Amended Stock Incentive Plan) prior to a termination of the participant’s service, any remaining unvested stock options and restricted stock units will vest. Participants holding restricted stock units will receive the benefit of any dividends paid on shares in the form of additional restricted stock units.
Amendment to CEO’s Employment Letter Agreement and Equity Grant to CEO
Mr. Foss entered into an amendment to his employment agreement on June 25, 2013 providing that any equity compensation awards granted as part of his compensation package for any fiscal year after 2012 will be in a form and have terms (including vesting conditions) that are the same as those granted to senior management of the Company as determined by the compensation committee from time to time.
Mr. Foss’s June 2013 equity grant, which consisted of 1,247,638 stock options and 271,438 restricted stock units, was made on June 20, 2013, subject to the approval of the Stock Committee of the board, which approval was received on the same date. The stock options have an exercise price equal to the fair market value of a share of the Company common stock on June 20, 2013, which is the most recent appraisal price of our common stock on that date, have a ten year term, vest 25% on each of the first four anniversaries of the date of grant, subject to Mr. Foss’ continued employment with the Company, and contain such other terms as are set forth in the award agreement. The restricted stock units vest 25% on each of the first four anniversaries of the date of grant, subject to Mr. Foss’ continued employment with the Company, and contain such other terms as are set forth in the award agreement.
104
Table of Contents
Equity Grants to Messrs. Sutherland and Munnelly and Ms. McKee and Ms. Wallace
On July 9, 2013 Messrs. Sutherland and Munnelly and Ms. McKee and Ms. Wallace received equity grants consisting of stock options and restricted stock units. Mr. Sutherland received 94,518 stock options and 30,846 restricted stock units; Ms. McKee received 94,518 stock options and 30,846 restricted stock units; Mr. Munnelly received 23,630 stock options and 7,712 restricted stock units; and Ms. Wallace received 9,452 stock options and 3,085 restricted stock units. Each of the stock options granted have an exercise price equal to the fair market value of a share of the Company common stock on the date of grant, which is the most recent appraisal price of our common stock on that date, have a ten year term, vest 25% on each of the first four anniversaries of the date of grant, subject to the holder’s continued employment with the Company, and contain such other terms as are set forth in the award agreement. The restricted stock units vest 25% on each of the first four anniversaries of the date of grant, subject to the holder’s continued employment with the Company, and contain such other terms as are set forth in the award agreement.
ISPO Exchange Offer
On July 29, 2013, the Company closed an exchange offer for all outstanding ISPOs held by certain employees, including certain named executive officers. Under the exchange offer, the Company offered to holders of outstanding ISPO awards the ability to exchange such awards for new grants of restricted stock (“Restricted Stock”) and non-qualified time-based stock options with an exercise price equal to the fair market value of the Company’s common stock on the date of grant (“Replacement Stock Options”), in each case, granted under the Amended Stock Incentive Plan and forms of a Restricted Stock Award Agreement and a non-qualified Replacement Stock Option Award Agreement approved by the Compensation Committee on June 20, 2013. The grants of Restricted Stock and Replacement Stock Options were made to certain of our named executive officers by the Stock Committee on July 31, 2013.
The vesting schedule of the Restricted Stock and Replacement Stock Options is based upon the vesting schedule of the ISPO award that was exchanged. If the participant’s service with the Company or any of its subsidiaries terminates due to death, disability or retirement (as disability and retirement are defined in the Amended Stock Incentive Plan), the installments of Restricted Stock and Replacement Stock Options that are scheduled to vest during the twelve months following such termination will immediately vest and any remaining shares of Restricted Stock and any unvested Replacement Stock Options will be forfeited. In the event of a change of control (as defined in the Amended Stock Incentive Plan) prior to a termination of the participant’s service, any remaining shares of Restricted Stock and any unvested Replacement Stock Options will vest and become nonforfeitable. Replacement Stock Options expire on the date that falls at the end of a number of years that equals (x) 10 minus (y) the number of years that have elapsed from the date of grant of the ISPOs being exchanged through the exchange date (rounded down to the nearest whole year). Upon termination of employment, unvested Replacement Stock Options are immediately forfeited (other than in the case of death, disability or retirement) and vested Replacement Stock Options expire immediately, in the case of termination for cause, and 90 days after termination, in the case of any other termination of employment. The Restricted Stock Award Agreement also provides that a participant may make an election under Section 83(b) of the Internal Revenue Code with regard to his or her restricted stock.
Messrs. Foss and Sutherland and Ms. McKee elected to participate in the exchange offer. Mr. Neubauer did not elect to participate in the exchange offer. Mr. Munnelly and Ms. Wallace did not hold any ISPOs. The following table shows the number of ISPOs each named executive officer exchanged and the number of shares of Restricted Stock and Replacement Stock Options that each of them received in the exchange offer:
| Name |
ISPOs Exchanged | Restricted Stock Granted | Replacement Options Granted |
|||||||||
| Eric J. Foss |
400,000 | 57,002 | 342,998 | |||||||||
| L. Frederick Sutherland |
36,000 | 10,172 | 25,828 | |||||||||
| Lynn B. McKee |
36,000 | 10,172 | 25,828 | |||||||||
105
Table of Contents
Equity Grant Policy
On May 8, 2007, our board of directors adopted a policy on granting equity awards. The board modified the policy in December 2009, March 2010 and June 2011 and the compensation committee modified the policy in June 2013. Under this policy, stock option grants were permitted to be approved by the compensation committee (or a subcommittee thereof) a reasonable period following each new appraisal of our common stock. In addition, the compensation committee was permitted to grant newly hired or promoted executives the right to purchase shares of our common stock through an ISPO. The grant date for stock options and ISPOs was the date the committee or subcommittee approved the grants (or in the case of executive officers, the date of stock committee approval) and the exercise price was the most recent appraisal price in effect on the date of such grant.
Following our initial public offering, the compensation committee intends to make annual awards of equity at its meeting held in November. The compensation committee has in the past, and may in the future, make limited grants of equity on other dates in order to retain key employees, to compensate an employee in connection with a promotion or to compensate newly hired executives for equity or other benefits lost upon termination of their previous employment or to otherwise induce them to join our Company. The grant date of equity grants to executives is the date of compensation committee approval or a later date of subcommittee or stock committee approval if designated by the compensation committee. The exercise price of option grants will be the closing market price of our common stock on the date of grant. We plan to monitor and periodically review our equity grant policies to ensure compliance with plan rules and applicable law.
Other Components of Compensation
Employee and Post-Employment Benefits. We offer basic employee benefits to provide our workforce with a reasonable level of coverage in the event of illness or injury. The cost of certain employee benefits is partially or fully borne by the employee, including each named executive officer. We offer comparable benefits to our eligible U.S. employees, which include medical, dental and vision coverage, disability insurance and optional life insurance. In addition, our named executive officers receive excess medical coverage that provides reimbursement for medical, dental and vision expenses in excess of $1,500 per covered individual per year. Our named executive officers also participate in a Survivor Income Protection Plan, which entitles a surviving spouse or domestic partner and dependent children to receive the executive’s full base salary for one year after the executive’s death and one-half of the executive’s base salary for the subsequent nine years or, alternatively, may receive excess term life insurance. A participant in the Survivor Income Protection Plan who is 65 and has attained 5 years of employment with us is entitled to a benefit equal to one times his or her base salary upon his or her retirement or death in lieu of the benefit described above. Mr. Neubauer will receive this benefit on his retirement. Mr. Neubauer is also entitled to a supplemental retirement benefit as discussed below in “Employment Agreements and Change of Control Arrangements.”
Generally, our highly compensated employees (for 2012, those earning more than $110,000), including our named executive officers, are not eligible to participate in our 401(k) plans because of certain legal requirements. Instead, those employees are eligible to participate in a non-qualified savings plan that we call our Savings Incentive Retirement Plan, the successor plan to our Stock Unit Retirement Plan. This plan is intended to be a substitute for those employees’ participation in our 401(k) plans. See “Nonqualified Deferred Compensation for Fiscal Year 2012” above for further information.
Management Committee
Messrs. Neubauer, Foss and Sutherland and Ms. McKee are also parties to employment agreements that entitle them to lump sum payments and severance if there is a change of control of us or ARAMARK Corporation as described in those agreements and their employment is terminated under specified circumstances. These provisions are intended to align executive and stockholder interests by enabling executives to consider corporate transactions that are in the best interests of the stockholders and our other constituents without concern over whether the transactions may jeopardize the executives’ own employment.
106
Table of Contents
Mr. Foss’ employment agreement contains a “double trigger”—for payments to be made, there must be a change of control followed by an involuntary loss of employment (or resignation by Mr. Foss for “good reason”) within three years or his employment must be terminated in anticipation of a change of control. The agreements with Mr. Sutherland and Ms. McKee were entered into following the 2007 Transaction and also contain a “double trigger.” We chose to implement a “double trigger” for our management committee members other than Mr. Neubauer after receiving advice from Frederic W. Cook & Co., Inc. that a “double trigger” is a more common practice in the market than a “single trigger.” Mr. Neubauer’s employment agreement has a “single trigger” that permits him to resign for any reason within twelve months after a change of control and be paid under his agreement. This single trigger provision has been included in his agreement for at least the past twelve years and was not triggered by our 2007 Transaction because Mr. Neubauer was part of the group that was responsible for the change of control. For more information on change of control and severance payments for our management committee members, see the disclosure under “Employment Agreements and Change of Control Arrangements” and under “Potential Post-Employment Benefits.”
Mr. Munnelly and Ms. Wallace
Mr. Munnelly and Ms. Wallace are each parties to an Agreement Relating to Employment and Post Employment Competition that provides for certain benefits if either Mr. Munnelly or Ms. Wallace should be terminated by us without cause. Those benefits include between 26 and 52 weeks of severance pay, depending on the executive’s length of service with the Company, as well as the continued use of a company car or the continuation of an auto allowance and the continuation of basic health care coverage through the end of the severance pay period. Pursuant to the agreement, the executive must adhere to certain non-disclosure, non-disparagement, non-competition and non-solicitation requirements for various periods of time after termination of employment.
Perquisites. We provide our named executive officers with other benefits, reflected in the All Other Compensation column in the Summary Compensation Table, that we believe are reasonable and encourage retention. We believe that these benefits enable our executives to focus on our business and enhance their commitment to us. In addition, the availability of financial planning services assists those who receive them to optimize the value received from all of the compensation and benefit programs offered. The costs of these benefits constitute a small percentage of each named executive officer’s total compensation, and include premiums paid on life insurance or the Survivor Income Protection Plan, disability insurance (in Mr. Sutherland’s case, a legacy policy the premiums for which are paid 100% by the Company), excess health insurance, use of a car leased by us or receipt of a car allowance, no cost parking at a garage near Company offices, an executive physical, financial planning services and personal use of Company tickets or the Company box and related items at sporting or other events. Generally, Company-provided perquisites are reviewed by the compensation committee in consultation with Frederic W. Cook & Co., Inc. on an annual basis. Based upon the usefulness of such perquisites for retention, the compensation committee determines whether or not to continue them. In November 2010, the compensation committee decided to phase out the Company-leased vehicle in favor of an auto allowance, such that those employees that currently have Company-leased vehicles can retain those vehicles until the end of the lease term or one year beyond the lease term.
Mr. Foss receives benefits under our relocation program that provide him with temporary housing and reimbursement for meals and other incidental expenses. Although the relocation program provides for benefits for a 90-day period to enable new employees to search for and purchase a permanent residence, we may extend the temporary housing benefit due to the tight housing market, work demands and/or family-related issues. In Mr. Foss’ case, we extended his relocation benefits because his work demands delayed him in his search for his permanent residence in the Philadelphia area.
Our compensation committee established a policy, which it has determined to be in our business interest, that directs the Chief Executive Officer to use Company aircraft, whenever possible, for all air travel, whether personal or business. Under the policy, the Chief Executive Officer may also designate other members of senior management to use the Company aircraft for air travel. Some of Mr. Neubauer’s and Mr. Foss’ business use of
107
Table of Contents
the corporate aircraft in fiscal 2012 included flights to attend outside board meetings at the companies or organizations for which they serve as a director or trustee. We believe that Mr. Neubauer’s and Mr. Foss’ service on these boards, and their ability to conduct Company business while traveling to these board meetings, provides benefits to us and therefore deem it to be business use. In addition, depending on seat availability, Mr. Neubauer’s or Mr. Foss’ spouses or family members may accompany them on the Company aircraft. Although there is little or no incremental cost to us for these trips, we reflect a $500 per seat charge in the “All Other Compensation” amounts in the Summary Compensation Table for flights in which those additional passengers’ travel is not business-related (for example, if a spouse’s presence at a business function is not required). Mr. Neubauer and Mr. Foss each have a car and driver that we provide to them. Much of their use of the Company-provided cars and drivers, which generally enables them to make efficient use of travel time, is business use, although both Mr. Neubauer and Mr. Foss utilize the car and driver for commuting to and from the office, which is considered personal use, and for other limited personal use.
Impact of Regulatory Requirements on our Executive Compensation
Sections 280G and 4999. Sections 280G and 4999 of the Internal Revenue Code, respectively, limit our ability to take a tax deduction for certain “excess parachute payments” (as defined in Sections 280G and 4999) and impose excise taxes on each executive that receives “excess parachute payments” in connection with his or her severance from us in connection with a change of control. The compensation committee considered the adverse tax liabilities imposed by Sections 280G and 4999, as well as other competitive factors, when it structured certain post-termination compensation payable to our named executive officers. The potential adverse tax consequences to us and/or the executive, however, are not necessarily determinative factors in such decisions. Our agreements with Messrs. Neubauer and Sutherland and Ms. McKee relating to employment require us to make a gross-up payment to compensate them for any excise taxes (and income taxes on such gross-up payment) that they incur under Section 4999 and other similar local tax laws as a result of these provisions. Mr. Foss’ agreement does not provide for such gross-up payments, as the compensation committee was advised that it is no longer a common practice in the marketplace.
Compensation Committee Interlocks and Insider Participation
Mr. Neubauer, who is our Chairman and former Chief Executive Officer (and remains an employee of the Company), serves on our Compensation and Human Resources Committee.
Please see “Certain Relationships and Related Party Transactions” for information on transactions with JPMorgan and Goldman Sachs. Stephen P. Murray, Chairman of our Compensation and Human Resources Committee, is the President and Chief Executive Officer of CCMP Capital Advisors, LLC (“CCMP”), a private equity firm specializing in buyout and growth equity investments. Pursuant to an agreement with JPMorgan and J.P. Morgan Partners, LLC, CCMP advises J.P. Morgan Partners with respect to certain of its private equity investments, including its investment in us. Sanjeev Mehra, a member of our Compensation and Human Resources Committee, is Managing Director of Goldman Sachs & Co.’s Principal Investment Area of its Merchant Banking Division.
Compensation Risk Disclosure
As part of its oversight responsibilities, the compensation committee considered the impact of our compensation programs on our risk profile and whether these programs promote excessive risk taking. Based on its review and the recommendation of its compensation consultant, the compensation committee determined that our compensation programs are appropriately structured and that risks arising from our compensation programs are not reasonably likely to have a material adverse affect on us for the following reasons, among others:
| • | our compensation programs are well aligned with sound compensation design principles; |
| • | our Bonus Plan and the Management Incentive Bonus Plan utilize several financial performance measures at the corporate level, which cannot be easily manipulated by any one individual; |
108
Table of Contents
| • | none of our individual business areas pose a significant business risk to the overall enterprise; |
| • | post-initial public offering transfer restrictions and our stock ownership guidelines ensure a long-term focus by our executives on our growth and long-term viability; and |
| • | equity compensation constitutes a meaningful portion of pay for most senior executives and focuses them on enhancing long-term stockholder value over a multi-year period. |
Summary Compensation Table
The following table lists the compensation we paid to our named executive officers as required to be disclosed:
| Name and Principal |
Year | Salary(1) | Bonus(2) | Option Awards(3) |
Non-Equity Incentive Plan Compensation |
Change in Pension Value and Non-Qualified Deferred Compensation Earnings(4) |
All
Other Compensation(5) |
Total | ||||||||||||||||||||||||
| Joseph Neubauer |
2012 | 1,375,000 | 2,100,000 | — | — | 2,198,736 | 388,092 | 6,061,828 | ||||||||||||||||||||||||
| Chairman and former Chief Executive Officer |
2011 | 1,300,000 | 2,500,000 | 1,824,000 | — | 1,497,083 | 258,437 | 7,379,520 | ||||||||||||||||||||||||
| 2010 | 1,300,000 | 2,100,000 | 2,006,500 | — | 1,404,705 | 202,194 | 7,013,399 | |||||||||||||||||||||||||
| Eric J. Foss |
2012 | 545,192 | 1,512,500 | 5,658,563 | — | — | 339,240 | 8,055,495 | ||||||||||||||||||||||||
| Chief Executive Officer and President |
||||||||||||||||||||||||||||||||
| L. Frederick Sutherland |
2012 | 787,500 | 625,000 | 111,875 | — | 16,655 | 57,661 | 1,598,691 | ||||||||||||||||||||||||
| EVP and Chief Financial Officer |
2011 | 750,000 | 650,000 | 816,925 | — | 15,385 | 51,273 | 2,283,583 | ||||||||||||||||||||||||
| 2010 | 750,000 | 600,000 | 1,324,543 | — | 14,113 | 55,023 | 2,743,679 | |||||||||||||||||||||||||
| Lynn B. McKee |
2012 | 616,250 | 460,000 | 111,875 | — | 9,189 | 36,436 | 1,233,750 | ||||||||||||||||||||||||
| EVP, Human Resources and Communications |
2011 | 590,000 | 500,000 | 816,925 | — | 8,389 | 40,392 | 1,955,706 | ||||||||||||||||||||||||
| 2010 | 586,538 | 450,000 | 969,096 | — | 7,599 | 44,805 | 2,058,038 | |||||||||||||||||||||||||
| Joseph M. Munnelly |
2012 | 359,250 | — | 137,625 | 174,000 | 674 | 39,531 | 711,080 | ||||||||||||||||||||||||
| SVP, Controller and Chief Accounting Officer |
2011 | 351,750 | — | — | 190,000 | 433 | 37,208 | 579,391 | ||||||||||||||||||||||||
| Karen A. Wallace |
2012 | 223,462 | — | 22,020 | 73,000 | 896 | 25,637 | 345,015 | ||||||||||||||||||||||||
| Vice President and Treasurer |
||||||||||||||||||||||||||||||||
| (1) | Messrs. Neubauer, Sutherland and Munnelly and Ms. McKee and Ms. Wallace deferred a portion of their salaries for the years presented under the 2007 Savings Incentive Retirement Plan. These amounts for fiscal 2012 are reflected in the Non-Qualified Deferred Compensation Table for Fiscal Year 2012 and in this column. |
| (2) | Mr. Foss’ bonus amount includes a signing bonus of $500,000, which was intended to cover relocation and commuting expenses, as well as $1,012,500, which is his target bonus, prorated for six months. |
| (3) | This column represents the aggregate grant date fair value computed in accordance with FASB ASC Topic 718 with respect to the 2012, 2011 and 2010 fiscal years for the stock options granted to each of the named executive officers in 2012, 2011 and 2010, respectively. The grant date fair value for performance-based stock options granted in fiscal 2012 reflects the value attributable only to those options whose vesting is based on 2012 targets (also includes performance-based stock options granted in 2011, whose vesting is subject to the 2012 EBIT target, which was set in November 2011), as targets for later years had not been determined. As future targets are determined in future years, additional grant date fair value will be reflected in the years in which such targets are set. See “Grants of Plan Based Awards for Fiscal Year 2012” for additional information on stock options granted or deemed granted in 2012. For additional information on the valuation assumptions and more discussion with respect to the stock options, refer to Note 10 to the consolidated financial statements contained in this prospectus. |
| (4) | Includes amounts earned on deferred compensation in excess of 120% of the applicable federal rate, based upon the above-market return at the time the rate basis was set. The amounts attributable to Mr. Neubauer’s above-market earnings on deferred compensation were $52,943 in 2012, $49,382 in 2011, and $45,518 in 2010. Also includes, for Mr. Neubauer, $2,145,793 in 2012, $1,447,701 in 2011 and $1,359,187 in 2010, which are the aggregate changes in the actuarial present value of his supplemental executive retirement benefit for such years. See “Employment Agreements and Change of Control Arrangements” and “Pension Benefits for Fiscal Year 2012.” |
109
Table of Contents
| (5) | The following are included in this column for 2012: |
| a. | The aggregate incremental cost to us of the following perquisites: car allowance payments or the cost to us of providing the named executive officer a Company-leased vehicle (including maintenance, insurance and fees), premium payments for disability insurance, premium payments for an excess health insurance plan, payments for an executive physical, parking fees paid by the Company, costs associated with personal use of Company-owned tickets or the Company-owned suite at sports stadiums, relocation expenses with respect to Mr. Foss, and, for Messrs. Neubauer and Foss, personal use of the Company aircraft and personal use of a Company-provided car and driver. |
| b. | With regard to Mr. Neubauer, $93,713 for Mr. Neubauer’s personal use of the Company aircraft. With regard to Mr. Foss, $144,218 for Mr. Foss’ personal use of the Company aircraft, $94,362 for relocation expenses incurred by Mr. Foss and paid under our relocation program or reimbursed to Mr. Foss (including a tax gross up of $38,663 as provided for in the program) and $48,143 for legal expenses we paid on behalf of Mr. Foss in connection with the negotiation of his employment arrangements with us. The calculation of incremental cost for personal use of Company aircraft includes the variable costs incurred as a result of personal flight activity: a portion of ongoing maintenance and repairs, landing fees, aircraft fuel, telephone communications and any travel expenses for the flight crew. |
| c. | With respect to each individual listed in the table other than Mr. Foss, the amount of Company matching contributions to the Savings Incentive Retirement Plan for fiscal 2012 ($10,200 for Messrs. Neubauer, Sutherland and Munnelly and Ms. McKee and $8,003 for Ms. Wallace). |
| d. | Premium payments for term life insurance or the Survivor Income Protection Plan as follows: for Mr. Neubauer, $244,090, for Mr. Foss, $686, for Mr. Sutherland, $23,427, for Ms. McKee, $5,121, for Mr. Munnelly, $1,659 and for Ms. Wallace, $830. |
Grants of Plan-Based Awards for Fiscal Year 2012
The following table provides information about equity awards granted or deemed granted to our named executive officers in fiscal 2012: (1) the grant date, (2) estimated future payouts under equity incentive plan awards, which consist of the stock options with performance-based vesting schedules, (3) estimated future payouts under non-equity incentive plan awards, which consist of potential awards under the MIB, (4) all other option awards, which consist of the number of shares underlying stock options with time-based vesting schedules, (5) the exercise price of the stock option awards, which reflects the most recent appraisal price of our common stock on the date of grant and (6) the grant date fair value of each equity award computed under FASB ASC Topic 718.
All of the grants in the Grants of Plan-Based Awards for Fiscal Year 2012 table, the Outstanding Equity Awards at 2012 Fiscal Year-End table and the Options Exercises and Stock Vested Table for Fiscal Year 2012 refer to grants of options to purchase shares of our common stock.
| Grant Date |
Estimated Future Payouts under Non-Equity Incentive Plan Awards(1) |
Estimated Future Payouts under Equity Incentive Plan Awards |
All Other Option Awards: Number of Securities Underlying Options |
Exercise or Base Price of Option Awards(3) ($/sh) |
Grant Date Fair Value of Stock and Option Awards(4) |
|||||||||||||||||||||||||||||||
| Threshold ($) |
Target ($) |
Max
($) |
Threshold (#) |
Target (2)(#) |
Max
(#) |
|||||||||||||||||||||||||||||||
| Neubauer |
||||||||||||||||||||||||||||||||||||
| Foss |
6/6/2012 | 500,000 | (5) | $ | 14.96 | $ | 1,430,000 | |||||||||||||||||||||||||||||
| 6/6/2012 | 725,000 | (6) | $ | 14.96 | $ | 3,443,750 | ||||||||||||||||||||||||||||||
| 6/6/2012 | 181,250 | (7) | $ | 14.96 | $ | 784,813 | (8) | |||||||||||||||||||||||||||||
| Sutherland |
11/15/2011 | 31,250 | 31,250 | $ | 12.69 | $ | 111,875 | (8) | ||||||||||||||||||||||||||||
| McKee |
11/15/2011 | 31,250 | 31,250 | $ | 12.69 | $ | 111,875 | (8) | ||||||||||||||||||||||||||||
| Munnelly |
12/7/2011 | 25,000 | (6) | $ | 13.82 | $ | 112,250 | |||||||||||||||||||||||||||||
| 12/7/2011 | 6,250 | 6,250 | $ | 13.82 | $ | 25,375 | (8) | |||||||||||||||||||||||||||||
| 11/15/2011 | $ | 38,092 | $ | 178,000 | $ | 311,500 | ||||||||||||||||||||||||||||||
| Wallace |
12/7/2011 | 4,000 | (6) | $ | 13.82 | $ | 17,960 | |||||||||||||||||||||||||||||
| 12/7/2011 | 1,000 | 1,000 | $ | 13.82 | $ | 4,060 | (8) | |||||||||||||||||||||||||||||
| 11/15/2011 | $ | 16,193 | $ | 75,667 | $ | 132,417 | ||||||||||||||||||||||||||||||
110
Table of Contents
| (1) | The amounts represent the threshold, target, and maximum payouts under our Management Incentive Bonus Plan for the October 1, 2011–September 28, 2012 performance period. The payment for threshold performance is 25% of target on all measures except individual objectives, for which the threshold is 1%. Ms. Wallace’s threshold, target and maximum amounts have been prorated to reflect the increase in her bonus target in connection with her promotion to Treasurer. |
| (2) | Named executive officers may receive all or less than all of the target amount of performance-based options when certain events occur, including the achievement of certain percentage returns by our sponsors. See the discussion under “Performance-Based Stock Options” below. Consists of shares underlying options granted that vest in 25% increments on each of the first four anniversaries of the date of grant and upon the attainment of certain EBIT targets that are established by the compensation committee within the first ninety days of each fiscal year and described in the Compensation Discussion and Analysis and the narrative to the table. These stock options will expire ten years from the date of grant. The EBIT targets associated with the grants of performance-based options are listed below under “Performance Based Stock Options.” |
| (3) | The exercise price of the options reported in the table is the most recent appraisal price of a share of our common stock on the original date of grant. |
| (4) | This column shows the full grant date fair value of stock options granted or deemed granted to our named executive officers in fiscal 2012 under FASB ASC Topic 718. No restricted stock was granted in fiscal 2012. Options deemed granted on November 15, 2011 are those previously granted performance-based options whose vesting is subject to the achievement of the 2012 EBIT target set by the compensation committee on November 15, 2011. For additional information on the valuation assumptions, refer to Note 10 to the consolidated financial statements. These amounts do not correspond to the actual value that will be received by the named executive officers. |
| (5) | These stock options are installment stock purchase opportunities that are divided into 5 installments. The first installment vests immediately upon grant and is exercisable for one year. The remaining installments vest on the first four anniversaries of the December 15th following the grant date and are exercisable for a period of 31 days. At least 25% of the first installment must be exercised or the remaining installments are canceled. As described above under “Compensation Discussion and Analysis—Components of Executive Compensation—Equity Incentives—New Equity Program—ISPO Exchange,” in July 2013, Mr. Foss exchanged his outstanding ISPOs for shares of restricted stock and stock options. |
| (6) | These stock options vest 25% per year over four years and have a ten-year term. |
| (7) | These stock options are performance-based options that vest whether or not the fiscal 2012 EBIT target is satisfied, so long as Mr. Foss remains employed by us through the vesting date, as provided in his employment arrangements. |
| (8) | The grant date fair value for these performance-based stock options reflects the value attributable only to those options whose vesting is based on 2012 targets, as that is the only target that had been determined during fiscal 2012. As future targets are determined in future years, additional grant date fair value will be reflected in the years in which such targets are set. |
Performance-Based Stock Options
The performance targets for 50% of the stock options granted to our named executive officers through fiscal 2012 are based upon our annual EBIT. If we do not achieve the performance target for any particular fiscal year (other than that of the “Final Fiscal Year” for each grant, as defined below), but we do achieve a cumulative performance target at the end of a later fiscal year, then all installments of performance-based options that did not become vested because of a missed performance target or targets in a prior year will vest. Our EBIT targets over the four-year vesting schedule of options granted to our named executive officers in fiscal 2009 and fiscal 2010 are as follows:
| Year |
Annual EBIT Target (in millions) |
Cumulative EBIT Target (in millions) |
||||||
| 2010 |
$ | 718.1 | N/A | |||||
| 2011 |
$ | 748.5 | $ | 1,507.5 | ||||
| 2012 |
$ | 834.8 | $ | 2,366.0 | ||||
| 2013 (the “Final Fiscal Year”) |
$ | 804.2 | $ | 3,299.3 | ||||
111
Table of Contents
In June 2011, our board approved a new Form of Non-Qualified Stock Option Agreement that provides that annual and cumulative EBIT targets for performance-based stock options will be established by the compensation committee within the first ninety days of each fiscal year. Therefore, performance-based options granted to certain of our named executive officers in fiscal 2011 had only an EBIT target for fiscal 2011 and those granted in fiscal 2012 had only an EBIT target for fiscal 2012. In November 2011, the compensation committee established EBIT targets for fiscal 2012, and the EBIT targets for 2013 were approved by the compensation committee in November 2012. EBIT targets for 2014 and later fiscal years will be established within the first ninety days of the respective fiscal year. The EBIT targets for options granted in fiscal 2011 are as follows:
| Year |
Annual EBIT Target (in millions) |
Cumulative EBIT Target (in millions) |
||||||
| 2011 |
$ | 748.5 | N/A | |||||
| 2012 |
$ | 834.8 | $ | 1,583.3 | ||||
| 2013 |
$ | 804.2 | $ | 2,387.5 | ||||
| 2014 (the “Final Fiscal Year”) |
* | * | ||||||
| * | EBIT Target not yet established |
The EBIT targets for options granted in fiscal 2012 are as follows:
| Year |
Annual EBIT Target (in millions) |
Cumulative EBIT Target (in millions) |
||||||
| 2012 |
$ | 834.8 | N/A | |||||
| 2013 |
$ | 804.2 | $ | 1,639.0 | ||||
| 2014 |
* | * | ||||||
| 2015 (the “Final Fiscal Year”) |
* | * | ||||||
| * | EBIT Target not yet established |
When we calculate our EBIT (which calculation is subject to review and approval by the compensation committee) for purposes of determining whether we have achieved our annual EBIT target, we take our net income and increase it by: (1) net interest expense and (2) the provision for income taxes. We are then required to exclude a number of categorical amounts as follows:
| • | any extraordinary gains or losses, cumulative effect of a change in accounting principle, income or loss from disposed or discontinued operations and any gains or losses on disposed or discontinued operations, all as determined in accordance with generally accepted accounting principles; |
| • | any gain or loss greater than $2 million attributable to asset dispositions, contract terminations and similar items, provided that losses on contract terminations and asset dispositions in connection with client contract terminations are limited in any given fiscal year to $5 million; |
| • | any increase in amortization or depreciation resulting from the application of purchase accounting to the 2007 Transaction, including the current amortization of existing acquired intangibles; |
| • | any gain or loss from the early extinguishment of indebtedness, including any hedging obligation or other derivative instrument; |
| • | any impairment charge or similar asset write-off required by generally accepted accounting principles; |
| • | any non-cash compensation expense resulting from the application of the authoritative accounting pronouncement for share-based compensation expense or similar accounting requirements; |
| • | any expenses or charges related to any equity offering, acquisition, disposition, recapitalization, refinancing or similar transaction, including the 2007 Transaction; |
112
Table of Contents
| • | any transaction, management, monitoring, consulting, advisory and related fees and expenses paid or payable to the sponsors; |
| • | the effects of changes in foreign currency translation rates from the rates used in the calculation of the EBIT targets. The 2011 and later EBIT targets are based on the foreign currency translation rates used in the Business Plan approved by our board for the applicable year; and |
| • | the impact of the 53rd week of operations on our financial results during any 53-week fiscal year referenced in the relevant Schedule 1 to the Non-Qualified Stock Option Agreement. |
Our calculation of EBIT is adjusted for acquisitions as follows:
| • | for small acquisitions, which have purchase prices of less than $20 million each, there is no adjustment until the total consideration for all small acquisitions exceeds $20 million in any fiscal year, and then the EBIT targets will be adjusted for the percentage of EBIT that results from the cumulative amounts of such acquisitions over $20 million; and |
| • | for larger acquisitions, which have purchase prices of more than $20 million, our EBIT targets are adjusted based on the amount of EBIT that we project for that acquisition when it is approved by our board. |
Our calculation of EBIT also is adjusted when we sell a business by an amount equal to the last twelve months of earnings of the divested business.
The terms of the performance targets and calculation of EBIT, including the adjustments, were initially negotiated with the sponsors in connection with the 2007 Transaction and were approved by our board in connection with the closing of the 2007 Transaction and subsequently modified twice in 2007. The EBIT targets were also modified in November 2008 and in December 2009 to reflect acquisitions and divestitures, pursuant to the terms of the Non-Qualified Stock Option Agreements. The EBIT targets are intended to measure achievement of the plan presented by us to the sponsors at the time of the negotiation of the 2007 Transaction, as modified in response to changed circumstances, and the adjustments to EBIT described above primarily represent elements of our performance that are either beyond the control of management or were not predictable at the time the targets were set. On June 21, 2011, our board approved a revised EBIT target for fiscal year 2011 and adopted a new form of Non-Qualified Stock Option Agreement that provides that the compensation committee will, on an annual basis, set both annual and cumulative EBIT targets for future fiscal years within 90 days of the beginning of each fiscal year based upon the Company’s business plan as approved by our board. Our board also approved an amendment to outstanding Stock Option Agreements, which provides that if an annual EBIT target is established for fiscal 2012 or later years for options granted after June 21, 2011 that is less than the annual EBIT target for such fiscal year for the outstanding stock options, the EBIT target for such outstanding options will be reduced to such lower EBIT target. In addition, if a cumulative EBIT target as established for options granted after June 21, 2011 is achieved in a fiscal year ending after fiscal 2011, then for any years (beginning with fiscal 2011) that an annual EBIT target as established under the outstanding Stock Option Agreement was not achieved and which was not the final performance year of such option (a “missed year”), then the portion of the performance option under the outstanding Stock Option Agreement that did not vest in respect of such missed year will nevertheless become vested.
Because we achieved our EBIT target for fiscal 2011, all performance-based options whose vesting is based upon the attainment of the 2011 EBIT target vested in accordance with the vesting schedules for those options. We did not achieve our EBIT target for 2012; therefore, performance-based stock options whose vesting is based upon the attainment of the 2012 EBIT target did not or will not vest unless an alternate vesting condition for those options is later satisfied.
The above performance targets do not represent a prediction of how we will perform during the fiscal years 2013 through 2015. We are not providing any guidance, nor updating any prior guidance, of our future performance with the disclosure of these performance targets, and you are cautioned not to rely on these performance targets as a prediction of ARAMARK’s future performance.
113
Table of Contents
Some or all of the performance-based options also will vest if certain other events occur, including the achievement of a return or internal rate of return by our sponsors. For example, if our sponsors were to sell a portion of their investment in us and, in connection with that sale, achieve an internal rate of return (i) on or after the third anniversary of the grant date of the options for options granted prior to June 2012 and (ii) at any time for options granted in June 2012 or later equal to 15%, or, for options granted prior to June 2012, prior to the third anniversary of the grant date, that equals or exceeds 200% of that sponsor’s investment, the sale would be a qualified partial liquidity event and a percentage of the unvested performance-based options would vest. The percentage will be based upon the percentage of our sponsors’ interest in us that was sold in the qualified partial liquidity event. In addition, if there is a change of control of us in which our sponsors do not achieve the return or internal rate of return described above, a portion of the unvested performance-based options will vest, with the percentage vesting based upon the percentage of eligible performance-based options that had previously vested (all unvested time-based options will vest on a change of control). Finally, upon death, disability or retirement (attaining at least age 60 with five years of service), unvested performance-based options that would have vested during the twelve-month period immediately following termination had the termination not occurred during that period will vest if the performance targets for that period are satisfied. Time-based options that would have vested in the year following retirement, death or disability would also vest according to the vesting schedule. In addition, if employment terminates due to death, disability or retirement, the exercise period for vested options is one year, rather than the 90-day period that is otherwise available for terminations other than for cause.
Employment Agreements and Change of Control Arrangements
We have employment agreements with all of the named executive officers for indeterminate periods terminable by either party, in most cases subject to post-employment severance and benefit obligations. Mr. Neubauer’s employment agreement, which was for an indeterminate period, was amended in November 2012 to provide that he will be an employee of the Company through December 2013. While we do have these agreements in place, from time to time, it has been necessary to renegotiate some terms upon actual termination.
For more information regarding change of control and severance payments for our named executive officers, see the disclosure under “Potential Post-Employment Benefits.”
Mr. Neubauer
Under Mr. Neubauer’s employment agreement in effect during fiscal 2012, he received a base salary of $1,400,000 for calendar 2012, which is reviewed annually by the compensation committee in connection with its review of Mr. Neubauer’s performance. His agreement provides that the compensation committee can increase, but not decrease, his salary in its discretion. Mr. Neubauer’s bonus is determined by the compensation committee pursuant to the terms of the Bonus Plan, and Mr. Neubauer is eligible to participate in our equity plan and all retirement and welfare programs applicable to our senior executives. Mr. Neubauer’s employment agreement also provides that he will receive a supplemental retirement benefit for the duration of his life following his termination of employment, with a 50% survivor benefit for his surviving spouse for her lifetime, which is described more fully in “Pension Benefits for Fiscal Year 2012” below. Mr. Neubauer’s employment agreement provides for certain payments upon termination that are more fully discussed in the “Potential Post-Employment Benefits” section below.
During his employment term and for a period of two years thereafter, Mr. Neubauer is subject to a non-competition covenant according to which he would be restricted from associating with or acquiring or maintaining an ownership interest in a competing business. We have agreed to use our best efforts to cause Mr. Neubauer to be a member of our board during the term of Mr. Neubauer’s employment agreement. In addition, if any payment or benefit payable to Mr. Neubauer after a change in ownership or control of us would be considered a parachute payment subject to a federal excise tax, then we will pay Mr. Neubauer an additional payment or benefit to gross-up the amount of the excise tax. This gross-up provision in Mr. Neubauer’s agreement ensures that he would receive the full benefit of payments related to a change of control.
114
Table of Contents
As mentioned above, on November 14, 2012, our board approved the third amendment to Mr. Neubauer’s employment agreement. The amendment provides that Mr. Neubauer will remain an employee of the Company until December 31, 2013 at an annual base salary of $700,000, established a floor for his 2012 bonus of $1.95 million, and fixed his 2013 bonus at $1,116,667. In addition, Mr. Neubauer will continue to be entitled to some of the perquisites that he had previously, including secretarial support and use of an office, a Company-provided car and driver and the Company airplane, subject to availability.
Mr. Foss
In connection with his employment with us, we entered into an employment letter agreement and an agreement relating to employment and post-employment competition, dated May 7, 2012, with Mr. Foss, which was later amended in June 2013. Mr. Foss’ letter agreement provides that Mr. Foss will serve as Chief Executive Officer and President of the Company and will be elected to our board so long as we are controlled by investment funds associated with or designated by our sponsors. Thereafter, Mr. Foss, while he remains the Chief Executive Officer and President, will be included as a nominee for election to our board at each annual stockholders meeting.
Mr. Foss is employed with us “at-will” and may be terminated at any time, subject to the severance provisions contained in his employment letter agreement. Mr. Foss’ minimum annual base salary is $1,350,000, and is subject to periodic review by the compensation committee. The compensation committee may, in its discretion, increase Mr. Foss’ annual base salary. Mr. Foss’ annual cash bonus will be determined by the compensation committee under our Senior Executive Annual Performance Bonus Plan. For fiscal 2012, however, Mr. Foss received a guaranteed bonus of $1,012,500 (his 2012 target bonus prorated for six months). His target bonus for fiscal 2013 is equal to 150% of his annual base salary. When we hired Mr. Foss, we committed to providing a total annual compensation package to Mr. Foss for fiscal 2013 based on total annual compensation values at the 75th percentile of the Company’s market peer group of companies. In addition, Mr. Foss received a one-time signing bonus of $500,000 intended to cover commuting and relocation expenses and is eligible to participate in all retirement, welfare and perquisite programs applicable to senior executives of the Company at benefit levels applicable to senior executives. Mr. Foss also receives a $2,000 monthly car allowance. We paid $48,143 on Mr. Foss’ behalf in connection with the negotiation of his employment arrangements with us. Under our agreement with Mr. Foss, he is entitled to serve on two for-profit boards, subject to the prior approval of the board. His current service on the boards of CIGNA Corporation and UDR, Inc. was approved by our board in connection with the approval of his employment arrangements.
Mr. Foss invested $3,750,000 through the purchase of our common stock at a per share purchase price equal to $14.96, which was equal to the fair market value (the appraisal price on the date of purchase) of one share of our common stock. In addition, Mr. Foss received an ISPO to purchase 500,000 shares of our common stock, of which Mr. Foss exercised the first installment for 100,000 shares of our common stock, which he had committed to do under the terms of his employment letter agreement. The remaining portion of Mr. Foss’s ISPOs were exchanged in connection with the exchange offer described above. Mr. Foss was also granted a nonqualified stock option to purchase 1,450,000 shares of our common stock, one-half of which has time-based vesting conditions and the other half of which has service and performance-based vesting conditions, except that the performance-based tranche that would vest based on our performance for fiscal year 2012 was to become fully vested so long as Mr. Foss remained employed with us through the applicable vesting date (regardless of whether the 2012 EBIT target was achieved). Accordingly, even though we did not achieve our 2012 EBIT target, in May 2012, the compensation committee vested the tranche of Mr. Foss’s performance options whose vesting was subject to the 2012 EBIT target. In addition, Mr. Foss is required to hold shares of our common stock having a fair market value equal to six times his base salary.
If we terminate Mr. Foss’ employment without cause or Mr. Foss resigns for good reason prior to a change of control (as defined in his agreement relating to employment and post-employment competition), Mr. Foss will receive severance payments equal to two times his base salary plus two times his most recent annual bonus, paid over a twenty-four month period. In addition, he would receive a pro rata portion of his bonus for the year of his
115
Table of Contents
termination, based upon our actual performance (his 2012 bonus was deemed to be his full target bonus of $2,025,000 for this purpose). Mr. Foss would also continue to receive his car allowance and to participate in our medical and life insurance programs. Finally, Mr. Foss’ time-based stock options that would have vested in the 24-month period following his termination date, but for his termination of employment, would vest immediately.
Mr. Foss’ agreement relating to employment and post-employment competition contains a double trigger. If we experience a change of control (as defined in Mr. Foss’ agreement) and within three years after that change of control Mr. Foss is terminated without cause or resigns for good reason, he would be entitled to similar payments as if he were terminated without cause or resigned for good reason prior to a change of control. Mr. Foss would receive severance payments equal to two times his base salary plus two times his most recent annual bonus or his target bonus, whichever is higher, paid over a twenty-four month period. In addition, he would receive a pro rata portion of his bonus for the year of his termination (his 2012 bonus was deemed to be his full target bonus of $2,025,000 for this purpose). Mr. Foss would also continue to receive his car allowance and to participate in our medical and life insurance programs. Finally, Mr. Foss’ stock options would vest in accordance with the applicable plan document or award agreement.
Upon any termination of employment, Mr. Foss would also receive any accrued amounts (earned but unpaid salary and benefits) owed to him by us. During his employment term and for a period of two years thereafter, Mr. Foss would be subject to non-competition and non-solicitation restrictions.
Mr. Sutherland and Ms. McKee
In connection with the 2007 Transaction, we entered into employment agreements relating to employment and post-employment competition with Mr. Sutherland and Ms. McKee in July 2007.
If Mr. Sutherland or Ms. McKee is terminated without “cause,” the agreements generally provide for severance payments equal to 6 to 18 months of pay, plus the continuation of certain other benefits, including basic group medical and life insurance coverage and use of a Company-leased vehicle or continuation of a car allowance, during the period of such payment. The agreements contain non-competition provisions pursuant to which the management committee member would be restricted from associating with or acquiring or maintaining an ownership interest in a competing business for a period of two years (or one year if employment is terminated by us other than for cause or is terminated by the employee for good reason after a change of control).
Upon a change of control of us as described in the agreements, in addition to the severance payments discussed in the preceding paragraph, these management committee members also would be entitled to lump sum payments if their employment is terminated under certain circumstances. The agreements provide a payout in the event of a change of control based on a “double trigger” (more fully described under “Potential Post-Employment Benefits”). The agreements, including the “double trigger” provision, were negotiated with the sponsors in connection with the 2007 Transaction. These provisions are intended to align executive and stockholder interests by enabling executives to consider corporate transactions that are in the best interests of the stockholders and our other constituents without undue concern over whether the transactions may jeopardize the executives’ own employment.
Mr. Munnelly and Ms. Wallace
We entered into agreements relating to employment and post-employment competition with Mr. Munnelly and Ms. Wallace upon their commencement of employment with us. The agreements provide for post-employment benefits should Mr. Munnelly or Ms. Wallace be terminated by us without cause. Those benefits include between 26 and 52 weeks of severance pay, depending on the length of time the executive has been employed by the Company, and basic group medical coverage and continued use of the Company-leased vehicle or the Company-paid auto allowance during the severance pay period. The agreements contain non-disclosure
116
Table of Contents
and non-disparagement provisions to which the executive must adhere for certain periods of time after termination of employment, as well as a one year non-competition provision and a two year non-solicitation provision.
Indemnification Agreements
We have entered into Indemnification Agreements with our named executive officers, among others, that provide substantially similar rights to which they are currently entitled pursuant to our certificate of incorporation and by-laws and that spell out further the procedures to be followed in connection with indemnification.
117
Table of Contents
Outstanding Equity Awards at 2012 Fiscal Year-End
The following table provides information with respect to holdings of stock options by our named executive officers at 2012 fiscal year-end.
| Option Awards | ||||||||||||||||||||
| Name |
Number of
Securities Underlying Unexercised Options(#) Exercisable(1) |
Number of
Securities Underlying Unexercised Options(#) Unexercisable(2) |
Equity Incentive Plan Awards: Number of Securities Underlying Unexercised Unearned Options(#)(3) |
Option Exercise Price |
Option Expiration Date |
|||||||||||||||
| Neubauer |
— | — | 106,874 | $ | 6.50 | 2/27/2017 | ||||||||||||||
| 37,500 | — | 35,624 | $ | 10.80 | 3/5/2018 | |||||||||||||||
| 100,000 | 100,000 | 150,000 | $ | 10.54 | 3/2/2020 | |||||||||||||||
| 100,000 | 150,000 | 150,000 | $ | 12.69 | 6/22/2021 | |||||||||||||||
| — | 80,000 | — | $ | 12.69 | 1/15/2016 | |||||||||||||||
| Foss |
— | 725,000 | 725,000 | $ | 14.96 | 6/6/2022 | ||||||||||||||
| — | 400,000 | — | $ | 14.96 | 1/15/2017 | |||||||||||||||
| Sutherland |
756,591 | — | 235,659 | $ | 6.50 | 1/26/2017 | ||||||||||||||
| 274,500 | — | 85,500 | $ | 6.50 | 2/27/2017 | |||||||||||||||
| 57,189 | — | 17,811 | $ | 10.80 | 3/5/2018 | |||||||||||||||
| 100,000 | 25,000 | 75,000 | $ | 9.65 | 9/2/2019 | |||||||||||||||
| 75,000 | 50,000 | 75,000 | $ | 10.54 | 3/2/2020 | |||||||||||||||
| 62,500 | 93,750 | 93,750 | $ | 12.69 | 6/22/2021 | |||||||||||||||
| — | 48,000 | — | $ | 12.69 | 1/15/2016 | |||||||||||||||
| McKee |
466,555 | — | 145,321 | $ | 6.50 | 1/26/2017 | ||||||||||||||
| 228,750 | — | 71,250 | $ | 6.50 | 2/27/2017 | |||||||||||||||
| 38,126 | — | 11,874 | $ | 10.80 | 3/5/2018 | |||||||||||||||
| 56,250 | 37,500 | 56,250 | $ | 10.54 | 3/2/2020 | |||||||||||||||
| 62,500 | 93,750 | 93,750 | $ | 12.69 | 6/22/2021 | |||||||||||||||
| — | 48,000 | — | $ | 12.69 | 1/15/2016 | |||||||||||||||
| Munnelly |
45,750 | — | 14,250 | $ | 9.95 | 12/4/2017 | ||||||||||||||
| 56,694 | — | 17,656 | $ | 9.95 | 12/20/2017 | |||||||||||||||
| 13,726 | — | 4,274 | $ | 10.80 | 3/5/2018 | |||||||||||||||
| 31,875 | 21,250 | 31,875 | $ | 10.54 | 3/2/2020 | |||||||||||||||
| — | 25,000 | 25,000 | $ | 13.82 | 12/7/2021 | |||||||||||||||
| Wallace |
18,796 | — | 5,854 | $ | 6.50 | 1/26/2017 | ||||||||||||||
| 11,439 | — | 3,561 | $ | 6.50 | 2/27/2017 | |||||||||||||||
| 3,050 | — | 950 | $ | 10.80 | 3/5/2018 | |||||||||||||||
| 7,500 | 5,000 | 7,500 | $ | 10.54 | 3/2/2020 | |||||||||||||||
| — | 4,000 | 4,000 | $ | 13.82 | 12/7/2021 | |||||||||||||||
| (1) | The amounts in this column are time-based and performance-based options and ISPOs that have vested. |
| (2) | These are options subject to time-based vesting and generally vest 25% per year over four years from the date of grant, provided that the named executive officer is still employed by us. ISPOs are also included in this column. |
118
Table of Contents
| Equity Instrument |
Expiration Date |
Grant Date |
Vesting Schedule | |||
| Option |
January 26, 2017 | January 26, 2007 | 25% on each of the first four anniversaries of the date of grant. | |||
| Option |
February 27, 2017 | February 27, 2007 | 25% on each of the first four anniversaries of January 26, 2007. | |||
| Option |
March 5, 2018 | March 5, 2008 | 25% on each of the first four anniversaries of the date of grant. | |||
| Option |
September 2, 2019 | September 2, 2009 | 25% on each of the first four anniversaries of the date of grant. | |||
| Option |
March 2, 2020 | March 2, 2010 | 25% on each of the first four anniversaries of the date of grant. | |||
| Option |
June 22, 2021 | June 22, 2011 | 25% on each of the first four anniversaries of the date of grant. | |||
| Option |
December 7, 2021 | December 7, 2011 | 25% on each of the first four anniversaries of the date of grant. | |||
| Option |
June 6, 2022 | June 6, 2012 | 25% on each of the first four anniversaries of the date of grant. |
ISPOs with an expiration date of January 15, 2016 were granted on June 22, 2011 and are divided into 5 installments. ISPOs with an expiration date of January 15, 2017 were granted on June 6, 2012 and are divided into 5 installments. The first ISPO installment vests immediately upon grant and is exercisable for one year. The remaining installments vest on the first four anniversaries of the December 15th following the grant date and are exercisable for a period of 31 days. At least 25% of the first installment must be exercised or the remaining installments are canceled. For all named executive officers other than Mr. Neubauer, the portion of ISPOs which remained outstanding in July 2013 were exchanged for shares of restricted stock and stock options in connection with the exchange offer described above. The restricted stock and stock options received in the exchange have the same vesting schedules as the ISPO surrendered in the exchange.
| (3) | These are the maximum number of options that are subject to performance-based vesting. 25% of the original award will vest each year over four years from the grant date, which in each case was 10 years prior to the listed expiration date, provided that certain performance targets are satisfied and the named executive officer is still employed by us, with certain exceptions (disability, retirement or death). See the narrative following the “Grants of Plan-Based Awards for Fiscal Year 2012” table. |
Options Exercises and Stock Vested Table for Fiscal Year 2012
The following table sets forth information with respect to the named executive officers concerning the exercise of options in fiscal 2012.
| Name |
Option Awards | |||||||
| Number of Shares Acquired on Exercise (#) |
Value Realized on Exercise ($)1 |
|||||||
| Neubauer |
490,002 | $ | 2,930,448 | |||||
| Foss |
100,000 | — | ||||||
| Sutherland |
— | — | ||||||
| McKee |
12,000 | $ | 13,560 | |||||
| Munnelly |
— | — | ||||||
| Wallace |
— | — | ||||||
| (1) | For Mr. Foss, who exercised ISPOs, no value was realized because the fair market value at the time of exercise was equal to the exercise price of the ISPO. |
119
Table of Contents
Pension Benefits for Fiscal Year 2012
Mr. Neubauer is the only named executive officer who has a supplemental executive retirement benefit. His right to the benefit vested in 1988. The supplemental executive retirement benefit entitles him to receive benefits beginning on his termination of employment for any reason or on his retirement. The annual benefit, which is payable in monthly installments, equals 50% of Mr. Neubauer’s base salary plus 50% of his average bonus, calculated based on his bonus from 2001-2003, or the three full years immediately preceding his retirement, whichever is greater. Under the third amendment to Mr. Neubauer’s employment agreement, which was approved by our board on November 14, 2012, for purposes of Mr. Neubauer’s supplemental executive retirement benefit, his salary is fixed at $1,400,000 and his average bonus will be based upon the three-year average bonus for fiscal 2010, 2011 and 2012 ($2,233,333). Mr. Neubauer will receive the retirement benefit for the remainder of his life and, upon his death, his surviving spouse would receive one-half of the benefit for the remainder of her life. This benefit will be paid to Mr. Neubauer, or his surviving spouse, according to our normal payroll cycle. Any amounts payable under the Survivor Income Protection Plan will reduce Mr. Neubauer’s retirement benefit. If Mr. Neubauer experiences a permanent disability, this benefit would commence immediately. The table below lists the present value of his benefit, which is set forth in his employment agreement with us, rather than in an actual plan document.
| Name |
Plan Name(1) | Number of Years
of Credited Service (#)(2) |
Present Value
of Accumulated Benefit ($)(3)(4) |
Payments During
Last Fiscal Year ($) |
||||||||||||
| Neubauer |
N/A | N/A | $ | 22,877,394 | — | |||||||||||
| (1) | Mr. Neubauer is entitled to this benefit under his employment agreement with the Company. |
| (2) | Mr. Neubauer’s right to the benefit vested in 1988 and credited service is not taken into account in determining the amount of the benefit. |
| (3) | The assumptions used in determining the present value of the future payments for the supplemental retirement benefit as of September 28, 2012 are as follows: (a) a discount rate of 3.25%; (b) mortality assumption based on the UP-94 mortality table; (c) payment as a monthly annuity as described above; and (d) Mr. Neubauer’s applicable base salary and average bonus figures. In the past, we calculated the actuarial present value assuming a retirement age equal to 2.0 years past Mr. Neubauer’s current age, based on the notice provision in his employment agreement. Because we hired Mr. Foss as our new chief executive officer in fiscal 2012, we calculated the actuarial present value for fiscal 2012 assuming a retirement age equal to 1.5 years past Mr. Neubauer’s current age, which was our best estimate of Mr. Neubauer’s time to retirement as of fiscal year end. The assumptions are adjusted annually, based on prevailing market conditions and actual experience. |
| (4) | The third amendment to Mr. Neubauer’s employment agreement, which the Company entered into on November 14, 2012, provides that Mr. Neubauer will remain an employee of the Company through December 31, 2013, which is 1.25 years past Mr. Neubauer’s age at our fiscal 2012 year end. The difference in the actuarial present value using 1.25 years to retirement versus 1.5 years is not material. |
120
Table of Contents
Non-Qualified Deferred Compensation for Fiscal Year 2012
Our named executive officers are eligible to participate in two deferred compensation plans: the 2007 Savings Incentive Retirement Plan and the 2005 Deferred Compensation Plan, each of which is discussed in “Other Components of Compensation” in the Compensation Discussion and Analysis above. Our named executive officers, other than Messrs. Foss and Munnelly, participated in predecessor plans to the 2007 Savings Incentive Retirement Plan and/or the 2005 Deferred Compensation Plan and retain balances in these older plans, all of which are reflected in the table.
| Name |
Executive Contributions in Last FY ($)(1) |
Registrant Contributions in Last FY ($)(2) |
Aggregate Earning in Last FY ($)(3) |
Aggregate Withdrawals/ Distributions ($) |
Aggregate Balance at Last FYE ($)(3)(4) |
|||||||||||||||
| Neubauer |
||||||||||||||||||||
| 2007 SIRP |
30,000 | 10,200 | 297,118 | — | 5,644,927 | |||||||||||||||
| 2005 Deferred Comp Plan |
— | — | 134,127 | — | 2,541,104 | |||||||||||||||
| Other Deferred Compensation(5) |
— | — | — | — | 959,369 | |||||||||||||||
| Foss |
||||||||||||||||||||
| 2007 SIRP |
— | — | — | — | — | |||||||||||||||
| 2005 Deferred Comp Plan |
— | — | — | — | — | |||||||||||||||
| Sutherland |
||||||||||||||||||||
| 2007 SIRP |
47,192 | 10,200 | 135,662 | — | 2,606,883 | |||||||||||||||
| 2005 Deferred Comp Plan |
— | — | — | — | — | |||||||||||||||
| McKee |
||||||||||||||||||||
| 2007 SIRP |
36,934 | 10,200 | 74,847 | — | 1,449,247 | |||||||||||||||
| 2005 Deferred Comp Plan |
— | — | — | — | — | |||||||||||||||
| Munnelly |
||||||||||||||||||||
| 2007 SIRP |
21,547 | 10,200 | 5,491 | — | 127,014 | |||||||||||||||
| 2005 Deferred Comp Plan |
— | — | — | — | — | |||||||||||||||
| Wallace |
||||||||||||||||||||
| 2007 SIRP |
13,338 | 8,003 | 7,300 | — | 154,606 | |||||||||||||||
| 2005 Deferred Comp Plan |
— | — | — | — | — | |||||||||||||||
| (1) | All amounts in this column were deferred under the 2007 Savings Incentive Retirement Plan during fiscal 2012. All amounts deferred are included in the named executive officer’s salary amount in the Summary Compensation Table. |
| (2) | With respect to our named executive officers, these amounts constitute the Company match for fiscal 2012, which was made in November 2012 to our nonqualified deferred compensation plan, the 2007 Savings Incentive Retirement Plan. These amounts were reported in the Summary Compensation Table. |
| (3) | Mr. Neubauer has balances in both the 2007 Savings Incentive Retirement Plan and the 2005 Deferred Compensation Plan, or its predecessors. Our Summary Compensation Table for previous years included the amount of salary deferred and Company match for those years. The amounts in the Executive Contributions column are included in the Salary column in the Summary Compensation Table for fiscal 2012 and amounts in the Registrant Contributions column are reflected in the All Other Compensation column and are separately footnoted. To the extent that earnings for the 2007 Savings Incentive Retirement Plan and the 2005 Deferred Compensation Plan exceeded 120% of the applicable federal rate, those excess earnings were reported in the Change in Pension Value and Non-Qualified Deferred Compensation Earnings column of the Summary Compensation Table as follows: for Mr. Neubauer, $52,943, for Mr. Sutherland, $16,655, for Ms. McKee, $9,189, for Mr. Munnelly, $674, and for Ms. Wallace, $896. |
| (4) | The Aggregate Balance at Fiscal Year End includes amounts that were reported in the Summary Compensation Table for the last three fiscal years as follows: for Mr. Neubauer, $471,606, for Mr. Sutherland, $213,838, for Ms. McKee, $162,776, for Mr. Munnelly, $64,261 (for 2011 and 2012), and for Ms. Wallace, $22,237 (for 2012 only). |
| (5) | Represents amounts deferred beginning in 1995 under various deferred compensation plans that are aggregated on the books of the Company and for which Mr. Neubauer is not credited with interest. |
121
Table of Contents
The 2007 Savings Incentive Retirement Plan enables our named executive officers to defer up to 25% of their base salaries, which become our unfunded deferral obligations. We credit amounts deferred with interest at the Moody’s Long Term Corporate Baa Bond Index rate for October of the previous year; which was 5.37% beginning January 1, 2012. From September 29, 2011 until December 31, 2011, we credited amounts deferred with an interest rate equal to 5.72%. Employees who participate in the 2007 Savings Incentive Retirement Plan are eligible to receive a Company matching contribution equal to 25-75% of the first 6% of their salary deferred up to the Internal Revenue Code maximum deferral limit ($17,000 for fiscal 2012). This match is intended to replicate what the employee would have received if he or she had been able to participate in our 401(k) plans. For fiscal 2012, the Company matching contribution was 60%. Participants in the Savings Incentive Retirement Plan may only make account withdrawals if there occurs an unforeseeable emergency as defined in the plan and the withdrawal is approved by the plan administrative committee. Company match amounts are not available for a hardship withdrawal. The 2007 Savings Incentive Retirement Plan is settled in cash following termination of employment and in compliance with certain requirements of Section 409A of the Internal Revenue Code.
Named executive officers may defer receipt of part or all of their cash compensation under our 2005 Deferred Compensation Plan. The 2005 Deferred Compensation Plan allows executives to save for retirement in a tax-deferred way at minimal cost to us. Under this unfunded Plan, amounts deferred by the executive are credited at an interest rate based on Moody’s Long Term Corporate Baa Bond Index rate for October of the previous year, which was 5.37% beginning January 1, 2012. From September 29, 2011 until December 31, 2011, we credited amounts deferred with an interest rate equal to 5.72%. The 2005 Deferred Compensation Plan permits participants to select a payment schedule at the time they make their deferral election, subject to a three-year minimum deferral period as long as the participant remains employed by us. All or a portion of the amount then credited to a deferral account may be withdrawn, if the withdrawal is necessary in light of a severe financial hardship.
Effective January 1, 2013, the rate for both the 2007 Savings Incentive Retirement Plan and the 2005 Deferred Compensation Plan was adjusted to 4.58%, the Moody’s Long Term Corporate Baa Bond Index rate for October 2012.
Potential Post-Employment Benefits
Our named executive officers may be eligible to receive benefits in the event their employment is terminated (1) upon their retirement, disability or death, (2) by ARAMARK without cause, or (3) in certain circumstances following a change of control. The amount of benefits will vary based on the reason for the termination.
The following sections present a discussion and calculations, as of September 28, 2012, of the estimated benefits the named executive officers would receive in these situations and in the case of Mr. Neubauer, do not reflect the benefits pursuant to his November 14, 2012 employment agreement amendment. Although the calculations are intended to provide reasonable estimates of the potential benefits, they are based on numerous assumptions discussed in the footnotes to the table and may not represent the actual amount an executive would receive if an eligible termination event were to occur.
In addition to the amounts disclosed in the following sections, each of our named executive officers would retain the amounts which he or she has earned or accrued over the course of his or her employment prior to the termination event, such as the executive’s balances under our deferred compensation plans and, on death, disability and termination other than for cause, the proceeds of previously vested stock options and on death, disability or retirement (if eligible), the proceeds of one additional tranche of unvested time-based options that will vest and the proceeds of any unvested performance-based options that would have otherwise vested in the year following termination. Mr. Neubauer is entitled to his supplemental executive retirement benefit upon his termination of employment. For further information about previously earned and accrued amounts, see “Summary Compensation Table,” “2012 Outstanding Equity Awards at Fiscal Year-End,” “Pension Benefits for Fiscal Year 2012” and “Nonqualified Deferred Compensation for Fiscal Year 2012.”
122
Table of Contents
As discussed above, on November 14, 2012, our board approved the third amendment to Mr. Neubauer’s employment agreement, which provides that Mr. Neubauer will remain Chairman and an employee of the Company until December 31, 2013. The third amendment provides that following the termination of Mr. Neubauer’s employment for any reason, his stock options and ISPOs will continue to vest as if his employment had not been terminated based on the passage of time and as applicable, based on the achievement of performance targets, and will remain exercisable for their stated term.
Retirement, Death and Disability
Mr. Neubauer
Mr. Neubauer has an employment agreement with us under which he is entitled to receive benefits from a supplemental executive retirement benefit upon his termination of employment or retirement. See “Pension Benefits for Fiscal Year 2012” for more information on Mr. Neubauer’s supplemental retirement benefit.
Mr. Neubauer’s employment agreement provides that, upon his death, his estate will receive his accrued but unpaid salary and vacation and a portion of his average bonus prorated for the portion of the then current fiscal year, calculated based on his bonus from 2001-2003, or the three full years immediately preceding his termination, whichever is greater. In the event of his death, one additional tranche of Mr. Neubauer’s time-based stock options will vest and after one year we will determine whether an additional tranche of 25% of performance-based options will vest. His vested options will be exercisable for one year following his death. His surviving spouse will receive her portion of the supplemental retirement benefit described above.
If Mr. Neubauer is unable to engage in any substantial gainful activity by reason of any medically determinable physical or mental impairment which can be expected to result in death or can be expected to last for a continuous period of not less than 12 months, or if Mr. Neubauer is, by reason of any such condition, receiving income replacement benefits for a period of not less than three months under an accident and health plan, he will be considered permanently disabled and will receive all accrued but unpaid salary and vacation, continuation of salary for three years (offset by any amounts received under the Survivor Income Protection Plan and any disability plans), a portion of his bonus prorated for the portion of the then current fiscal year, calculated based on his average bonus from 2001-2003, or the three full years immediately preceding his termination, whichever is greater. In addition, all stock options held by Mr. Neubauer will become vested and immediately exercisable, but will remain subject to the terms of our 2007 Management Stock Incentive Plan. Accelerated vesting will occur for both Mr. Neubauer’s time-based and performance-based stock options (at target). In addition, Mr. Neubauer may participate in the Executive Health Plan at his own expense for a period of three years following his permanent disability. Mr. Neubauer’s benefits on permanent disability would be in addition to amounts he would receive under the supplemental retirement benefit described above.
Messrs. Foss, Sutherland and Munnelly and Ms. McKee and Ms. Wallace
The other named executive officers do not receive any special benefits upon retirement, disability or death, other than those under the Survivor Income Protection Plan and/or life insurance, as applicable, in the case of death as more fully described in the “Other Components of Compensation” section of the Compensation Discussion and Analysis, or with regard to their stock options that are more fully described above.
Termination for Cause or Resignation without Good Reason
Mr. Neubauer
If Mr. Neubauer’s employment is terminated by us for cause or if Mr. Neubauer resigns without good reason, his employment agreement entitles him to receive accrued but unpaid base salary and vacation, a portion of his bonus prorated for the portion of the then current fiscal year, calculated based on his average bonus from 2001-2003, or the three full years immediately preceding his termination, whichever is greater, and his
123
Table of Contents
supplemental retirement benefit described above. Mr. Neubauer may also continue participation in the Executive Health Plan at his own expense for three years following his termination for cause or resignation without good reason. In addition, all of Mr. Neubauer’s outstanding stock options would remain outstanding and subject to the terms of our 2007 Management Stock Incentive Plan. If Mr. Neubauer resigns without good reason two years following his notice to us of his intent to do so, all of his stock options will vest and become immediately exercisable upon the effective date of his resignation. If Mr. Neubauer does not provide two years’ notice of his intent to resign, his stock options will not be subject to accelerated vesting. Termination for cause means termination by our board for Mr. Neubauer’s willful failure to perform his duties or his willful misconduct that materially injures our reputation or financial condition, in each case if he fails to cure within 30 days of receiving notice of the events or circumstances that the board deems to be willful failure or willful misconduct. Good reason includes our material breach of his employment agreement and our failure to cure that breach or Mr. Neubauer’s resignation within 12 months after a change of control, which is defined below.
Mr. Foss
Mr. Foss is not entitled to any benefits under his employment agreement upon termination for cause or resignation without good reason. Termination for cause as defined in his employment agreement means termination of employment due to conviction or plea of guilty or nolo contendere to a felony or a misdemeanor involving moral turpitude that has a substantial adverse effect on Mr. Foss’ ability to perform his duties, willful and continuous failure to perform his or her duties after written notice, willful and continuous failure to perform lawfully assigned duties that are consistent with his position with the Company, willful violation of our Business Conduct Policy that causes us material harm or intentionally working against our best interests, in each case after notice and failure to cure the conduct within 15 business days.
Mr. Sutherland and Ms. McKee
Mr. Sutherland and Ms. McKee are not entitled to any benefits under their employment agreements upon termination for cause or resignation without good reason. With respect to Mr. Sutherland and Ms. McKee, termination for cause means termination of employment due to conviction or plea of nolo contendere to a felony, intentional fraud or dishonesty with regard to us that causes us demonstrable harm, willful and continuous failure to perform his or her lawfully assigned duties that are consistent with their positions, willful violation of our Business Conduct Policy that causes material harm to us or our business reputation or intentionally working against our best interests, in each case after notice and failure to cure the conduct within 10 business days. Mr. Sutherland and Ms. McKee are subject to a two-year non-competition covenant if their employment is terminated for cause or they resign without good reason.
Mr. Munnelly and Ms. Wallace
Mr. Munnelly and Ms. Wallace are not entitled to any benefits under their employment agreements upon termination for cause or resignation without good reason. With respect to Mr. Munnelly and Ms. Wallace, termination for cause means termination of employment due to conviction or plea of nolo contendere to a felony, fraud or dishonesty, willful failure to perform his or her assigned duties, willful violation of our Business Conduct Policy or intentionally working against our best interests. Mr. Munnelly and Ms. Wallace are subject to a one-year non-competition covenant if their employment is terminated for cause or they resign without good reason.
124
Table of Contents
Termination without Cause / Resignation for Good Reason prior to a Change of Control
Mr. Neubauer
If Mr. Neubauer’s employment is terminated by us without cause or if he resigns for good reason after we materially breach his employment agreement and fail to cure, he is entitled to the following payments and benefits:
| • | a pro rata bonus for the year of termination based on his average bonus over the three immediately preceding years (or, if higher, 2001-2003); |
| • | a lump sum payment of two times his base salary; |
| • | a lump sum payment of two times his average bonus for the three years prior to his termination (or, if higher, his average bonus from 2001-2003); |
| • | the supplemental retirement benefit described above; |
| • | participation in our Survivor Income Protection Plan, if applicable, certain health and welfare plans and other perquisites (such as his Company car) for up to three years; |
| • | stock options and ISPOs will continue to vest as if his employment had not been terminated based on the passage of time and as applicable, based on the achievement of performance targets; |
| • | participation in our Executive Health Plan at his own expense for three years; and |
| • | other accrued but unpaid salary and benefits. |
If Mr. Neubauer’s termination occurs at least two years after our notice to Mr. Neubauer of our intent to terminate his employment, it will be considered an “Involuntary Termination with Notice” under his employment agreement and he will not receive the lump sum payment of two times his base salary and bonus or other perquisites, but will receive the other benefits outlined above.
Mr. Foss
If Mr. Foss is terminated without cause or resigns for good reason prior to a change of control (as defined in his agreement), he will be entitled to the following payments and benefits:
| • | a pro rata bonus for the year of termination based upon actual performance; |
| • | continued payment of his base salary for 24 months; |
| • | two times the prior year’s bonus (if any) paid over 24 months (for 2012, this is deemed to be his full target bonus); |
| • | continued participation in the Company’s basic medical and life insurance programs on the same terms as prior to termination for a period of 24 months, both for Mr. Foss and for his dependents; |
| • | continued payment of his car allowance for 24 months; and |
| • | immediate vesting of time-based stock options that would have vested during the 24 month period following his termination. |
Mr. Foss is subject to non-competition and non-solicitation provisions for the two year period following his termination of employment.
Mr. Sutherland and Ms. McKee
If we terminate Mr. Sutherland or Ms. McKee without cause, he or she will receive:
| • | severance payments equal to his or her monthly base salary for 18 months, made in the course of our normal payroll cycle; |
125
Table of Contents
| • | participation in our basic medical and life insurance programs during the period over which he or she receives severance payments, with the employee’s share of premiums deducted from the severance payments; |
| • | continuation of his or her car allowance payments, as applicable, during the severance period; and |
| • | all of his or her vested stock options. |
Mr. Sutherland and Ms. McKee are subject to a two-year non-competition covenant if their employment is terminated without cause and it is reduced to one year if, following a change of control, they are terminated without cause or they resign for good reason.
Mr. Munnelly and Ms. Wallace
If we terminate Mr. Munnelly or Ms. Wallace without cause, he or she will receive:
| • | severance payments equal to his or her monthly base salary for 52 weeks made in the course of our normal payroll cycle; |
| • | participation in our basic medical and life insurance programs during the period over which he or she receives severance payments, with the employee’s share of premiums deducted from the severance payments; |
| • | use of his or her Company car or continuation of his or her car allowance payments, as applicable, during the severance period; and |
| • | all of his or her vested stock options. |
Mr. Munnelly and Ms. Wallace are subject to non-disclosure and non-disparagement obligations, a one-year non-competition covenant and a two-year non-solicitation covenant after termination of employment under their agreements.
Termination without Cause or Resignation for Good Reason after a Change of Control
Mr. Neubauer
Mr. Neubauer may resign within 12 months after a change of control, and his resignation will be considered to be resignation with good reason. He would then be entitled to the benefits set forth in the previous section “Termination without Cause / Resignation for Good Reason prior to a Change of Control.” A change of control under Mr. Neubauer’s employment agreement includes a person’s acquisition of 35% or more of our outstanding voting stock, the change in a majority of our board membership over a two-year period, a sale or disposition of substantially all of our income-producing assets or property, our merger or consolidation with another Company with our stockholders owning less than 50% of the voting stock of the surviving corporation after the merger or a change of control. A change of control will not be deemed to have occurred under Mr. Neubauer’s employment agreement if Mr. Neubauer is a member of the group whose transaction with us or our stockholders would result in the change of control. If Mr. Neubauer resigns for good reason, he is entitled to the amounts set forth above under the heading “Termination without Cause.” This would constitute a “single trigger” since Mr. Neubauer can resign for any reason within 12 months after a change of control and be paid out under his agreement. This “single trigger” provision has been included in Mr. Neubauer’s employment agreement for at least the past 12 years and was not triggered by the 2007 Transaction.
126
Table of Contents
Mr. Foss
Our employment agreement with Mr. Foss contains a “double trigger”—to be initiated, there must be a change of control followed by an involuntary loss of employment or decrease in responsibilities within three years thereafter, or employment must be terminated in anticipation of a change of control. If we terminate Mr. Foss’ employment without cause during the three-year period following a change of control or he resigns for good reason following a change of control, Mr. Foss would receive:
| • | a pro-rata portion of his annual target bonus in effect on the date of the change of control or on the date of termination, whichever is higher, in a lump sum; |
| • | two times his base salary in effect on the date of the change of control or on the date of termination, whichever is higher, payable over 24 months; |
| • | two times the higher of his annual target bonus in effect on the date of the change of control or his most recent annual bonus, whichever is higher, payable over 24 months; |
| • | outplacement counseling in an amount not to exceed 20% of his base salary, for a period of 24 months; |
| • | treatment of equity awards in accordance with the terms of the applicable plans and agreements; |
| • | continued participation (for Mr. Foss and his dependents) in our medical and life insurance programs on the same terms as in effect immediately prior to his termination, for a period of 24 months; and |
| • | continued payment of his car allowance, if provided at the time of termination, for a period of 24 months. |
Change of control is defined in Mr. Foss’ agreement relating to employment and post-employment competition to include the following:
| • | an entity or group other than us, our sponsors or one of our employee benefit plans acquire more than 50% of our voting stock; |
| • | the Company experiences a reorganization, merger or sale or disposition of substantially all of our assets or we purchase the assets or stock of another entity unless the stockholders prior to the transaction own at least 50% of the voting stock after the transaction and no person owns a majority of the voting stock (unless that ownership existed before the transaction); or |
| • | a majority of the members of our board are replaced during any 12-month period and the new directors are not endorsed by a majority of the Company’s board before the replacement or the replacement is not contemplated by our stockholders’ agreement. |
In addition to termination by us following a change of control, Mr. Foss’ employment agreement provides the same benefits to him if he resigns for good reason following a change of control. Good reason is defined in Mr. Foss’ agreement relating to employment and post-employment competition as:
| • | any diminution in title or reporting relationships, or substantial diminution in duties or responsibilities (other than a change in control after which we are no longer publicly held or independent) including the requirement that he report to any person or entity other than our board; |
| • | reduction in base salary or target annual bonus opportunity, other than, prior to a change of control, an across-the-board reduction applicable to all senior executives; |
| • | the relocation of his principal place of employment by more than 35 miles in a direction further away from his current residence; |
| • | a material decrease in employee benefits in the aggregate; and |
| • | failure to pay or provide (in any material respect) the compensation and benefits under his employment letter agreement or his agreement relating to employment and post-employment competition. |
127
Table of Contents
Mr. Foss must provide 90 days’ written notice that he is resigning for good reason and the Company then has 30 days to cure. If the condition is not cured, Mr. Foss has thirty days from the end of the cure period to resign for good reason.
Mr. Foss’ employment agreement also provides that if any payments to Mr. Foss in connection with a change in control of the Company would constitute excess parachute payments that are subject to excise taxes under Section 4999 of the Code, such payments will be subject to a reduction to avoid any such excise taxes that may be due, if such reduction results in Mr. Foss retaining a greater after-tax amount than if Mr. Foss paid the excise taxes otherwise due. Mr. Foss is not eligible to receive a gross-up payment in respect of any such excise taxes he may pay. During his employment term and for a period of two years thereafter, Mr. Foss would be subject to non-competition and non-solicitation restrictions with the Company.
Mr. Sutherland and Ms. McKee
Our employment agreements with Mr. Sutherland and Ms. McKee contain a “double trigger”—to be initiated, there must be a change of control followed by an involuntary loss of employment or decrease in responsibilities within three years thereafter, or employment must be terminated in anticipation of a change of control. We chose to implement a “double trigger” because we were advised by Frederic W. Cook & Co., Inc. that a “double trigger” is more common in the market than a “single trigger.” In addition, in connection with the 2007 Transaction, change of control amounts were paid to our management committee members other than Mr. Neubauer and Mr. Foss under their previous employment agreements. With respect to Mr. Sutherland and Ms. McKee, a change of control is deemed to occur if:
| • | an entity or group other than our sponsors acquires more than 50% of our voting stock; |
| • | the Company experiences a reorganization, merger or sale or disposition of substantially all of our assets or we purchase the assets or stock of another entity unless the stockholders prior to the transaction own at least 50% of the voting stock after the transaction and no person owns a majority of the voting stock (unless that ownership existed before the transaction); or |
| • | a majority of the members of our board are replaced during any 12-month period and the new directors are not endorsed by a majority of the Company’s board before the replacement or the replacement is not contemplated by our stockholders’ agreement. |
In addition to termination by us following a change of control, the employment agreements with Mr. Sutherland and Ms. McKee provide the same benefits to them if they resign for good reason following a change of control. Good reason is defined in their employment agreements as any of the following actions occurring after a change of control:
| • | a decrease in base salary or target bonus; |
| • | a material decrease in aggregate employee benefits; |
| • | diminution in title or substantial diminution in reporting relationship or responsibilities; or |
| • | relocation of his or her principal place of business by 35 miles or more. |
If Mr. Sutherland’s or Ms. McKee’s employment is terminated by us without cause or if he or she resigns with good reason (as defined in his or her employment agreement) following a change of control other than the 2007 Transaction, he or she is entitled to the following in addition to severance payments and benefits, which are also included in the “change of control” amounts in the table (see “Employment Agreements and Change of Control Arrangements”):
| • | cash severance benefits based on a multiple of two times his or her base salary and target bonus (or the prior year’s actual bonus, if higher) over a two-year period according to our payroll cycle; |
128
Table of Contents
| • | a lump sum payment, within 40 days after his or her termination date, equal to the portion of his or her target bonus attributable to the portion of the fiscal year served prior to termination, plus any earned but unpaid amounts; |
| • | continued medical, life and disability insurance at our expense for a two-year period following termination; |
| • | outplacement counseling in an amount not to exceed 20% of base salary; and |
| • | accelerated vesting of outstanding equity-based awards or retirement plan benefits as is specified under the terms of the applicable plans. See the narrative following the “Grants of Plan-Based Awards for Fiscal Year 2012” table. |
Mr. Sutherland and Ms. McKee are subject to a one-year non-competition covenant if their employment is terminated without cause or they terminate for good reason, each after a change of control.
If the payments made to a management committee member (other than Mr. Foss) were to result in excise tax or interest and penalties, the Company is required to gross up the management committee member for the income or excise tax imposed. This gross-up provision ensures that our management committee members receive the full benefit of payments related to a change of control to which they are entitled. If a change of control were to have occurred at the end of fiscal 2012, no excise tax would have been imposed on our management committee members other than Mr. Foss (who would not receive a gross up) and, therefore, the table below does not include any gross-up for excise taxes.
Mr. Munnelly and Ms. Wallace
Mr. Munnelly and Ms. Wallace are not entitled to any additional benefits under their employment agreements upon termination without cause after a change of control, other than severance benefits as follows:
| • | severance payments equal to his or her monthly base salary for 52 weeks made in the course of our normal payroll cycle; |
| • | participation in our basic medical and life insurance programs during the period over which he or she receives severance payments, with the employee’s share of premiums deducted from the severance payments; |
| • | use of his or her Company car or continuation of his or her car allowance payments, as applicable, during the severance period; |
| • | all of his or her vested stock options; and |
| • | accelerated vesting of unvested time-based options in accordance with our 2007 Management Stock incentive Plan. |
There is no concept of “good reason” in their employment agreements.
Estimated Benefits Upon Termination
The following table shows potential payments to our named executive officers under existing contracts, agreements, plans or arrangements, whether written or unwritten, for various scenarios involving a termination of employment, assuming a September 28, 2012 termination date and using the appraisal price of our common stock as of September 28, 2012 ($15.17). The named executive officers would also be eligible to receive their supplemental retirement benefits (in the case of Mr. Neubauer) and accrued deferred compensation (see “Pension Benefits for Fiscal Year 2012” and “Nonqualified Deferred Compensation for Fiscal Year 2012”), which does not automatically accelerate upon a change of control. Some of the named executive officers have optional life insurance for which they pay 100% of the premium.
129
Table of Contents
This table shows amounts that would be payable under existing employment and post-employment competition and other agreements.
| Name | Retirement | Permanent Disability |
Death(4) | Termination For Cause |
Resignation w/out Good Reason |
Voluntary Resignation with Notice |
Termination w/out Cause |
Involuntary Termination With Notice |
Resignation with Good Reason / Change of Control |
|||||||||||||||||||||||||||
| Neubauer(6) |
||||||||||||||||||||||||||||||||||||
| Cash Payment (Lump Sum) |
$ | 1,400,000 | $ | 2,333,333 | $ | 4,633,333 | $ | 2,233,333 | $ | 2,233,333 | $ | 2,233,333 | $ | 9,500,000 | $ | 2,233,333 | $ | 9,500,000 | ||||||||||||||||||
| Cash Payment (Over Time) |
— | $ | 4,200,000 | — | — | — | — | — | — | — | ||||||||||||||||||||||||||
| Vested Stock Options(1) |
$ | 874,875 | $ | 874,875 | $ | 874,875 | — | $ | 874,875 | $ | 874,875 | $ | 874,875 | $ | 874,875 | $ | 874,875 | |||||||||||||||||||
| Unvested Stock Options(2) |
$ | 355,500 | $ | 3,182,174 | $ | 355,500 | — | — | $ | 3,182,174 | $ | 3,182,174 | $ | 3,182,174 | $ | 3,182,174 | ||||||||||||||||||||
| Perquisites(3) |
— | — | — | — | — | — | $ | 826,805 | — | $ | 826,805 | |||||||||||||||||||||||||
|
|
|
|
|
|
|
|
|
|
|
|
|
|
|
|
|
|
|
|||||||||||||||||||
| Total |
$ | 2,630,375 | $ | 10,590,382 | $ | 5,863,708 | $ | 2,233,333 | $ | 3,108,208 | $ | 6,290,382 | $ | 14,383,854 | $ | 6,290,382 | $ | 14,383,854 | ||||||||||||||||||
|
|
|
|
|
|
|
|
|
|
|
|
|
|
|
|
|
|
|
|||||||||||||||||||
| Name |
Retirement | Death(4) | Disability | Termination w/out cause(5) |
Change of Control |
|||||||||||||||
| Foss(7) |
||||||||||||||||||||
| Cash Payment (Lump Sum) |
$ | 2,000,000 | — | 2,025,000 | $ | 2,025,000 | ||||||||||||||
| Cash Payment (Over Time) |
$ | — | — | $ | 6,750,000 | $ | 6,750,000 | |||||||||||||
| Vested Stock Options(1) |
$ | — | $ | — | $ | — | $ | — | ||||||||||||
| Unvested Stock Options(2) |
$ | 76,125 | $ | 76,125 | $ | 152,250 | $ | 236,250 | ||||||||||||
| Perquisites(3) |
— | — | $ | 92,253 | $ | 375,351 | ||||||||||||||
|
|
|
|
|
|
|
|
|
|||||||||||||
| Total |
$ | 2,076,125 | $ | 76,125 | $ | 9,019,503 | $ | 9,386,601 | ||||||||||||
|
|
|
|
|
|
|
|
|
|||||||||||||
| Sutherland(8) |
||||||||||||||||||||
| Cash Payment (Lump Sum) |
$ | 1,000,000 | — | — | $ | 650,000 | ||||||||||||||
| Cash Payment (Over Time) |
$ | 3,900,000 | — | $ | 1,200,000 | $ | 4,100,000 | |||||||||||||
| Vested Stock Options(1) |
$ | 10,243,725 | $ | 10,243,725 | $ | 10,243,725 | $ | 10,243,725 | $ | 10,243,725 | ||||||||||
| Unvested Stock Options(2) |
$ | 331,250 | $ | 331,250 | $ | 331,250 | — | $ | 1,138,290 | |||||||||||
| Perquisites(3) |
— | — | — | $ | 40,902 | $ | 267,082 | |||||||||||||
|
|
|
|
|
|
|
|
|
|
|
|||||||||||
| Total |
$ | 10,574,975 | $ | 15,474,975 | $ | 10,574,975 | $ | 11,484,627 | $ | 16,399,097 | ||||||||||
|
|
|
|
|
|
|
|
|
|
|
|||||||||||
| McKee(9) |
||||||||||||||||||||
| Cash Payment (Lump Sum) |
$ | 1,500,000 | — | — | $ | 480,000 | ||||||||||||||
| Cash Payment (Over Time) |
$ | 2,937,500 | — | $ | 937,500 | $ | 3,187,500 | |||||||||||||
| Vested Stock Options(1) |
$ | 6,610,342 | $ | 6,610,342 | $ | 6,610,342 | $ | 6,610,342 | ||||||||||||
| Unvested Stock Options(2) |
$ | 164,313 | $ | 164,313 | — | $ | 844,478 | |||||||||||||
| Perquisites(3) |
— | — | $ | 20,970 | $ | 166,418 | ||||||||||||||
|
|
|
|
|
|
|
|
|
|||||||||||||
| Total |
$ | 11,212,155 | $ | 6,774,655 | $ | 7,568,812 | $ | 11,288,738 | ||||||||||||
|
|
|
|
|
|
|
|
|
|||||||||||||
| Munnelly(10) |
||||||||||||||||||||
| Cash Payment (Lump Sum) |
$ | 1,722,000 | — | — | — | |||||||||||||||
| Cash Payment (Over Time) |
$ | — | — | $ | 361,000 | $ | 361,000 | |||||||||||||
| Vested Stock Options(1) |
$ | 742,322 | $ | 742,322 | $ | 742,322 | $ | 742,322 | ||||||||||||
| Unvested Stock Options(2) |
$ | 57,631 | $ | 57,631 | — | $ | 181,331 | |||||||||||||
| Perquisites(3) |
— | — | $ | 35,613 | $ | 35,613 | ||||||||||||||
|
|
|
|
|
|
|
|
|
|||||||||||||
| Total |
$ | 2,521,953 | $ | 799,953 | $ | 1,138,935 | $ | 1,320,266 | ||||||||||||
|
|
|
|
|
|
|
|
|
|||||||||||||
| Wallace(11) |
||||||||||||||||||||
| Cash Payment (Lump Sum) |
$ | 1,480,000 | — | $ | — | $ | — | |||||||||||||
| Cash Payment (Over Time) |
— | — | $ | 240,000 | $ | 240,000 | ||||||||||||||
| Vested Stock Options(1) |
$ | 310,191 | $ | 310,191 | $ | 310,191 | $ | 310,191 | ||||||||||||
| Unvested Stock Options(2) |
$ | 12,925 | $ | 12,925 | — | $ | 40,125 | |||||||||||||
| Perquisites(3) |
— | — | $ | 16,407 | $ | 16,407 | ||||||||||||||
|
|
|
|
|
|
|
|
|
|||||||||||||
| Total |
$ | 1,803,116 | $ | 323,116 | $ | 566,598 | $ | 606,723 | ||||||||||||
|
|
|
|
|
|
|
|
|
|||||||||||||
130
Table of Contents
| (1) | Represents currently vested stock options. Calculations with regard to stock options are based upon the market value of our common stock, which is calculated on the basis of the appraisal price of the common stock ($15.17) as of September 28, 2012. Vested stock options are included in the table due to the fact that absent the events set forth in the table, the named executive officers would not have been able to gain any liquidity as of September 28, 2012 from any of the stock they would receive upon exercising vested options. |
| (2) | Represents unvested stock options that would vest upon the occurrence of the specified event. Calculations with regard to stock options are based upon the market value of our common stock, which is calculated on the basis of the appraisal price of the common stock ($15.17) as of September 28, 2012. |
(a) Only Messrs. Neubauer and Sutherland have attained the Company’s retirement age of 60 under the Management Stock Incentive Plan. Therefore, the accelerated vesting for stock options on retirement would apply only to Messrs. Neubauer and Sutherland.
(b) For Mr. Neubauer, the accelerated vesting for stock options in the case of permanent disability was calculated assuming that all options become fully vested. Otherwise, in the case of death or disability of any named executive officer, amounts were calculated assuming that all time-based options scheduled to vest in fiscal 2013 vest and the performance-based options granted in 2009, 2010, 2011 and 2012 that were scheduled to vest based upon the achievement of the 2012 EBIT target would not vest since the 2012 EBIT target was not achieved.
(c) For Mr. Neubauer, the accelerated vesting for stock options on a change of control was calculated assuming that all options become fully vested at 100% of target. Stock option amounts (which apply to options not yet vested) on a change of control for named executive officers other than Mr. Neubauer assume that unvested performance-based options granted in 2009 and 2010 vest at a rate of 50%, which is the blended rate for the vesting of performance-based stock options based on the 2010 and 2011 EBIT targets. Stock option amounts on a change of control for named executive officers other than Mr. Neubauer assume that unvested performance-based options granted in 2011 vest at a rate of 100%, which is the achieved rate for the vesting of performance-based stock options based on the 2011 EBIT target. See “Grants of Plan Based Awards for Fiscal Year 2012” and the narrative following the table.
| (3) | The following assumptions were used in our calculation of the cost of perquisites in connection with termination of employment: a 5% increase annually for health insurance premiums, dental insurance premiums, vision insurance premiums and excess health, with 2012 used as the base year, and no increase annually for life and accident insurance premiums. |
| (4) | Includes amounts payable under the Survivor Income Protection Plan, various term life insurance policies and accidental death and dismemberment policy for which we pay all or part of the premium, which amounts are reflected in the “Summary Compensation Table.” |
| (5) | For Mr. Foss, the “Termination Without Cause” column means termination without cause or resignation for Good Reason (as defined in his employment arrangements) prior to a change of control. |
| (6) | (a) The amounts set forth in the table with respect to Mr. Neubauer were calculated based upon his employment agreement in effect on the last day of fiscal 2012. Under the third amendment to Mr. Neubauer’s employment agreement (dated as of November 14, 2012, which was after our fiscal year end), performance-based stock options that failed to vest because the applicable EBIT target was not achieved will no longer automatically vest upon disability, voluntary resignation with notice, termination without cause, involuntary termination with notice and resignation with good reason / change of control, which would reduce the unvested stock option amounts in those categories by $1,313,774. |
(b) In addition to the amounts listed in this table, Mr. Neubauer also will receive his supplemental executive retirement benefit as described under “Pension Benefits for Fiscal Year 2012.”
(c) Included in Mr. Neubauer’s perquisites in the case of termination without cause or resignation for good reason following a change of control are health care, accident, disability and survivor insurance premiums for three years, use of a Company leased vehicle and vehicle maintenance and insurance for three years and reimbursement for financial planning services. Mr. Neubauer may also participate in the Executive Health Plan at his own expense.
| (7) | Included in Mr. Foss’ perquisites: (a) in the case of termination without cause, are basic medical and life insurance coverage and a car allowance over a 24-month severance period; and (b) in the case of a change of control, are health care, accident, disability and survivor insurance premiums for two years and a car allowance for twenty-four months, as well as outplacement benefits of 20% of his base salary. Mr. Foss would incur excise tax if a change of control of the Company had occurred on September 28, 2012, as his payout would be considered a parachute payment. He is not entitled to a 280G gross up, but under the terms of his employment agreement, if his payout on a change of control would be considered a parachute payment, we would reduce his payments if that reduction (to avoid the excise tax) would result in him receiving a greater after tax amount than he would have received had he been paid the full amount and then paid the excise tax. Because Mr. Foss would receive a greater after tax amount if he were paid the full change of control amount and paid the excise tax than he would if his payout were cut back to avoid the excise tax, the payments on change of control that are included in the table represent the gross amount he would receive before he paid the excise tax. In the event that Mr. Foss’ payments were considered parachute payments, the Company would lose the deduction for all amounts it paid to Mr. Foss above the “base amount” as defined in the Internal Revenue Code. |
131
Table of Contents
| (8) | Included in Mr. Sutherland’s perquisites: (a) in the case of termination without cause, are basic medical and life insurance coverage and a car allowance over an 18-month severance period; and (b) in the case of a change of control, are health care, accident, disability and survivor insurance premiums for two years and a car allowance for eighteen months, as well as outplacement benefits of 20% of his base salary. |
| (9) | Included in Ms. McKee’s perquisites: (a) in the case of termination without cause, are life insurance coverage and a car allowance over an 18-month severance period; and (b) in the case of a change of control, are health care, accident, disability and survivor insurance premiums for two years, a car allowance for 18 months, as well as outplacement benefits of 20% of her base salary. |
| (10) | Included in Mr. Munnelly’s perquisites, in the case of termination without cause, are basic medical insurance coverage and use of a leased car over a 52 week severance period. |
| (11) | Included in Ms. Wallace’s perquisites, in the case of termination without cause, are basic medical insurance coverage and receipt of a car allowance over a 52 week severance period. |
Director Compensation
Annual Cash Compensation for Board Service
Each non-employee, non-Sponsor director receives $100,000 annually for service on the board, payable quarterly in arrears. Prior to May 2012, non-employee, non-Sponsor directors received $90,000 annually, payable quarterly in arrears. The chairman of the Audit Committee is eligible to receive an additional annual retainer of $20,000 (prior to May 2012, $15,000), the chairman of the Compensation Committee is eligible to receive an additional annual retainer of $15,000 and the chairmen of the Nominating and Corporate Governance Committee and the Finance Committee are eligible to receive an additional annual retainer of $10,000, provided, in each case, that such committee chairmen are non-employee, non-Sponsor directors. Mr. Ksansnak currently is the only committee chairman who receives an additional annual retainer ($20,000), since he is the only non-employee, non-sponsor director who chairs a standing committee. In fiscal 2012 and the first quarter of fiscal 2013, Messrs. Babbio (Finance Committee), Robert J. Callander (Compensation Committee), Kean (Nominating Committee) and Ksansnak (Audit Committee) each received additional fees for chairing board committees.
Annual Deferred Stock Unit Grant
Each non-employee, non-Sponsor director receives an annual grant of $100,000 worth of deferred stock units (“DSUs”) under the Fourth Amended and Restated Management Stock Incentive Plan, which vest immediately upon grant. Prior to May 2012, non-employee, non-Sponsor directors received an annual grant of $90,000 worth of DSUs. DSUs are deliverable to a director in shares of our common stock six months after his service as a director terminates.
Director Deferred Compensation Plan
Prior to our 2007 Transaction, our non-employee directors could participate in our Deferred Compensation Plan for Directors, electing to receive all or part of an annual cash retainer in the form of deferred shares and/or deferred cash. Deferred cash accrues interest at a rate determined annually by us based on the Moody’s Long Term Corporate Baa Bond Index rate for October of the previous year, which was 5.37% beginning January 1, 2012. From September 29, 2011 until December 31, 2011, we credited amounts deferred with an interest rate equal to 5.72%. This plan was frozen in 2007 and only Governor Kean retains a balance, which accrues interest.
Health and Welfare Premiums
Current non-employee, non-Sponsor directors are eligible to participate in the Company’s health and welfare programs, for which the Company pays a portion of the premiums. The Company discontinued providing the benefit for new directors in May 2012, but grandfathered the benefit for then-serving non-employee, non-Sponsor directors who continue to serve on our board.
132
Table of Contents
Management Directors
Directors who are employees of the Company receive no additional compensation for service on our board of directors. The only directors who are currently also employees of the Company are our Chairman, Mr. Neubauer, and our CEO and President, Mr. Foss.
Reimbursement of Expenses
Directors are reimbursed for their reasonable expenses (including costs of travel, food and lodging) incurred when attending meetings of our board of directors, the committees of our board of directors and our stockholders. Directors are also reimbursed for any other reasonable expenses relating to their service on our board of directors, including visits to our offices and facilities.
Fiscal 2012 Director Compensation
The following table sets forth compensation information for our non-employee directors in fiscal 2012. The employee directors and Sponsor-affiliated directors receive no additional compensation for serving on the board of directors or any committee thereof.
Director Compensation
| Name |
Fees Earned or Paid in Cash ($)(1) |
Stock Awards ($)(2) |
Change in Pension Value and Nonqualified Deferred Compensation Earnings(4) |
All Other Compensation ($)(5) |
Total ($) | |||||||||||||||
| Todd M. Abbrecht |
— | — | — | — | — | |||||||||||||||
| Lawrence T. Babbio, Jr. |
$ | 102,500 | $ | 99,988 | — | — | $ | 202,488 | ||||||||||||
| Robert J. Callander(1) |
$ | 107,500 | $ | 99,988 | — | $ | 7,961 | $ | 215,449 | |||||||||||
| Leonard S. Coleman, Jr. |
$ | 92,500 | $ | 99,988 | — | $ | 11,476 | $ | 203,964 | |||||||||||
| Thomas H. Kean |
$ | 102,500 | $ | 99,988 | $ | 517 | — | $ | 203,005 | |||||||||||
| James E. Ksansnak |
$ | 108,750 | $ | 99,988 | — | $ | 7,961 | $ | 216,699 | |||||||||||
| Kewsong Lee |
— | — | — | — | — | |||||||||||||||
| Sanjeev Mehra |
— | — | — | — | — | |||||||||||||||
| Stephen P. Murray |
— | — | — | — | — | |||||||||||||||
| (1) | Mr. Callander retired from our board effective January 1, 2013 |
| (2) | Includes base director fees of $92,500, as well as chair fees as follows: for Messrs. Babbio and Kean, $10,000 in chair fees for serving as chairman of the Finance Committee and Nominating Committee, respectively, for Mr. Callander, $15,000 in chair fees for serving as the chairman of the Compensation Committee, and for Mr. Ksansnak, $16,250 in chair fees for serving as chairman of the Audit Committee. |
| (3) | Consists of a regular grant on March 2, 2012 of $89,995 worth of DSUs and a catch up grant on June 2, 2012 of $9,993 worth of DSUs to account for the Committee’s increase in director fees in May 2012. |
| (4) | Includes amounts earned on deferred compensation in excess of 120% of the applicable federal rate, based upon the above-market return at the time the rate basis was set. |
| (5) | Consists of the Company’s portion of the premiums for health and welfare benefits for the directors and their families. |
133
Table of Contents
PRINCIPAL AND SELLING STOCKHOLDERS
The following table sets forth information with respect to the beneficial ownership, as of June 28, 2013, of (i) each individual or entity known by us to own beneficially more than 5% of the shares of our common stock, (ii) each of our named executive officers, (iii) each of our directors and (iv) all of our directors and executive officers as a group.
The amounts and percentages of shares beneficially owned are reported on the basis of SEC regulations governing the determination of beneficial ownership of securities. Under SEC rules, a person is deemed to be a “beneficial owner” of a security if that person has or shares voting power or investment power, which includes the power to dispose of or to direct the disposition of such security. A person is also deemed to be a beneficial owner of any securities of which that person has a right to acquire beneficial ownership within 60 days. Securities that can be so acquired are deemed to be outstanding for purposes of computing such person’s ownership percentage, but not for purposes of computing any other person’s percentage. Under these rules, more than one person may be deemed to be a beneficial owner of the same securities and a person may be deemed to be a beneficial owner of securities as to which such person has no economic interest.
Except as otherwise indicated in the footnotes below, each of the beneficial owners has, to our knowledge, sole voting and investment power with respect to the indicated shares. Unless otherwise noted, the address of each beneficial owner is ARAMARK Holdings Corporation, ARAMARK Tower, 1101 Market Street, Philadelphia, Pennsylvania 19107.
| Common Stock Beneficially Owned After this Offering |
||||||||||||||||||||
| Common Stock Beneficially Owned Prior to this Offering |
Shares
of Common Stock Offered |
Assuming the Underwriters’ Option is not Exercised |
Assuming the Underwriters’ Option is Exercised in Full |
|||||||||||||||||
| Name of Beneficial Owner |
Number | %(1) | Number | % | Number | % | ||||||||||||||
| Principal and Selling Stockholders: |
||||||||||||||||||||
| GS Capital Partners(2) |
42,400,000 | 21.05 | % | |||||||||||||||||
| CCMP Capital Investors(3) |
21,200,000 | 10.52 | ||||||||||||||||||
| J.P. Morgan Partners(4) |
21,200,000 | 10.52 | ||||||||||||||||||
| Thomas H. Lee Partners(5) |
42,400,000 | 21.05 | ||||||||||||||||||
| Warburg Pincus LLC(6) |
43,300,000 | 21.50 | ||||||||||||||||||
| Directors and Named Executive Officers: |
||||||||||||||||||||
| Joseph Neubauer(7) |
20,490,328 | 10.17 | ||||||||||||||||||
| L. Frederick Sutherland(8) |
2,906,428 | 1.43 | ||||||||||||||||||
| Lynn B. McKee(9) |
1,331,434 | * | ||||||||||||||||||
| Eric J. Foss(10) |
713,168 | * | ||||||||||||||||||
| Joseph Munnelly(11) |
201,144 | * | ||||||||||||||||||
| Karen A. Wallace(12) |
64,285 | * | ||||||||||||||||||
| Todd M. Abbrecht(13) |
— | — | ||||||||||||||||||
| Lawrence T. Babbio, Jr.(14) |
— | — | ||||||||||||||||||
| Leonard S. Coleman, Jr.(15) |
— | — | ||||||||||||||||||
| Thomas H. Kean(16) |
— | — | ||||||||||||||||||
| James E. Ksansnak(17) |
— | — | ||||||||||||||||||
| Kewsong Lee(18) |
43,300,000 | 21.50 | ||||||||||||||||||
| Sanjeev Mehra(2) |
42,400,000 | 21.05 | ||||||||||||||||||
| Stephen P. Murray(3) |
21,200,000 | 10.52 | ||||||||||||||||||
| Directors and Executive Officers as a Group (16 Persons)(19) |
25,718,787 | 12.59 | % | |||||||||||||||||
134
Table of Contents
| * | Less than one percent or one share, as applicable. |
| (1) | As of June 28, 2013, we had 201,364,511 shares outstanding. |
| (2) | Shares shown as beneficially owned by GS Capital Partners reflect an aggregate of the following record ownership: (i) 22,326,144 shares held by GS Capital Partners V Fund, L.P.; (ii) 11,532,758 shares held by GS Capital Partners V Offshore Fund, L.P.; (iii) 7,655,956 shares held by GS Capital Partners V Institutional, L.P.; and (iv) 885,142 shares held by GS Capital Partners V GmbH & Co. KG (collectively, the “GS Entities”). The GS Entities, of which affiliates of the Goldman Sachs Group, Inc. are the general partner, managing general partner or investment manager, share voting and investment power with certain of its respective affiliates. Mr. Sanjeev Mehra is a Managing Director of Goldman Sachs & Co. and may be deemed to have beneficial ownership of the shares held by the GS Entities. The Goldman Sachs Group, Inc., Goldman, Sachs & Co. and Mr. Mehra each disclaim beneficial ownership of the shares held directly or indirectly by the GS Entities, except to the extent of its pecuniary interest therein, if any. The address of the GS Entities, the Goldman Sachs Group, Inc., Goldman, Sachs & Co. and Mr. Mehra is c/o The Goldman Sachs Group, 200 West Street, New York, New York 10282. |
| (3) | Shares shown as beneficially owned by CCMP Capital Investors reflect an aggregate of the following record ownership: (i) 18,706,647 shares held by CCMP Capital Investors II, L.P.; and (ii) 2,493,353 shares held by CCMP Capital Investors (Cayman) II, L.P. CCMP Capital, LLC is the sole owner of CCMP Capital Associates GP, LLC, which is the general partner of CCMP Capital Associates, L.P., which is the general partner of each of CCMP Capital Investors II, L.P. and CCMP Capital Investors (Cayman) II, L.P. Stephen Murray is President and Chief Executive Officer of CCMP Capital, LLC, and of CCMP Capital Advisors, LLC. Mr. Murray is a member of a CCMP Capital, LLC investment committee that makes voting and disposition decisions with respect to the shares held by the CCMP Capital Investors, and may be deemed to have beneficial ownership of such shares. Mr. Murray disclaims beneficial ownership of the shares held by the CCMP Capital Investors. CCMP Capital Advisors, LLC, pursuant to an agreement with JPMorgan Chase & Co. and J.P. Morgan Partners, LLC, advises J.P. Morgan Partners with respect to certain of its private equity investments, including its investment in the Company. CCMP Capital Advisors, LLC, and its affiliates, including Mr. Murray, disclaims beneficial ownership of the shares owned by J.P. Morgan Partners and its affiliates. The address of the entities listed above and of Mr. Murray is 245 Park Avenue, 16th Floor, New York, New York 10167, except that the address for CCMP Capital Investors (Cayman) II, L.P. is c/o Intertrust Corporate Services (Cayman) Limited, 190 Elgin Avenue, George Town, Grand Cayman KY1-9005, Cayman Islands. |
| (4) | Shares shown as beneficially owned by J.P. Morgan Partners reflect an aggregate of the following record ownership: (i) 11,955,003 shares held by J.P. Morgan Partners (BHCA), L.P.; (ii) 2,865,797 shares held by JP Morgan Partners Global Investors, L.P.; (iii) 440,340 shares held by J.P. Morgan Partners Global Investors A, L.P.; (iv) 1,438,760 shares held by J.P. Morgan Partners Global Investors (Cayman), L.P.; (v) 160,899 shares held by J.P. Morgan Partners Global Investors (Cayman) II, L.P.; (vi) 970,308 shares held by J.P. Morgan Partners Global Investors (Selldown), L.P.; and (vii) 3,368,893 shares held by J.P. Morgan Partners Global Investors (Selldown) II, L.P. The general partner of J.P. Morgan Partners (BHCA), L.P. is JPMP Master Fund Manager, L.P. The general partner of the entities listed in clauses (ii) through (vii) is JPMP Global Investors, L.P. The general partner of JPMP Master Fund Manager, L.P. and JPMP Global Investors, L.P. is JPMP Capital Corp., a wholly owned subsidiary of JPMorgan Chase & Co., a publicly traded company. The address of the JPMorgan Partners entities is 270 Park Avenue, 10th Floor, New York, New York 10017, except the address of each Cayman entity is c/o Intertrust Corporate Services (Cayman) Limited, 190 Elgin Avenue, George Town, Grand Cayman KY1-9005, Cayman Islands. |
| (5) | Shares shown as beneficially owned by investment funds affiliated with Thomas H. Lee Partners, L.P. reflect an aggregate of the following record ownership: (i) 23,347,540 shares held by Thomas H. Lee Equity Fund VI, L.P.; (ii) 15,809,712 shares held by Thomas H. Lee Parallel Fund VI, L.P.; (iii) 2,761,639 shares held by Thomas H. Lee Parallel (DT) Fund VI, L.P.; (iv) 200,000 shares held by THL Equity Fund VI Investors (Aramark), LLC; (v) 42,833 shares held by THL Coinvestment Partners, L.P. (collectively, the “THL Funds”); (vi) 119,161 shares held by Putnam Investment Holdings, LLC; and (vii) 119,115 shares held by Putnam Investments Employees’ Securities Company III LLC (collectively, the “Putnam Funds”). THL Holdco, LLC is the managing member of Thomas H. Lee Advisors, LLC, which is the general partner |
135
Table of Contents
| of Thomas H. Lee Partners, L.P., which is the sole member of THL Equity Advisors VI, LLC, which is the general partner of Thomas H. Lee Equity Fund VI, L.P., Thomas H. Lee Parallel Fund VI, L.P. and Thomas H. Lee Parallel (DT) Fund VI, L.P. and the manager of THL Equity Fund VI Investors (Aramark), LLC. Thomas H. Lee Partners, L.P. is the general partner of THL Coinvestment Partners, L.P. . The Putnam Funds are co-investment entities of the THL Funds, and are contractually obligated to co-invest (and dispose of securities) alongside certain of the THL Funds on a pro rata basis. Voting and investment determinations with respect to the shares held by the THL Funds are made by the management committee of THL Holdco, LLC. Anthony J. DiNovi and Scott M. Sperling are the members of the management committee of THL Holdco, LLC, and as such may be deemed to share beneficial ownership of the shares held or controlled by the THL Funds. Each of Messrs. DiNovi and Sperling disclaims beneficial ownership of such securities. Putnam Investment Holdings, LLC (“Holdings”) is the managing member of Putnam Investments Employees’ Securities Company III LLC (“ESC III”). Holdings disclaims any beneficial ownership of any shares held by ESC III. Putnam Investments LLC, the managing member of Holdings, disclaims beneficial ownership of any shares held by the Putnam Funds. The address of each of the THL Funds and Messrs. DiNovi and Sperling is c/o Thomas H. Lee Partners, L.P., 100 Federal Street, 35th Floor, Boston, Massachusetts 02110. The address of each of the Putnam Funds is c/o Putnam Investment, Inc., 1 Post Office Square, Boston, Massachusetts 02109. |
| (6) | Shares shown as beneficially owned by affiliates of Warburg Pincus LLC, a New York limited liability company (“WP LLC”) reflect record ownership of 43,300,000 shares held by Warburg Pincus Private Equity IX, L.P., a Delaware limited partnership (“WPIX”). The general partner of WPIX is Warburg Pincus IX, LLC, a New York limited liability company (“WPIX LLC”). Warburg Pincus Partners LLC, a New York limited liability company (“WP Partners”), is the sole member of WPIX LLC. Warburg Pincus & Co., a New York general partnership (“WP”), is the managing member of WP Partners. WP LLC manages WPIX. Charles R. Kaye and Joseph P. Landy are Managing General Partners of WP and Managing Members and Co-Presidents of WP LLC and may be deemed to control the Warburg Pincus entities. Messrs. Kaye and Landy disclaim beneficial ownership of all shares held by the Warburg Pincus entities. The address of the Warburg Pincus entities and Messrs. Kaye and Landy is 450 Lexington Avenue, New York, New York 10017. |
| (7) | Shares shown as beneficially owned by Mr. Neubauer reflect 100,000 shares subject to stock options exercisable as of June 28, 2013, or within 60 days of June 28, 2013. |
| (8) | Includes beneficial ownership of shares held by a family limited liability company for which Mr. Sutherland serves as a manager. Shares shown as beneficially owned by Mr. Sutherland reflect 1,382,030 shares subject to stock options exercisable as of June 28, 2013, or within 60 days of June 28, 2013. |
| (9) | Includes beneficial ownership of shares held by a general partnership for which Ms. McKee serves as a general partner. Shares shown as beneficially owned by Ms. McKee reflect 902,181 shares subject to stock options exercisable as of June 28, 2013, or within 60 days of June 28, 2013. |
| (10) | Shares shown as beneficially owned by Mr. Foss reflect 362,500 shares subject to stock options exercisable as of June 28, 2013, or within 60 days of June 28, 2013. |
| (11) | Shares shown as beneficially owned by Mr. Munnelly reflect 126,795 shares subject to stock options exercisable as of June 28, 2013, or within 60 days of June 28, 2013. |
| (12) | Shares shown as beneficially owned by Ms. Wallace reflect 44,285 shares subject to stock options exercisable as of June 28, 2013, or within 60 days of June 28, 2013. |
| (13) | Does not include shares of common stock held by the THL Funds or the Putnam Funds. Mr. Abbrecht is a member of THL Holdco, LLC, and by virtue of the relationships described in footnote (5) above, may be deemed to share beneficial ownership of the shares held by the THL Funds. Mr. Abbrecht disclaims beneficial ownership of the shares referred to in footnote (5) above. The address for Mr. Abbrecht is c/o Thomas H. Lee Partners, L.P., 100 Federal Street, 35th Floor, Boston, Massachusetts 02110. |
| (14) | Does not include 55,584 deferred stock units, which will convert to shares of common stock and be delivered to Mr. Babbio six months following his termination as a director. |
| (15) | Does not include 55,584 deferred stock units, which will convert to shares of common stock and be delivered to Mr. Coleman six months following his termination as a director. |
136
Table of Contents
| (16) | Does not include 55,584 deferred stock units, which will convert to shares of common stock and be delivered to Mr. Kean six months following his termination as a director. |
| (17) | Does not include 55,584 deferred stock units, which will convert to shares of common stock and be delivered to Mr. Ksansnak six months following his termination as a director. |
| (18) | Kewsong Lee is a Partner of Warburg Pincus & Co. and a Managing Director of Warburg Pincus LLC. Mr. Lee disclaims beneficial ownership of all shares of common stock held by the Warburg Pincus entities. The address for Mr. Lee is c/o Warburg Pincus LLC, 450 Lexington Avenue, New York, NY 10017. |
| (19) | Does not include shares that may be deemed to be beneficially owned but disclaimed by Mr. Murray, Mr. Lee and Mr. Mehra pursuant to notes 3, 18 and 19, respectively. Shares shown as beneficially owned by Directors and Executive Officers as a group reflect 3,152,127 shares subject to stock options exercisable currently, or within 60 days of June 28, 2013. |
137
Table of Contents
CERTAIN RELATIONSHIPS AND RELATED PARTY TRANSACTIONS
Review of Related Person Transactions
The Board of Directors adopted a written Policy Regarding Transactions with Related Persons, which is administered by our Audit and Corporate Practices Committee (the “Audit Committee”). This policy applies to any transaction or series of transactions in which the Company or a subsidiary is a participant, the amount involved exceeds $120,000 and a Related Person (as defined in Item 404(a) of SEC Regulation S-K) has a direct or indirect material interest; provided, however, our board of directors has determined that certain transactions not required to be reported pursuant to Item 404(a) of SEC Regulation S-K are not considered to be transactions covered by the Policy. Under the policy, a related person transaction must be reported to the Company’s General Counsel and be reviewed and approved or ratified by the Audit Committee in accordance with the terms of the policy, prior to the effectiveness or consummation of the transaction, whenever practicable. The Audit Committee will review all relevant information available to it about the potential related person transaction. The Audit Committee, in its sole discretion, may impose such conditions as it deems appropriate on the Company or the Related Person in connection with the approval of the Related Person Transaction.
Stockholder Arrangements
Stockholders Agreement
In connection with the 2007 Transaction, we entered into a stockholders agreement, dated January 26, 2007, as amended (the “Stockholders Agreement”), with Mr. Neubauer, the Sponsors and the other management participants. The Stockholders Agreement contains agreements among the parties with respect to the election of directors, restrictions on the issuance and transfer of shares, tag-along rights and drag-along rights, put rights and call options, and certain other corporate governance provisions. The Stockholders Agreement is expected to be amended and restated in connection with this offering.
Registration Rights Agreement
In connection with the 2007 Transaction, we entered into a registration rights agreement, dated January 26, 2007 (the “Registration Rights Agreement”), with Mr. Neubauer, the Sponsors and other management participants. Pursuant to the Registration Rights Agreement, these existing stockholders are entitled to participate in certain offerings of the Company’s securities registered under the Securities Act which are initiated by the Company, the Sponsors or Mr. Neubauer, subject to certain exceptions. This agreement provides to the Sponsors an unlimited number of “demand” registrations and customary “piggy back” registration rights and provides to Mr. Neubauer two “demand” registrations and customary “piggy back” registration rights. In addition, all stockholders party to the agreement are entitled to “piggy back” registration rights in an initial public offering to the extent any such stockholder is permitted by the Company to participate in the offering and the Sponsors, Mr. Neubauer and certain members of senior management are entitled to “piggy back” registration rights in subsequent offerings. Pursuant to our Registration Rights Agreement, stockholders who hold more than 20% of our then-outstanding shares, or Mr. Neubauer, have the right to require us to file a registration statement with the SEC for the resale of our common stock at any time after the consummation of an initial public offering. The Registration Rights Agreement also provides that we will pay certain expenses of these stockholders relating to such registrations and indemnify them against certain liabilities which may arise under the Securities Act of 1933, as amended.
Financing Transactions
We manage our exposure to interest rate changes with respect to our floating rate indebtedness through the use of interest rate swaps. Before and subsequent to the closing of the 2007 Transaction on January 26, 2007, our financial institution counterparties on these swaps have included entities affiliated with GS Capital Partners and with J.P. Morgan Partners, two of our Sponsors. As of June 28, 2013, the notional value of interest rate swaps with entities affiliated with GS Capital Partners was $90.7 million and with entities affiliated with J.P. Morgan
138
Table of Contents
Partners was $215.7 million. In all of these swaps, we pay the counterparty a fixed interest rate in exchange for their payment of a floating interest rate. The net payments to entities affiliated with GS Capital Partners and entities affiliated with J.P. Morgan Partners pursuant to interest rate swap transactions in fiscal 2012 were approximately $21.5 million and $28.2 million, respectively, and in the nine months ended June 28, 2013 were approximately $3.0 million and $5.5 million, respectively.
JP Morgan Chase Bank, N.A., an affiliate of J.P. Morgan Partners, serves as administrative agent, collateral agent and LC facility issuing bank for our Amended and Restated Credit Agreement dated as of March 26, 2010 (the “Credit Agreement”). In each of fiscal 2012 and 2013, we paid JPMorgan Chase Bank, N.A. $200,000 for these services.
We engaged Goldman Sachs Lending Partners LLC and J.P. Morgan Securities LLC, affiliates of GS Capital Partners and J.P. Morgan Partners, respectively, as co-lead arrangers in connection with several amendments to our Credit Agreement since the beginning of fiscal 2012. Under these engagements, Goldman Sachs Lending Partners LLC and J.P. Morgan Securities LLC were each paid (i) approximately $2.3 million on February 29, 2012 in connection with Amendment Agreement No. 2, (ii) approximately $2.2 million on December 20, 2012 in connection Amendment Agreement No. 3 and (iii) approximately $3.1 million in connection with Amendment Agreement No. 4. In addition, we paid approximately $565,000 in the aggregate in legal fees related to the Amendment Agreements on behalf of these co-lead arrangers.
Goldman, Sachs & Co. and J.P. Morgan Securities LLC, affiliates of GS Capital Partners and J.P. Morgan Partners, respectively, each acted as a lead book running manager and a representative of the initial purchasers of the $1,000 million aggregate principal amount of 5.75% Senior Notes due 2020 (the “2020 Notes”) that ARAMARK Corporation issued on March 7, 2013. Goldman, Sachs & Co. and J.P. Morgan Securities LLC were each paid $3.6 million in connection with the offering of the 2020 Notes. The proceeds from the offering, along with borrowings under the new term loans pursuant to Amendment Agreement No. 4, were used to tender any and all of (i) our outstanding 8.625% / 9.375% Senior Notes due 2016 (ii) ARAMARK Corporation’s outstanding 8.50% Senior Notes due 2015 and (iii) ARAMARK Corporation’s outstanding Senior Floating Rate Notes due 2015 (the “March 2013 Tender Offer”). Goldman Sachs & Co. acted as a dealer manager in connection with the March 2013 Tender Offer and we paid approximately $42,000 in legal fees in connection with this engagement on behalf of Goldman Sachs.
Goldman Sachs Lending Partners LLC is an affiliate of GS Capital Partners, and Sanjeev Mehra, Managing Director of Goldman, Sachs & Co. and a member of the board of directors of the Company. JPMorgan Chase Bank, N.A. and J.P. Morgan Securities LLC are affiliates of J.P. Morgan Partners, Stephen P. Murray, who serves on the board of directors of the Company, was employed by J.P. Morgan Partners until August 2006 and has been employed by CCMP Capital Advisors since August 2006.
Other Transactions
Effective March 5, 2013, Mr. Neubauer’s 1995 Trust surrendered split dollar life insurance policies it owned, in which the Company held a security interest. Pursuant to Mr. Neubauer’s Split Dollar Life Insurance Agreement, prior to 2003 we paid a substantial portion of the premiums on the policies, and those amounts were required to be repaid from the proceeds of the policies upon their termination. We did not charge interest in each fiscal year on this amount, but we captured at least some of the foregone interest because we reduced the amount of the interest that would otherwise accrue on Mr. Neubauer’s deferred compensation. At March 5, 2013, the effective date of the surrender of the policies, the amount of the premium repayment obligation was $ 2,497,692. Upon the surrender of the policies, we received the amount of the premium repayment obligation and then remitted the remaining $1,341,212 to Mr. Neubauer’s 1995 Trust.
139
Table of Contents
DESCRIPTION OF CERTAIN INDEBTEDNESS
The summaries of our senior secured credit facilities and senior notes set forth below are qualified in their entirety by the actual text of the applicable agreements and indentures, each of which has been filed with the SEC as an exhibit to the registration statement of which this prospectus constitutes a part and which may be obtained on publicly available websites at the addresses set forth under “Where You Can Find More Information.”
Senior Secured Credit Facilities
Overview
Senior Secured Credit Facilities
Our senior secured credit facilities currently provide:
| • | a total of $4,686.8 million in term loan facilities comprised of various tranches denominated in U.S. Dollars, Canadian dollars, euros, yen and pounds sterling; |
| • | a revolving credit facility of up to $605.0 million available for loans denominated in U.S. Dollars, $50.0 million of which is also available in Canadian dollars; and |
| • | a synthetic letter of credit facility of up to $200.0 million. |
The primary borrower under the senior secured credit facilities is ARAMARK Corporation. In addition, certain subsidiaries of ARAMARK Corporation are borrowers under certain tranches of the term loan facility and/or the revolving credit facility. Holdings is not a guarantor under the senior secured credit facilities and is not subject to the covenants or obligations under the senior secured credit agreement. Following completion of this offering, it is intended that Holdings will become a guarantor under the senior secured credit facilities.
The revolving credit facility currently consists of the following subfacilities:
| • | a revolving credit facility available for loans in U.S. dollars to ARAMARK Corporation with aggregate commitments of $555.0 million; and |
| • | a revolving credit facility available for loans in Canadian dollars or U.S. dollars to ARAMARK Canada Ltd., a wholly-owned Canadian subsidiary, and ARAMARK Corporation with aggregate commitments of $50.0 million. |
The final maturity date of $505.0 million of the $555.0 million U.S. revolving loan commitments and all of the Canadian revolving loan commitments is January 26, 2017, provided, however, that the maturity date accelerates to April 26, 2016 if any term loans, other than the term loans due September 7, 2019 and any other term loans with a maturity at least 91 days after January 26, 2017, remain outstanding on April 26, 2016. The final maturity date of the $50.0 million remaining U.S. dollar revolving loan commitments is January 26, 2015.
Our revolving credit facility includes a $250.0 million sublimit for letters of credit and includes borrowing capacity available for short-term borrowings referred to as swingline loans subject to a sublimit.
The senior secured credit facilities provide that we have the right at any time to request up to $750.0 million of incremental commitments in the aggregate under one or more incremental term loan facilities and/or synthetic letter of credit facilities and/or revolving credit facilities and/or by increasing commitments under the revolving credit facility. The lenders under these facilities are not under any obligation to provide any such incremental facilities or commitments, and any such addition of or increase in facilities or commitments will be subject to pro forma compliance with an incurrence-based financial covenant and customary conditions precedent. Our ability to obtain extensions of credit under these incremental facilities or commitments is subject to the same conditions as extensions of credit under the existing credit facilities.
As of June 28, 2013, outstanding term loan borrowings were $4,678.7 million and outstanding revolving credit borrowings were $142.0 million.
140
Table of Contents
Interest Rate and Fees
Borrowings under the senior secured credit facilities bear interest at a rate equal to an applicable margin plus, at our option, either (a) a LIBOR rate determined by reference to the costs of funds for deposits in the currency of such borrowing for the interest period relevant to such borrowing adjusted for certain additional costs, (b) with respect to borrowings denominated in U.S. Dollars, a base rate determined by reference to the higher of (1) the prime rate of the administrative agent, (2) the federal funds rate plus 0.50% and (3) the LIBOR rate plus 1% or (c) with respect to borrowings denominated in Canadian dollars, (1) a base rate determined by reference to the prime rate of Canadian banks or (2) a BA (bankers’ acceptance) rate determined by reference to the rate offered for banker’s acceptances in Canadian dollars for the interest period relevant to such borrowing.
The applicable margin spread for U.S. dollar borrowings under the revolving credit facility are 3.25% with respect to eurocurrency (LIBOR) borrowings and 2.25% with respect to base-rate borrowings. The applicable margin spread for Canadian dollar borrowings under the revolving credit facility are 3.25% for BA (bankers’ acceptance) rate borrowings and 2.25% for base rate borrowings. U.S. and Canadian swingline loans must be base rate borrowings.
In addition to paying interest on outstanding principal, we are required to pay a commitment fee to the lenders under the revolving credit facility in respect of the unutilized commitments thereunder. The commitment fee rate is 0.50% per annum.
Maturity Dates
Beginning on March 26, 2010, we began extending the maturity dates of our term loans from January 26, 2014 to July 26, 2016 through a series of amendments to our senior secured credit agreement. On December 20, 2012, we extended the maturity of approximately $650 million of term loans, representing the remaining balance of un-extended term loans, and on March 7, 2013, we borrowed an additional $1,400 million of term loans, which have a maturity date of September 7, 2019. The applicable margin spreads for all term loans are as follows (i) 3.50% for U.S. dollar denominated LIBOR term loan borrowings other than the term loans maturing on September 7, 2019 and Euro denominated LIBOR term loan borrowings, (ii) 2.50% for U.S. dollar denominated base rate term loan borrowings other than term loans maturing on September 7, 2019, (iii) 3.00% for the term loans maturing on September 7, 2019 borrowed at the LIBOR rate, (iv) 2.00% for the term loans maturing on September 7, 2019 borrowed at the base rate and (v) 3.50% for yen denominated term loans and sterling denominated term loans borrowings.
Beginning on March 26, 2010, we began extending the maturity dates of the deposits securing the synthetic letter of credit facility from January 26, 2014 to July 26, 2016 through a series of amendments to our senior secured credit agreement. We have extended the maturity dates for $159.3 million of synthetic letter of credit facility deposits to July 26, 2016. The maturity dates for the remaining $40.7 million of un-extended synthetic letter of credit facility deposits remain January 26, 2014. Fees with respect to the $159.3 million of extended letter of credit facility deposits are 3.50%. Fees on the $40.7 million of un-extended synthetic letter of credit facility deposits are 1.875% to 2.125% depending on ARAMARK Corporation’s ratio of Consolidated Secured Debt to Covenant EBITDA, as defined in the senior secured credit agreement. The actual fees on the un-extended synthetic letter of credit facility deposits as of June 28, 2013 were 2.00%.
Prepayments
The senior secured credit agreement requires us to prepay outstanding term loans, subject to certain exceptions, with:
| • | 50% of ARAMARK Corporation’s annual excess cash flow (as defined in the senior secured credit agreement) with stepdowns to 25% and 0% upon ARAMARK Corporation’s reaching a certain senior secured leverage ratio threshold; |
141
Table of Contents
| • | 100% of the net cash proceeds of all nonordinary course asset sales or other dispositions of property subject to certain exceptions and customary reinvestment rights; and |
| • | 100% of the net cash proceeds of any incurrence of debt, including debt incurred by any business securitization subsidiary in respect of any business securitization facility, but excluding proceeds from the receivables facilities and other debt permitted under the senior secured credit agreement. |
The foregoing mandatory prepayments will be applied to the term loan facilities as directed by us. We may voluntarily repay outstanding loans under the senior secured credit facilities at any time without premium or penalty, other than customary “breakage” costs with respect to LIBOR loans. Prepaid term loans may not be reborrowed.
On March 30, 2007, June 29, 2007 and September 28, 2007, we voluntarily prepaid an additional $40.0 million, $300.0 million and $50.0 million, respectively. In fiscal 2009, we voluntarily prepaid an additional $100.0 million of outstanding term loans in anticipation of a required excess cash flow prepayment in the first quarter of fiscal year 2010. In June 2010 and September 2010, we made optional prepayments of $150.0 million and $150.0 million, respectively, of outstanding U.S. Dollar term loan.
If a change of control as defined in the senior secured credit agreement occurs, this will cause an event of default under the credit agreement. Upon an event of default, the senior secured credit facilities may be accelerated, in which case we would be required to repay all outstanding loans plus accrued and unpaid interest and all other amounts outstanding under the senior credit facilities.
Amortization and Maturity
We are required to repay installments on the loans under the term loan facilities in quarterly principal amounts of 1% per annum of their funded total principal amount beginning on March 31, 2014. For term loans due on July 26, 2016, the remaining principal amount is payable on the maturity date of July 26, 2016. For term loans due on September 7, 2019, the remaining principal amount is payable on the maturity date of September 7, 2019.
Principal amounts outstanding under the revolving credit facility are due and payable in full at maturity. The final maturity date of the Canadian revolving loan commitments and $505.0 million of the $555.0 million U.S. revolving loan commitments is January 26, 2017, provided, however, that the maturity date accelerates to April 26, 2016 if any term loans, other than the term loans due on September 7, 2019 and any other term loans with a maturity at least 91 days after January 26, 2017, remain outstanding on April 26, 2016. The final maturity date of the remaining revolving loan commitments is January 26, 2015.
Principal amounts outstanding under the synthetic letter of credit facility are due and payable in full at maturity, on which day the commitments thereunder will terminate. The final date of maturity for $159.3 million of synthetic letter of credit facility deposits has been extended to July 26, 2016. The final date of maturity for the $40.7 million of un-extended synthetic letter of credit facility deposits remains January 26, 2014.
Guarantee and Security
All obligations under the senior secured credit agreement are unconditionally guaranteed by ARAMARK Intermediate Holdco Corporation and, subject to certain exceptions, substantially all of ARAMARK Corporation’s existing and future domestic subsidiaries (excluding certain immaterial and dormant subsidiaries, receivables facility subsidiaries, business securitization subsidiaries and certain subsidiaries designated by us under our senior secured credit agreement as “unrestricted subsidiaries”), referred to, collectively, as U.S. Guarantors. All obligations of each foreign borrower under the senior secured credit facilities are unconditionally guaranteed by ARAMARK Corporation, the U.S. guarantors and, subject to certain exceptions and qualifications, the respective other foreign borrowers.
142
Table of Contents
All obligations under the senior secured credit facilities, and the guarantees of those obligations, are secured by substantially all of the following assets of ARAMARK Intermediate Holdco Corporation, ARAMARK Corporation and each U.S. Guarantor, subject to certain exceptions:
| • | a pledge of 100% of the capital stock of ARAMARK Corporation; |
| • | 100% of the capital stock held by ARAMARK Intermediate Holdco Corporation, us or any of our domestic subsidiaries that are directly owned by us or one of the U.S. Guarantors and 100% of the capital stock of each of our existing and future foreign subsidiaries that are directly owned by us or one of the U.S. Guarantors; and |
| • | a security interest in, and mortgages on, substantially all tangible and intangible assets of ARAMARK Intermediate Holdco Corporation, ARAMARK Corporation and each U.S. Guarantor. |
Certain Covenants and Events of Default
The senior secured credit agreement contains a number of covenants that, among other things, restrict, subject to certain exceptions, ARAMARK Corporation’s ability and the ability of its restricted subsidiaries to:
| • | incur additional indebtedness, issue preferred stock or provide guarantees; |
| • | create liens on assets; |
| • | engage in mergers or consolidations; |
| • | sell assets; |
| • | pay dividends, make distributions or repurchase our capital stock; |
| • | make investments, loans or advances; |
| • | repay or repurchase any notes, except as scheduled or at maturity; |
| • | create restrictions on the payment of dividends or other transfers to us from our restricted subsidiaries; |
| • | make certain acquisitions; |
| • | engage in certain transactions with affiliates; |
| • | amend material agreements governing the senior notes (or any indebtedness that refinances the senior notes); and |
| • | fundamentally change our business. |
In addition, the senior secured credit agreement requires us to maintain the following financial covenants in connection with the revolving credit facility:
| • | a maximum senior secured leverage ratio; and |
| • | maximum annual capital expenditures. |
The senior secured credit agreement also contains certain customary affirmative covenants and certain events of default.
Senior Notes
General
On March 7, 2013, ARAMARK Corporation issued $1,000 million of 5.75% Senior Notes due 2020 (the “senior notes”) pursuant to the indenture, dated as of March 7, 2013 (the “Indenture”), among ARAMARK Corporation, the guarantors named therein and The Bank of New York Mellon, as trustee.
143
Table of Contents
The senior notes are unsecured obligations of ARAMARK Corporation. The senior notes rank equal in right of payment to all of ARAMARK Corporation’s existing and future senior debt and senior in right of payment to all of ARAMARK Corporation’s existing and future debt that is expressly subordinated in right of payment to the senior notes. Each of the guarantors named in the Indenture (each a “Senior Notes Guarantor”) is providing an unconditional guarantee of the senior notes which ranks equal in right of payment to all of the senior obligations of such Senior Notes Guarantor. The senior notes and the guarantees are effectively subordinated to ARAMARK Corporation’s existing and future secured debt and that of the Senior Notes Guarantors, including all indebtedness under our senior secured credit facilities, to the extent of the value of the assets securing that indebtedness. The senior notes and guarantees are structurally subordinated to all of the liabilities of any of ARAMARK Corporation’s subsidiaries that do not guarantee the senior notes.
Interest on the senior notes is payable on March 15 and September 15 of each year, commencing on September 15, 2013. Interest on the senior notes accrue from March 7, 2013. Interest is calculated on the basis of a 360-day year of twelve 30-day months. The senior notes mature on March 15, 2020.
Optional Redemption
Prior to March 15, 2015, ARAMARK Corporation may redeem up to 40% of the senior notes with the proceeds from one or more qualified equity offerings at a price equal to 105.750% of the principal amount of the senior notes redeemed, plus accrued and unpaid interest and additional interest, if any, to the date of redemption. In addition, at any time prior to March 15, 2015, ARAMARK Corporation may redeem all or a portion of the senior notes at a price equal to 100% of the principal amount of the senior notes redeemed plus a “make whole” premium and accrued and unpaid interest and additional interest, if any, to the date of redemption. Thereafter, ARAMARK Corporation has the option to redeem all or a portion of the senior notes at any time at the redemption prices set forth in the Indenture.
Change of Control Offer
In the event of certain types of change of control, the holders of the senior notes may require ARAMARK Corporation to purchase for cash all or a portion of their senior notes at a purchase price equal to 101% of the principal amount of such senior notes, plus accrued and unpaid interest, if any, to the date of repurchase.
Covenants
The Indenture contains covenants limiting ARAMARK Corporation’s ability and the ability of its restricted subsidiaries to:
| • | incur additional indebtedness or issue certain preferred shares; |
| • | pay dividends and make certain distributions, investments and other restricted payments; |
| • | create certain liens; |
| • | sell assets; |
| • | enter into transactions with affiliates; |
| • | limit the ability of restricted subsidiaries to make payments to ARAMARK Corporation; |
| • | enter into sale and leaseback transactions; |
| • | merge, consolidate, sell or otherwise dispose of all or substantially all of ARAMARK Corporation’s assets; and |
| • | designate ARAMARK Corporation’s subsidiaries as unrestricted subsidiaries. |
144
Table of Contents
The Indenture also provides for events of default which, if any of them occurs, would permit or require the principal of and accrued interest on the senior notes to become or to be declared due and payable.
Holdings does not currently guarantee the senior notes and is not subject to the covenants that apply to ARAMARK Corporation or its restricted subsidiaries under the senior notes. Following completion of this offering, it is intended that Holdings will guarantee the senior notes for purposes of financial reporting, but will not become subject to any covenants under the senior notes.
Receivables Facility
Overview
We have in place an agreement whereby ARAMARK Receivables, LLC (“ARAMARK Receivables”), a wholly-owned, bankruptcy-remote subsidiary of ARAMARK Corporation, purchases accounts receivable generated by certain of our operating subsidiaries using funding provided through the sale of an interest in such accounts receivable and other related assets to Wells Fargo Bank, N.A. (“Wells Fargo”) and a commercial paper conduit (the “Commercial Paper Conduit”) sponsored by Coöperatieve Centrale Raiffeisen-Boerenleenbank B.A., New York Branch (“Rabobank”). This receivables facility provides an amount of funding up to a maximum of $300.0 million. The availability of funding under the facility depends on the amount of receivables eligible for funding under the receivables facility and satisfaction of other customary conditions. As of June 28, 2013, we had outstanding borrowings under the receivables facility of $300.0 million.
Availability of funding under the receivables facility depends primarily upon the outstanding accounts receivable balance of our subsidiaries that participate in the facility. Aggregate availability is determined by using a formula that reduces the gross receivables balance by factors that take into account, among other things, historical default and dilution rates, excessive obligor concentrations and average days outstanding and the costs of the facility.
The Commercial Paper Conduit may discontinue funding the receivables facility at any time for any reason. If it does, Rabobank will be obligated to fund the Commercial Paper Conduit’s proportion of the receivables facility.
Twenty-three of our subsidiaries participate in the receivables facility program all of which are domestic subsidiaries in our FSS North America segment.
Interest Rates and Fees
ARAMARK Receivables is required to pay interest on the amount of each advance forwarded by Wells Fargo at a variable rate equal to a one-month Eurodollar rate determined daily plus the applicable margin equal to 1.40%. ARAMARK Receivables is required to pay interest on the amount of each advance funded by the Commercial Paper Conduit at the quoted cost of funds for the Commercial Paper Conduit’s issuance of commercial paper plus an applicable margin equal to 1.40%. For the amount of each advance funded through Rabobank directly, the receivables facility provides funding at an applicable margin equal to 1.40%, plus, either (1) a one, two, three or six-month Eurodollar rate plus the applicable margin for revolving loans under our senior secured credit agreement, or (2) the higher of (x) Rabobank’s prime rate and (y) the federal funds effective rate plus 0.50%.
In addition, ARAMARK Receivables is required to pay a fee on the unused portion of the receivables facility of between 0.35% and 0.45% (depending on the level of used capacity) per annum.
In addition, ARAMARK Corporation acts as receivables collection agent, servicing, administering and collecting receivables transferred pursuant to the receivables facility. Under the receivables facility, ARAMARK Corporation receives an estimated monthly servicing fee of approximately 1.0% per annum of the daily average outstanding balance of the receivables under such facility, payable monthly in arrears by ARAMARK Receivables.
145
Table of Contents
Maturity and Termination Events
The final maturity of the receivables facility is January 26, 2015. The receivables facility may be terminated for material breaches of representations and warranties or covenants, bankruptcies of any seller, the collection agent or the transferor, a change of control or certain cross defaults under our senior secured credit facility or other material indebtedness, among other reasons.
Other Indebtedness
As of June 28, 2013, we had outstanding approximately $54.2 million of secured debt representing capital lease obligations. In addition, we had $42.1 million of other indebtedness outstanding at June 28, 2013, consisting primarily of borrowings by certain of our foreign subsidiaries.
146
Table of Contents
In connection with this offering, we will amend and restate our certificate of incorporation and our bylaws. The following is a description of the material terms of, and is qualified in its entirety by, our amended and restated certificate of incorporation and amended and restated bylaws, each of which will be in effect upon the consummation of this offering, the forms of which are filed as exhibits to the registration statement of which this prospectus is a part.
Our purpose is to engage in any lawful act or activity for which corporations may now or hereafter be organized under the General Corporation Law of the State of Delaware (the “DGCL”). Upon the consummation of this offering, our authorized capital stock will consist of shares of common stock, par value $0.01 per share, and shares of preferred stock, par value $0.01 per share. No shares of preferred stock will be issued or outstanding immediately after the public offering contemplated by this prospectus. Unless our board of directors determines otherwise, we will issue all shares of our capital stock in uncertificated form.
Common Stock
Holders of shares of our common stock are entitled to one vote for each share held of record on all matters on which stockholders are entitled to vote generally, including the election or removal of directors. The holders of our common stock do not have cumulative voting rights in the election of directors.
Upon our liquidation, dissolution or winding up and after payment in full of all amounts required to be paid to creditors and to the holders of shares of our preferred stock having liquidation preferences, if any, the holders of shares of our common stock will be entitled to receive pro rata our remaining assets available for distribution. Holders of shares of our common stock do not have preemptive, subscription, redemption or conversion rights. Shares of our common stock will not be subject to further calls or assessment by us. There will be no redemption or sinking fund provisions applicable to shares of our common stock. All shares of our common stock that will be outstanding at the time of the completion of the offering will be fully paid and non-assessable. The rights, powers, preferences and privileges of holders of shares of our common stock will be subject to those of the holders of any shares of our preferred stock we may authorize and issue in the future.
Preferred Stock
Our amended and restated certificate of incorporation authorizes our board of directors to establish one or more series of shares of preferred stock (including shares of convertible preferred stock). Unless required by law or by the NYSE, the authorized shares of preferred stock will be available for issuance without further action by you. Our board of directors is able to determine, with respect to any series of shares of preferred stock, the powers (including voting powers), preferences and relative, participating, optional or other special rights, and the qualifications, limitations or restrictions thereof, including, without limitation:
| • | the designation of the series; |
| • | the number of shares of the series, which our board of directors may, except where otherwise provided in the preferred stock designation, increase (but not above the total number of authorized shares of the class) or decrease (but not below the number of shares then outstanding); |
| • | whether dividends, if any, will be cumulative or non-cumulative and the dividend rate of the series; |
| • | the dates at which dividends, if any, will be payable; |
| • | the redemption rights and price or prices, if any, for shares of the series; |
| • | the terms and amounts of any sinking fund provided for the purchase or redemption of shares of the series; |
| • | the amounts payable on shares of the series in the event of any voluntary or involuntary liquidation, dissolution or winding-up of the affairs of the Company; |
147
Table of Contents
| • | whether the shares of the series will be convertible into shares of any other class or series, or any other security, of the Company or any other corporation, and, if so, the specification of the other class or series or other security, the conversion price or prices or rate or rates, any rate adjustments, the date or dates as of which the shares will be convertible and all other terms and conditions upon which the conversion may be made; |
| • | restrictions on the issuance of shares of the same series or of any other class or series; and |
| • | the voting rights, if any, of the holders of the series. |
We could issue a series of shares of preferred stock that could, depending on the terms of the series, impede or discourage an acquisition attempt or other transaction that some, or a majority, of the holders of shares of our common stock might believe to be in their best interests or in which the holders of shares of our common stock might receive a premium for your shares of common stock over the market price of the shares of common stock. Additionally, the issuance of shares of preferred stock may adversely affect the holders of shares of our common stock by restricting dividends on the shares of common stock, diluting the voting power of the shares of common stock or subordinating the liquidation rights of the shares of common stock. As a result of these or other factors, the issuance of shares of preferred stock could have an adverse impact on the market price of shares of our common stock.
Dividends
The DGCL permits a corporation to declare and pay dividends out of “surplus” or, if there is no “surplus,” out of its net profits for the fiscal year in which the dividend is declared and/or the preceding fiscal year. “Surplus” is defined as the excess of the net assets of the corporation over the amount determined to be the capital of the corporation by the board of directors. The capital of the corporation is typically calculated to be (and cannot be less than) the aggregate par value of all issued shares of capital stock. Net assets equals the fair value of the total assets minus total liabilities. The DGCL also provides that dividends may not be paid out of net profits if, after the payment of the dividend, remaining capital would be less than the capital represented by the outstanding stock of all classes having a preference upon the distribution of assets.
Declaration and payment of any dividend will be subject to the discretion of our board of directors. The time and amount of dividends will be dependent upon our financial condition, operations, cash requirements and availability, debt repayment obligations, capital expenditure needs and restrictions in our debt instruments, industry trends, the provisions of Delaware law affecting the payment of distributions to stockholders and any other factors our board of directors may consider relevant.
Following completion of this offering, we intend to pay cash dividends on our common stock, subject to our compliance with applicable law, and depending on, among other things, our results of operations, financial condition, level of indebtedness, capital requirements, contractual restrictions, business prospects and other factors that our board of directors may deem relevant. In addition, our ability to pay dividends is limited by covenants in our senior secured credit agreement and our notes indenture. Future agreements may also limit our ability to pay dividends. See “Dividend Policy,” “Description of Certain Indebtedness” for restrictions on our ability to pay dividends.
Annual Stockholder Meetings
Our amended and restated certificate of incorporation and our amended and restated bylaws provide that annual stockholder meetings will be held at a date, time and place, if any, as exclusively selected by our board of directors. To the extent permitted under applicable law, we may conduct meetings by remote communications, including by webcast.
148
Table of Contents
Anti-Takeover Effects of Our Amended and Restated Certificate of Incorporation and Amended and Restated Bylaws and Certain Provisions of Delaware Law
Our amended and restated certificate of incorporation, amended and restated bylaws and the DGCL contain provisions, which are summarized in the following paragraphs, that are intended to enhance the likelihood of continuity and stability in the composition of our board of directors. These provisions are intended to avoid costly takeover battles, reduce our vulnerability to a hostile change of control and enhance the ability of our board of directors to maximize stockholder value in connection with any unsolicited offer to acquire us. However, these provisions may have an anti-takeover effect and may delay, deter or prevent a merger or acquisition of the Company by means of a tender offer, a proxy contest or other takeover attempt that a stockholder might consider in its best interest, including those attempts that might result in a premium over the prevailing market price for the shares of common stock held by stockholders.
Authorized but Unissued Capital Stock
Delaware law does not require stockholder approval for any issuance of authorized shares. However, the listing requirements of the NYSE, which would apply if and so long as our common stock remains listed on the NYSE, require stockholder approval of certain issuances equal to or exceeding 20% of the then outstanding voting power or then outstanding number of shares of common stock. Additional shares that may be used in the future may be used for a variety of corporate purposes, including future public offerings, to raise additional capital or to facilitate acquisitions.
Our board of directors may generally issue preferred shares on terms calculated to discourage, delay or prevent a change of control of the Company or the removal of our management. Moreover, our authorized but unissued shares of preferred stock will be available for future issuances without stockholder approval and could be utilized for a variety of corporate purposes, including future offerings to raise additional capital, to facilitate acquisitions and employee benefit plans.
One of the effects of the existence of unissued and unreserved shares of common stock or preferred stock may be to enable our board of directors to issue shares to persons friendly to current management, which issuance could render more difficult or discourage an attempt to obtain control of the Company by means of a merger, tender offer, proxy contest or otherwise, and thereby protect the continuity of our management and possibly deprive our stockholders of opportunities to sell their shares of common stock at prices higher than prevailing market prices.
Delaware Anti-Takeover Statutes
Certain Delaware law provisions may make it more difficult for someone to acquire us through a tender offer, proxy contest or otherwise.
Section 203 of the DGCL, provides that, subject to certain stated exceptions, an “interested stockholder” is any person (other than the corporation and any direct or indirect majority-owned subsidiary) who owns 15% or more of the outstanding voting stock of the corporation or is an affiliate or associate of the corporation and was the owner of 15% or more of the outstanding voting stock of the corporation at any time within the three-year period immediately prior to the date of determination, and the affiliates and associates of such person. A corporation may not engage in a business combination with any interested stockholder for a period of three years following the time that such stockholder became an interested stockholder unless:
| • | prior to such time the board of directors of the corporation approved either the business combination or transaction which resulted in the stockholder becoming an interested stockholder; |
| • | upon consummation of the transaction which resulted in the stockholder becoming an interested stockholder, the interested stockholder owned at least 85% of the voting stock of the corporation |
149
Table of Contents
| outstanding at the time the transaction commenced, excluding shares owned by persons who are directors and also officers and employee stock plans in which participants do not have the right to determine confidentially whether shares held subject to the plan will be tendered in a tender or exchange offer; or |
| • | at or subsequent to such time, the business combination is approved by the board of directors and authorized at an annual or special meeting of stockholders, and not by written consent, by the affirmative vote of 66-2/3% of the outstanding voting stock which is not owned by the interested stockholder. |
The effect of these provisions may make a change in control of our business more difficult by delaying, deferring or preventing a tender offer or other takeover attempt that a stockholder might consider in its best interest. This includes attempts that might result in the payment of a premium to stockholders over the market price for their shares. These provisions also may promote the continuity of our management by making it more difficult for a person to remove or change the incumbent members of the board of directors.
Removal of Directors; Vacancies
Our amended and restated certificate of incorporation provides that directors may be removed with or without cause upon the affirmative vote of a majority in voting power of all outstanding shares of stock entitled to vote thereon, voting together as a single class; provided, however, at any time when the Controlling Owners and their affiliates beneficially own, in the aggregate, less than a majority in voting power of the stock of the Company entitled to vote generally in the election of directors, directors may only be removed for cause, and only by the affirmative vote of holders of at least 75% in voting power of all the then-outstanding shares of stock of the Company entitled to vote thereon, voting together as a single class. In addition, our amended and restated certificate of incorporation also provides that, subject to the rights granted to one or more series of shares of preferred stock then outstanding, any newly created directorship on the board of directors that results from an increase in the number of directors and any vacancies on our board of directors will be filled only by the affirmative vote of a majority of the remaining directors, even if less than a quorum, by a sole remaining director or by the stockholders; provided, however, at any time when the Controlling Owners and their affiliates beneficially own, in the aggregate, less than % in voting power of the shares of stock of the Company entitled to vote generally in the election of directors, any newly created directorship on the board of directors that results from an increase in the number of directors and any vacancy occurring in the board of directors may only be filled by a majority of the directors then in office, although less than a quorum, or by a sole remaining director (and not by the stockholders).
No Cumulative Voting
Under Delaware law, the right to vote cumulatively does not exist unless the certificate of incorporation specifically authorizes cumulative voting. Our amended and restated certificate of incorporation does not authorize cumulative voting. Therefore, stockholders holding a majority in voting power of the shares of our stock entitled to vote generally in the election of directors will be able to elect all our directors.
Special Stockholder Meetings
Our amended and restated certificate of incorporation provides that special meetings of our stockholders may be called at any time only by or at the direction of the board of directors or the chairman of the board of directors; provided, however, at any time when the Controlling Owners and their affiliates beneficially own, in the aggregate, at least a majority in voting power of the shares of stock of the Company entitled to vote generally in the election of directors, special meetings of our stockholders shall also be called by the board of directors or the chairman of the board of directors at the request of the Controlling Owners and their affiliates. Our amended and restated bylaws prohibit the conduct of any business at a special meeting other than as specified in the notice for such meeting. These provisions may have the effect of deferring, delaying or discouraging hostile takeovers, or changes in control or management of the Company.
150
Table of Contents
Requirements for Advance Notification of Director Nominations and Stockholder Proposals
Our amended and restated bylaws establish advance notice procedures with respect to stockholder proposals and the nomination of candidates for election as directors, other than nominations made by or at the direction of the board of directors or a committee of the board of directors. In order for any matter to be “properly brought” before a meeting, a stockholder will have to comply with advance notice requirements and provide us with certain information. Generally, to be timely, a stockholder’s notice must be received at our principal executive offices not less than 90 days nor more than 120 days prior to the first anniversary date of the immediately preceding annual meeting of stockholders. Our amended and restated bylaws also specify requirements as to the form and content of a stockholder’s notice. Our amended and restated bylaws allow the chairman of the meeting at a meeting of the stockholders to adopt rules and regulations for the conduct of meetings which may have the effect of precluding the conduct of certain business at a meeting if the rules and regulations are not followed. These provisions will not apply to the Controlling Owners and their affiliates so long as the stockholders agreement remains in effect. These provisions may also defer, delay or discourage a potential acquirer from conducting a solicitation of proxies to elect the acquirer’s own slate of directors or otherwise attempting to influence or obtain control of the Company.
Stockholder Action by Written Consent
Pursuant to Section 228 of the DGCL, any action required to be taken at any annual or special meeting of the stockholders may be taken without a meeting, without prior notice and without a vote if a consent or consents in writing, setting forth the action so taken, is signed by the holders of outstanding shares of stock having not less than the minimum number of votes that would be necessary to authorize or take such action at a meeting at which all shares of our stock entitled to vote thereon were present and voted, unless our amended and restated certificate of incorporation provides otherwise. Our amended and restated certificate of incorporation will preclude stockholder action by written consent at any time when the Controlling Owners and their affiliates beneficially own, in the aggregate, less than a majority in voting power of the shares of stock of the Company entitled to vote generally in the election of directors.
Supermajority Provisions
Our amended and restated certificate of incorporation and amended and restated bylaws will provide that the board of directors is expressly authorized to make, alter, amend, change, add to, rescind or repeal, in whole or in part, our bylaws without a stockholder vote in any matter not inconsistent with the laws of the State of Delaware and our amended and restated certificate of incorporation. For as long as the Controlling Owners and their affiliates beneficially own, in the aggregate, at least a majority in voting power of the shares of stock of the Company entitled to vote generally in the election of directors, any amendment, alteration, rescission or repeal of our bylaws by our stockholders will require the affirmative vote of a majority in voting power of the outstanding shares of our stock present in person or represented by proxy at the meeting of stockholders and entitled to vote on such amendment, alteration, change, addition, rescission or repeal. At any time when the Controlling Owners and their affiliates beneficially own, in the aggregate, less than a majority in voting power of all outstanding shares of stock of the Company entitled to vote generally in the election of directors, any amendment, alteration, rescission or repeal of our bylaws by our stockholders will require the affirmative vote of the holders of at least 75% in voting power of all the then-outstanding shares of stock of the Company entitled to vote thereon, voting together as a single class.
The DGCL provides generally that the affirmative vote of a majority of the outstanding shares entitled to vote thereon, voting together as a single class, is required to amend a corporation’s certificate of incorporation, unless the certificate of incorporation requires a greater percentage.
Our amended and restated certificate of incorporation provides that at any time when the Controlling Owners and their affiliates beneficially own, in the aggregate, less than a majority in voting power of the stock of the Company entitled to vote generally in the election of directors the following provisions in our amended and
151
Table of Contents
restated certificate of incorporation may be amended, altered, repealed or rescinded only by the affirmative vote of the holders of at least 75% in voting power of all the then-outstanding shares of stock of the Company entitled to vote thereon, voting together as a single class:
| • | the provision requiring a 75% supermajority vote for stockholders to amend our amended and restated bylaws; |
| • | the provisions regarding resignation and removal of directors; |
| • | the provisions regarding competition and corporate opportunities; |
| • | the provisions regarding stockholder action by written consent; |
| • | the provisions regarding calling special meetings of stockholders; |
| • | the provisions regarding filling vacancies on our board of directors and newly created directorships; |
| • | the provisions eliminating monetary damages for breaches of fiduciary duty by a director; and |
| • | the amendment provision requiring that the above provisions be amended only with a 75% supermajority vote. |
The combination of the lack of cumulative voting and the supermajority voting requirements will make it more difficult for our existing stockholders to replace our board of directors as well as for another party to obtain control of us by replacing our board of directors. Because our board of directors has the power to retain and discharge our officers, these provisions could also make it more difficult for existing stockholders or another party to effect a change in management.
These provisions may have the effect of deterring hostile takeovers or delaying or preventing changes in control of our management or the Company, such as a merger, reorganization or tender offer. These provisions are intended to enhance the likelihood of continued stability in the composition of our board of directors and its policies and to discourage certain types of transactions that may involve an actual or threatened acquisition of the Company. These provisions are designed to reduce our vulnerability to an unsolicited acquisition proposal. The provisions are also intended to discourage certain tactics that may be used in proxy fights. However, such provisions could have the effect of discouraging others from making tender offers for our shares and, as a consequence, they also may inhibit fluctuations in the market price of our shares that could result from actual or rumored takeover attempts.
Dissenters’ Rights of Appraisal and Payment
Under the DGCL, with certain exceptions, our stockholders will have appraisal rights in connection with a merger or consolidation of us. Pursuant to the DGCL, stockholders who properly request and perfect appraisal rights in connection with such merger or consolidation will have the right to receive payment of the fair value of their shares as determined by the Delaware Court of Chancery.
Stockholders’ Derivative Actions
Under the DGCL, any of our stockholders may bring an action in our name to procure a judgment in our favor, also known as a derivative action, provided that the stockholder bringing the action is a holder of shares of our stock at the time of the transaction to which the action relates or such stockholder’s stock thereafter devolved by operation of law.
Exclusive Forum
Our amended and restated certificate of incorporation will provide that unless we consent to the selection of an alternative forum, the Court of Chancery of the State of Delaware shall be the sole and exclusive forum for any (i) derivative action or proceeding brought on behalf, to the fullest extent permitted by law, of the Company,
152
Table of Contents
(ii) action asserting a claim of breach of a fiduciary duty owed by any director or officer of the Company to the Company or the Company’s stockholders, creditors or other constituents, (iii) action asserting a claim against the Company or any director or officer of the Company arising pursuant to any provision of the DGCL or our amended and restated certificate of incorporation or our amended and restated bylaws, or (iv) action asserting a claim against the Company or any director or officer of the Company governed by the internal affairs doctrine, in each such case subject to said Court of Chancery having personal jurisdiction over the indispensable parties named as defendants therein. Any person or entity purchasing or otherwise acquiring any interest in shares of capital stock of the Company shall be deemed to have notice of and consented to the forum provisions in our amended and restated certificate of incorporation. However, the enforceability of similar forum provisions in other companies’ certificates of incorporation has been challenged in legal proceedings, and it is possible that a court could find these types of provisions to be unenforceable.
Conflicts of Interest
Delaware law permits corporations to adopt provisions renouncing any interest or expectancy in certain opportunities that are presented to the corporation or its officers, directors or stockholders. Our amended and restated certificate of incorporation will, to the maximum extent permitted from time to time by Delaware law, renounce any interest or expectancy that we have in, or right to be offered an opportunity to participate in, specified business opportunities that are from time to time presented to our officers, directors or stockholders or their respective affiliates, other than those officers, directors, stockholders or affiliates who are our or our subsidiaries’ employees. Our amended and restated certificate of incorporation will provide that, to the fullest extent permitted by law, none of the Controlling Owners or any of their affiliates or any director who is not employed by us (including any non-employee director who serves as one of our officers in both his director and officer capacities) or his or her affiliates will have any duty to refrain from (i) engaging in a corporate opportunity in the same or similar lines of business in which we or our affiliates now engage or propose to engage or (ii) otherwise competing with us or our affiliates. In addition, to the fullest extent permitted by law, in the event that the Controlling Owners or any non-employee director acquires knowledge of a potential transaction or other business opportunity which may be a corporate opportunity for itself or himself or its or his affiliates or for us or our affiliates, such person will have no duty to communicate or offer such transaction or business opportunity to us or any of our affiliates and they may take any such opportunity for themselves or offer it to another person or entity. Our amended and restated certificate of incorporation will not renounce our interest in any business opportunity that is expressly offered to a non-employee director solely in his or her capacity as a director or officer of the Company. To the fullest extent permitted by law, no business opportunity will be deemed to be a potential corporate opportunity for us unless we would be permitted, to undertake the opportunity under our amended and restated certificate of incorporation, we have sufficient financial resources to undertake the opportunity and the opportunity would be in line with our business.
Limitations on Liability and Indemnification of Officers and Directors
The DGCL authorizes corporations to limit or eliminate the personal liability of directors to corporations and their stockholders for monetary damages for breaches of directors’ fiduciary duties, subject to certain exceptions. Our amended and restated certificate of incorporation includes a provision that eliminates the personal liability of directors for monetary damages for any breach of fiduciary duty as a director, except to the extent such exemption from liability or limitation thereof is not permitted under the DGCL. The effect of these provisions is to eliminate the rights of us and our stockholders, through stockholders’ derivative suits on our behalf, to recover monetary damages from a director for breach of fiduciary duty as a director, including breaches resulting from grossly negligent behavior. However, exculpation does not apply to any director if the director has acted in bad faith, knowingly or intentionally violated the law, authorized illegal dividends or redemptions or derived an improper benefit from his or her actions as a director.
Our amended and restated bylaws provide that we must indemnify and advance expenses to our directors and officers to the fullest extent authorized by the DGCL. We also are expressly authorized to carry directors’
153
Table of Contents
and officers’ liability insurance providing indemnification for our directors, officers and certain employees for some liabilities. We believe that these indemnification and advancement provisions and insurance are useful to attract and retain qualified directors and executive officers.
The limitation of liability, indemnification and advancement provisions in our amended and restated certificate of incorporation and amended and restated bylaws may discourage stockholders from bringing a lawsuit against directors for breach of their fiduciary duty. These provisions also may have the effect of reducing the likelihood of derivative litigation against directors and officers, even though such an action, if successful, might otherwise benefit us and our stockholders. In addition, your investment may be adversely affected to the extent we pay the costs of settlement and damage awards against directors and officers pursuant to these indemnification provisions.
We currently are party to indemnification agreements with certain of our directors and officers. These agreements require us to indemnify these individuals to the fullest extent permitted under Delaware law against liabilities that may arise by reason of their service to us, and to advance expenses incurred as a result of any proceeding against them as to which they could be indemnified.
There is currently no pending material litigation or proceeding involving any of our directors or officers for which indemnification is sought.
Transfer Agent and Registrar
The transfer agent and registrar for shares of our common stock is .
Listing
We intend to list shares of our common stock on the NYSE under the symbol “ .”
154
Table of Contents
SHARES ELIGIBLE FOR FUTURE SALE
Prior to this offering, there has not been a public market for our common stock, and we cannot predict what effect, if any, market sales of shares of our common stock or the availability of shares of our common stock for sale will have on the market price of our common stock prevailing from time to time. Nevertheless, sales of substantial amounts of common stock, including shares issued upon the exercise of outstanding options or restricted stock units, in the public market, or the perception that such sales could occur, could materially and adversely affect the market price of our common stock and could impair our future ability to raise capital through the sale of our equity or equity-related securities at a time and price that we deem appropriate.
Upon the closing of this offering, we will have outstanding an aggregate of approximately shares of common stock ( shares of common stock if the underwriters exercise their option to purchase additional shares). In addition, options to purchase an aggregate of approximately shares of our common stock will be outstanding as of the closing of this offering. Of the outstanding shares, the shares sold in this offering will be freely tradable without restriction or further registration under the Securities Act, except that any shares held by our affiliates, as that term is defined under Rule 144 of the Securities Act, may be sold only in compliance with the limitations described below. The remaining outstanding shares of our common stock will be deemed restricted securities, as defined under Rule 144. Restricted securities may be sold in the public market only if registered or if they qualify for an exemption from registration under Rule 144 under the Securities Act, which we summarize below.
The restricted shares and the shares held by our affiliates will be available for sale in the public market as follows:
| • | shares will be eligible for sale at various times after the date of this prospectus pursuant to Rule 144; and |
| • | shares subject to the lock-up agreements will be eligible for sale at various times beginning 180 days after the date of this prospectus pursuant to Rule 144. |
Rule 144
In general, under Rule 144, as currently in effect, a person (or persons whose shares are aggregated) who is not deemed to be or have been one of our affiliates for purposes of the Securities Act at any time during 90 days preceding a sale and who has beneficially owned the shares proposed to be sold for at least six months, including the holding period of any prior owner other than an affiliate, is entitled to sell such shares without registration, subject to compliance with the public information requirements of Rule 144. If such a person has beneficially owned the shares proposed to be sold for at least one year, including the holding period of a prior owner other than an affiliate, then such person is entitled to sell such shares without complying with any of the requirements of Rule 144.
In general, under Rule 144, as currently in effect, our affiliates or persons selling shares on behalf of our affiliates, who have met the six month holding period for beneficial ownership of “restricted shares” of our common stock, are entitled to sell within any three-month period, a number of shares that does not exceed the greater of:
| • | 1% of the number of shares of our common stock then outstanding, which will equal approximately shares immediately after this offering; or |
| • | the average reported weekly trading volume of our common stock on the NYSE during the four calendar weeks preceding the filing of a notice on Form 144 with respect to such sale. |
Sales under Rule 144 by our affiliates or persons selling shares on behalf of our affiliates are also subject to certain manner of sale provisions and notice requirements and to the availability of current public information about us. The sale of these shares, or the perception that sales will be made, could adversely affect the price of our common stock after this offering because a great supply of shares would be, or would be perceived to be, available for sale in the public market.
155
Table of Contents
Rule 701
In general and subject to certain vesting restrictions and the expiration of the applicable lock-up restrictions, under Rule 701 promulgated under the Securities Act, any of our employees, directors or officers who purchased shares from us in connection with a qualified compensatory stock or option plan or other written agreement before the effective date of this offering, or who purchased shares from us after that date upon the exercise of options granted before that date, are eligible to resell such shares in reliance upon Rule 144 subject to the availability of current public information about us. If such person is not an affiliate, the sale may be made under Rule 144 without compliance with the holding periods of Rule 144 and subject only to the manner-of-sale restrictions of Rule 144. If such a person is an affiliate, the sale may be made under Rule 144 without compliance with its one-year minimum holding period, but subject to the other Rule 144 restrictions.
Lock-Up Agreements
In connection with this offering, we and the selling stockholders, our executive officers and directors and certain principal holders of outstanding shares of our common stock and common stock equivalents have agreed, subject to certain exceptions, not to sell, dispose of or hedge any shares of our common stock or securities convertible into or exchangeable for shares of our common stock, during the period ending 180 days after the date of this prospectus, except with the prior written consent of , except in limited circumstances. This agreement does not apply to any existing employee benefit plans.
The 180-day restricted period described in the preceding paragraph will be automatically extended if:
| • | during the last 17 days of the 180-day restricted period we issue an earnings release or announces material news or a material event; or |
| • | prior to the expiration of the 180-day restricted period, we announce that we will release earnings results during the 15-day period following the last day of the 180-day period, |
in which case the restrictions described in this paragraph will continue to apply until the expiration of the 18-day period beginning on the issuance of the earnings release or the announcement of the material news or material event. See “Underwriting.”
In addition, following completion of this offering, certain shares held by officers and other employees of the company will be subject to restrictions on transfer pursuant to our Stockholder’s Agreement for a period of up to four years.
Registration on Form S-8
Following completion of this offering, we intend to file one or more registration statements on Form S-8 under the Securities Act to register shares of our common stock issuable under our stock incentive plans. As a result, shares of our common stock issued pursuant to such stock incentive plans, including upon exercise of stock options and vesting of restricted stock units, will be eligible for resale in the public market without restriction, subject to the Rule 144 limitations applicable to affiliates and the lock-up agreements described above.
Registration Rights
Pursuant to the Registration Rights Agreement, certain existing stockholders are entitled to participate in certain offerings of the Company’s securities registered under the Securities Act which are initiated by the Company, the Sponsors or Mr. Neubauer, subject to certain exceptions. This agreement provides to the Sponsors an unlimited number of “demand” registrations and customary “piggy back” registration rights and provides to Mr. Neubauer two “demand” registrations and customary “piggy back” registration rights. In addition, all
156
Table of Contents
stockholders party to the agreement are entitled to “piggy back” registration rights in an initial public offering to the extent any such stockholder is permitted by the Company to participate in the offering and the Sponsors, Mr. Neubauer and certain members of senior management are entitled to “piggy back” registration rights in subsequent offerings. Pursuant to our Registration Rights Agreement, stockholders who hold more than 20% of our then-outstanding shares, or Mr. Neubauer, have the right to require us to file a registration statement with the SEC for the resale of our common stock at any time after the consummation of an initial public offering. The Registration Rights Agreement also provides that we will pay certain expenses of these stockholders relating to such registrations and indemnify them against certain liabilities which may arise under the Securities Act of 1933, as amended. The shares subject to the Registration Rights Agreement will represent approximately % of our outstanding common stock after this offering, or % if the underwriters exercise their option to purchase additional shares in full. These shares also may be sold under Rule 144 under the Securities Act, depending on their holding period and subject to restrictions in the case of shares held by persons deemed to be our affiliates.
157
Table of Contents
CERTAIN UNITED STATES FEDERAL INCOME AND ESTATE TAX CONSIDERATIONS FOR NON-U.S. HOLDERS
The following is a summary of certain United States federal income and estate tax consequences, as of the date hereof, to a non-U.S. holder (as defined below) of the purchase, ownership and disposition of shares of our common stock. This summary deals only with shares of common stock that are held as a capital asset.
Except as modified for estate tax purposes (as discussed below), “non-U.S. holder” means a beneficial owner of shares that, for United States federal income tax purposes, is an individual, corporation, estate or trust other than:
| • | an individual who is a citizen or resident of the United States; |
| • | a corporation created or organized under the laws of the United States, any state thereof or the District of Columbia; |
| • | an estate the income of which is subject to United States federal income taxation regardless of its source; or |
| • | a trust if it (1) is subject to the primary supervision of a court within the United States and one or more United States persons have the authority to control all substantial decisions of the trust or (2) has a valid election in effect under applicable United States Treasury regulations to be treated as a United States person. |
If an entity treated as a partnership for United States federal income tax purposes holds shares of our common stock, the tax treatment of a partner will generally depend upon the status of the partner and the activities of the partnership. If you are a partner of a partnership considering an investment in shares of our common stock, you should consult your own tax advisors.
This summary is based upon provisions of the Internal Revenue Code of 1986, as amended (the “Code”), and regulations, rulings and judicial decisions as of the date hereof. Those authorities may be changed or subject to different interpretations, perhaps retroactively, so as to result in United States federal income and estate tax consequences different from those summarized below. We cannot assure you that a change in law will not alter significantly the tax considerations that we describe in this summary.
This summary does not address all aspects of United States federal income and estate taxes and does not address the effects of any other United States federal tax laws (including gift tax or the recently enacted Medicare tax on certain investment income) or any foreign, state, local or other tax laws that may be relevant to non-U.S. holders in light of their particular circumstances. In addition, it does not represent a detailed description of the United States federal income or estate tax consequences applicable to you if you are subject to special treatment under the United States federal income tax laws (including if you are a United States expatriate, “controlled foreign corporation,” “passive foreign investment company” or a partnership or other pass-through entity for United States federal income tax purposes (or an investor in such an entity)).
If you are considering the purchase of shares our common stock, you should consult your own tax advisors concerning the particular United States federal income and estate tax consequences to you of the purchase, ownership and disposition of the shares of common stock, as well as the consequences to you arising under other United States federal tax laws and the laws of any other taxing jurisdiction.
Dividends
Subject to the discussions of backup withholding and additional withholding requirements below, dividends paid to a non-U.S. holder of shares of our common stock generally will be subject to withholding of United States federal income tax at a 30% rate or such lower rate as may be specified by an applicable income tax treaty. However, dividends that are effectively connected with the conduct of a trade or business by the non-U.S. holder within the United States are generally not subject to the withholding tax, provided certain certification and
158
Table of Contents
disclosure requirements are satisfied. Instead, such dividends are subject to United States federal income tax on a net income basis in generally the same manner as if the non-U.S. holder were a United States person as defined under the Code, unless an applicable income tax treaty provides otherwise. In addition, a foreign corporation may be subject to a “branch profits tax” at a 30% rate (or such lower rate as may be specified by an applicable income tax treaty) on its effectively connected earnings and profits, subject to adjustments.
A non-U.S. holder of shares of our common stock who wishes to claim the benefit of an applicable treaty rate and avoid backup withholding, as discussed below, for dividends will be required (a) to complete Internal Revenue Service Form W-8BEN (or other applicable form) and certify under penalty of perjury that such holder is not a United States person as defined under the Code and is eligible for treaty benefits or (b) if the shares of our common stock are held through certain foreign intermediaries, to satisfy the relevant certification requirements of applicable United States Treasury regulations. Special certification and other requirements apply to certain non-U.S. holders that are pass-through entities rather than corporations or individuals.
A non-U.S. holder of shares of our common stock eligible for a reduced rate of United States withholding tax pursuant to an income tax treaty may obtain a refund of any excess amounts withheld by timely filing an appropriate claim for refund with the Internal Revenue Service.
Gain on Disposition of Common Stock
Subject to the discussions of backup withholding and additional withholding requirements below, any gain recognized on a disposition of shares of our common stock generally will not be subject to United States federal income tax unless:
| • | the gain is effectively connected with a trade or business of the non-U.S. holder in the United States; |
| • | the non-U.S. holder is an individual who is present in the United States for 183 days or more in the taxable year of such disposition, and certain other conditions are met; or |
| • | we are or have been a “United States real property holding corporation” for United States federal income tax purposes. |
A non-U.S. holder described in the first bullet point immediately above will be subject to tax on the net gain derived from the disposition on a net income basis in generally the same manner as a United States person, unless an applicable income tax treaty provides otherwise. If a non-U.S. holder that is a foreign corporation falls under the first bullet point immediately above, it may also be subject to a branch profits tax equal to 30% of its effectively connected earnings and profits (subject to adjustments) or such lower rate as may be specified by an applicable income tax treaty.
Unless an applicable income tax treaty provides otherwise, an individual non-U.S. holder described in the second bullet point immediately above will be subject to a flat 30% tax on the gain derived from the disposition, which may be offset by United States source capital losses, even though the individual is not considered a resident of the United States.
We believe we are not and do not anticipate becoming a “United States real property holding corporation” for United States federal income tax purposes. However, even if we are or were to become a United States real property holding corporation, so long as our common stock remains regularly traded on an established securities market for United States federal income tax purposes, any gain recognized by a non-U.S. holder that is not subject to tax under either of the first two bullet points would generally be subject to United States federal income tax only if such non-U.S. holder actually or constructively owned more than five percent of our outstanding common stock at some time during the shorter of such non-U.S. holder’s holding period and the five year period ending on the date of such disposition.
159
Table of Contents
Federal Estate Tax
Shares of common stock held (or deemed held) at the time of death by an individual non-U.S. holder who is neither a citizen or resident of the United States (as specifically defined for United States estate tax purposes) will be included in such holder’s gross estate for United States federal estate tax purposes, unless an applicable estate tax treaty provides otherwise.
Information Reporting and Backup Withholding
We must report annually to the Internal Revenue Service and to each non-U.S. holder the amount of dividends paid to such holder and the tax withheld with respect to such dividends, regardless of whether withholding was required. Copies of the information returns reporting such dividends and withholding may also be made available to the tax authorities in the country in which the non-U.S. holder resides under the provisions of an applicable income tax treaty.
A non-U.S. holder will be subject to backup withholding with respect to dividends paid to such holder unless such holder certifies under penalty of perjury that it is a non-U.S. holder (and the payor does not have actual knowledge or reason to know that such holder is a United States person as defined under the Code), or such holder otherwise establishes an exemption.
Information reporting and, depending on the circumstances, backup withholding will apply to the proceeds of a disposition of our common stock within the United States or conducted through certain United States-related financial intermediaries, unless the beneficial owner certifies under penalty of perjury that it is a non-U.S. holder (and the payor does not have actual knowledge or reason to know that the beneficial owner is a United States person as defined under the Code), or such owner otherwise establishes an exemption.
Backup withholding is not an additional tax. Any amounts withheld under the backup withholding rules may be allowed as a refund or a credit against a non-U.S. holder’s United States federal income tax liability provided the required information is timely furnished to the Internal Revenue Service.
Additional Withholding Requirements
Under legislation enacted in 2010 and administrative guidance as modified by intergovernmental agreements entered between the United States and certain foreign jurisdictions (“IGAs”), a new 30% United States federal withholding tax may apply to any dividends paid after June 30, 2014, and the gross proceeds from a disposition of shares of our common stock occurring after December 31, 2016, in each case paid to (i) a “foreign financial institution” (as specifically defined in the legislation or an applicable IGA, if any), whether such foreign financial institution is the beneficial owner or an intermediary, unless such foreign financial institution agrees to verify, report and disclose its United States “account” holders (as specifically defined in the legislation or an applicable IGA, if any) and meets certain other specified requirements or (ii) a non-financial foreign entity, whether such non-financial foreign entity is the beneficial owner or an intermediary, unless such entity provides a certification that the beneficial owner of the payment does not have any substantial United States owners or provides the name, address and taxpayer identification number of each such substantial United States owner and certain other specified requirements are met. In certain cases, the relevant foreign financial institution or non-financial foreign entity may qualify for an exemption from, or be deemed to be in compliance with, these requirements. You should consult your own tax advisor regarding this legislation, administrative guidance, and IGAs and whether they may be relevant to your ownership and disposition of shares of our common stock.
160
Table of Contents
UNDERWRITING (CONFLICTS OF INTEREST)
We, the selling stockholders and the underwriters named below have entered into an underwriting agreement with respect to the shares being offered. Subject to certain conditions, each underwriter has severally agreed to purchase the number of shares indicated in the following table. are the representatives of the underwriters.
| Underwriters |
Number of Shares | |
| Goldman, Sachs & Co. |
||
| J.P. Morgan Securities LLC |
||
| Credit Suisse Securities (USA) LLC |
||
| Morgan Stanley & Co. LLC |
||
| Barclays Capital Inc. |
||
| Merrill Lynch, Pierce, Fenner & Smith Incorporated |
||
| RBC Capital Markets LLC |
||
| Wells Fargo Securities, LLC |
||
| Robert W. Baird & Co. Incorporated |
||
| PNC Capital Markets LLC |
||
| Rabo Securities USA, Inc. |
||
| Samuel A. Ramirez & Company, Inc. |
||
| Santander Investment Securities Inc. |
||
| SMBC Nikko Securities America, Inc. |
||
| The Williams Capital Group, L.P. |
||
| Total |
The underwriters are committed to take and pay for all of the shares being offered, if any are taken, other than the shares covered by the option described below unless and until this option is exercised.
The underwriters have an option to buy up to an additional shares from us and the selling stockholders to cover sales by the underwriters of a greater number of shares than the total number set forth in the table above. They may exercise that option for 30 days. If any shares are purchased pursuant to this option, the underwriters will severally purchase shares in approximately the same proportion as set forth in the table above.
The following tables show the per share and total underwriting discounts and commissions to be paid to the underwriters by us and the selling stockholders. Such amounts are shown assuming both no exercise and full exercise of the underwriters’ option to purchase additional shares.
Paid by Us
| No Exercise | Full Exercise | |||||||
| Per Share |
$ | $ | ||||||
| Total |
$ | $ | ||||||
Paid by the Selling Stockholders
| No Exercise | Full Exercise | |||||||
| Per Share |
$ | $ | ||||||
| Total |
$ | $ | ||||||
Shares sold by the underwriters to the public will initially be offered at the initial public offering price set forth on the cover of this prospectus. Any shares sold by the underwriters to securities dealers may be sold at a discount of up to $ per share from the initial public offering price. After the initial offering of the shares, the
161
Table of Contents
representatives may change the offering price and the other selling terms. The offering of the shares by the underwriters is subject to receipt and acceptance and subject to the underwriters’ right to reject any order in whole or in part.
We and our officers, directors, and holders of substantially all of our common stock, including the selling stockholders, have agreed with the underwriters, subject to certain exceptions, not to dispose of or hedge any of their common stock or securities convertible into or exchangeable for shares of common stock during the period from the date of this prospectus continuing through the date 180 days after the date of this prospectus, except with the prior written consent of . See “Shares Eligible for Future Sale” for a discussion of certain transfer restrictions.
The 180-day restricted period described in the preceding paragraph will be automatically extended if: (1) during the last 17 days of the 180-day restricted period, we issue an earnings release or announce material news or a material event; or (2) prior to the expiration of the 180-day restricted period, we announce that we will release earnings results during the 15-day period following the last day of the 180-day period, in which case the restrictions described in the preceding paragraph will continue to apply until the expiration of the 18-day period beginning on the issuance of the earnings release of the announcement of the material news or material event.
Prior to the offering, there has been no public market for the shares. The initial public offering price has been negotiated among us and the representatives. Among the factors to be considered in determining the initial public offering price of the shares, in addition to prevailing market conditions, will be our historical performance, estimates of our business potential and earnings prospects, an assessment of our management and the consideration of the above factors in relation to market valuation of companies in related businesses.
We intend to apply for listing of our common stock on the NYSE under the symbol “ .” In order to meet one of the requirements for listing the common stock on the NYSE, the underwriters have undertaken to sell lots of 100 or more shares to a minimum of 400 beneficial owners.
In connection with the offering, the underwriters may purchase and sell shares of common stock in the open market. These transactions may include short sales, stabilizing transactions and purchases to cover positions created by short sales. Short sales involve the sale by the underwriters of a greater number of shares than they are required to purchase in the offering, and a short position represents the amount of such sales that have not been covered by subsequent purchases. A “covered short position” is a short position that is not greater than the amount of additional shares for which the underwriters’ option described above may be exercised. The underwriters may cover any covered short position by either exercising their option to purchase additional shares or purchasing shares in the open market. In determining the source of shares to cover the covered short position, the underwriters will consider, among other things, the price of shares available for purchase in the open market as compared to the price at which they may purchase additional shares pursuant to the option described above. “Naked” short sales are any short sales that create a short position greater than the amount of additional shares for which the option described above may be exercised. The underwriters must cover any such naked short position by purchasing shares in the open market. A naked short position is more likely to be created if the underwriters are concerned that there may be downward pressure on the price of the common stock in the open market after pricing that could adversely affect investors who purchase in the offering. Stabilizing transactions consist of various bids for or purchases of common stock made by the underwriters in the open market prior to the completion of the offering.
The underwriters may also impose a penalty bid. This occurs when a particular underwriter repays to the underwriters a portion of the underwriting discount received by it because the representatives have repurchased shares sold by or for the account of such underwriter in stabilizing or short covering transactions.
Purchases to cover a short position and stabilizing transactions, as well as other purchases by the underwriters for their own accounts, may have the effect of preventing or retarding a decline in the market price of our stock, and together with the imposition of the penalty bid, may stabilize, maintain or otherwise affect the
162
Table of Contents
market price of the common stock. As a result, the price of the common stock may be higher than the price that otherwise might exist in the open market. The underwriters are not required to engage in these activities and may end any of these activities at any time. These transactions may be effected on the NYSE, in the over-the-counter market or otherwise.
In relation to each Member State of the European Economic Area which has implemented the Prospectus Directive (each, a “Relevant Member State”), with effect from and including the date on which the Prospectus Directive is implemented in that Relevant Member State, no offer of shares may be made to the public in that Relevant Member State other than:
| (a) | to any legal entity which is a qualified investor as defined in the Prospectus Directive; |
| (b) | to fewer than 100, or, if the Relevant Member State has implemented the relevant portion of the 2010 PD Amending Directive, 150 natural or legal persons (other than qualified investors as defined in the Prospectus Directive), as permitted under the Prospectus Directive, subject to obtaining the prior consent of the representative; |
| (c) | in any other circumstances falling within Article 3(2) of the Prospectus Directive, provided that no such offer of shares shall require the Company or the representatives to publish a prospectus pursuant to Article 3 of the Prospectus Directive or supplement a prospectus pursuant to Article 16 of the Prospectus Directive. |
For the purposes of this provision, the expression an “offer of shares to the public” in relation to any shares in any Relevant Member State means the communication in any form and by any means of sufficient information on the terms of the offer and the shares to be offered so as to enable an investor to decide to purchase or subscribe the shares, as the same may be varied in that Relevant Member State by any measure implementing the Prospectus Directive in that Relevant Member State and the expression Prospectus Directive means Directive 2003/71/EC (including the 2010 PD Amending Directive, to the extent implemented in the Relevant Member State) and includes any relevant implementing measure in each Relevant Member State and the expression “2010 PD Amending Directive” means Directive 2010/73/EU.
Each underwriter has represented and agreed that:
| (a) | it has only communicated or caused to be communicated and will only communicate or cause to be communicated an invitation or inducement to engage in investment activity (within the meaning of Section 21 of the FSMA) received by it in connection with the issue or sale of the shares in circumstances in which Section 21(1) of the FSMA does not apply to the Company; and |
| (b) | it has complied and will comply with all applicable provisions of the FSMA with respect to anything done by it in relation to the shares in, from or otherwise involving the United Kingdom. |
The shares may not be offered or sold by means of any document other than (i) in circumstances which do not constitute an offer to the public within the meaning of the Companies Ordinance (Cap.32, Laws of Hong Kong), or (ii) to “professional investors” within the meaning of the Securities and Futures Ordinance (Cap.571, Laws of Hong Kong) and any rules made thereunder, or (iii) in other circumstances which do not result in the document being a “prospectus” within the meaning of the Companies Ordinance (Cap.32, Laws of Hong Kong), and no advertisement, invitation or document relating to the shares may be issued or may be in the possession of any person for the purpose of issue (in each case whether in Hong Kong or elsewhere), which is directed at, or the contents of which are likely to be accessed or read by, the public in Hong Kong (except if permitted to do so under the laws of Hong Kong) other than with respect to shares which are or are intended to be disposed of only to persons outside Hong Kong or only to “professional investors” within the meaning of the Securities and Futures Ordinance (Cap. 571, Laws of Hong Kong) and any rules made thereunder.
This prospectus has not been registered as a prospectus with the Monetary Authority of Singapore. Accordingly, this prospectus and any other document or material in connection with the offer or sale, or
163
Table of Contents
invitation for subscription or purchase, of the shares may not be circulated or distributed, nor may the shares be offered or sold, or be made the subject of an invitation for subscription or purchase, whether directly or indirectly, to persons in Singapore other than (i) to an institutional investor under Section 274 of the Securities and Futures Act, Chapter 289 of Singapore (the “SFA”), (ii) to a relevant person, or any person pursuant to Section 275(1A), and in accordance with the conditions, specified in Section 275 of the SFA or (iii) otherwise pursuant to, and in accordance with the conditions of, any other applicable provision of the SFA.
Where the shares are subscribed or purchased under Section 275 by a relevant person which is: (a) a corporation (which is not an accredited investor) the sole business of which is to hold investments and the entire share capital of which is owned by one or more individuals, each of whom is an accredited investor; or (b) a trust (where the trustee is not an accredited investor) whose sole purpose is to hold investments and each beneficiary is an accredited investor, shares, debentures and units of shares and debentures of that corporation or the beneficiaries’ rights and interest in that trust shall not be transferable for six months after that corporation or that trust has acquired the shares under Section 275 except: (1) to an institutional investor under Section 274 of the SFA or to a relevant person, or any person pursuant to Section 275(1A), and in accordance with the conditions, specified in Section 275 of the SFA; (2) where no consideration is given for the transfer; or (3) by operation of law.
The securities have not been and will not be registered under the Financial Instruments and Exchange Law of Japan (the Financial Instruments and Exchange Law) and each underwriter has agreed that it will not offer or sell any securities, directly or indirectly, in Japan or to, or for the benefit of, any resident of Japan (which term as used herein means any person resident in Japan, including any corporation or other entity organized under the laws of Japan), or to others for re-offering or resale, directly or indirectly, in Japan or to a resident of Japan, except pursuant to an exemption from the registration requirements of, and otherwise in compliance with, the Financial Instruments and Exchange Law and any other applicable laws, regulations and ministerial guidelines of Japan.
The underwriters do not expect sales to discretionary accounts to exceed five percent of the total number of shares offered.
We and the selling stockholders estimate that the total expenses of the offering, excluding underwriting discounts and commissions, will be approximately $ million and are payable by us. We have also agreed to reimburse the underwriters for certain of their expenses in an amount up to $ as set forth in the underwriting agreement.
We and the selling stockholders have agreed to indemnify the several underwriters against certain liabilities, including liabilities under the Securities Act.
Conflicts of Interest
Goldman, Sachs & Co. and J.P. Morgan Securities LLC and/or their respective affiliates each own in excess of 10% of our issued and outstanding common stock and it is expected that, by selling shares of common stock in this offering, they will collectively receive more than 5% of the net proceeds of the offering, not including underwriting compensation and as a result are deemed to have a “conflict of interest” with us within the meaning of Rule 5121 of the Financial Industry Regulatory Authority (“Rule 5121”). Therefore, this offering will be conducted in accordance with Rule 5121, which requires that Goldman, Sachs & Co. and J.P. Morgan Securities LLC will not make sales to discretionary accounts without the prior written consent of the account holder and that a qualified independent underwriter (“QIU”) as defined in Rule 5121 participate in the preparation of the registration statement of which this prospectus forms a part and perform its usual standard of due diligence with respect thereto and has agreed to act as QIU for this offering. We have agreed to indemnify against certain liabilities incurred in connection with acting as QIU for this offering, including liabilities under the Securities Act or contribute to payments that the underwriters may be required to make in that respect.
164
Table of Contents
Certain of the underwriters or their affiliates are lenders or have committed to lend under our senior secured credit facility due July 26, 2016. As described under “Use of Proceeds,” the Company intends to repay outstanding amounts under such senior secured credit facility using a portion of the net proceeds of this offering received by the Company and will pay such amounts to the underwriters or their respective affiliates in proportion to their respective current commitments thereunder.
Other Relationships
The underwriters and their respective affiliates are full service financial institutions engaged in various activities, which may include sales and trading, commercial and investment banking, advisory, investment management, investment research, principal investment, hedging, market making, brokerage and other financial and non-financial activities and services. Certain of the underwriters and their respective affiliates have provided, and may in the future provide, a variety of these services to us and to persons and entities with relationships with us, for which they received or will receive customary fees and expenses.
J.P. Morgan Securities LLC and Goldman, Sachs & Co., each of which is an underwriter of this offering, acted as an initial purchaser in the offering of $1,000 million aggregate principal amount of 5.75% Senior Notes due 2020 by ARAMARK Corporation in March 2013.
In addition, in the ordinary course of their various business activities, the underwriters and their respective affiliates, officers, directors and employees may purchase, sell or hold a broad array of investments and actively trade securities, derivatives, loans, commodities, currencies, credit default swaps and other financial instruments for their own account and for the accounts of their customers, and such investment and trading activities may involve or relate to assets, securities and/or instruments of ours (directly, as collateral securing other obligations or otherwise) and/or persons and entities with relationships with us. The underwriters and their respective affiliates may also communicate independent investment recommendations, market color or trading ideas and/or publish or express independent research views in respect of such assets, securities or instruments and may at any time hold, or recommend to clients that they should acquire, long and/or short positions in such assets, securities and instruments.
Solebury Consulting Relationship
Pursuant to an engagement agreement, we engaged Solebury Capital LLC (“Solebury”), a FINRA member, to provide certain financial consulting services (which do not include underwriting services) in connection with this offering. We agreed to pay Solebury, only upon successful completion of this offering, a fee of $ . We also agreed to reimburse Solebury for reasonable and documented out-of-pocket expenses up to a maximum of $ and have provided indemnification of Solebury pursuant to the engagement agreement.
Solebury’s services include advice with respect to selection of underwriters for this offering, deal structure, fees and economics, modeling metrics and presentations and investor marketing. Solebury is not acting as an underwriter and has no contact with any public or institutional investor on behalf of us or the underwriters. In addition, Solebury will not underwrite or purchase any of our common stock in this offering or otherwise participate in any such undertaking.
165
Table of Contents
Certain legal matters in connection with the offering will be passed upon for us and the selling stockholders by Simpson Thacher & Bartlett LLP, New York, New York. Certain matters in connection with the offering will be passed upon for the underwriters by Cahill Gordon & Reindel LLP, New York, New York.
The consolidated financial statements and financial statement schedule of ARAMARK Holdings Corporation and subsidiaries as of September 28, 2012 and September 30, 2011, and for each of the years in the three-year period ended September 28, 2012 have been included herein and in the registration statement in reliance upon the report of KPMG LLP, independent registered public accounting firm, appearing elsewhere herein, and upon the authority of said firm as experts in accounting and auditing. The report covering the consolidated financial statements as of September 28, 2012 and September 30, 2011 and for the three-year period ended September 28, 2012 refers to a change in the Company’s method of accounting for its trade receivables securitization agreement as of October 2, 2010.
The consolidated financial statements of AIM SERVICES Co., Ltd. and subsidiaries as of March 31, 2013 and March 31, 2012 and for each of the three years in the period ended March 31, 2013 included in this Prospectus have been audited by Deloitte Touche Tohmatsu LLC, independent auditors, as stated in their report (which report expresses an unqualified opinion and includes explanatory paragraphs relating to (1) that accounting principles generally accepted in Japan vary in certain significant respects from accounting principles generally accepted in the United States of America as discussed in Note 14 to the consolidated financial statements and (2) that the audits also comprehended the translation of Japanese yen amounts into U.S. dollar amounts and such translation has been made in conformity with the basis stated in Note 1 to the consolidated financial statements) appearing herein and are included in reliance upon the report of such firm given upon their authority as experts in accounting and auditing.
WHERE YOU CAN FIND MORE INFORMATION
We have filed with the Securities and Exchange Commission a registration statement on Form S-1 under the Securities Act with respect to the shares of common stock offered in this prospectus. This prospectus is a part of the registration statement and does not contain all of the information set forth in the registration statement. For further information about us and shares of our common stock, you should refer to the registration statement. This prospectus summarizes material provisions of contracts and other documents to which we refer you. Since the prospectus may not contain all of the information that you may find important, you should review the full text of these contracts and other documents. We have included or incorporated by reference copies of these documents as exhibits to our registration statement.
We will file annual, quarterly and special reports and other information with the SEC. Our filings with the SEC will be available to the public on the SEC’s website at http://www.sec.gov. Those filings will also be available to the public on, or accessible through our corporate web site at http://www.aramark.com. The information contained on our corporate web site or any other web site that we may maintain is not part of this prospectus, any prospectus supplement or the registration statement of which this prospectus is a part. You may also read and copy, at SEC prescribed rates, any document we file with the SEC, including the registration statement (and its exhibits) of which this prospectus is a part, at the SEC’s Public Reference Room located at 100 F Street, N.E., Washington D.C. 20549. You can call the SEC at 1-800-SEC-0330 to obtain information on the operation of the Public Reference Room.
166
Table of Contents
INDEX TO CONSOLIDATED FINANCIAL STATEMENTS
| Page | ||||
| Audited Consolidated Financial Statements and Schedule of ARAMARK Holdings Corporation |
||||
| F-2 | ||||
| Consolidated Balance Sheets as of September 28, 2012 and September 30, 2011 |
F-3 | |||
| F-4 | ||||
| F-5 | ||||
| F-6 | ||||
| F-8 | ||||
| F-46 | ||||
| Unaudited Condensed Consolidated Financial Statements of ARAMARK Holdings Corporation |
||||
| Condensed Consolidated Balance Sheets (Unaudited) as of June 28, 2013 and September 28, 2012 |
F-47 | |||
| F-48 | ||||
| F-50 | ||||
| F-51 | ||||
| F-52 | ||||
| Notes to Condensed Consolidated Financial Statements (Unaudited) |
F-54 | |||
| Audited Financial Statements of AIM Services Co., Ltd. |
||||
| F-73 | ||||
| F-75 | ||||
| Consolidated Statements of Income—Years Ended March 31, 2013, 2012 and 2011 |
F-77 | |||
| Consolidated Statements of Comprehensive Income—Years Ended March 31, 2013, 2012 and 2011 |
F-78 | |||
| Consolidated Statements of Changes in Equity—Years Ended March 31, 2013, 2012 and 2011 |
F-79 | |||
| Consolidated Statements of Cash Flows—Years Ended March 31, 2013, 2012 and 2011 |
F-80 | |||
| F-83 | ||||
F-1
Table of Contents
Report of Independent Registered Public Accounting Firm
The Board of Directors and Stockholders
ARAMARK Holdings Corporation:
We have audited the accompanying consolidated balance sheets of ARAMARK Holdings Corporation and subsidiaries (the Company) as of September 28, 2012 and September 30, 2011, and the related consolidated statements of income, cash flows and equity for the fiscal years ended September 28, 2012, September 30, 2011 and October 1, 2010. In connection with our audits of the consolidated financial statements, we also have audited the financial statement schedule as listed in the accompanying index. These consolidated financial statements and financial statement schedule are the responsibility of the Company’s management. Our responsibility is to express an opinion on these consolidated financial statements and financial statement schedule based on our audits.
We conducted our audits in accordance with the standards of the Public Company Accounting Oversight Board (United States). Those standards require that we plan and perform the audit to obtain reasonable assurance about whether the financial statements are free of material misstatement. An audit includes examining, on a test basis, evidence supporting the amounts and disclosures in the financial statements. An audit also includes assessing the accounting principles used and significant estimates made by management, as well as evaluating the overall financial statement presentation. We believe that our audits provide a reasonable basis for our opinion.
In our opinion, the consolidated financial statements referred to above present fairly, in all material respects, the financial position of ARAMARK Holdings Corporation and subsidiaries as of September 28, 2012 and September 30, 2011, and the results of their operations and their cash flows for each of the fiscal years ended September 28, 2012, September 30, 2011 and October 1, 2010, in conformity with U.S. generally accepted accounting principles. Also in our opinion, the related financial statement schedule, when considered in relation to the basic consolidated financial statements taken as a whole, presents fairly, in all material respects, the information set forth therein.
As discussed in Note 11 to the consolidated financial statements, the Company changed their method of accounting for their trade receivables securitization agreement as of October 2, 2010 due to the adoption of Accounting Standards Update No. 2009-16, Transfers and Servicing (Topic 860): Accounting for Transfers of Financial Assets.
/s/ KPMG LLP
Philadelphia, Pennsylvania
January 16, 2013, except for earnings per share information,
as to which the date is September 9, 2013
F-2
Table of Contents
ARAMARK HOLDINGS CORPORATION AND SUBSIDIARIES
CONSOLIDATED BALANCE SHEETS
SEPTEMBER 28, 2012 AND SEPTEMBER 30, 2011
(in thousands, except share amounts)
| September 28, 2012 | September 30, 2011 | |||||||
| ASSETS | ||||||||
| Current Assets: |
||||||||
| Cash and cash equivalents |
$ | 136,748 | $ | 213,390 | ||||
| Receivables (less allowances: 2012—$41,212; 2011—$32,963) |
1,315,997 | 1,252,266 | ||||||
| Inventories |
508,416 | 450,848 | ||||||
| Prepayments and other current assets |
200,070 | 214,385 | ||||||
|
|
|
|
|
|||||
| Total current assets |
2,161,231 | 2,130,889 | ||||||
|
|
|
|
|
|||||
| Property and Equipment, at cost: |
||||||||
| Land, buildings and improvements |
596,368 | 573,740 | ||||||
| Service equipment and fixtures |
1,545,361 | 1,400,471 | ||||||
|
|
|
|
|
|||||
| 2,141,729 | 1,974,211 | |||||||
| Less—Accumulated depreciation |
(1,141,150 | ) | (969,521 | ) | ||||
|
|
|
|
|
|||||
| 1,000,579 | 1,004,690 | |||||||
|
|
|
|
|
|||||
| Goodwill |
4,729,474 | 4,640,606 | ||||||
| Other Intangible Assets |
1,595,149 | 1,748,417 | ||||||
| Other Assets |
1,000,921 | 998,477 | ||||||
|
|
|
|
|
|||||
| $ | 10,487,354 | $ | 10,523,079 | |||||
|
|
|
|
|
|||||
| LIABILITIES AND EQUITY | ||||||||
| Current Liabilities: |
||||||||
| Current maturities of long-term borrowings |
$ | 37,462 | $ | 49,064 | ||||
| Accounts payable |
873,345 | 775,455 | ||||||
| Accrued payroll and related expenses |
468,622 | 445,076 | ||||||
| Accrued expenses and other current liabilities |
784,245 | 795,003 | ||||||
|
|
|
|
|
|||||
| Total current liabilities |
2,163,674 | 2,064,598 | ||||||
|
|
|
|
|
|||||
| Long-Term Borrowings |
5,971,305 | 6,183,070 | ||||||
| Deferred Income Taxes and Other Noncurrent Liabilities |
1,218,050 | 1,234,885 | ||||||
| Common Stock Subject to Repurchase |
167,461 | 158,061 | ||||||
| Equity: |
||||||||
| ARAMARK Holdings Stockholders’ Equity: |
||||||||
| Common stock, par value $.01 (authorized: 600,000,000 shares; issued: 2012—216,050,523 and 2011—212,285,938; and outstanding: 2012—202,573,022 and 2011—203,508,922) |
2,159 | 2,123 | ||||||
| Capital surplus |
1,636,128 | 1,593,711 | ||||||
| Accumulated deficit |
(444,479 | ) | (548,030 | ) | ||||
| Accumulated other comprehensive loss |
(73,745 | ) | (77,345 | ) | ||||
| Treasury stock (shares held in treasury: 2012—13,477,501 and 2011—8,777,016) |
(187,046 | ) | (119,773 | ) | ||||
|
|
|
|
|
|||||
| Total ARAMARK Holdings stockholders’ equity |
933,017 | 850,686 | ||||||
| Noncontrolling interest |
33,847 | 31,779 | ||||||
|
|
|
|
|
|||||
| Total equity |
966,864 | 882,465 | ||||||
|
|
|
|
|
|||||
| $ | 10,487,354 | $ | 10,523,079 | |||||
|
|
|
|
|
|||||
The accompanying notes are an integral part of these consolidated financial statements.
F-3
Table of Contents
ARAMARK HOLDINGS CORPORATION AND SUBSIDIARIES
CONSOLIDATED STATEMENTS OF INCOME
FOR THE FISCAL YEARS ENDED SEPTEMBER 28, 2012, SEPTEMBER 30, 2011 AND OCTOBER 1, 2010
(in thousands, except per share data)
| Fiscal
Year Ended September 28, 2012 |
Fiscal
Year Ended September 30, 2011 |
Fiscal
Year Ended October 1, 2010 |
||||||||||
| Sales |
$ | 13,505,426 | $ | 13,082,377 | $ | 12,419,064 | ||||||
|
|
|
|
|
|
|
|||||||
| Costs and Expenses: |
||||||||||||
| Cost of services provided |
12,191,419 | 11,836,780 | 11,247,115 | |||||||||
| Depreciation and amortization |
529,213 | 510,516 | 502,892 | |||||||||
| Selling and general corporate expenses |
203,019 | 187,992 | 191,561 | |||||||||
|
|
|
|
|
|
|
|||||||
| 12,923,651 | 12,535,288 | 11,941,568 | ||||||||||
|
|
|
|
|
|
|
|||||||
| Operating income |
581,775 | 547,089 | 477,496 | |||||||||
| Interest and Other Financing Costs, net |
456,807 | 451,120 | 444,510 | |||||||||
|
|
|
|
|
|
|
|||||||
| Income from Continuing Operations Before Income Taxes |
124,968 | 95,969 | 32,986 | |||||||||
| Provision (Benefit) for Income Taxes |
18,066 | (734 | ) | 663 | ||||||||
|
|
|
|
|
|
|
|||||||
| Income from Continuing Operations |
106,902 | 96,703 | 32,323 | |||||||||
| Income (loss) from Discontinued Operations, net of tax |
297 | (11,732 | ) | (1,635 | ) | |||||||
|
|
|
|
|
|
|
|||||||
| Net income |
107,199 | 84,971 | 30,688 | |||||||||
| Less: Net income attributable to noncontrolling interests |
3,648 | 1,125 | — | |||||||||
|
|
|
|
|
|
|
|||||||
| Net income attributable to ARAMARK Holdings stockholders |
$ | 103,551 | $ | 83,846 | $ | 30,688 | ||||||
|
|
|
|
|
|
|
|||||||
| Earnings per share attributable to ARAMARK Holdings stockholders: |
||||||||||||
| Basic: |
||||||||||||
| Income from Continuing Operations |
$ | 0.51 | $ | 0.47 | $ | 0.16 | ||||||
| Income (loss) from Discontinued Operations |
0.00 | (0.06 | ) | (0.01 | ) | |||||||
|
|
|
|
|
|
|
|||||||
| Net income attributable to ARAMARK Holdings stockholders |
$ | 0.51 | $ | 0.41 | $ | 0.15 | ||||||
|
|
|
|
|
|
|
|||||||
| Diluted: |
||||||||||||
| Income from Continuing Operations |
$ | 0.49 | $ | 0.46 | $ | 0.16 | ||||||
| Income (loss) from Discontinued Operations |
0.00 | (0.06 | ) | (0.01 | ) | |||||||
|
|
|
|
|
|
|
|||||||
| Net income attributable to ARAMARK Holdings stockholders |
$ | 0.49 | $ | 0.40 | $ | 0.15 | ||||||
|
|
|
|
|
|
|
|||||||
| Weighted Average Shares Outstanding: |
||||||||||||
| Basic |
203,211 | 203,525 | 203,867 | |||||||||
| Diluted |
209,707 | 209,999 | 207,822 | |||||||||
The accompanying notes are an integral part of these consolidated financial statements.
F-4
Table of Contents
ARAMARK HOLDINGS CORPORATION AND SUBSIDIARIES
CONSOLIDATED STATEMENTS OF CASH FLOWS
FOR THE FISCAL YEARS ENDED SEPTEMBER 28, 2012, SEPTEMBER 30, 2011
AND OCTOBER 1, 2010
(in thousands)
| Fiscal
Year Ended September 28, 2012 |
Fiscal
Year Ended September 30, 2011 |
Fiscal
Year Ended October 1, 2010 |
||||||||||
| Cash flows from operating activities: |
||||||||||||
| Net income |
$ | 107,199 | $ | 84,971 | $ | 30,688 | ||||||
| Adjustments to reconcile net income to net cash provided by operating activities: |
||||||||||||
| Depreciation and amortization |
529,213 | 516,290 | 508,875 | |||||||||
| Income taxes deferred |
(66,613 | ) | (39,890 | ) | (45,553 | ) | ||||||
| Share-based compensation expense |
15,678 | 17,317 | 21,300 | |||||||||
| Loss on sale of Galls |
— | 11,998 | — | |||||||||
| Changes in noncash working capital: |
||||||||||||
| Receivables |
(45,190 | ) | (111,862 | ) | (69,264 | ) | ||||||
| Inventories |
(50,324 | ) | (26,000 | ) | 18,883 | |||||||
| Prepayments |
38,267 | (3,096 | ) | 6,878 | ||||||||
| Accounts payable |
83,981 | 27,012 | 74,737 | |||||||||
| Accrued expenses |
16,495 | 34,450 | 70,105 | |||||||||
| Net change in proceeds from sale of receivables |
— | (220,855 | ) | (14,585 | ) | |||||||
| Changes in other noncurrent liabilities |
4,569 | 9,391 | 16,438 | |||||||||
| Changes in other assets |
43,038 | 12,311 | (1,775 | ) | ||||||||
| Other operating activities |
15,448 | (8,429 | ) | 17,283 | ||||||||
|
|
|
|
|
|
|
|||||||
| Net cash provided by operating activities |
691,761 | 303,608 | 634,010 | |||||||||
|
|
|
|
|
|
|
|||||||
| Cash flows from investing activities: |
||||||||||||
| Purchases of property and equipment, client contract investments and other |
(354,542 | ) | (293,776 | ) | (289,973 | ) | ||||||
| Disposals of property and equipment |
11,666 | 21,499 | 25,895 | |||||||||
| Proceeds from divestitures |
6,479 | 83,078 | — | |||||||||
| Acquisition of certain businesses: |
||||||||||||
| Working capital other than cash acquired |
(8,415 | ) | 5,128 | 45 | ||||||||
| Property and equipment |
(18,905 | ) | (6,386 | ) | (2,905 | ) | ||||||
| Additions to goodwill, other intangible assets and other assets, net |
(124,427 | ) | (155,697 | ) | (82,880 | ) | ||||||
| Other investing activities |
6,568 | (16,993 | ) | (3,686 | ) | |||||||
|
|
|
|
|
|
|
|||||||
| Net cash used in investing activities |
(481,576 | ) | (363,147 | ) | (353,504 | ) | ||||||
|
|
|
|
|
|
|
|||||||
| Cash flows from financing activities: |
||||||||||||
| Proceeds from long-term borrowings |
3,449 | 616,252 | 11,519 | |||||||||
| Payments of long-term borrowings |
(288,940 | ) | (31,236 | ) | (334,823 | ) | ||||||
| Net change in funding under the Receivables Facility |
37,895 | 225,905 | — | |||||||||
| Dividends paid |
— | (711,172 | ) | — | ||||||||
| Net proceeds from sale of subsidiary shares to noncontrolling interest |
— | 48,369 | — | |||||||||
| Proceeds from issuance of common stock |
11,258 | 4,593 | 3,273 | |||||||||
| Repurchase of common stock |
(37,704 | ) | (16,149 | ) | (10,809 | ) | ||||||
| Other financing activities |
(12,785 | ) | (24,562 | ) | (13,381 | ) | ||||||
|
|
|
|
|
|
|
|||||||
| Net cash (used in) provided by financing activities |
(286,827 | ) | 112,000 | (344,221 | ) | |||||||
|
|
|
|
|
|
|
|||||||
| Increase (decrease) in cash and cash equivalents |
(76,642 | ) | 52,461 | (63,715 | ) | |||||||
| Cash and cash equivalents, beginning of period |
213,390 | 160,929 | 224,644 | |||||||||
|
|
|
|
|
|
|
|||||||
| Cash and cash equivalents, end of period |
136,748 | 213,390 | 160,929 | |||||||||
| Less: Cash and cash equivalents included in assets held for sale |
— | — | 663 | |||||||||
|
|
|
|
|
|
|
|||||||
| Cash and cash equivalents, end of period |
$ | 136,748 | $ | 213,390 | $ | 160,266 | ||||||
|
|
|
|
|
|
|
|||||||
The accompanying notes are an integral part of these consolidated financial statements.
F-5
Table of Contents
ARAMARK HOLDINGS CORPORATION AND SUBSIDIARIES
CONSOLIDATED STATEMENTS OF EQUITY
FOR THE FISCAL YEARS ENDED SEPTEMBER 28, 2012, SEPTEMBER 30, 2011 AND OCTOBER 1, 2010
(In thousands)
| Total | Total ARAMARK Holdings Stockholders’ Equity |
Common Stock |
Capital Surplus |
Accumulated Deficit |
Accumulated Other Comprehensive Loss |
Treasury Stock |
Noncontrolling Interest |
|||||||||||||||||||||||||
| Balance, October 2, 2009 |
$ | 1,360,365 | $ | 1,360,365 | $ | 2,082 | $ | 1,498,564 | $ | 48,608 | $ | (133,694 | ) | $ | (55,195 | ) | $ | — | ||||||||||||||
| Net income |
30,688 | 30,688 | 30,688 | |||||||||||||||||||||||||||||
| Pension plan adjustments (net of tax) |
(12,304 | ) | (12,304 | ) | (12,304 | ) | ||||||||||||||||||||||||||
| Foreign currency translation adjustments (net of tax) |
2,220 | 2,220 | 2,220 | |||||||||||||||||||||||||||||
| Change in fair value of cash flow hedges (net of tax) |
15,252 | 15,252 | 15,252 | |||||||||||||||||||||||||||||
| Capital contributions from issuance of common stock |
11,703 | 11,703 | 12 | 11,691 | ||||||||||||||||||||||||||||
| Compensation expense related to stock incentive plans |
21,300 | 21,300 | 21,300 | |||||||||||||||||||||||||||||
| Tax benefits related to stock incentive plans |
(104 | ) | (104 | ) | (104 | ) | ||||||||||||||||||||||||||
| Increase in common stock subject to repurchase obligation, net |
(8,341 | ) | (8,341 | ) | (8,341 | ) | ||||||||||||||||||||||||||
| Repurchases of common stock |
(23,822 | ) | (23,822 | ) | (23,822 | ) | ||||||||||||||||||||||||||
|
|
|
|
|
|
|
|
|
|
|
|
|
|
|
|
|
|||||||||||||||||
| Balance, October 1, 2010 |
$ | 1,396,957 | $ | 1,396,957 | $ | 2,094 | $ | 1,523,110 | $ | 79,296 | $ | (128,526 | ) | $ | (79,017 | ) | $ | — | ||||||||||||||
|
|
|
|
|
|
|
|
|
|
|
|
|
|
|
|
|
|||||||||||||||||
| Net income |
84,971 | 83,846 | 83,846 | 1,125 | ||||||||||||||||||||||||||||
| Pension plan adjustments (net of tax) |
(4,058 | ) | (4,058 | ) | (4,058 | ) | ||||||||||||||||||||||||||
| Foreign currency translation adjustments (net of tax) |
366 | 366 | 366 | |||||||||||||||||||||||||||||
| Change in fair value of cash flow hedges (net of tax) |
54,873 | 54,873 | 54,873 | |||||||||||||||||||||||||||||
| Capital contributions from issuance of common stock |
25,252 | 25,252 | 29 | 25,223 | ||||||||||||||||||||||||||||
| Compensation expense related to stock incentive plans |
17,317 | 17,317 | 17,317 | |||||||||||||||||||||||||||||
| Tax benefits related to stock incentive plans |
651 | 651 | 651 | |||||||||||||||||||||||||||||
| Decrease in common stock subject to repurchase obligation, net |
26,675 | 26,675 | 26,675 | |||||||||||||||||||||||||||||
| Repurchases of common stock |
(40,756 | ) | (40,756 | ) | (40,756 | ) | ||||||||||||||||||||||||||
| Dividends paid |
(711,172 | ) | (711,172 | ) | (711,172 | ) | ||||||||||||||||||||||||||
| Sale of subsidiary shares to noncontrolling interest |
31,677 | 735 | 735 | 30,942 | ||||||||||||||||||||||||||||
| Distributions to noncontrolling interest |
(288 | ) | — | (288 | ) | |||||||||||||||||||||||||||
|
|
|
|
|
|
|
|
|
|
|
|
|
|
|
|
|
|||||||||||||||||
| Balance, September 30, 2011 |
$ | 882,465 | $ | 850,686 | $ | 2,123 | $ | 1,593,711 | $ | (548,030 | ) | $ | (77,345 | ) | $ | (119,773 | ) | $ | 31,779 | |||||||||||||
|
|
|
|
|
|
|
|
|
|
|
|
|
|
|
|
|
|||||||||||||||||
The accompanying notes are an integral part of these consolidated financial statements.
F-6
Table of Contents
ARAMARK HOLDINGS CORPORATION AND SUBSIDIARIES
CONSOLIDATED STATEMENTS OF EQUITY
FOR THE FISCAL YEARS ENDED SEPTEMBER 28, 2012, SEPTEMBER 30, 2011 AND OCTOBER 1, 2010
(In thousands)
| Total | Total ARAMARK Holdings Stockholders’ Equity |
Common Stock |
Capital Surplus |
Accumulated Deficit |
Accumulated Other Comprehensive Loss |
Treasury Stock |
Noncontrolling Interest |
|||||||||||||||||||||||||
| Balance, September 30, 2011 |
$ | 882,465 | $ | 850,686 | $ | 2,123 | $ | 1,593,711 | $ | (548,030 | ) | $ | (77,345 | ) | $ | (119,773 | ) | $ | 31,779 | |||||||||||||
| Net income |
106,076 | 103,551 | 103,551 | 2,525 | ||||||||||||||||||||||||||||
| Pension plan adjustments (net of tax) |
(16,208 | ) | (16,208 | ) | (16,208 | ) | ||||||||||||||||||||||||||
| Foreign currency translation adjustments (net of tax) |
(4,368 | ) | (4,368 | ) | (4,368 | ) | ||||||||||||||||||||||||||
| Change in fair value of cash flow hedges (net of tax) |
34,976 | 34,976 | 34,976 | |||||||||||||||||||||||||||||
| Share of equity method investee’s other comprehensive loss (net of tax) |
(10,800 | ) | (10,800 | ) | (10,800 | ) | ||||||||||||||||||||||||||
| Capital contributions from issuance of common stock |
31,636 | 31,636 | 36 | 31,600 | ||||||||||||||||||||||||||||
| Compensation expense related to stock incentive plans |
15,678 | 15,678 | 15,678 | |||||||||||||||||||||||||||||
| Tax benefits related to stock incentive plans |
4,539 | 4,539 | 4,539 | |||||||||||||||||||||||||||||
| Increase in common stock subject to repurchase obligation, net |
(9,400 | ) | (9,400 | ) | (9,400 | ) | ||||||||||||||||||||||||||
| Repurchases of common stock |
(67,273 | ) | (67,273 | ) | (67,273 | ) | ||||||||||||||||||||||||||
| Distributions to noncontrolling interest |
(457 | ) | — | (457 | ) | |||||||||||||||||||||||||||
|
|
|
|
|
|
|
|
|
|
|
|
|
|
|
|
|
|||||||||||||||||
| Balance, September 28, 2012 |
$ | 966,864 | $ | 933,017 | $ | 2,159 | $ | 1,636,128 | $ | (444,479 | ) | $ | (73,745 | ) | $ | (187,046 | ) | $ | 33,847 | |||||||||||||
|
|
|
|
|
|
|
|
|
|
|
|
|
|
|
|
|
|||||||||||||||||
The accompanying notes are an integral part of these consolidated financial statements.
F-7
Table of Contents
ARAMARK HOLDINGS CORPORATION AND SUBSIDIARIES
NOTES TO CONSOLIDATED FINANCIAL STATEMENTS
NOTE 1. BASIS OF PRESENTATION AND SUMMARY OF SIGNIFICANT ACCOUNTING POLICIES:
On January 26, 2007, ARAMARK Holdings Corporation (the “Company” or “Holdings”), a Delaware corporation controlled by investment funds associated with GS Capital Partners, CCMP Capital Advisors, J.P. Morgan Partners, Thomas H. Lee Partners and Warburg Pincus LLC (collectively, the “Sponsors”), Joseph Neubauer, Chairman and former Chief Executive Officer of ARAMARK Corporation, and certain other members of the Company’s management, acquired all of the outstanding shares of ARAMARK Corporation.
The consolidated financial statements include the accounts of the Company and all of its subsidiaries in which a controlling financial interest is maintained. For those material consolidated subsidiaries in which the Company’s ownership is less than 100%, the outside stockholders’ interests are shown as noncontrolling interest in the accompanying Consolidated Balance Sheets. All significant intercompany transactions and accounts have been eliminated.
Fiscal Year
The Company’s fiscal year is the fifty-two or fifty-three week period which ends on the Friday nearest September 30th. The fiscal years ended September 28, 2012, September 30, 2011 and October 1, 2010 were each fifty-two week periods.
New Accounting Standard Updates
In January 2010, the FASB issued an accounting standard update that requires new disclosures about recurring and non-recurring fair value measurements. The new disclosures include significant transfers into and out of level 1 and 2 measurements and changes the current disclosure requirement of level 3 measurement activity from a net basis to a gross basis. The standard also clarifies existing disclosure guidance about the level of disaggregation, inputs and valuation techniques. The new and revised disclosures were effective for the Company in fiscal 2010, except for the revised disclosures about level 3 measurement activity, which became effective for the Company in the first quarter of fiscal 2012 (see Note 14).
In May 2011, the FASB issued an accounting standard update that is intended to achieve common fair value measurement and disclosure requirements in U.S. GAAP and International Financial Reporting Standards. The new standard does not extend the use of fair value but rather provides clarification of existing guidance and additional disclosures. The Company adopted this guidance prospectively beginning in the second quarter of fiscal 2012. The standard update has resulted in expanded disclosures, specifically regarding level 3 fair value measurements (see Note 9 and Note 14).
In September 2011, the FASB issued an accounting standard update that simplifies how entities test goodwill for impairment. The amendment permits an entity to first assess qualitative factors to determine whether it is more likely than not that the fair value of a reporting unit is less than its carrying amount as a basis for determining whether it is necessary to perform the two-step goodwill impairment test. The guidance is effective for the Company beginning in fiscal 2013; however, early adoption is permitted. The Company is currently evaluating the impact of this pronouncement.
In June 2011, the FASB issued an accounting standard update that modifies the presentation of comprehensive income in the financial statements. The standard requires an entity to present the total of comprehensive income, the components of net income, and the components of other comprehensive income
F-8
Table of Contents
either in a single continuous statement of comprehensive income or in two separate but consecutive statements. This standard eliminates the current option to report other comprehensive income and its components in the statement of changes in equity. In December 2011, the FASB issued an accounting standard update which deferred the portion of this update related to the presentation of reclassification adjustments between other comprehensive income and net income. The guidance is effective retrospectively for the Company beginning in the first quarter of fiscal 2013. The Company is currently evaluating the impact of this pronouncement.
In September 2011, the FASB issued an accounting standard update that requires companies participating in multiemployer pension plans to disclose more information about their involvement in the plans, specifically related to the amount of employer contributions made to each significant plan and to all plans in the aggregate, whether an employer’s contributions represent more than 5% of total contributions to the plan, whether any plans are subject to a funding improvement plan, the expiration date(s) of the collective bargaining agreement(s) and any minimum funding arrangements, the most recent certified funded status of the plan, as determined by the plan’s “zone status,” (required by the Pension Protection Act of 2006) and a description of the nature and effect of any changes affecting comparability for each period an income statement is presented. The Company adopted this accounting standard update on September 28, 2012 (see Note 7).
In December 2011, the FASB issued an accounting standard update that requires companies with financial instruments and derivative instruments that are offset on the balance sheet or subject to a master netting arrangement to provide additional disclosures regarding the instruments’ impact on a company’s financial position. The guidance is effective for the Company beginning in the first quarter of fiscal 2014. The Company is currently evaluating the impact of this pronouncement.
In June 2012, the FASB issued an accounting standard update which amends the guidance on testing indefinite-lived intangible assets, other than goodwill, for impairment. The amendment permits an entity to perform a qualitative impairment assessment before proceeding to the two-step impairment test. The guidance is effective for the Company beginning in fiscal 2013; however early adoption is permitted. The Company is currently evaluating the impact of this pronouncement.
Revenue Recognition
In each of the Company’s operating segments, sales are recognized in the period in which services are provided pursuant to the terms of the Company’s contractual relationships with its clients. Sales from direct marketing activities are recognized upon shipment. All sales related taxes are presented on a net basis.
Vendor Consideration
Consideration received from vendors is accounted for as an adjustment to the cost of the vendor’s products or services and reported as a reduction of “Cost of services provided” or “Inventories.”
Use of Estimates
The preparation of financial statements in conformity with generally accepted accounting principles in the United States requires management to make estimates and assumptions that affect the reported amounts of assets and liabilities and disclosure of contingent assets and liabilities at the date of the financial statements and the reported amounts of sales and expenses during the reporting period. Actual results could differ from those estimates.
F-9
Table of Contents
Comprehensive Income
Comprehensive income includes all changes to stockholders’ equity during a period, except those resulting from investments by and distributions to stockholders. Components of comprehensive income include net income (loss), changes in foreign currency translation adjustments (net of tax), pension plan adjustments (net of tax), changes in the fair value of cash flow hedges (net of tax) and changes to the share of any equity investees’ comprehensive income (net of tax).
Comprehensive income consists of the following (in thousands):
| Fiscal Year Ended |
Fiscal Year Ended |
Fiscal Year Ended |
||||||||||
| September 28, 2012 | September 30, 2011 | October 1, 2010 | ||||||||||
| Net income |
$ | 107,199 | $ | 84,971 | $ | 30,688 | ||||||
| Pension plan adjustments |
(16,208 | ) | (4,058 | ) | (12,304 | ) | ||||||
| Foreign currency translation adjustments |
(4,368 | ) | 366 | 2,220 | ||||||||
| Fair value of cash flow hedges |
34,976 | 54,873 | 15,252 | |||||||||
| Share of equity investee’s comprehensive loss |
(10,800 | ) | — | — | ||||||||
|
|
|
|
|
|
|
|||||||
| Comprehensive income |
110,799 | 136,152 | 35,856 | |||||||||
| Less: Net income attributable to noncontrolling interests |
3,648 | 1,125 | — | |||||||||
|
|
|
|
|
|
|
|||||||
| Comprehensive income attributable to ARAMARK Holdings stockholders |
$ | 107,151 | $ | 135,027 | $ | 35,856 | ||||||
|
|
|
|
|
|
|
|||||||
The tax effects on comprehensive income were as follows (in thousands):
| Fiscal Year Ended |
Fiscal Year Ended |
Fiscal Year Ended |
||||||||||
| September 28, 2012 | September 30, 2011 | October 1, 2010 | ||||||||||
| Pension plan adjustments |
$ | 8,646 | $ | 2,207 | $ | 6,620 | ||||||
| Foreign currency translation adjustments |
2,684 | (5,515 | ) | (6,581 | ) | |||||||
| Fair value of cash flow hedges |
(22,197 | ) | (36,050 | ) | (9,838 | ) | ||||||
| Share of equity investee’s comprehensive loss |
7,200 | — | — | |||||||||
Accumulated other comprehensive loss consists of the following (in thousands):
| September 28, 2012 | September 30, 2011 | |||||||
| Pension plan adjustments |
$ | (50,268 | ) | $ | (34,060 | ) | ||
| Foreign currency translation adjustments |
20,429 | 24,797 | ||||||
| Fair value of cash flow hedges |
(33,106 | ) | (68,082 | ) | ||||
| Share of equity investee’s accumulated other comprehensive loss |
(10,800 | ) | — | |||||
|
|
|
|
|
|||||
| $ | (73,745 | ) | $ | (77,345 | ) | |||
|
|
|
|
|
|||||
Currency Translation
Gains and losses resulting from the translation of financial statements of non-U.S. subsidiaries are reflected as a component of accumulated other comprehensive income (loss) in stockholders’ equity. Transaction gains and losses included in operating results for fiscal 2012, fiscal 2011 and fiscal 2010 were immaterial.
F-10
Table of Contents
Current Assets
The Company considers all highly liquid investments with an original maturity of three months or less to be cash equivalents.
Inventories are valued at the lower of cost (principally the first-in, first-out method) or market. Personalized work apparel, linens and other rental items in service are recorded at cost and are amortized over their estimated useful lives, which primarily range from one to four years. The amortization rates used are based on the Company’s specific experience.
The components of inventories are as follows:
| September 28, 2012 | September 30, 2011 | |||||||
| Food |
39.5 | % | 38.7 | % | ||||
| Career apparel and linens |
57.2 | % | 55.9 | % | ||||
| Parts, supplies and novelties |
3.3 | % | 5.4 | % | ||||
|
|
|
|
|
|||||
| 100.0 | % | 100.0 | % | |||||
|
|
|
|
|
|||||
Property and Equipment
Property and equipment are stated at cost and are depreciated over their estimated useful lives on a straight-line basis. Gains and losses on dispositions are included in operating results. Maintenance and repairs are charged to current operations, and replacements and significant improvements are capitalized. The estimated useful lives for the major categories of property and equipment are 10 to 40 years for buildings and improvements and 3 to 10 years for service equipment and fixtures. Depreciation expense during fiscal 2012, fiscal 2011 and fiscal 2010 was $236.6 million, $234.5 million, and $240.8 million, respectively.
Other Assets
Other assets consist primarily of investments in 50% or less owned entities, client contract investments, deferred financing costs, computer software costs and long-term receivables. Investments in which the Company owns more than 20% but less than a majority are accounted for using the equity method. Investments in which the Company owns less than 20% are accounted for under the cost method. Client contract investments generally represent a cash payment provided by the Company to help finance improvement or renovation at the facility from which the Company operates. These amounts are amortized over the contract period. If a contract is terminated prior to its maturity date, the Company is generally reimbursed for the unamortized client contract investment amount. Amortization expense for client contract investments was $86.9 million, $76.7 million and $67.8 million during fiscal 2012, fiscal 2011 and fiscal 2010, respectively.
The Company’s principal equity method investment is its 50% ownership interest in AIM Services Co., Ltd., a Japanese food and support services company (approximately $233.4 million and $269.7 million at September 28, 2012 and September 30, 2011, respectively, which is included in “Other Assets” in the Consolidated Balance Sheets). Summarized financial information for AIM Services Co., Ltd. follows (in thousands):
| September 28, 2012 | September 30, 2011 | |||||||
| Current assets |
$ | 433,584 | $ | 402,381 | ||||
| Noncurrent assets |
222,813 | 215,475 | ||||||
| Current liabilities |
374,062 | 321,025 | ||||||
| Noncurrent liabilities |
74,680 | 67,008 | ||||||
F-11
Table of Contents
| Fiscal Year Ended |
Fiscal Year Ended |
Fiscal Year Ended |
||||||||||
| September 28, 2012 | September 30, 2011 | October 1, 2010 | ||||||||||
| Sales |
$ | 1,916,620 | $ | 1,772,143 | $ | 1,589,709 | ||||||
| Gross profit |
222,033 | 222,970 | 198,980 | |||||||||
| Net income |
39,174 | 41,949 | 38,559 | |||||||||
The Company’s equity in undistributed earnings of AIM Services Co., Ltd., net of amortization related to purchase accounting for the 2007 going-private transaction (the “2007 Transaction”), was $14.7 million, $18.0 million and $15.5 million for fiscal 2012, fiscal 2011 and fiscal 2010, respectively, and is recorded as a reduction of “Cost of services provided” in the Consolidated Statements of Income. During fiscal 2012, fiscal 2011 and fiscal 2010, the Company received $34.9 million, $10.5 million and $8.2 million of cash distributions from AIM Services Co., Ltd, respectively.
Other Accrued Expenses and Liabilities
Accrued expenses and other current liabilities consist principally of insurance accruals, advanced payments from clients, taxes, interest, fair value of interest rate swaps and accrued commissions. Advanced payments from clients as of September 28, 2012 and September 30, 2011 were $278.5 million and $242.3 million, respectively. The Company is self-insured for the risk retained under its health and welfare and general liability and workers’ compensation arrangements. Self-insurance reserves are recorded based on historical claims experience and actuarial analyses. As of September 28, 2012 and September 30, 2011, $92.2 million and $86.7 million of insurance accruals were included in accrued expenses and other current liabilities, respectively.
Noncurrent liabilities consist primarily of deferred compensation, insurance accruals, pension liabilities, redeemable noncontrolling interests, fair value of interest rate swaps and other hedging agreements and asset retirement obligations.
Fair Value of Financial Instruments
The Company’s financial instruments consist primarily of cash and cash equivalents, accounts receivable, accounts payable, current and long-term borrowings, derivatives and common stock subject to repurchase.
Share-Based Compensation
The Company recognizes compensation cost related to share-based payment transactions in the consolidated financial statements. The cost is measured at the grant date, based on the estimated fair value of the award, and is recognized as an expense over the employee’s requisite service period (generally the vesting period of the equity award). See Note 10 for additional information on share-based compensation.
Earnings Per Share
Basic earnings per share is computed using the weighted average number of common shares outstanding during the periods presented. Diluted earnings per share is computed using the weighted average number of common shares outstanding adjusted to include the potentially dilutive effect of stock options, incentive stock purchase opportunities and deferred stock units.
F-12
Table of Contents
The following table sets forth the computation of basic and diluted earnings per share attributable to ARAMARK Holdings stockholders (in thousands, except per share data):
| Fiscal Year Ended |
Fiscal Year Ended |
Fiscal Year Ended |
||||||||||
| September 28, 2012 | September 30, 2011 | October 1, 2010 | ||||||||||
| Earnings: |
||||||||||||
| Income from Continuing Operations attributable to ARAMARK Holdings stockholders |
$ | 103,254 | $ | 95,578 | $ | 32,323 | ||||||
| Income (loss) from Discontinued Operations |
297 | (11,732 | ) | (1,635 | ) | |||||||
|
|
|
|
|
|
|
|||||||
| Net income attributable to ARAMARK Holdings stockholders |
$ | 103,551 | $ | 83,846 | $ | 30,688 | ||||||
|
|
|
|
|
|
|
|||||||
| Shares: |
||||||||||||
| Basic weighted-averages shares outstanding |
203,211 | 203,525 | 203,867 | |||||||||
| Effect of dilutive securities |
6,496 | 6,474 | 3,955 | |||||||||
|
|
|
|
|
|
|
|||||||
| Diluted weighted-averages shares outstanding |
209,707 | 209,999 | 207,822 | |||||||||
|
|
|
|
|
|
|
|||||||
| Basic Earnings Per Share: |
||||||||||||
| Income from Continuing Operations |
$ | 0.51 | $ | 0.47 | $ | 0.16 | ||||||
| Income (loss) from Discontinued Operations |
0.00 | (0.06 | ) | (0.01 | ) | |||||||
|
|
|
|
|
|
|
|||||||
| Net income attributable to ARAMARK Holdings stockholders |
$ | 0.51 | $ | 0.41 | $ | 0.15 | ||||||
|
|
|
|
|
|
|
|||||||
| Diluted Earnings Per Share: |
||||||||||||
| Income from Continuing Operations |
$ | 0.49 | $ | 0.46 | $ | 0.16 | ||||||
| Income (loss) from Discontinued Operations |
0.00 | (0.06 | ) | (0.01 | ) | |||||||
|
|
|
|
|
|
|
|||||||
| Net income attributable to ARAMARK Holdings stockholders |
$ | 0.49 | $ | 0.40 | $ | 0.15 | ||||||
|
|
|
|
|
|
|
|||||||
Share-based awards to purchase 3.2 million, 7.2 million and 6.0 million shares were outstanding at September 28, 2012, September 30, 2011 and October 1, 2010, respectively, but were not included in the computation of diluted earnings per common share as their effect would have been antidilutive. In addition, Performance-Based Options to purchase 8.7 million, 7.2 million and 7.8 million shares were outstanding at September 28, 2012, September 30, 2011 and October 1, 2010, respectively, but were not included in the computation of diluted earnings per share, as the performance targets were not met.
Supplemental Cash Flow Information
| Fiscal Year Ended |
Fiscal Year Ended |
Fiscal Year Ended |
||||||||||
| (dollars in millions) | September 28, 2012 | September 30, 2011 | October 1, 2010 | |||||||||
| Interest paid |
$ | 422.5 | $ | 386.4 | $ | 409.3 | ||||||
| Income taxes paid |
$ | 82.5 | $ | 64.9 | $ | 34.8 | ||||||
F-13
Table of Contents
Significant noncash activities follow:
| • | During fiscal 2012, fiscal 2011 and fiscal 2010, the Company executed capital lease transactions. The present value of the future rental obligations was approximately $17.0 million, $16.2 million and $3.2 million for the respective periods, which is included in property and equipment and long-term borrowings. |
| • | During fiscal 2012, fiscal 2011 and fiscal 2010, approximately $6.7 million, $4.8 million and $5.2 million of common stock was repurchased through the issuance of promissory notes, respectively. |
| • | During fiscal 2012, fiscal 2011 and fiscal 2010, cashless settlements of the exercise price and related employee minimum tax withholding liabilities of share-based payment awards were approximately $27.0 million, $25.9 million and $9.6 million, respectively. |
NOTE 2. DISCONTINUED OPERATIONS:
On September 30, 2011, the Company completed the sale of its wholly-owned subsidiary, Galls, LLC (“Galls”), for approximately $75.0 million in cash. The transaction resulted in a pretax loss of approximately $1.5 million (after-tax loss of approximately $12.0 million) during fiscal 2011. Galls is accounted for as a discontinued operation in the Consolidated Statements of Income. Galls’ results of operations have been removed from the Company’s results of continuing operations for all periods presented. Galls was previously included in the Uniform and Career Apparel segment. All related disclosures have also been adjusted to reflect the discontinued operation.
Summarized selected financial information of discontinued operations is as follows (in thousands):
| Fiscal Year Ended September 28, 2012 |
Fiscal Year Ended September 30, 2011 |
Fiscal Year Ended October 1, 2010 |
||||||||||
| Sales |
$ | — | $ | 162,294 | $ | 152,611 | ||||||
| Income (loss) before income taxes |
491 | 441 | (2,702 | ) | ||||||||
| Income tax provision (benefit) |
194 | 175 | (1,067 | ) | ||||||||
|
|
|
|
|
|
|
|||||||
| 297 | 266 | (1,635 | ) | |||||||||
| Loss on sale, net of tax |
— | (11,998 | ) | — | ||||||||
|
|
|
|
|
|
|
|||||||
| Income (loss) from discontinued operations |
$ | 297 | $ | (11,732 | ) | $ | (1,635 | ) | ||||
|
|
|
|
|
|
|
|||||||
NOTE 3. ACQUISITIONS AND DIVESTITURES:
Fiscal 2012
Acquisitions
On October 3, 2011, ARAMARK Refreshment Services, LLC, a subsidiary of the Company, purchased all of the outstanding shares of capital stock of Van Houtte USA Holdings, Inc. (doing business as “Filterfresh”), a provider of office coffee services in the United States, for cash consideration of approximately $145.2 million. The acquisition was financed with cash on hand and borrowings under the Company’s revolving credit facility. Under the terms of the purchase agreement, if a certain significant customer relationship was not maintained within a specific timeframe, the Company was entitled to a refund of a portion of the purchase price. During the second quarter of fiscal 2012, the Company received a refund of approximately $7.4 million related to the termination of this customer relationship.
As part of the acquisition of Filterfresh, the Company acquired a subsidiary with a redeemable noncontrolling interest. The Company classifies redeemable noncontrolling interests outside of stockholders’ equity in the Consolidated Balance Sheet in “Deferred Income Taxes and Other Noncurrent Liabilities.” As of September 28, 2012, the redeemable noncontrolling interest related to the subsidiary was approximately
F-14
Table of Contents
$10.4 million. For fiscal 2012, net income attributable to the redeemable noncontrolling interest was $1.1 million. Distributions to the redeemable noncontrolling interest were $0.9 million for fiscal 2012.
For fiscal 2012, $108.0 million of sales and ($1.6) million of net loss, which includes transition and integration costs, were recorded in the Consolidated Statements of Income related to the acquisition. During fiscal 2011, approximately $0.7 million of pretax transaction-related costs related to the acquisition were recorded in earnings. The Company’s proforma results of operations for fiscal 2012 and fiscal 2011 would not have been materially different than reported, assuming the acquisition had occurred at the beginning of the prior year period.
Fiscal 2011
Acquisitions
On March 18, 2011, ARAMARK Clinical Technology Services, LLC, a subsidiary of the Company, purchased the common stock of the ultimate parent company of Masterplan, a clinical technology management and medical equipment maintenance company, for cash consideration of approximately $154.2 million. Also acquired in the transaction was ReMedPar, an independent provider of sourced and refurbished medical equipment parts. During the first quarter of fiscal 2012, the Company sold MESA, a wholly-owned subsidiary acquired as part of the Masterplan acquisition, for cash consideration of approximately $4.2 million. The sale resulted in a reduction to goodwill of approximately $1.7 million. The Company’s proforma results of operations for fiscal 2011 would not have been materially different than reported.
During the third quarter of fiscal 2012, the Company received $5.5 million in cash related to the settlement of indemnity claims filed against the former owners of Masterplan. After applying a portion of the proceeds to agreed upon indemnification assets, and after adjusting for certain other exposures, the Company recorded a pretax gain of $1.0 million, which is included in “Cost of services provided” in the Consolidated Statements of Income.
The Company followed the acquisition method of accounting in accordance with the accounting standard related to business combinations. The following table summarizes the final fair values of the assets acquired and liabilities assumed from Masterplan (in thousands):
| Purchase consideration |
$ | 154,154 | ||
|
|
|
|||
| Current assets |
$ | 29,906 | ||
| Current liabilities |
(31,396 | ) | ||
| Property and equipment |
3,736 | |||
| Other intangible assets |
42,800 | |||
| Goodwill |
126,757 | |||
| Other assets |
314 | |||
| Long-term borrowings |
(767 | ) | ||
| Deferred income taxes and other noncurrent liabilities |
(17,196 | ) | ||
|
|
|
|||
| $ | 154,154 | |||
|
|
|
For fiscal 2012 and fiscal 2011, $107.3 million and $62.4 million of sales and ($0.2) million and ($4.7) million of net loss, respectively, were recorded in the Consolidated Statements of Income related to Masterplan.
Divestitures
During fiscal 2011, the Company completed the sale of its 67% ownership interest in the security business of its Chilean subsidiary for approximately $11.6 million in cash. The transaction resulted in a pretax gain of
F-15
Table of Contents
approximately $7.7 million (net of tax gain of approximately $5.8 million), which is included in “Cost of services provided” in the Consolidated Statements of Income. The results of operations and cash flows associated with the security business were not material to the Company’s consolidated operations and cash flows.
During the third quarter of fiscal 2011, the Company sold a noncontrolling interest in Seamless North America, LLC (“Seamless”), an online and mobile food ordering service, for consideration of $50.0 million in cash (see Note 16). During the fourth quarter of fiscal 2011, the Company completed the sale of its wholly-owned subsidiary, Galls, for approximately $75.0 million in cash (see Note 2).
Fiscal 2010
Acquisitions
On October 30, 2009, ARAMARK Ireland Holdings Limited and ARAMARK Investments Limited, subsidiaries of the Company, completed the acquisition of the facilities management and property management businesses of Veris plc, an Irish company, for consideration of approximately $74.3 million in cash and the assumption of a pension liability of approximately $1.2 million. These business interests include Vector Workplace and Facility Management Ltd, Irish Estates (Facilities Management) Ltd, Irish Estates (Management) Ltd, Premier Management Company (Dublin) Ltd, Glenrye Properties Services Ltd, Spokesoft Technologies Ltd, Orange Support Services Ltd, Orange Environmental Building Services Ltd and Vector Environmental Services Ltd, all of which are companies that were owned by Veris plc. The facilities management business provides a broad range of facility and project management and consulting services for clients across a wide range of industrial and commercial sectors in Ireland and the United Kingdom. The property management business operates three business units—commercial, residential and retail—through which it manages mixed and single use property developments.
The Company followed the acquisition method of accounting in accordance with the accounting standard related to business combinations. The following table summarizes the fair values of the assets acquired and liabilities assumed from Veris plc (in thousands):
| Purchase consideration |
$ | 74,335 | ||
|
|
|
|||
| Current assets |
$ | 42,962 | ||
| Current liabilities |
(48,122 | ) | ||
| Property and equipment |
1,005 | |||
| Customer relationship assets |
44,235 | |||
| Goodwill |
40,165 | |||
| Other assets |
956 | |||
| Long-term borrowings |
(77 | ) | ||
| Deferred income taxes and other noncurrent liabilities |
(6,789 | ) | ||
|
|
|
|||
| $ | 74,335 | |||
|
|
|
NOTE 4. GOODWILL AND OTHER INTANGIBLE ASSETS:
Goodwill represents the excess of the fair value of consideration paid for an acquired entity over the fair value of assets acquired and liabilities assumed in a business combination. Goodwill is not amortized and is subject to an impairment test that the Company conducts annually or more frequently if a change in circumstances or the occurrence of events indicates that potential impairment exists, using discounted cash flows. The Company performs its assessment of goodwill at the reporting unit level. Within the Food and Support Services—International segment, each country is evaluated separately since such operating units are relatively autonomous and separate goodwill balances have been recorded for each entity. The Company has completed the annual goodwill impairment test, which did not result in an impairment charge.
F-16
Table of Contents
During the second quarter of fiscal 2011, the Company recorded an impairment charge of $5.3 million in the Food and Support Services—International segment in order to write off the goodwill (approximately $4.0 million) and other intangible assets (approximately $1.3 million) associated with its India operations. The impairment charge is included in “Cost of services provided” in the Consolidated Statements of Income. The impairment charge primarily resulted from a change in the strategic direction of the business and continuing operating losses due to competitive pressures. To determine the amount of the impairment charge, the Company concluded that the carrying value exceeded the estimated fair value of the India operating unit. The Company estimated the fair value using a discounted cash flow valuation methodology, which included making assumptions about the future profitability and cash flows of the business.
Goodwill, allocated by segment (see Note 13 for a description of segments), is as follows (in thousands):
| Segment |
September 30, 2011 | Acquisitions
and Divestitures |
Translation | September 28, 2012 | ||||||||||||
| Food and Support Services—North America |
$ | 3,613,370 | $ | 87,734 | $ | 33 | $ | 3,701,137 | ||||||||
| Food and Support Services—International |
453,996 | — | 556 | 454,552 | ||||||||||||
| Uniform and Career Apparel |
573,240 | 545 | — | 573,785 | ||||||||||||
|
|
|
|
|
|
|
|
|
|||||||||
| $ | 4,640,606 | $ | 88,279 | $ | 589 | $ | 4,729,474 | |||||||||
|
|
|
|
|
|
|
|
|
|||||||||
The Food and Support Services—North America acquisitions and divestitures activity consists primarily of goodwill resulting from the final determination of the purchase price allocations related to Filterfresh and Masterplan (see Note 3).
Other intangible assets consist of (in thousands):
| September 28, 2012 | September 30, 2011 | |||||||||||||||||||||||
| Gross Amount |
Accumulated Amortization |
Net Amount |
Gross Amount |
Accumulated Amortization |
Net Amount |
|||||||||||||||||||
| Customer relationship assets |
$ | 1,897,933 | $ | (1,064,492 | ) | $ | 833,441 | $ | 1,852,531 | $ | (865,524 | ) | $ | 987,007 | ||||||||||
| Trade names |
763,127 | (1,419 | ) | 761,708 | 761,919 | (509 | ) | 761,410 | ||||||||||||||||
|
|
|
|
|
|
|
|
|
|
|
|
|
|||||||||||||
| $ | 2,661,060 | $ | (1,065,911 | ) | $ | 1,595,149 | $ | 2,614,450 | $ | (866,033 | ) | $ | 1,748,417 | |||||||||||
|
|
|
|
|
|
|
|
|
|
|
|
|
|||||||||||||
Acquisition-related intangible assets consist of customer relationship assets, the ARAMARK trade name and other trade names. Customer relationship assets are being amortized principally on a straight-line basis over the expected period of benefit, 3 to 24 years, with a weighted average life of approximately 11 years. The ARAMARK and Seamless trade names are indefinite lived intangible assets and are not amortizable but are evaluated for impairment at least annually. The Company completed its annual trade names impairment test, which did not result in an impairment charge.
Intangible assets of approximately $43.9 million were acquired through business combinations during fiscal 2012. Amortization of intangible assets for fiscal 2012, fiscal 2011 and fiscal 2010 was approximately $198 million, $193 million and $188 million, respectively.
The estimated amortization expense of the amortizable intangible assets through 2017 reflects the 2007 Transaction and acquisitions since January 26, 2007. Based on the recorded balances at September 28, 2012, total estimated amortization of all acquisition-related intangible assets for fiscal years 2013 through 2017 follows (in thousands):
| 2013 |
$ | 191,776 | ||
| 2014 |
$ | 156,771 | ||
| 2015 |
$ | 132,642 | ||
| 2016 |
$ | 95,788 | ||
| 2017 |
$ | 71,797 |
F-17
Table of Contents
NOTE 5. BORROWINGS:
As of September 28, 2012 and September 30, 2011, all of the Company’s indebtedness was held by the Company’s wholly-owned subsidiary, ARAMARK Corporation, except for the 8.625% / 9.275% Senior Notes due 2016. Long-term borrowings at September 28, 2012 and September 30, 2011 are summarized in the following table (in thousands):
| September 28, 2012 |
September 30, 2011 |
|||||||
| Senior secured revolving credit facility |
$ | — | $ | — | ||||
| 8.625% / 9.375% Senior Notes, due April 2016 |
595,486 | 594,456 | ||||||
| Senior secured term loan facility (un-extended) |
650,913 | 1,886,848 | ||||||
| Senior secured term loan facility (extended) |
2,637,920 | 1,407,440 | ||||||
| 8.50% senior notes, due February 2015 |
1,280,000 | 1,280,000 | ||||||
| Senior floating rate notes, due February 2015 |
500,000 | 500,000 | ||||||
| 5.00% senior notes, due June 2012 |
— | 246,287 | ||||||
| Receivables Facility, due January 2015 |
263,800 | 225,905 | ||||||
| Capital leases |
49,584 | 45,696 | ||||||
| Other |
31,064 | 45,502 | ||||||
|
|
|
|
|
|||||
| 6,008,767 | 6,232,134 | |||||||
| Less—current portion |
(37,462 | ) | (49,064 | ) | ||||
|
|
|
|
|
|||||
| $ | 5,971,305 | $ | 6,183,070 | |||||
|
|
|
|
|
|||||
On January 26, 2007, ARAMARK Corporation (i) entered into a $4.15 billion senior secured term loan facility with an original maturity date of January 26, 2014, (ii) issued $1.28 billion of 8.50% senior notes due 2015 (the “fixed rate notes”) and $500 million of senior floating rate notes due 2015 (the “floating rate notes”), (iii) entered into a $600 million senior secured revolving credit facility with an original six-year maturity, and (iv) entered into a synthetic letter of credit facility for up to $250 million (which was reduced to $200 million in January 2008).
On March 26, 2010, ARAMARK Corporation amended and restated its senior secured credit agreement (the “Restated Credit Agreement”). Among other things, the Restated Credit Agreement: (i) extended the maturity date of $1,407.4 million of ARAMARK Corporation’s U.S. denominated term loan and $92.6 million of the letter of credit deposits securing ARAMARK Corporation’s synthetic letter of credit facility to July 26, 2016, (ii) permitted future extensions and refinancings of the maturity date of ARAMARK Corporation’s term loans, letter of credit deposits and revolving credit commitments under the Restated Credit Agreement, (iii) established a sub-limit of $250 million for letters of credit under the Restated Credit Agreement’s revolving credit facility, and (iv) permitted ARAMARK Corporation to refinance term loans in the future with the proceeds of unsecured or secured notes issued by ARAMARK Corporation; provided that any such secured notes are subject to a customary first- or second-lien intercreditor agreement, as applicable. The Restated Credit Agreement increased the applicable margin with respect to the extended term loans to 3.25% for Eurocurrency borrowings and to 2.25% with respect to extended term loan base-rate borrowings. The Restated Credit Agreement also increased the applicable margin with respect to the extended letter of credit facility fees to 3.25%. Consenting lenders received a one-time amendment fee of approximately $1.9 million in the aggregate on their total loan commitments. During fiscal 2010, approximately $8.5 million of third-party costs directly attributable to the amendment were expensed and are included in “Interest and Other Financing Costs, net” in the Consolidated Statements of Income. Approximately $7.5 million of the third-party costs were paid to entities affiliated with GS Capital Partners and J.P. Morgan Partners.
On February 29, 2012, ARAMARK Corporation entered into Amendment Agreement No. 2 to the Restated Credit Agreement (the “Amendment Agreement No. 2”). The Amendment Agreement No. 2 extended the maturity date of an aggregate U.S. dollar equivalent of approximately $1,231.6 million of ARAMARK Corporation’s term loans and $66.7 million of letter of credit deposits securing ARAMARK Corporation’s synthetic letter of credit facility to July 26, 2016.
F-18
Table of Contents
The term loans extended include (i) $858.1 million of U.S. dollar denominated term loans borrowed by ARAMARK Corporation; (ii) ¥5,150.9 million of yen denominated term loans borrowed by ARAMARK Corporation; (iii) $75.4 million of U.S. dollar denominated term loans borrowed by a Canadian subsidiary of ARAMARK Corporation; (iv) €30.4 million of Euro denominated term loans borrowed by an Irish subsidiary of ARAMARK Corporation; (v) £82.3 million of sterling denominated term loans borrowed by a U.K. subsidiary of ARAMARK Corporation; and (vi) €46.1 million of Euro denominated term loans borrowed by German subsidiaries of ARAMARK Corporation. From and after the effective date of the Amendment Agreement No. 2, (A) the Eurocurrency rate margin and letter of credit fees with respect to the extended U.S. dollar denominated and Euro denominated term loans and letter of credit deposits increased 1.375% to 3.25%, (B) the margin on extended U.S. dollar denominated base-rate term loans increased 1.375% to 2.25% and (C) the margins on extended yen denominated term loans and sterling denominated term loans increased 1.375% to 3.375%. Consenting lenders received a one-time amendment fee of approximately $3.2 million in the aggregate on their total loan commitments. During fiscal 2012, approximately $7.5 million of third-party costs directly attributable to the amendment were expensed and are included in “Interest and Other Financing Costs, net” in the Consolidated Statements of Income. Approximately $4.5 million of the third-party costs were paid to entities affiliated with GS Capital Partners and J.P. Morgan Partners.
On April 18, 2011, ARAMARK Corporation entered into an Amendment Agreement to the Restated Credit Agreement (the “Amendment Agreement”) that extended, from January 2013 to January 2015, the maturity of, and increased, from $435 million to $500 million, the U.S. dollar denominated portion of its existing revolving credit facility. The other revolving credit facilities available to ARAMARK Corporation under its existing senior secured credit agreement, which total $165 million and are available in both U.S. dollars and other foreign currencies, were not extended and remain unchanged. Any commitments from existing lenders in the U.S. dollar facility that were not extended have been terminated, which resulted in a write-off of deferred financing fees of $2.1 million in fiscal 2011. Existing lenders that extended the U.S. dollar denominated portion of their existing revolving credit facility include entities affiliated with GS Capital Partners and J.P. Morgan Partners. As a result of the extension, ARAMARK Corporation’s aggregate revolver capacity under the senior secured credit agreement will be $665 million through January 2013 and $500 million from January 2013 through the January 2015 extended maturity date. From and after the effective date of the Amendment Agreement, borrowings under the new U.S. revolving facility have an applicable margin of 3.25% for Eurocurrency rate borrowings and 2.25% for base-rate borrowings. The new U.S. revolving facility has an unused commitment fee of 0.50% per annum. The maturity date of the U.S. revolving facility will accelerate from January 26, 2015 to October 26, 2013 if un-extended term loans in excess of $250 million remain outstanding on October 26, 2013. The un-extended term loans are due on January 26, 2014. All other terms are substantially similar to the terms of the existing revolving credit facilities. Commitment fees and third party costs directly attributable to the amendment were approximately $7.2 million in fiscal 2011, of which approximately $3.9 million were paid to entities affiliated with GS Capital Partners and J.P. Morgan Partners.
The Restated Credit Agreement, Amendment Agreement and Amendment Agreement No. 2 provide that if any of ARAMARK Corporation’s fixed rate notes or floating rate notes are outstanding on October 31, 2014, the maturity date of the term loans, letter of credit deposits and U.S. revolving facility shall be October 31, 2014. ARAMARK Corporation’s fixed rate notes and floating rate notes mature on February 1, 2015. The maturity date, interest margins and letter of credit fees for loans and letters of credits deposits that were not extended remain unchanged.
As of September 28, 2012, there was approximately $649.0 million available for borrowing on the credit facility.
Senior Secured Credit Facilities
The senior secured revolving credit facility consists of the following subfacilities:
| • | A revolving credit facility available for loans in U.S. dollars to ARAMARK Corporation with aggregate commitments of $500 million; |
| • | A revolving credit facility available for loans in sterling or U.S. dollars to ARAMARK Corporation or a U.K. subsidiary with aggregate commitments of $40 million; |
F-19
Table of Contents
| • | A revolving credit facility available for loans in Euros or U.S. dollars to ARAMARK Corporation or an Irish subsidiary with aggregate commitments of $20 million; |
| • | A revolving credit facility available for loans in Euros or U.S. dollars to ARAMARK Corporation or German subsidiaries with aggregate commitments of $30 million; and |
| • | A revolving credit facility available for loans in Canadian dollars or U.S. dollars to ARAMARK Corporation or a Canadian subsidiary with aggregate commitments of $75 million. |
The senior secured term loan facility consists of the following subfacilities as of September 28, 2012:
| • | A U.S. dollar denominated term loan to ARAMARK Corporation in the amount of $3,547 million ($475.6 million (un-extended) and $2,265.5 million (extended)); |
| • | A yen denominated term loan to ARAMARK Corporation in the amount of ¥5,422 million (¥5,110.3 million (extended)); |
| • | A U.S. dollar denominated term loan to a Canadian subsidiary in the amount of $170 million ($85.2 million (un-extended) and $75.5 million (extended)); |
| • | A Euro denominated term loan to an Irish subsidiary in an amount of €44 million (€11.1 million (un-extended) and €30.4 million (extended)); |
| • | A sterling denominated term loan to a U.K. subsidiary in an amount of £122 million (£32.7 million (un-extended) and £82.3 million (extended)); and |
| • | A Euro denominated term loan to German subsidiaries in the amount of €70 million (€17.9 million (un-extended) and €46.1 million (extended)). |
The senior secured credit facilities provide that ARAMARK Corporation has the right at any time to request up to $750 million of incremental commitments in the aggregate under one or more incremental term loan facilities and/or synthetic letter of credit facilities and/or revolving credit facilities and/or by increasing commitments under the revolving credit facility. ARAMARK Corporation’s ability to obtain extensions of credit under these incremental facilities or commitments will be subject to the same conditions as extensions of credit under the existing credit facilities. However, the lenders under these facilities will not be under any obligation to provide any such incremental facilities or commitments, and any such addition of or increase in facilities or commitments will be subject to pro forma compliance with an incurrence-based financial covenant and customary conditions precedent.
Borrowings under the senior secured credit facilities bear interest at a rate equal to an applicable margin plus, at ARAMARK Corporation’s option, either (a) a LIBOR rate determined by reference to the costs of funds for deposits in the currency of such borrowing for the interest period relevant to such borrowing adjusted for certain additional costs, (b) with respect to borrowings denominated in U.S. dollars, a base rate determined by reference to the higher of (1) the prime rate of the administrative agent, and (2) the federal funds rate plus 0.50% or (c) with respect to borrowings denominated in Canadian dollars, (1) a base rate determined by reference to the prime rate of Canadian banks or (2) a BA (bankers’ acceptance) rate determined by reference to the rate offered for bankers’ acceptances in Canadian dollars for the interest period relevant to such borrowing.
The applicable margin spread for borrowings under the un-extended revolving credit facility are 1.25% to 2.00% (as of September 28, 2012—1.75%) with respect to Eurocurrency borrowings and 0.25% to 1.00% (as of September 28, 2012—0.75%) with respect to base-rate borrowings.
The applicable margin spreads under the un-extended U.S. dollar term loan and Euro term loan facilities and the synthetic letter of credit facilities are 1.875% to 2.125% (as of September 28, 2012—1.875%) with respect to Eurocurrency borrowings and 0.875% to 1.125% (as of September 28, 2012—0.875%) with respect to base-rate borrowings. The applicable margin spreads under the un-extended sterling term loan facilities are 2.00% to 2.125% (as of September 28, 2012—2.00%).
F-20
Table of Contents
In addition to paying interest on outstanding principal under the senior secured credit facilities, ARAMARK Corporation is required to pay a commitment fee to the lenders under the revolving credit facility in respect of the unutilized commitments thereunder. The commitment fee rate ranges from 0.375% to 0.50% per annum (as of September 28, 2012—0.50%).
The actual spreads within all ranges referred to above are based on a ratio of Consolidated Secured Debt to EBITDA, each as defined in the senior secured credit agreement.
All obligations under the senior secured credit facilities are secured by a security interest in substantially all assets of ARAMARK Corporation and its U.S. subsidiaries.
The senior secured credit facilities require ARAMARK Corporation to prepay outstanding term loans, subject to certain exceptions, with (i) 50% of ARAMARK Corporation’s Excess Cash Flow if the Consolidated Capital Leverage Ratio is above 5.25x or 25% of ARAMARK Corporation’s Excess Cash Flow if the Consolidated Capital Leverage Ratio falls between 5.25x and 4.50x (as defined in the senior secured credit agreement) (the actual ratio at September 28, 2012 was 4.70x), (ii) 100% of the net cash proceeds of all nonordinary course asset sales or other dispositions of property subject to certain exceptions and customary reinvestment rights, and (iii) 100% of the net cash proceeds of any incurrence of debt, including debt incurred by any business securitization subsidiary in respect of any business securitization facility, but excluding proceeds from ARAMARK Corporation’s receivables facilities and other debt permitted under the senior secured credit agreement. Any mandatory prepayments would be applied to the term loan facilities as directed by ARAMARK Corporation. Generally, ARAMARK Corporation is permitted to voluntarily repay outstanding loans under the senior secured credit facilities at any time without premium or penalty, other than customary “breakage” costs with respect to LIBOR loans.
ARAMARK Corporation is required to repay the senior secured term loan facilities in quarterly principal amounts of 0.25% of the funded total principal amount, with the remaining amount payable on January 26, 2014 (un-extended) and July 26, 2016 (extended). In June 2010 and September 2010, ARAMARK Corporation made optional prepayments of outstanding un- extended U.S. dollar term loan of $150.0 million and $150.0 million, respectively. All required quarterly principal amounts of the U.S. dollar term loan have been prepaid through its maturities in January 2014 (un-extended).
Principal amounts outstanding under the synthetic letter of credit facility are due and payable in full at maturity, January 26, 2014 (un-extended) and July 26, 2016 (extended), on which day the commitments thereunder will terminate.
The senior secured credit agreement contains a number of covenants that, among other things, restrict, subject to certain exceptions, ARAMARK Corporation’s ability to: incur additional indebtedness; issue preferred stock or provide guarantees; create liens on assets; engage in mergers or consolidations; sell assets; pay dividends, make distributions or repurchase its capital stock; make investments, loans or advances; repay or repurchase any notes, except as scheduled or at maturity; create restrictions on the payment of dividends or other amounts to ARAMARK Corporation from its restricted subsidiaries; make certain acquisitions; engage in certain transactions with affiliates; amend material agreements governing ARAMARK Corporation’s outstanding notes (or any indebtedness that refinances the notes); and fundamentally change ARAMARK Corporation’s business. In addition, the senior secured revolving credit facility requires ARAMARK Corporation to maintain a maximum senior secured leverage ratio and imposes limitations on capital expenditures. The senior secured credit agreement also contains certain customary affirmative covenants, such as financial and other reporting, and certain events of default. At September 28, 2012, ARAMARK Corporation was in compliance with all of these covenants.
The senior secured credit agreement requires ARAMARK Corporation to maintain a maximum Consolidated Secured Debt Ratio, defined as consolidated total indebtedness secured by a lien to Covenant Adjusted EBITDA, of 5.875x, being reduced over time to 4.25x by the end of 2013 (as of September 28, 2012—4.50x). Consolidated total
F-21
Table of Contents
indebtedness secured by a lien is defined in the senior secured credit agreement as total indebtedness outstanding under the senior secured credit agreement, capital leases, advances under the Receivables Facility and any other indebtedness secured by a lien reduced by the lesser of the amount of cash and cash equivalents on the consolidated balance sheet that is free and clear of any lien and $75 million. Non-compliance with the maximum Consolidated Secured Debt Ratio could result in the requirement to immediately repay all amounts outstanding under such agreement, which, if ARAMARK Corporation’s revolving credit facility lenders failed to waive any such default, would also constitute a default under the indenture. The actual ratio at September 28, 2012 was 3.11x.
The senior secured credit agreement establishes an incurrence-based minimum Interest Coverage Ratio, defined as Covenant Adjusted EBITDA to consolidated interest expense, the achievement of which is a condition for ARAMARK Corporation to incur additional indebtedness and to make certain restricted payments. The minimum Interest Coverage Ratio is 2.00x for the term of the senior secured credit agreement. If ARAMARK Corporation does not maintain this minimum Interest Coverage Ratio calculated on a pro forma basis for any such additional indebtedness or restricted payments, it could be prohibited from being able to incur additional indebtedness, other than the additional funding provided for under the senior secured credit agreement and pursuant to specified exceptions, and make certain restricted payments, other than pursuant to certain exceptions. Consolidated interest expense is defined in the senior secured credit agreement as consolidated interest expense excluding interest income, adjusted for acquisitions and dispositions, further adjusted for certain non-cash or nonrecurring interest expense and ARAMARK Corporation’s estimated share of interest expense from one equity method investee. The actual ratio was 2.97x for the twelve months ended September 28, 2012.
8.625% / 9.375% Senior Notes due 2016
On April 18, 2011, the Company completed a private placement of $600 million, net of a 1% discount, in aggregate principal amount of 8.625% / 9.375% Senior Notes due 2016 (the “Notes”). Interest on the Notes accrues at the rate of 8.625% per annum with respect to interest payments made in cash and 9.375% per annum with respect to any payment in-kind interest. The Notes are obligations of the Company, are not guaranteed by ARAMARK Corporation and its subsidiaries and are structurally subordinated to all existing and future indebtedness and other liabilities of ARAMARK Corporation and its subsidiaries, including trade payables, the senior secured revolving credit facility, the senior secured term loan facility, the fixed rate notes and the floating rate notes. The Company is obligated to pay interest on the Notes in cash to the extent ARAMARK Corporation has sufficient capacity to distribute such amounts to the Company under the covenants relating to ARAMARK Corporation’s outstanding indebtedness, including the senior secured revolving credit facility, the senior secured term loan facility, the fixed rate notes and the floating rate notes. If ARAMARK Corporation does not have sufficient covenant capacity to distribute such amounts to the Company, the Company will have the ability to pay the interest on the Notes through the issuance of additional notes.
The Company used the net proceeds from the offering of the Notes, along with $132.7 million in borrowings by ARAMARK Corporation under the extended U.S. dollar revolving credit facility, to pay an approximately $711 million dividend ($3.50 per share) to the Company’s stockholders and to pay fees and expenses related to the issuance of the Notes. Third party costs directly attributable to the Notes were approximately $14.6 million, of which approximately $8.3 million were paid to entities affiliated with GS Capital Partners and J.P. Morgan Partners.
8.50% Senior Notes due 2015 and Senior Floating Rate Notes due 2015
The floating rate notes bear interest equal to three-month LIBOR (as defined in the indenture) plus a spread of 3.50%.
The fixed rate notes and floating rate notes are senior unsecured obligations of ARAMARK Corporation.
ARAMARK Corporation may redeem some or all of the fixed rate notes at any time on or after February 1, 2011 and some or all of the floating rate notes at any time, in each case at varying redemption prices that are stated in the indenture and generally include premiums.
F-22
Table of Contents
If ARAMARK Corporation experiences specific kinds of “changes in control,” it will be required to make an offer to purchase the fixed rate notes and floating rate notes at a purchase price of 101% of the principal amount thereof, plus accrued and unpaid interest to the purchase date. If ARAMARK Corporation sells assets under certain circumstances, it will be required to make an offer to purchase the fixed rate notes and floating rate notes at a purchase price of 100% of the principal amount thereof, plus accrued and unpaid interest to the purchase date.
The indenture governing the fixed rate notes and the floating rate notes restricts ARAMARK Corporation’s ability to, among other things, incur additional indebtedness, pay dividends and make certain other distributions, investments and other restricted payments. As of September 28, 2012, ARAMARK Corporation was in compliance with the covenants of the indenture.
5.00% Senior Notes due 2012
ARAMARK Corporation’s 5.00% senior notes, contractually due in June 2012, were paid in full during fiscal 2012.
At September 28, 2012, annual maturities on long-term borrowings maturing in the next five fiscal years and thereafter (excludes the $4.5 million discount on the Notes and presumes repayment of the fixed rate notes and the floating rate notes by October 31, 2014 and the extended $2.6 billion U.S. and non-U.S. denominated term loan on July 26, 2016) are as follows (in thousands):
| 2013 |
$ | 37,462 | ||
| 2014 |
$ | 682,846 | ||
| 2015 |
$ | 2,081,714 | ||
| 2016 |
$ | 3,200,283 | ||
| 2017 |
$ | 4,679 | ||
| Thereafter |
$ | 6,297 |
The components of interest and other financing costs, net, are summarized as follows (in thousands):
| Fiscal Year Ended September 28, 2012 |
Fiscal Year Ended September 30, 2011 |
Fiscal Year Ended October 1, 2010 |
||||||||||
| Interest expense |
$ | 459,083 | $ | 466,140 | $ | 449,002 | ||||||
| Interest income |
(5,477 | ) | (18,653 | ) | (7,318 | ) | ||||||
| Other financing costs |
3,201 | 3,633 | 2,826 | |||||||||
|
|
|
|
|
|
|
|||||||
| Total |
$ | 456,807 | $ | 451,120 | $ | 444,510 | ||||||
|
|
|
|
|
|
|
|||||||
NOTE 6. DERIVATIVE INSTRUMENTS:
The Company enters into contractual derivative arrangements to manage changes in market conditions related to interest on debt obligations, foreign currency exposures and exposure to fluctuating natural gas, gasoline and diesel fuel prices. Derivative instruments utilized during the period include interest rate swap agreements, foreign currency forward exchange contracts, and natural gas, gasoline and diesel fuel agreements. All derivative instruments are recognized as either assets or liabilities on the balance sheet at fair value at the end of each quarter. The counterparties to the Company’s contractual derivative agreements are all major international financial institutions. The Company is exposed to credit loss in the event of nonperformance by these counterparties. The Company continually monitors its positions and the credit ratings of its counterparties, and does not anticipate nonperformance by the counterparties. For designated hedging relationships, the Company formally documents the hedging relationship and its risk management objective and strategy for undertaking the hedge, the hedging instrument, the hedged item, the nature of the risk being hedged, how the
F-23
Table of Contents
hedging instrument’s effectiveness in offsetting the hedged risk will be assessed prospectively and retrospectively, and a description of the method of measuring ineffectiveness. The Company also formally assesses, both at the hedge’s inception and on an ongoing basis, whether the derivatives that are used in hedging transactions are highly effective in offsetting cash flows of hedged items.
Cash Flow Hedges
The Company has entered into $1.0 billion of interest rate swap agreements, fixing the rate on a like amount of variable rate borrowings. During fiscal 2012, $2.3 billion and ¥5.0 billion of interest rate swap agreements matured. Changes in the fair value of a derivative that is designated as and meets all the required criteria for a cash flow hedge are recorded in accumulated other comprehensive income (loss) and reclassified into earnings as the underlying hedged item affects earnings. As of September 28, 2012 and September 30, 2011, approximately ($28.1) million and ($56.3) million of unrealized net of tax losses related to the interest rate swaps were included in “Accumulated other comprehensive loss,” respectively. The hedge ineffectiveness for these cash flow hedging instruments during fiscal 2012, fiscal 2011 and fiscal 2010 was immaterial.
The Company previously entered into a $169.6 million amortizing cross currency swap to mitigate the risk of variability in principal and interest payments on the Canadian subsidiary’s variable rate debt denominated in U.S. dollars. The agreement fixes the rate on the variable rate borrowings and mitigates changes in the Canadian dollar/U.S. dollar exchange rate. In March 2012, the cross currency swap was amended to match the terms of the Canadian subsidiary’s debt that was impacted by the Amendment Agreement No. 2. A portion of the swap was amended and extended to match the terms related to its variable rate debt denominated in U.S. dollars that was extended under Amendment Agreement No. 2. The Company has designated the swaps as cash flow hedges. During fiscal 2012 and fiscal 2011, approximately ($8.1) million and $1.8 million of unrealized net of tax gains (losses) related to the swap were added to “Accumulated other comprehensive loss,” respectively. Approximately $10.0 million and ($3.8) million were reclassified to offset net translation gains (losses) on the foreign currency denominated debt during fiscal 2012 and fiscal 2011, respectively. As of September 28, 2012 and September 30, 2011, unrealized net of tax losses of approximately ($5.0) million and ($10.6) million related to the cross currency swap were included in “Accumulated other comprehensive loss,” respectively. As a result of amending the cross currency swap, the hedge ineffectiveness for fiscal 2012 was approximately $3.6 million, which is recorded in “Interest and Other Financing Costs, net”. The Company expects the hedge to be highly effective in future periods. The hedge ineffectiveness for this cash flow hedging instrument during fiscal 2011 and fiscal 2010 was immaterial.
The Company previously entered into a series of pay fixed/receive floating natural gas hedge agreements based on a NYMEX price in order to limit its exposure to price increases for natural gas, primarily in the Uniform and Career Apparel segment. As of September 28, 2012, the Company has no natural gas contracts outstanding. As of September 28, 2012 and September 30, 2011, approximately $0 and ($0.1) million of unrealized net of tax losses, respectively, were recorded in “Accumulated other comprehensive loss” for these contracts. There was no hedge ineffectiveness for fiscal 2012, fiscal 2011 and fiscal 2010.
The following table summarizes the net of tax effect of our derivatives designated as cash flow hedging instruments on Comprehensive Income (in thousands):
| Fiscal Year Ended September 28, 2012 |
Fiscal Year Ended September 30, 2011 |
Fiscal Year Ended October 1, 2010 |
||||||||||
| Interest rate swap agreements |
$ | 28,147 | $ | 58,082 | $ | 13,749 | ||||||
| Cross currency swap agreements |
5,580 | (1,956 | ) | (224 | ) | |||||||
| Natural gas hedge agreements |
113 | (21 | ) | 536 | ||||||||
| Gasoline and diesel fuel agreements |
— | (1,232 | ) | 1,191 | ||||||||
|
|
|
|
|
|
|
|||||||
| $ | 33,840 | $ | 54,873 | $ | 15,252 | |||||||
|
|
|
|
|
|
|
|||||||
F-24
Table of Contents
Derivatives not Designated in Hedging Relationships
The Company entered into a series of pay fixed/receive floating gasoline and diesel fuel agreements based on the Department of Energy weekly retail on-highway index in order to limit its exposure to price fluctuations for gasoline and diesel fuel. As of September 28, 2012, the Company has contracts for approximately 4.2 million gallons outstanding for fiscal 2013. During fiscal 2012, the Company entered into contracts totaling approximately 5.3 million gallons. Prior to October 1, 2011, all outstanding contracts were designated as cash flow hedging instruments; therefore, changes in the fair value of these contracts were recorded in accumulated other comprehensive income (loss) and reclassified into earnings as the underlying hedged item affects earnings. Beginning in the first quarter of fiscal 2012, the Company no longer records its gasoline and diesel fuel agreements as hedges for accounting purposes. As a result, on a prospective basis, changes in the fair value of these contracts are recorded in earnings. Amounts previously recorded in accumulated other comprehensive income (loss) were reclassified into earnings as the underlying item affected earnings. During fiscal 2012, the Company recorded a pretax gain of $0.7 million in the Consolidated Statements of Income for the change in the fair value on these agreements. As of September 28, 2012 and September 30, 2011, unrealized net of tax losses of approximately $0 and ($1.1) million were recorded in “Accumulated other comprehensive loss” for these contracts, respectively. The hedge ineffectiveness for the gasoline and diesel fuel hedging instruments for fiscal 2011 and fiscal 2010 was immaterial.
As of September 28, 2012, the Company had foreign currency forward exchange contracts outstanding with notional amounts of €61.6 million, £18.0 million, kr.22.0 million and CAD79.0 million to mitigate the risk of changes in foreign currency exchange rates on short-term intercompany loans to certain international subsidiaries. Gains and losses on these foreign currency exchange contracts are recognized in income as the contracts were not designated as hedging instruments, substantially offsetting currency transaction gains and losses on the short term intercompany loans.
The following table summarizes the location and fair value, using Level 2 inputs, of the Company’s derivatives designated and not designated as hedging instruments in the Consolidated Balance Sheets (in thousands):
| Balance Sheet Location | September 28, 2012 | September 30, 2011 | ||||||||
| ASSETS |
||||||||||
| Not designated as hedging instruments: |
||||||||||
| Foreign currency forward exchange contracts |
Prepayments | $ | 251 | $ | 2,856 | |||||
| Gasoline and diesel fuel agreements |
Prepayments | 696 | — | |||||||
|
|
|
|
|
|||||||
| $ | 947 | $ | 2,856 | |||||||
|
|
|
|
|
|||||||
| LIABILITIES |
||||||||||
| Designated as hedging instruments: |
||||||||||
| Natural gas hedge agreements |
Accounts Payable | $ | — | $ | 187 | |||||
| Gasoline and diesel fuel agreements |
Accounts Payable | — | 1,894 | |||||||
| Interest rate swap agreements |
Accrued Expenses | — | 49,349 | |||||||
| Interest rate swap agreements |
Other Noncurrent Liabilities | 46,484 | 44,054 | |||||||
| Cross currency swap agreements |
Other Noncurrent Liabilities | 45,406 | 35,551 | |||||||
|
|
|
|
|
|||||||
| $ | 91,890 | $ | 131,035 | |||||||
|
|
|
|
|
|||||||
F-25
Table of Contents
The following table summarizes the location of (gain) loss reclassified from “Accumulated other comprehensive loss” into earnings for derivatives designated as hedging instruments and the location of (gain) loss for our derivatives not designated as hedging instruments in the Consolidated Statements of Income (in thousands):
| Account | Fiscal
Year Ended September 28, 2012 |
Fiscal
Year Ended September 30, 2011 |
Fiscal
Year Ended October 1, 2010 |
|||||||||||
| Designated as hedging instruments: |
||||||||||||||
| Interest rate swap agreements |
Interest Expense | $ | 66,260 | $ | 123,739 | $ | 132,787 | |||||||
| Cross currency swap agreements |
Interest Expense | 8,077 | 8,960 | 11,763 | ||||||||||
| Natural gas hedge agreements |
Cost of services provided | 396 | 158 | 1,961 | ||||||||||
| Gasoline and diesel fuel agreements |
Cost of services provided | — | (2,289 | ) | 2,192 | |||||||||
|
|
|
|
|
|
|
|||||||||
| $ | 74,733 | $ | 130,568 | $ | 148,703 | |||||||||
|
|
|
|
|
|
|
|||||||||
| Not designated as hedging instruments: |
||||||||||||||
| Gasoline and diesel fuel agreements |
Cost of services provided | $ | 24 | $ | — | $ | — | |||||||
| Foreign currency forward exchange contracts |
Interest Expense | (265 | ) | (1,586 | ) | (5,812 | ) | |||||||
|
|
|
|
|
|
|
|||||||||
| (241 | ) | (1,586 | ) | (5,812 | ) | |||||||||
|
|
|
|
|
|
|
|||||||||
| $ | 74,492 | $ | 128,982 | $ | 142,891 | |||||||||
|
|
|
|
|
|
|
|||||||||
As part of the 2007 Transaction, the Company entered into a Japanese yen denominated term loan in the amount of ¥5,422 million (see Note 5). The term loan was designated as a hedge of the Company’s net Japanese currency exposure represented by the equity investment in our Japanese affiliate, AIM Services Co., Ltd.
At September 28, 2012, the net of tax loss expected to be reclassified from “Accumulated other comprehensive loss” into earnings over the next twelve months based on current market rates is approximately $20.2 million.
NOTE 7. EMPLOYEE PENSION AND PROFIT SHARING PLANS:
In the United States, the Company maintains qualified contributory and non-contributory defined contribution retirement plans for eligible employees, with Company contributions to the plans based on earnings performance or salary level. The Company also has a non-qualified retirement savings plan for certain employees. The total expense of the above plans for fiscal 2012, fiscal 2011 and fiscal 2010 was $29.5 million, $31.5 million and $26.1 million, respectively. Additionally, the Company maintains several contributory and non-contributory defined benefit pension plans, primarily in Canada and the United Kingdom.
The following table sets forth the components of net periodic pension cost for the Company’s single-employer defined benefit pension plans for fiscal 2012, fiscal 2011 and fiscal 2010 (in thousands):
| Fiscal
Year Ended September 28, 2012 |
Fiscal
Year Ended September 30, 2011 |
Fiscal
Year Ended October 1, 2010 |
||||||||||
| Service cost |
$ | 9,961 | $ | 10,310 | $ | 8,308 | ||||||
| Interest cost |
13,001 | 13,086 | 11,769 | |||||||||
| Expected return on plan assets |
(12,521 | ) | (12,738 | ) | (10,577 | ) | ||||||
| Settlements |
467 | 704 | 1,066 | |||||||||
| Amortization of prior service cost |
6 | 6 | 6 | |||||||||
| Recognized net (gain) loss |
2,392 | 1,608 | 1,234 | |||||||||
|
|
|
|
|
|
|
|||||||
| Net periodic pension cost |
$ | 13,306 | $ | 12,976 | $ | 11,806 | ||||||
|
|
|
|
|
|
|
|||||||
F-26
Table of Contents
The following table set forth changes in the projected benefit obligation and the fair value of plan assets for these plans (in thousands):
| September 28, 2012 | September 30, 2011 | |||||||
| Change in benefit obligation: |
||||||||
| Benefit obligation, beginning |
$ | 244,754 | $ | 239,103 | ||||
| Foreign currency translation |
14,056 | (6,426 | ) | |||||
| Service cost |
9,961 | 10,310 | ||||||
| Interest cost |
13,001 | 13,086 | ||||||
| Employee contributions |
3,565 | 3,619 | ||||||
| Actuarial loss (gain) |
34,227 | (4,532 | ) | |||||
| Benefits paid |
(11,699 | ) | (8,151 | ) | ||||
| Settlements and curtailments |
(1,055 | ) | (2,255 | ) | ||||
|
|
|
|
|
|||||
| Benefit obligation, end |
$ | 306,810 | $ | 244,754 | ||||
|
|
|
|
|
|||||
| Change in plan assets: |
||||||||
| Fair value of plan assets, beginning |
$ | 178,587 | $ | 175,943 | ||||
| Foreign currency translation |
9,866 | (4,350 | ) | |||||
| Employer contributions |
20,558 | 16,375 | ||||||
| Employee contributions |
3,565 | 3,619 | ||||||
| Actual return on plan assets |
22,601 | (2,594 | ) | |||||
| Benefits paid |
(11,699 | ) | (8,151 | ) | ||||
| Settlements |
(1,206 | ) | (2,255 | ) | ||||
|
|
|
|
|
|||||
| Fair value of plan assets, end |
$ | 222,272 | $ | 178,587 | ||||
|
|
|
|
|
|||||
|
|
|
|
|
|||||
| Funded Status at end of year |
$ | (84,538 | ) | $ | (66,167 | ) | ||
|
|
|
|
|
|||||
Amounts recognized in the Consolidated Balance Sheets consist of the following (in thousands):
| September 28, 2012 | September 30, 2011 | |||||||
| Current benefit liability (included in Accrued expenses and other current liabilities) |
$ | (484 | ) | $ | (188 | ) | ||
| Noncurrent benefit liability (included in Other Noncurrent Liabilities) |
$ | (84,054 | ) | $ | (65,979 | ) | ||
| Net actuarial loss (gain) (included in Accumulated other comprehensive (income) loss before taxes) |
$ | 77,391 | $ | 52,526 | ||||
| Prior service cost (included in Accumulated other comprehensive (income) loss before taxes) |
$ | 52 | $ | 63 | ||||
The settlements in both fiscal years primarily relate to the lump sum payments made to employees in the Company’s Korean pension plan.
The following weighted average assumptions were used to determine pension expense of the respective fiscal years:
| September 28, 2012 | September 30, 2011 | |||||||
| Discount rate |
5.0 | % | 5.2 | % | ||||
| Rate of compensation increase |
3.5 | % | 3.5 | % | ||||
| Long-term rate of return on assets |
6.6 | % | 6.8 | % | ||||
The following weighted average assumptions were used to determine the funded status of the respective fiscal years:
| September 28, 2012 | September 30, 2011 | |||||||
| Discount rate |
4.2 | % | 5.0 | % | ||||
| Rate of compensation increase |
3.4 | % | 3.5 | % | ||||
F-27
Table of Contents
Assumptions are adjusted annually, as necessary, based on prevailing market conditions and actual experience.
The accumulated benefit obligation as of September 28, 2012 was $279.4 million. During fiscal 2012, actuarial losses of approximately $22.8 million and settlement gains of $0.3 million were recognized in other comprehensive loss (before taxes) and $0.6 million of amortization of actuarial losses was recognized as net periodic pension cost during such period. The estimated portion of net actuarial loss included in accumulated other comprehensive income (loss) as of September 28, 2012 expected to be recognized in net periodic pension cost during fiscal 2013 is approximately $3.6 million (before taxes).
The accumulated benefit obligation as of September 30, 2011 was $205.5 million. During fiscal 2011, actuarial losses of approximately $9.8 million and settlement gains of $0.7 million were recognized in other comprehensive loss (before taxes) and $0.9 million of amortization of actuarial losses was recognized as net periodic pension cost during such period. The estimated portion of net actuarial loss included in accumulated other comprehensive income (loss) as of September 30, 2011 expected to be recognized in net periodic pension cost during fiscal 2012 is approximately $2.3 million (before taxes).
The following table sets forth information for the Company’s single-employer pension plans with an accumulated benefit obligation in excess of plan assets as of September 28, 2012 and September 30, 2011 (in thousands):
| September 28, 2012 | September 30, 2011 | |||||||
| Projected benefit obligation |
$ | 302,072 | $ | 244,754 | ||||
| Accumulated benefit obligation |
274,701 | 205,537 | ||||||
| Fair value of plan assets |
217,044 | 178,587 | ||||||
Assets of the plans are invested with the goal of principal preservation and enhancement over the long-term. The primary goal is total return, consistent with prudent investment management. The Company’s investment policies also require an appropriate level of diversification across the asset categories. The current overall capital structure and targeted ranges for asset classes are 50-70% invested in equity securities and 30-50% invested in debt securities. Performance of the plans is monitored on a regular basis and adjustments of the asset allocations are made when deemed necessary.
The weighted-average long-term rate of return on assets has been determined based on an estimated weighted-average of long-term returns of major asset classes, taking into account historical performance of plan assets, the current interest rate environment, plan demographics, acceptable risk levels and the estimated value of active asset management.
The fair value of plan assets for the Company’s defined benefit pension plans as of September 28, 2012 and September 30, 2011 is as follows (see Note 14 for a description of the fair value levels) (in thousands):
| September 28, 2012 | Quoted prices in active markets Level 1 |
Significant other observable inputs Level 2 |
Significant unobservable inputs Level 3 |
|||||||||||||
| Cash and cash equivalents and other |
$ | 2,042 | $ | 2,042 | $ | — | $ | — | ||||||||
| Investment funds: |
||||||||||||||||
| Pooled funds—equity |
141,784 | — | 141,784 | — | ||||||||||||
| Pooled funds—fixed income |
78,446 | — | 78,446 | — | ||||||||||||
|
|
|
|
|
|
|
|
|
|||||||||
| Total |
$ | 222,272 | $ | 2,042 | $ | 220,230 | $ | — | ||||||||
|
|
|
|
|
|
|
|
|
|||||||||
F-28
Table of Contents
| September 30, 2011 | Quoted prices in active markets Level 1 |
Significant other observable inputs Level 2 |
Significant unobservable inputs Level 3 |
|||||||||||||
| Cash and cash equivalents and other |
$ | 1,610 | $ | 1,610 | $ | — | $ | — | ||||||||
| Investment funds: |
||||||||||||||||
| Pooled funds—equity |
104,168 | — | 104,168 | — | ||||||||||||
| Pooled funds—fixed income |
72,809 | — | 72,809 | — | ||||||||||||
|
|
|
|
|
|
|
|
|
|||||||||
| Total |
$ | 178,587 | $ | 1,610 | $ | 176,977 | $ | — | ||||||||
|
|
|
|
|
|
|
|
|
|||||||||
The fair value of the pooled separate accounts is based on the value of the underlying assets, as reported to the Plan by the trustees. The pooled separate account is comprised of a portfolio of underlying securities that can be valued on active markets. Fair value is calculated by applying the Plan’s percentage ownership in the pooled separate account to the total market value of the account’s underlying securities, and is therefore categorized as Level 2 as the Plan does not directly own shares in these underlying investments. Investments in equity securities include publicly-traded domestic (approximately 31%) and international (approximately 69%) companies that are diversified across industry, country and stock market capitalization. Investments in fixed income securities include domestic (approximately 11%) and international (approximately 89%) corporate bonds and government securities. Cash and cash equivalents include direct cash holdings, which are valued based on cost, and short-term deposits and investments in money market funds for which fair value measurements are all based on quoted prices for similar assets or liabilities in markets that are not active.
It is the Company’s policy to fund at least the minimum required contributions as outlined in the required statutory actuarial valuation for each plan. The following table sets forth the benefits expected to be paid in the next five fiscal years and in aggregate for the five fiscal years thereafter by the Company’s defined benefit pension plans (in thousands):
| Fiscal 2013 |
$ | 11,683 | ||
| Fiscal 2014 |
$ | 11,141 | ||
| Fiscal 2015 |
$ | 10,850 | ||
| Fiscal 2016 |
$ | 11,313 | ||
| Fiscal 2017 |
$ | 11,890 | ||
| Fiscal 2018 – 2022 |
$ | 64,349 |
The estimated benefit payments above are based on assumptions about future events. Actual benefit payments may vary significantly from these estimates.
The expected contributions to be paid to the Company’s defined benefit pension plans during fiscal 2013 are approximately $20.8 million.
Multiemployer Defined Benefit Pension Plans
The Company contributes to a number of multiemployer defined benefit pension plans under the terms of collective-bargaining agreements (“CBA”) that cover its union-represented employees. The risks of participating in these multiemployer plans are different from single-employer plans in the following respects:
a. Assets contributed to the multiemployer plan by one employer may be used to provide benefits to employees of other participating employers.
b. If a participating employer stops contributing to the plan, the unfunded obligations of the plan may be borne by the remaining participating employers.
c. If the Company chooses to stop participating in some of its multiemployer plans, the Company may be required to pay those plans an amount based on the underfunded status of the plan, referred to as a withdrawal liability.
F-29
Table of Contents
The Company’s participation in these plans for fiscal 2012 is outlined in the table below. The “EIN/Pension Plan Number” column provides the Employee Identification Number (EIN) and the three-digit plan number, if applicable. Unless otherwise noted, the most recent Pension Protection Act (PPA) zone status available in 2012 and 2011 is for the plans’ two most recent fiscal year-ends. The zone status is based on information that the Company received from the plan and is certified by the plan’s actuary. Among other factors, plans in the red zone are generally less than 65 percent funded, plans in the yellow zone are less than 80 percent funded, and plans in the green zone are at least 80 percent funded. The “FIP/RP Status Pending/Implemented” column indicates plans for which a financial improvement plan (FIP) or a rehabilitation plan (RP) is either pending or has been implemented. The last column lists the expiration date(s) of the CBA(s) to which the plans are subject. There have been no significant changes that affect the comparability of fiscal 2012, fiscal 2011 and fiscal 2010 contributions.
| Pension Fund |
EIN/Pension Plan Number |
Pension Protection Act Zone Status |
FIP/RP Status Pending/ Implemented |
Contributions by the Company (in thousands) |
Surcharge Imposed |
Range of Expiration Dates of CBAs | ||||||||||||||||||||
| 2012 | 2011 | 2012 | 2011 | 2010 | ||||||||||||||||||||||
| National Retirement Fund |
13-6130178/ 001 | Red | Red | Implemented | $ | 4,868 | $ | 5,367 | $ | 5,672 | No | 5/31/2010- 11/30/2014 | ||||||||||||||
| Service Employees Pension Fund of Upstate New York(1) |
16-0908576/ 001 | Red | Red | Implemented | 247 | 385 | 277 | No | 9/30/2014- 6/30/2015 | |||||||||||||||||
| Local 1102 Retirement Trust(2) |
13-1847329/ 001 | Red | Red | Implemented | 201 | 232 | 211 | No | 6/30/2013- 6/30/2015 | |||||||||||||||||
| Central States SE and SW Areas Pension Plan |
36-6044243/ 001 | Red | Red | Implemented | 3,164 | 2,869 | 2,758 | No | 1/31/2007- 11/26/2015 | |||||||||||||||||
| Pension Plan for Hospital & Health Care Employees Philadelphia & Vicinity |
23-2627428/ 001 | Red | Red | Implemented | 154 | 122 | 240 | No | 1/31/2013 | |||||||||||||||||
| Richmond Teamsters and Industry Pension Fund(3) |
54-6056180/ 001 | Green | Green | N/A | 121 | 109 | 98 | No | 1/26/2016 | |||||||||||||||||
| Other funds |
13,546 | 12,785 | 11,629 | |||||||||||||||||||||||
|
|
|
|
|
|
|
|||||||||||||||||||||
| Total contributions |
$ | 22,301 | $ | 21,869 | $ | 20,885 | ||||||||||||||||||||
|
|
|
|
|
|
|
|||||||||||||||||||||
| (1) | Over 60% of the Company’s participants in this fund are covered by a single CBA that expires on 6/30/2015. |
| (2) | Over 90% of the Company’s participants in this fund are covered by a single CBA that expires on 6/30/2015. |
| (3) | The Company is one of two participants in this fund along with Hostess Brands Inc., which is currently in bankruptcy. Additionally, the fund has informed the Company that the fund exercised an automatic 5-year amortization extension that affected the calculation of the fund’s PPA zone status. |
The Company provided more than 5 percent of the total contributions for the following plans and plan years:
| Pension Fund |
Contributions to the plan exceeded more than 5% of total contributions (as of the plan’s year-end) | |
| Local 1102 Retirement Trust |
12/31/ 2011 and 12/31/2010 | |
| Service Employees Pension Fund of Upstate New York |
12/31/ 2011 and 12/31/2010 | |
| Richmond Teamsters and Industry Pension Fund |
2/28/2011 and 2/28/2010 |
At the date the Company’s financial statements were issued, Forms 5500 were not available for the plan years ending in 2012.
NOTE 8. INCOME TAXES:
The Company accounts for income taxes using the asset and liability method. Under this method, the provision for income taxes represents income taxes payable or refundable for the current year plus the change in deferred taxes during the year. Deferred taxes result from differences between the financial and tax bases of the
F-30
Table of Contents
Company’s assets and liabilities and are adjusted for changes in tax rates and tax laws when changes are enacted. Valuation allowances are recorded to reduce deferred tax assets when it is more likely than not that a tax benefit will not be realized. Interest and penalties related to income tax matters are included in the provision for income taxes.
The components of income from continuing operations before income taxes by source of income are as follows (in thousands):
| Fiscal
Year Ended September 28, 2012 |
Fiscal
Year Ended September 30, 2011 |
Fiscal
Year Ended October 1, 2010 |
||||||||||
| United States |
$ | 34,498 | $ | (16,162 | ) | $ | (63,122 | ) | ||||
| Non-U.S. |
90,470 | 112,131 | 96,108 | |||||||||
|
|
|
|
|
|
|
|||||||
| $ | 124,968 | $ | 95,969 | $ | 32,986 | |||||||
|
|
|
|
|
|
|
|||||||
The provision (benefit) for income taxes consists of (in thousands):
| Fiscal
Year Ended September 28, 2012 |
Fiscal
Year Ended September 30, 2011 |
Fiscal
Year Ended October 1, 2010 |
||||||||||
| Current: |
||||||||||||
| Federal |
$ | 45,173 | $ | (1,493 | ) | $ | 10,722 | |||||
| State and local |
7,205 | 8,494 | 8,325 | |||||||||
| Non-U.S. |
32,301 | 34,356 | 29,037 | |||||||||
|
|
|
|
|
|
|
|||||||
| $ | 84,679 | $ | 41,357 | $ | 48,084 | |||||||
|
|
|
|
|
|
|
|||||||
| Deferred: |
||||||||||||
| Federal |
$ | (42,515 | ) | $ | (22,885 | ) | $ | (31,125 | ) | |||
| State and local |
(11,189 | ) | (8,946 | ) | (9,300 | ) | ||||||
| Non-U.S. |
(12,909 | ) | (10,260 | ) | (6,996 | ) | ||||||
|
|
|
|
|
|
|
|||||||
| (66,613 | ) | (42,091 | ) | (47,421 | ) | |||||||
|
|
|
|
|
|
|
|||||||
| $ | 18,066 | $ | (734 | ) | $ | 663 | ||||||
|
|
|
|
|
|
|
|||||||
The provision for income taxes varies from the amount determined by applying the United States Federal statutory rate to pretax income as a result of the following (all percentages are as a percentage of pretax income):
| Fiscal
Year Ended September 28, 2012 |
Fiscal
Year Ended September 30, 2011 |
Fiscal
Year Ended October 1, 2010 |
||||||||||
| United States statutory income tax rate |
35.0 | % | 35.0 | % | 35.0 | % | ||||||
| Increase (decrease) in taxes, resulting from: |
||||||||||||
| State income taxes, net of Federal tax benefit |
0.5 | 2.1 | (2.7 | ) | ||||||||
| Foreign taxes |
(9.8 | ) | (10.7 | ) | (24.2 | ) | ||||||
| Permanent book/tax differences |
(0.6 | ) | 1.2 | 2.2 | ||||||||
| Uncertain tax positions |
(1.8 | ) | (17.7 | ) | 7.2 | |||||||
| Tax credits & other |
(8.8 | ) | (10.7 | ) | (15.5 | ) | ||||||
|
|
|
|
|
|
|
|||||||
| Effective income tax rate |
14.5 | % | (0.8 | )% | 2.0 | % | ||||||
|
|
|
|
|
|
|
|||||||
The effective tax rate is based on expected income, statutory tax rates and tax planning opportunities available to the Company in the various jurisdictions in which it operates. Judgment is required in determining the effective tax rate and in evaluating the Company’s tax positions. The Company establishes reserves when, despite the belief that the Company’s tax return positions are supportable, the Company believes that certain positions are likely to be challenged and that the Company may not succeed. The Company adjusts these reserves
F-31
Table of Contents
in light of changing facts and circumstances, such as the progress of a tax audit. The effective tax rate includes the impact of reserve provisions and changes to the reserve that the Company considers appropriate, as well as related interest and penalties. During fiscal 2011, the Company recorded a reduction of approximately $17.0 million related to the remeasurement of an uncertain tax position. The Tax Relief, Unemployment Insurance Reauthorization, and Job Creation Act of 2010 was enacted on December 17, 2010. Under the Act, the Empowerment Zones and non-veteran targeted groups under the Work Opportunity Tax Credit were extended until December 31, 2011. The expiration of the tax credits at December 31, 2011 is reflected in the 2012 effective tax rate.
The effective tax rate is also applied to the quarterly operating results. In the event that there is a significant unusual or one-time item recognized in the Company’s operating results, the tax attributable to that item would be separately calculated and recorded at the same time as the unusual or one-time item.
A number of years may elapse before a particular tax reporting year is audited and finally resolved. The number of years with open tax audits varies depending on the tax jurisdiction. In the United States, the statutes for state income taxes for 1998 and forward remain open. The Company received final notification in November 2012 that the Internal Revenue Service has settled the 2007 and 2008 examination of the Company’s tax returns. While it is often difficult to predict the final outcome or the timing of resolution of any particular tax matter, the Company believes that its income tax accruals reflect the probable outcome of known tax contingencies. Unfavorable settlement of any particular issue would require use of the Company’s cash.
As of September 28, 2012, certain subsidiaries have recorded deferred tax assets of $30.3 million associated with accumulated federal, state and foreign net operating loss carryforwards. The Company has approximately $15.2 million of a valuation allowance as of September 28, 2012 against these carryforwards due to the uncertainty of their realization. In addition, certain subsidiaries have accumulated state net operating loss carryforwards for which no benefit has been recorded as they are attributable to uncertain tax positions. The unrecognized tax benefits, as of September 28, 2012, attributable to these net operating losses was approximately $8.8 million. Due to the uncertain tax position, these net operating losses are not included as components of deferred tax assets as of September 28, 2012. The federal, state and foreign net operating loss carryforwards will expire from 2013 through 2032.
As of September 28, 2012, the Company has approximately $6.7 million of foreign tax credit carryforwards, which expire in 2022. The Company believes it is more likely than not that it will be able to generate taxable income in the future sufficient to utilize these carryforwards, and no valuation allowance is necessary.
As of September 28, 2012 and September 30, 2011, the components of deferred taxes are as follows (in thousands):
| September 28, 2012 | September 30, 2011 | |||||||
| Deferred tax liabilities: |
||||||||
| Property and equipment |
$ | 82,627 | $ | 82,168 | ||||
| Investments |
95,445 | 92,802 | ||||||
| Other intangible assets, including goodwill |
717,583 | 742,474 | ||||||
| Other |
13,095 | 10,988 | ||||||
|
|
|
|
|
|||||
| Gross deferred tax liability |
908,750 | 928,432 | ||||||
|
|
|
|
|
|||||
| Deferred tax assets: |
||||||||
| Insurance |
41,443 | 38,927 | ||||||
| Employee compensation and benefits |
214,847 | 190,106 | ||||||
| Accruals and allowances |
43,781 | 32,313 | ||||||
| Derivatives |
31,879 | 56,207 | ||||||
| Net operating loss/credit carryforwards and other |
37,509 | 9,287 | ||||||
|
|
|
|
|
|||||
| Gross deferred tax asset, before valuation allowances |
369,459 | 326,840 | ||||||
|
|
|
|
|
|||||
| Valuation allowances |
(15,187 | ) | (10,426 | ) | ||||
|
|
|
|
|
|||||
| Net deferred tax liability |
$ | 554,478 | $ | 612,018 | ||||
|
|
|
|
|
|||||
F-32
Table of Contents
Current deferred tax assets of $77.9 million and $93.5 million at September 28, 2012 and September 30, 2011 are included in “Prepayments and other current assets,” respectively. Deferred tax liabilities of $632.3 million and $705.5 million at September 28, 2012 and September 30, 2011 are included in “Deferred Income Taxes and Other Noncurrent Liabilities,” respectively.
The Company had approximately $32.0 million of total gross unrecognized tax benefits as of September 28, 2012, all of which, if recognized, would impact the effective tax rate. A reconciliation of the beginning and ending amount of gross unrecognized tax benefits follows (in thousands):
| September 28, 2012 | ||||
| Gross unrecognized tax benefits at September 30, 2011 |
$ | 34,040 | ||
| Additions based on tax positions taken in the current year |
2,304 | |||
| Reductions for tax positions taken in prior years |
(254 | ) | ||
| Reductions for remeasurements, settlements and payments |
(3,306 | ) | ||
| Reductions due to statute expiration |
(807 | ) | ||
|
|
|
|||
| Gross unrecognized tax benefits at September 28, 2012 |
$ | 31,977 | ||
|
|
|
|||
| September 30, 2011 | ||||
| Gross unrecognized tax benefits at October 1, 2010 |
$ | 49,274 | ||
| Additions based on tax positions taken in the current year |
3,353 | |||
| Additions for tax positions taken in prior years |
1,312 | |||
| Reductions for remeasurements, settlements and payments |
(19,331 | ) | ||
| Reductions due to statute expiration |
(568 | ) | ||
|
|
|
|||
| Gross unrecognized tax benefits at September 30, 2011 |
$ | 34,040 | ||
|
|
|
|||
The Company had approximately $8.4 million and $9.6 million accrued for interest and penalties as of September 28, 2012 and September 30, 2011, respectively, and recorded approximately ($1.0) million and ($2.5) million in interest and penalties during fiscal 2012 and fiscal 2011, respectively.
The Company is subject to U.S. federal income tax as well as income tax of multiple state and foreign jurisdictions. The Company has substantially concluded all U.S. federal income tax matters for years through 2006, with the exception of certain Work Opportunity Tax Credits and Welfare to Work Tax Credits which are pending the outcome of Protective Refund Claims filed for 1998 through 2006.
The Company has significant operations in approximately 20 states and foreign taxing jurisdictions. The Company has open tax years in these jurisdictions ranging from 1 to 10 years. The Company does not anticipate that any adjustments resulting from tax audits would result in a material change to the results of operations or financial condition.
The Company does not expect the amount of unrecognized tax benefits to significantly change within the next 12 months.
NOTE 9. CAPITAL STOCK:
Pursuant to the Stockholders Agreement of the Company, upon termination of employment from the Company or one of its subsidiaries, members of the Company’s management (other than Mr. Neubauer) who hold shares of common stock of the Company can cause the Company to repurchase all of their initial investment shares (as defined) or shares acquired as a result of the exercise of Installment Stock Purchase Opportunities at appraised fair market value. Generally, payment for shares repurchased could be, at the Company’s option, in
F-33
Table of Contents
cash or installment notes, which would be effectively subordinated to all indebtedness of ARAMARK Corporation. The amount of this potential repurchase obligation has been classified outside of stockholders’ equity, which reflects the Company’s investment basis and capital structure in the Company’s consolidated financial statements. The amount of common stock subject to repurchase as of September 28, 2012 and September 30, 2011 was $167.5 million and $158.1 million, which is based on approximately 11.0 million and 12.4 million shares of common stock of the Company valued at $15.17 and $12.73 per share, respectively. The fair value of the common stock subject to repurchase is calculated using discounted cash flow techniques and comparable public company trading multiples. Inputs used in the discounted cash flow analysis include the weighted average cost of capital, long-term revenue growth rates, long-term EBIT margins and residual growth rates. Inputs used in the comparable public company trading multiples include the last-twelve-months’ EBITDA multiple, forward EBITDA multiples and control premium. During fiscal 2012 and fiscal 2011, approximately $67.3 million and $40.8 million of common stock of the Company was repurchased, respectively, and has been reflected in the Company’s consolidated financial statements. The Stockholders Agreement, the senior secured credit agreement, the indenture governing the fixed rate notes, the indenture governing the floating rate notes and the indenture governing the notes issued by the Company contain limitations on the amount the Company can expend for such share repurchases.
The Company used the net proceeds from the offering of the Notes, along with $132.7 million in borrowing by ARAMARK Corporation under its extended U.S. Dollar revolving credit facility to pay an approximately $711 million dividend ($3.50 per share) to the Company’s stockholders and to pay fees and expenses related to the issuance of the Notes.
NOTE 10. SHARE-BASED COMPENSATION:
In connection with the 2007 Transaction, the Company established the ARAMARK Holdings Corporation 2007 Management Stock Incentive Plan (the “2007 MSIP”). Incentive awards under the 2007 MSIP may be granted to employees or directors of, or consultants to, the Company or one of its affiliates in the form of non-qualified stock options, unvested shares of common stock, the opportunity to purchase shares of common stock and other awards that are valued in whole or in part by reference to, or are otherwise based on, the fair market value of the Company’s shares. The 2007 MSIP permits the granting of awards of up to 40.4 million shares of common stock of the Company. As of September 28, 2012, there were 5.2 million shares available for grant. Under the 2007 MSIP, the terms of the awards are fixed at the grant date.
The Company adopted an amended and restated ARAMARK Holdings Corporation 2007 MSIP (the Amended Stock Incentive Plan) on June 21, 2011. The Amended Stock Incentive Plan incorporates certain changes from prior amendments to the 2007 MSIP and provides for the grant of Installment Stock Purchase Opportunities. The Amended Stock Incentive Plan also provides that shares repurchased by the Company from former employees will become eligible for issuances as stock options or purchased stock.
Share-based compensation expense charged to expense for fiscal 2012, fiscal 2011 and fiscal 2010 was approximately $15.7 million, before taxes of approximately $6.1 million, approximately $17.3 million, before taxes of approximately $6.8 million, and approximately $21.3 million, before taxes of approximately $8.3 million, respectively. The compensation expense recognized is classified as “Selling and general corporate expenses” in the Consolidated Statements of Income. No compensation expense was capitalized.
Cash received from option exercises during fiscal 2012, fiscal 2011 and fiscal 2010 was $6.7 million, $1.0 million and $0.1 million, respectively. For fiscal 2012, fiscal 2011 and fiscal 2010, the amount of tax benefits included in “Other financing activities” in the Consolidated Statements of Cash Flows was $4.5 million, $0.7 million and ($0.1) million, respectively.
F-34
Table of Contents
Stock Options
Each award of stock options under the Amended Stock Incentive Plan is comprised of two types of stock options. One-half of the options awarded vest solely based upon continued employment over a specific period of time, generally four years (“Time-Based Options”). One-half of the options awarded vest based both upon continued employment and upon the achievement of a level of earnings before interest and taxes (“EBIT”), as defined in the 2007 MSIP, over time, generally four years (“Performance-Based Options”). The Performance-Based Options may also vest in part or in full upon the occurrence of specific return-based events. The exercise price for Time-Based Options and Performance-Based Options equals the fair value of the Company’s stock on the date of the grant. All options remain exercisable for ten years from the date of grant.
Time-Based Options
The fair value of the Time-Based Options granted was estimated using the Black-Scholes option pricing model and the weighted-average assumptions noted in the table below. Since the Company’s stock is not publicly traded, the expected volatility is based on an average of the historical volatility of the Company’s competitors’ stocks over the expected term of the stock options. The expected life represents the period of time that options granted are expected to be outstanding and is calculated using the simplified method prescribed by Securities and Exchange Commission (“SEC”) rules and regulations due to the lack of history. The risk-free rate is based on the U.S. Treasury security with terms equal to the expected life of the option as of the grant date.
| Fiscal
Year Ended September 28, 2012 |
Fiscal
Year Ended September 30, 2011 |
Fiscal
Year Ended October 1, 2010 | ||||
| Expected volatility |
30% | 30% | 30% | |||
| Expected dividend yield |
0% | 0% | 0% | |||
| Expected life (in years) |
6.25 | 6.25 | 6.25 | |||
| Risk-free interest rate |
1.04% - 1.61% | 1.41% - 2.86% | 2.04% - 3.31% |
The weighted-average grant-date fair value of Time-Based Options granted during fiscal 2012, fiscal 2011 and fiscal 2010 was $4.57, $4.42 and $5.10 per option, respectively.
Compensation expense for Time-Based Options is recognized on a straight-line basis over the vesting period during which employees perform related services. Approximately $8.5 million, $10.3 million and $14.1 million was charged to expense during fiscal 2012, fiscal 2011 and fiscal 2010 for Time-Based Options, respectively. The Company has applied a forfeiture assumption of 8.7% per annum in the calculation of such expense.
As of September 28, 2012, there was approximately $18.0 million of unrecognized compensation expense related to nonvested Time-Based Options, which is expected to be recognized over a weighted-average period of approximately 2.66 years.
A summary of Time-Based Options activity is presented below:
| Options |
Shares (000s) |
Weighted- Average Exercise Price |
Aggregate Intrinsic Value ($000s) |
Weighted- Average Remaining Term (Years) |
||||||||||||
| Outstanding at September 30, 2011 |
15,982 | $ | 8.73 | |||||||||||||
| Granted |
2,699 | $ | 14.17 | |||||||||||||
| Exercised |
(2,195 | ) | $ | 7.52 | ||||||||||||
| Forfeited and expired |
(775 | ) | $ | 11.45 | ||||||||||||
|
|
|
|
|
|
|
|
|
|||||||||
| Outstanding at September 28, 2012 |
15,711 | $ | 9.70 | $ | 85,945 | 6.5 | ||||||||||
|
|
|
|
|
|
|
|
|
|||||||||
| Exercisable at September 28, 2012 |
10,025 | $ | 7.98 | $ | 72,062 | 5.2 | ||||||||||
|
|
|
|
|
|
|
|
|
|||||||||
| Expected to vest at September 28, 2012 |
5,093 | $ | 12.63 | $ | 12,948 | 8.6 | ||||||||||
|
|
|
|
|
|
|
|
|
|||||||||
F-35
Table of Contents
The total intrinsic value of Time-Based Options exercised during fiscal 2012, fiscal 2011 and fiscal 2010 was $15.0 million, $8.9 million and $1.8 million, respectively. The total fair value of Time-Based Options that vested during fiscal 2012, fiscal 2011 and fiscal 2010 was $7.9 million, $15.8 million and $11.0 million, respectively.
Performance-Based Options
The fair value of the Performance-Based Options was estimated using the Black-Scholes option pricing model and the weighted-average assumptions noted in the table below. Since the Company’s stock is not publicly traded, the expected volatility is based on an average of the historical volatility of the Company’s competitors’ stocks over the expected term of the stock options. The expected life represents the period of time that options granted are expected to be outstanding and is calculated using the simplified method prescribed by SEC rules and regulations due to the lack of history. The risk-free rate is based on the U.S. Treasury security with terms equal to the expected life of the option as of the grant date.
| Fiscal
Year Ended September 28, 2012 |
Fiscal
Year Ended September 30, 2011 |
Fiscal Year Ended October 1, 2010 | ||||
| Expected volatility |
30% | 30% | 30% | |||
| Expected dividend yield |
0% | 0% | 0% | |||
| Expected life (in years) |
5.0 - 6.0 | 5.5 - 7.0 | 5.5 - 7.0 | |||
| Risk-free interest rate |
0.73% - 1.04% | 1.43% - 2.86% | 1.41% - 3.31% |
The weighted-average grant-date fair value of the Performance-Based Options granted during fiscal 2012, fiscal 2011 and fiscal 2010 was $3.91, $4.21 and $4.98 per option, respectively.
Compensation expense for Performance-Based Options is recognized on a principally straight-line basis over the requisite performance and service periods. The Company recognized compensation expense of approximately $3.6 million, $5.1 million and $6.7 million during fiscal 2012, fiscal 2011 and fiscal 2010 for Performance-Based Options, respectively. The Company has applied a forfeiture assumption of 8.7% per annum in the calculation of such expense.
On June 21, 2011, the Company’s Board approved new annual and cumulative EBIT targets for fiscal 2011 and beyond. Approximately 3.7 million options were affected by these modifications. The fair values of these Performance-Based Options were revalued at the award modification date. The fair value of the Performance-Based Options modified during fiscal 2011 was estimated using the Black-Scholes option pricing model and the following weighted-average assumptions: estimated volatility (30%), expected dividend yield (0%), expected life (3.5-6.8 years) and risk-free interest rate (0.69%-2.27%). The weighted-average fair value of the Performance-Based Options modified during fiscal 2011 was $4.66 per option.
On June 21, 2011, the Company’s Board also agreed that for awards granted on or after June 21, 2011, annual and cumulative EBIT targets for future fiscal years beginning after fiscal 2011 will be set within 90 days of the beginning of each fiscal year. The Amended Stock Incentive Plan also provides that if an annual EBIT target is established for fiscal 2012 or later years for options granted after June 21, 2011 that is less than the annual EBIT target for such fiscal year for outstanding stock options, the EBIT target for such outstanding options will be reduced to the lower EBIT target.
On December 9, 2009, the Company’s Board waived the EBIT target for fiscal 2009 with respect to approximately 1.1 million options representing 35% of the portion of the Performance-Based Options whose vesting was subject to the achievement of the Company’s fiscal 2009 EBIT target. Accordingly, such portion of the Performance-Based Options vested when the time-based vesting requirement of such options was satisfied. The fair value of these Performance-Based Options was revalued at the award modification date. The fair value of the Performance-Based Options modified during fiscal 2010 was estimated using the Black-Scholes option
F-36
Table of Contents
pricing model and the following weighted-average assumptions: expected volatility (30%), expected dividend yield (0%), expected life (3.60-6.80 years) and risk-free interest rate (1.23%-3.04%). The weighted-average fair value of the Performance-Based Options modified during fiscal 2010 was $5.19 per option.
A summary of Performance-Based Options activity is presented below:
| Options |
Shares (000s) |
Weighted- Average Exercise Price |
Aggregate Intrinsic Value ($000s) |
Weighted- Average Remaining Term (Years) |
||||||||||||
| Outstanding at September 30, 2011 |
16,051 | $ | 8.73 | |||||||||||||
| Granted |
2,699 | $ | 14.17 | |||||||||||||
| Exercised |
(1,045 | ) | $ | 7.25 | ||||||||||||
| Forfeited and expired |
(1,776 | ) | $ | 9.41 | ||||||||||||
|
|
|
|
|
|
|
|
|
|||||||||
| Outstanding at September 28, 2012 |
15,929 | $ | 9.68 | $ | 87,487 | 6.4 | ||||||||||
|
|
|
|
|
|
|
|
|
|||||||||
| Exercisable at September 28, 2012 |
5,391 | $ | 8.12 | $ | 38,019 | 5.3 | ||||||||||
|
|
|
|
|
|
|
|
|
|||||||||
| Expected to vest at September 28, 2012 |
— | $ | — | $ | — | 0 | ||||||||||
|
|
|
|
|
|
|
|
|
|||||||||
The total intrinsic value of Performance-Based Options exercised during fiscal 2012, fiscal 2011 and fiscal 2010 was $7.5 million, $5.0 million and $1.5 million, respectively. The total fair value of Performance-Based Options that vested during fiscal 2012, fiscal 2011 and fiscal 2010 was $6.7 million, $0 million and $5.5 million, respectively.
Installment Stock Purchase Opportunities
Installment Stock Purchase Opportunities (“ISPOs”) provide the grantee the option to purchase shares of the Company’s common stock. ISPO awards are divided into five equal installments. The first installment, which represents 20% of the total award, vests immediately upon grant and will be exercisable until the first anniversary of the grant date. At least 25% of the first installment must be exercised or the entire grant (including the remaining four installments) will expire and any part of the first installment that is not exercised during the exercise period will also expire, in each case on the first anniversary of the grant date. If the exercise conditions of the first installment are met, the remaining four installments will vest on December 15th of the first calendar year following the year in which the ISPO is granted, and on each of the three anniversaries of such date, respectively, and will be exercisable for 31 days thereafter. Any of these remaining four installments that becomes vested but is not exercised during its respective exercise period will expire at the end of its exercise period, but the holder may still exercise any subsequent installments when they vest in future years.
The fair value of the ISPOs was estimated using the Black-Scholes option pricing model and the following weighted-average assumptions noted in the table below. Since the Company’s stock is not publicly traded, the expected volatility is based on an average of the historical volatility of the Company’s competitors’ stocks over the expected term of the stock options. The expected life represents the period of time that options granted are expected to be outstanding and is calculated using the simplified method prescribed by SEC rules and regulations due to the lack of history. The risk-free rate is based on the U.S. Treasury security with terms equal to the expected life of the option as of the grant date.
| Fiscal Year Ended September 28, 2012 |
Fiscal Year Ended September 30, 2011 | |||
| Expected volatility |
30% | 30% | ||
| Expected dividend yield |
0% | 0% | ||
| Expected life (in years) |
2.5 | 2.5 | ||
| Risk-free interest rate |
0.24% - 0.31% | 0.33% - 0.68% |
F-37
Table of Contents
The weighted-average grant-date fair value of ISPOs granted during fiscal 2012 and fiscal 2011 was $2.80 and $2.47 per option, respectively.
Compensation expense for ISPOs is recognized on a straight-line basis over the vesting period during which employees perform related services. The Company recorded approximately $1.0 million and $0.8 million of compensation expense related to these awards during fiscal 2012 and fiscal 2011, respectively. The Company has applied a forfeiture assumption of 8.7% per annum in the calculation of such expense.
As of September 28, 2012, there was approximately $2.4 million of unrecognized compensation expense related to nonvested ISPOs, which is expected to be recognized over a weighted-average period of approximately 3.70 years.
A summary of ISPOs activity is presented below:
| Options |
Shares (000s) |
Weighted- Average Exercise Price |
Aggregate Intrinsic Value ($000s) |
Weighted- Average Remaining Term (Years) |
||||||||||||
| Outstanding at September 30, 2011 |
977 | $ | 12.69 | |||||||||||||
| Granted |
920 | $ | 14.67 | |||||||||||||
| Exercised |
(216 | ) | $ | 13.86 | ||||||||||||
| Forfeited and expired |
(278 | ) | $ | 12.69 | ||||||||||||
|
|
|
|
|
|
|
|
|
|||||||||
| Outstanding at September 28, 2012 |
1,403 | $ | 13.81 | $ | 1,911 | 3.7 | ||||||||||
|
|
|
|
|
|
|
|
|
|||||||||
| Exercisable at September 28, 2012 |
63 | $ | 14.46 | $ | 45 | .5 | ||||||||||
|
|
|
|
|
|
|
|
|
|||||||||
| Expected to vest at September 28, 2012 |
1,207 | $ | 13.65 | $ | 1,838 | 9.2 | ||||||||||
|
|
|
|
|
|
|
|
|
|||||||||
The total intrinsic value of ISPOs exercised during fiscal 2012 was $0.2 million. The total fair value of ISPOs that vested during fiscal 2012 was $0.9 million.
Seamless Unit Options
During fiscal 2011, Seamless established the Seamless North America 2011 Equity Incentive Plan (the “Plan”). The Plan allows for the issuance of unit options and other equity-based awards in Seamless. The unit options awarded vest solely based on continued employment over a specific period of time, generally four years. The Company recognized compensation expense of approximately $2.1 million and $0.1 million for Seamless unit options during fiscal 2012 and fiscal 2011, respectively. During fiscal 2012 and fiscal 2011, Seamless granted approximately 3.5 million and 6.0 million unit options, respectively.
Deferred Stock Units
Deferred stock units are issued only to non-employee members of the Board of Directors of the Company who are not representatives of one of the Sponsors and represent the right to receive shares of the Company’s common stock in the future. Each deferred stock unit will be converted to one share of the Company’s common stock six months and one day after the date on which such director ceases to serve as a member of the Board of Directors. The grant-date fair value of deferred stock units is based on the fair value of the Company’s common stock. Since the deferred stock units are fully vested upon grant, compensation expense for the entire award is recognized immediately upon grant. The Company granted 34,480 deferred stock units during fiscal 2012. The compensation cost charged to expense during fiscal 2012, fiscal 2011 and fiscal 2010 for deferred stock units was approximately $0.5 million, $1.0 million and $0.5 million, respectively.
F-38
Table of Contents
NOTE 11. ACCOUNTS RECEIVABLE SECURITIZATION:
The Company has an agreement (the Receivables Facility) with several financial institutions whereby it sells on a continuous basis an undivided interest in all eligible trade accounts receivable, as defined in the Receivables Facility. Pursuant to the Receivables Facility, the Company formed ARAMARK Receivables, LLC, a wholly-owned, consolidated, bankruptcy- remote subsidiary. ARAMARK Receivables, LLC was formed for the sole purpose of buying and selling receivables generated by certain subsidiaries of the Company. Under the Receivables Facility, the Company and certain of its subsidiaries transfer without recourse all of their accounts receivable to ARAMARK Receivables, LLC. As collections reduce previously transferred interests, interests in new, eligible receivables are transferred to ARAMARK Receivables, LLC, subject to meeting certain conditions.
In the first quarter of fiscal 2011, the Company adopted the new authoritative accounting guidance regarding transfers of financial assets. On a prospective basis, the Company is required to report its receivables securitization facility as a secured borrowing instead of as a sale of receivables. The impact of the new accounting treatment upon adoption resulted in the recognition of both the receivables securitized under the program and the borrowings they collateralize on the Consolidated Balance Sheet, which led to a $220.9 million increase in “Receivables” and “Long-Term Borrowings.” Additionally, the Company’s Consolidated Statement of Cash Flows during fiscal 2011 reflects the final remittance of cash associated with the $220.9 million of receivables sold at October 1, 2010 and subsequently collected by the Company on behalf of the bank conduits as an operating cash outflow. Any subsequent borrowing activity with the bank conduits will now be treated as financing cash flows. The overall effect on the Consolidated Statement of Cash Flows was a reduction in cash from operating activities and an increase in cash from financing activities, whereas under the previous guidance, these cash flows were presented net as cash from operating activities.
In June 2012, the Company amended the Receivables Facility to increase the maximum amount from $250.0 million to $300.0 million and extend the maturity date to January 2015. The Company incurred third-party costs of approximately $0.5 million related to the new amendment. At September 28, 2012 and September 30, 2011, the amount of outstanding borrowings under the Receivables Facility was $263.8 million and $225.9 million, respectively, and is included in “Long-Term Borrowings”.
NOTE 12. COMMITMENTS AND CONTINGENCIES:
The Company has capital and other purchase commitments of approximately $254.6 million at September 28, 2012, primarily in connection with commitments for capital projects and client contract investments. At September 28, 2012, the Company also has letters of credit outstanding in the amount of $181.7 million.
Certain of the Company’s lease arrangements, primarily vehicle leases, with terms of one to eight years, contain provisions related to residual value guarantees. The maximum potential liability to the Company under such arrangements was approximately $96.8 million at September 28, 2012 if the terminal fair value of vehicles coming off lease was zero. Consistent with past experience, management does not expect any significant payments will be required pursuant to these arrangements. No amounts have been accrued for guarantee arrangements at September 28, 2012.
Rental expense for all operating leases was $177.4 million, $168.1 million and $172.4 million for fiscal 2012, fiscal 2011 and fiscal 2010, respectively. Following is a schedule of the future minimum rental and similar commitments under all noncancelable operating leases as of September 28, 2012 (in thousands):
| Fiscal Year |
||||
| 2013 |
$ | 205,009 | ||
| 2014 |
89,041 | |||
| 2015 |
74,857 | |||
| 2016 |
60,473 | |||
| 2017 |
51,664 | |||
| Subsequent years |
102,024 | |||
|
|
|
|||
| Total minimum rental obligations |
$ | 583,068 | ||
|
|
|
F-39
Table of Contents
From time to time, the Company is a party to various legal actions and investigations involving claims incidental to the conduct of its business, including actions by clients, customers, employees, government entities and third parties, including under federal and state employment laws, wage and hour laws, immigration laws, human health and safety laws, import and export controls and customs laws, environmental laws, false claims statutes, minority business enterprise and women owned business enterprise statutes, contractual disputes, antitrust and competition laws and dram shop laws. Based on information currently available, advice of counsel, available insurance coverage, established reserves and other resources, the Company does not believe that any such actions are likely to be, individually or in the aggregate, material to its business, financial condition, results of operations or cash flows. However, in the event of unexpected further developments, it is possible that the ultimate resolution of these matters, or other similar matters, if unfavorable, may be materially adverse to the Company’s business, financial condition, results of operations or cash flows.
The Company has been informed that an Illinois state civil action has been filed against a subsidiary of the Company by an unnamed Relator under the Illinois Whistleblower Reward and Protection Act in the Circuit Court of Cook County, Illinois County Department, Law Division. The action alleges, among other things, that the subsidiary has not complied with the requirement to contract with minority owned and women owned businesses in connection with its contracts with Cook County and seeks monetary damages. The Company has accrued its best estimate of this potential liability as of September 28, 2012.
NOTE 13. BUSINESS SEGMENTS:
The Company provides or manages services in two strategic areas: Food and Support Services and Uniform and Career Apparel, which are organized and managed in the following reportable business segments:
Food and Support Services—North America—Food, refreshment, specialized dietary and support services, including facility maintenance and housekeeping, provided to business, educational and healthcare institutions and in sports, entertainment, recreational and other facilities serving the general public in the United States, Canada and Mexico. Food and Support Services—North America operating income for fiscal 2012 includes transition and integration costs of $4.9 million related to the Filterfresh acquisition, a favorable risk insurance adjustment of $1.7 million related to favorable claims experience and other income recognized of $6.7 million relating to the recovery of the Company’s investment (possessory interest) at one of the National Park Service (“NPS”) sites in the Sports, Leisure and Corrections sector, which was terminated in the current year. Food and Support Services—North America operating income for fiscal 2011 includes other income recognized of $7.8 million related to a compensation agreement signed with the NPS under which the NPS agreed to pay down a portion of the Company’s investment (possessory interest) in certain assets at one of the Company’s NPS sites in the Sports, Leisure and Corrections sector, severance related expenses of $6.2 million and a favorable risk insurance adjustment of $0.9 million related to favorable claims experience.
Food and Support Services—International—Food, refreshment, specialized dietary and support services, including facility maintenance and housekeeping, provided to business, educational and healthcare institutions and in sports, entertainment, recreational and other facilities serving the general public. Operations are conducted in 19 countries, including the U.K., Germany, Chile, Ireland, Spain, China, Belgium, Korea, Argentina and Japan. Food and Support Services—International operating income for fiscal 2012 includes a favorable adjustment of $1.5 million related to a non-income tax settlement in the U.K. and $2.9 million of severance related expenses. Food and Support Services—International operating income for fiscal 2011 includes a gain of $7.7 million related to the divestiture of the Company’s 67% ownership interest in the security business of its Chilean subsidiary (see Note 3), favorable non-income tax settlements in the U.K. of $5.3 million, a goodwill and other intangible assets impairment charge of $5.3 million (see Note 4), a gain on the sale of land in Chile of $1.7 million and severance related expenses of $11.4 million. Food and Support Services—International operating income for fiscal 2010 includes a favorable non-income tax settlement in the U.K. of $3.2 million.
Uniform and Career Apparel—Rental, sale, cleaning, maintenance and delivery of personalized uniform and career apparel and other textile items on a contract basis and direct marketing of personalized uniforms and
F-40
Table of Contents
career apparel and accessories to businesses, public institutions and individuals. Also provided are walk-off mats, cleaning cloths, disposable towels and other environmental control items. Uniform and Career Apparel operating income for the fiscal 2012 includes a favorable risk insurance adjustment of $5.7 million related to favorable claims experience and severance related expenses of $2.6 million. Uniform and Career Apparel operating income for fiscal 2011 includes a gain of $2.6 million related to a property settlement of an eminent domain claim, a risk insurance adjustment of $4.8 million related to favorable claims experience and severance related expenses of $3.9 million.
Sales by segment are substantially comprised of services to unaffiliated customers and clients. Operating income reflects expenses directly related to individual segments plus an allocation of corporate expenses applicable to more than one segment.
Corporate—Corporate includes general corporate expenses not specifically allocated to an individual segment and share-based compensation expense (see Note 10). During fiscal 2011, the Company recorded severance related expenses of $1.3 million. During fiscal 2010, the Company recorded share-based compensation expense of $21.3 million, which included approximately $5.5 million for the 2010 modification of the portion of the Performance-Based Options whose vesting was subject to the achievement of the Company’s fiscal 2009 EBIT target.
Interest and Other Financing Costs, net, for fiscal 2012 was impacted by the maturity of interest rate swaps during fiscal 2012 (see Note 6) and includes $11.1 million of third-party costs related to the amendment of the senior secured credit agreement (see Note 5) and the amendment of the Company’s Canadian subsidiary cross currency swap (see Note 6). Interest and Other Financing Costs, net, for fiscal 2011 includes a write-off of deferred financing fees of $2.1 million related to the amendment that extended the U.S. dollar denominated portion of the revolving credit facility and interest income of $14.1 million related to favorable non-income tax settlements in the U.K. For fiscal 2010, Interest and Other Financing Costs, net, includes $8.5 million of third-party costs related to the amendment of the senior secured credit agreement that extended the maturity date of $1,407.4 million of outstanding U.S. denominated term loan and interest income of approximately $4.3 million related to favorable non-income tax settlements in the U.K.
Financial information by segment follows (in millions):
| Sales | ||||||||||||
| Fiscal
Year Ended September 28, 2012 |
Fiscal
Year Ended September 30, 2011 |
Fiscal Year Ended October 1, 2010 |
||||||||||
| Food and Support Services—North America |
$ | 9,413.2 | $ | 9,019.0 | $ | 8,654.7 | ||||||
| Food and Support Services—International |
2,729.5 | 2,723.3 | 2,437.7 | |||||||||
| Uniform and Career Apparel |
1,362.7 | 1,340.1 | 1,326.7 | |||||||||
|
|
|
|
|
|
|
|||||||
| $ | 13,505.4 | $ | 13,082.4 | $ | 12,419.1 | |||||||
|
|
|
|
|
|
|
|||||||
| Operating Income | ||||||||||||
| Fiscal
Year Ended September 28, 2012 |
Fiscal
Year Ended September 30, 2011 |
Fiscal Year Ended October 1, 2010 |
||||||||||
| Food and Support Services—North America |
$ | 425.6 | $ | 400.5 | $ | 350.6 | ||||||
| Food and Support Services—International |
89.9 | 79.9 | 75.3 | |||||||||
| Uniform and Career Apparel |
118.1 | 117.3 | 102.7 | |||||||||
|
|
|
|
|
|
|
|||||||
| 633.6 | 597.7 | 528.6 | ||||||||||
| Corporate |
(51.8 | ) | (50.6 | ) | (51.1 | ) | ||||||
|
|
|
|
|
|
|
|||||||
| Operating Income |
581.8 | 547.1 | 477.5 | |||||||||
| Interest and other financing costs, net |
(456.8 | ) | (451.1 | ) | (444.5 | ) | ||||||
|
|
|
|
|
|
|
|||||||
| Income from Continuing Operations Before Income Taxes |
$ | 125.0 | $ | 96.0 | $ | 33.0 | ||||||
|
|
|
|
|
|
|
|||||||
F-41
Table of Contents
| Depreciation and Amortization | ||||||||||||
| Fiscal Year Ended September 28, 2012 |
Fiscal Year Ended September 30, 2011 |
Fiscal Year Ended October 1, 2010 |
||||||||||
| Food and Support Services—North America |
$ | 364.7 | $ | 341.9 | $ | 334.3 | ||||||
| Food and Support Services—International |
61.0 | 62.6 | 60.2 | |||||||||
| Uniform and Career Apparel |
102.6 | 105.1 | 107.5 | |||||||||
| Corporate |
0.9 | 0.9 | 0.9 | |||||||||
|
|
|
|
|
|
|
|||||||
| $ | 529.2 | $ | 510.5 | $ | 502.9 | |||||||
|
|
|
|
|
|
|
|||||||
| Capital Expenditures and Client Contract Investments and Other* |
||||||||||||
| Fiscal Year Ended September 28, 2012 |
Fiscal Year Ended September 30, 2011 |
Fiscal Year Ended October 1, 2010 |
||||||||||
| Food and Support Services—North America |
$ | 281.0 | $ | 207.9 | $ | 212.8 | ||||||
| Food and Support Services—International |
51.9 | 58.6 | 46.8 | |||||||||
| Uniform and Career Apparel |
40.5 | 33.3 | 33.3 | |||||||||
| Corporate |
— | 0.4 | — | |||||||||
|
|
|
|
|
|
|
|||||||
| $ | 373.4 | $ | 300.2 | $ | 292.9 | |||||||
|
|
|
|
|
|
|
|||||||
| * | Includes amounts acquired in business combinations |
| Identifiable Assets | ||||||||
| September 28, 2012 |
September 30, 2011 |
|||||||
| Food and Support Services—North America |
$ | 7,120.8 | $ | 7,234.2 | ||||
| Food and Support Services—International |
1,527.7 | 1,524.8 | ||||||
| Uniform and Career Apparel |
1,681.7 | 1,672.8 | ||||||
| Corporate |
157.2 | 91.3 | ||||||
|
|
|
|
|
|||||
| $ | 10,487.4 | $ | 10,523.1 | |||||
|
|
|
|
|
|||||
The following geographic data include sales generated by subsidiaries within that geographic area and net property & equipment based on physical location (in millions):
| Sales | ||||||||||||
| Fiscal
Year Ended September 28, 2012 |
Fiscal
Year Ended September 30, 2011 |
Fiscal Year Ended October 1, 2010 |
||||||||||
| United States |
$ | 9,729.6 | $ | 9,369.6 | $ | 9,078.2 | ||||||
| Foreign |
3,775.8 | 3,712.8 | 3,340.9 | |||||||||
|
|
|
|
|
|
|
|||||||
| $ | 13,505.4 | $ | 13,082.4 | $ | 12,419.1 | |||||||
|
|
|
|
|
|
|
|||||||
| Net Property & Equipment | ||||||||
| September 28, 2012 |
September 30, 2011 |
|||||||
| United States |
$ | 814.4 | $ | 818.4 | ||||
| Foreign |
186.2 | 186.3 | ||||||
|
|
|
|
|
|||||
| $ | 1,000.6 | $ | 1,004.7 | |||||
|
|
|
|
|
|||||
F-42
Table of Contents
NOTE 14. FAIR VALUE OF FINANCIAL ASSETS AND FINANCIAL LIABILITIES:
Fair value is defined as the price that would be received to sell an asset or paid to transfer a liability in an orderly transaction between market participants at the measurement date. Assets and liabilities recorded at fair value are classified based upon the level of judgment associated with the inputs used to measure their fair value. The hierarchical levels related to the subjectivity of the valuation inputs are defined as follows:
| • | Level 1—inputs to the valuation methodology are quoted prices (unadjusted) for identical assets or liabilities in active markets |
| • | Level 2—inputs to the valuation methodology include quoted prices for similar assets and liabilities in active markets, and inputs that are observable for the asset or liability, either directly or indirectly, for substantially the full term of the financial instrument |
| • | Level 3—inputs to the valuation methodology are unobservable and significant to the fair value measurement |
Recurring Fair Value Measurements
The Company’s financial instruments consist primarily of cash and cash equivalents, accounts receivable, accounts payable, borrowings, common stock subject to repurchase and derivatives (see Note 6). Management believes that the carrying value of cash and cash equivalents, accounts receivable and accounts payable are representative of their respective fair values. In conjunction with the fair value measurement of the derivative instruments, the Company made an accounting policy election to measure the credit risk of its derivative instruments that are subject to master netting agreements on a net basis by counterparty portfolio. The fair value of the Company’s debt at September 28, 2012 and September 30, 2011 was $6,052.9 million and $6,090.7 million, respectively. The carrying value of the Company’s debt at September 28, 2012 and September 30, 2011 was $6,008.8 million and $6,232.1 million, respectively. The fair values were computed using market quotes, if available, or based on discounted cash flows using market interest rates as of the end of the respective periods. The inputs utilized in estimating the fair value of the Company’s debt has been classified as level 2 in the fair value hierarchy levels.
The following table presents the changes in the Company’s common stock subject to repurchase for which level 3 inputs were significant to their valuation for fiscal 2012 (in thousands):
| Common Stock Subject to Repurchase |
||||
| Balance, September 30, 2011 |
$ | 158,061 | ||
| Issuances of common stock |
8,098 | |||
| Repurchases of common stock |
(27,293 | ) | ||
| Change in fair market value of common stock |
28,595 | |||
|
|
|
|||
| Balance, September 28, 2012 |
$ | 167,461 | ||
|
|
|
|||
Nonrecurring Fair Value Measurements
During the second quarter of fiscal 2011, the Company recorded an impairment charge of $5.3 million in the Food and Support Services—International segment in order to write off the goodwill (approximately $4.0 million) and other intangible assets (approximately $1.3 million) associated with its India operations. These nonrecurring fair value measurements were developed using significant unobservable inputs (Level 3). The fair values were computed using a discounted cash flow valuation methodology (see Note 4).
NOTE 15. RELATED PARTY TRANSACTIONS:
As of September 28, 2012, the notional value of interest rate swaps with entities affiliated with GS Capital Partners was $96 million and with entities affiliated with J.P. Morgan Partners was $221 million. As of
F-43
Table of Contents
September 30, 2011, the notional value of interest rate swaps with entities affiliated with GS Capital Partners was $766 million and ¥5.0 billion and with entities affiliated with J.P. Morgan Partners was $1,071 million. In all of these swaps, the Company pays the counterparty a fixed interest rate in exchange for their payment of a floating interest rate. The net payments in fiscal 2012, fiscal 2011 and fiscal 2010 to entities affiliated with GS Capital Partners pursuant to interest rate swap transactions were approximately $21.5 million, $40.1 million and $51.3 million, respectively. The net payments in fiscal 2012, fiscal 2011 and fiscal 2010 to entities affiliated with J.P. Morgan Partners pursuant to interest rate swap transactions were approximately $28.2 million, $51.6 million and $54.9 million, respectively.
NOTE 16. NONCONTROLLING INTEREST:
During the third quarter of fiscal 2011, the Company sold a noncontrolling ownership interest in Seamless, an online and mobile food ordering service, for consideration of $50.0 million in cash. The carrying value of the noncontrolling ownership interest sold at the time of the transaction was approximately $30.9 million, which resulted in an increase to “Noncontrolling interest” in the Consolidated Balance Sheet. The difference between the consideration received, the carrying value of the noncontrolling ownership sold, the related tax consequences of the sale, and the fees incurred on the sale of the noncontrolling interest resulted in an increase of approximately $0.7 million to “Capital surplus” in the Consolidated Balance Sheet. The Company incurred approximately $1.6 million of pretax transaction-related costs, of which approximately $1.0 million was paid to entities affiliated with GS Capital Partners and J.P. Morgan Partners.
NOTE 17. SUBSEQUENT EVENTS:
Consummation of the Spin-off of Seamless Holdings
On October 29, 2012, the Company completed the spin-off of its majority interest in Seamless to its stockholders.
In the spin-off, ARAMARK Corporation distributed all of the issued and outstanding shares of the common stock of Seamless Holdings Corporation (“Seamless Holdings”), an entity formed for the purpose of completing the spin-off and whose assets primarily consist of the Company’s former interest in Seamless, to its parent company and sole stockholder, ARAMARK Intermediate Holdco Corporation (“ARAMARK Intermediate”). Thereafter, ARAMARK Intermediate distributed such shares to the Company, its parent company and sole stockholder, who then distributed all of the shares of Seamless Holdings on a pro rata basis to the holders of Holdings common stock on October 26, 2012, the record date, through a tax-free stock dividend. Each Holdings stockholder received one share of Seamless Holdings common stock for each share of Holdings common stock held as of the record date.
Until October 29, 2012, including all periods presented in these consolidated financial statements, Seamless Holdings and its subsidiaries were part of the Company and its assets, liabilities, results of operations, and cash flows are included in the amounts reported in these consolidated financial statements.
Relationship with Seamless Holdings after Spin-off
Following the spin-off, Seamless Holdings is an independent company and the Company retains no ownership interest in Seamless Holdings or Seamless. However, one member of the Seamless Holdings board of directors also serves on ARAMARK Corporation’s board of directors.
In connection with the completion of the spin-off, Seamless Holdings, ARAMARK Corporation, ARAMARK Intermediate and the Company entered into a Distribution Agreement, Seamless Holdings and the Company entered into a Tax Matters Agreement and ARAMARK Corporation entered into a Transition Services Agreement with each of Seamless Holdings and Seamless. These agreements, as well as several additional ancillary agreements, govern the future relationships among the various parties involved in the spin-off.
F-44
Table of Contents
None of the agreements are expected to have a material impact on the Company’s financial position, results of operations, or liquidity.
As a result of this continuing involvement, the Company will not present Seamless Holdings and its subsidiaries as a discontinued operation.
Amendment Agreement No. 3 to the Senior Secured Credit Agreement
On December 20, 2012, ARAMARK Corporation amended the senior secured credit agreement (“Amendment Agreement No. 3”) to, among other things, borrow $670 million of new term loans with a maturity date of July 26, 2016. The proceeds of the new term loans were used primarily to repay approximately $650 million of existing term loans with a maturity date of January 26, 2014 and to fund certain discounts, fees and costs associated with the amendment. The existing term loans that were repaid in connection with Amendment Agreement No. 3 included U.S. dollar denominated term loans as well as non-U.S. term loans and consisted of the remaining balance of the un-extended term loans. The maturity date of the new term loans accelerate to October 31, 2014 if any of the fixed rate notes or the floating rate notes remains outstanding on October 31, 2014. The applicable margin with respect to the new term loans, all of which are Eurocurrency designated U.S. dollar denominated term loans borrowed by ARAMARK Corporation, is 3.25%. The new term loans were borrowed by ARAMARK Corporation with an original issue discount of 0.25%.
F-45
Table of Contents
ARAMARK HOLDINGS CORPORATION AND SUBSIDIARIES
SCHEDULE II—VALUATION AND QUALIFYING ACCOUNTS AND RESERVES
FOR THE FISCAL YEARS ENDED SEPTEMBER 28, 2012, SEPTEMBER 30, 2011 AND OCTOBER 1, 2010
| Additions | Reductions | |||||||||||||||
| Balance, Beginning of Period |
Charged to Income |
Deductions from Reserves(1) |
Balance, End of Period |
|||||||||||||
| Description |
||||||||||||||||
| Fiscal Year 2012 |
||||||||||||||||
| Reserve for doubtful accounts, advances & current notes receivable |
$ | 32,963 | $ | 26,718 | $ | 18,469 | $ | 41,212 | ||||||||
|
|
|
|
|
|
|
|
|
|||||||||
| Fiscal Year 2011 |
||||||||||||||||
| Reserve for doubtful accounts, advances & current notes receivable |
$ | 36,886 | $ | 10,298 | $ | 14,221 | $ | 32,963 | ||||||||
|
|
|
|
|
|
|
|
|
|||||||||
| Fiscal Year 2010 |
||||||||||||||||
| Reserve for doubtful accounts, advances & current notes receivable |
$ | 37,772 | $ | 8,756 | $ | 9,642 | $ | 36,886 | ||||||||
|
|
|
|
|
|
|
|
|
|||||||||
| (1) | Amounts determined not to be collectible and charged against the reserve and translation. |
F-46
Table of Contents
ARAMARK HOLDINGS CORPORATION AND SUBSIDIARIES
CONDENSED CONSOLIDATED BALANCE SHEETS
(Unaudited)
(In Thousands, Except Share Amounts)
| June 28, 2013 | September 28, 2012 | |||||||
| ASSETS | ||||||||
| Current Assets: |
||||||||
| Cash and cash equivalents |
$ | 97,821 | $ | 136,748 | ||||
| Receivables |
1,330,120 | 1,315,997 | ||||||
| Inventories, at lower of cost or market |
516,494 | 508,416 | ||||||
| Prepayments and other current assets |
221,825 | 197,272 | ||||||
|
|
|
|
|
|||||
| Total current assets |
2,166,260 | 2,158,433 | ||||||
|
|
|
|
|
|||||
| Property and Equipment, net |
958,208 | 1,003,377 | ||||||
| Goodwill |
4,602,266 | 4,729,474 | ||||||
| Other Intangible Assets |
1,450,850 | 1,595,149 | ||||||
| Other Assets |
949,549 | 1,000,921 | ||||||
|
|
|
|
|
|||||
| $ | 10,127,133 | $ | 10,487,354 | |||||
|
|
|
|
|
|||||
| LIABILITIES AND EQUITY | ||||||||
| Current Liabilities: |
||||||||
| Current maturities of long-term borrowings |
$ | 71,139 | $ | 37,462 | ||||
| Accounts payable |
699,567 | 873,345 | ||||||
| Accrued expenses and other current liabilities |
1,127,356 | 1,252,867 | ||||||
|
|
|
|
|
|||||
| Total current liabilities |
1,898,062 | 2,163,674 | ||||||
|
|
|
|
|
|||||
| Long-Term Borrowings |
6,145,917 | 5,971,305 | ||||||
| Deferred Income Taxes and Other Noncurrent Liabilities |
1,090,061 | 1,207,585 | ||||||
| Common Stock Subject to Repurchase and Other |
163,775 | 177,926 | ||||||
| Equity: |
||||||||
| ARAMARK Holdings Stockholders’ Equity: |
||||||||
| Common stock, par value $.01 (authorized: 600,000,000 shares; issued: 2013—218,751,738 and 2012—216,050,523; and outstanding: 2013—201,364,511 and 2012—202,573,022) |
2,187 | 2,159 | ||||||
| Capital surplus |
1,686,334 | 1,636,128 | ||||||
| Accumulated deficit |
(518,131 | ) | (444,479 | ) | ||||
| Accumulated other comprehensive loss |
(93,859 | ) | (73,745 | ) | ||||
| Treasury stock (shares held in treasury: 2013—17,387,227 and 2012—13,477,501) |
(247,213 | ) | (187,046 | ) | ||||
|
|
|
|
|
|||||
| Total ARAMARK Holdings stockholders’ equity |
829,318 | 933,017 | ||||||
| Noncontrolling interest |
— | 33,847 | ||||||
|
|
|
|
|
|||||
| Total equity |
829,318 | 966,864 | ||||||
|
|
|
|
|
|||||
| $ | 10,127,133 | $ | 10,487,354 | |||||
|
|
|
|
|
|||||
The accompanying notes are an integral part of these condensed consolidated financial statements.
F-47
Table of Contents
ARAMARK HOLDINGS CORPORATION AND SUBSIDIARIES
CONDENSED CONSOLIDATED STATEMENTS OF INCOME
(Unaudited)
(In Thousands, except per share data)
| Three Months Ended June 28, 2013 |
Three Months Ended June 29, 2012 |
|||||||
| Sales |
$ | 3,490,030 | $ | 3,336,094 | ||||
|
|
|
|
|
|||||
| Costs and Expenses: |
||||||||
| Cost of services provided |
3,178,092 | 3,036,522 | ||||||
| Depreciation and amortization |
135,808 | 132,388 | ||||||
| Selling and general corporate expenses |
52,534 | 52,002 | ||||||
|
|
|
|
|
|||||
| 3,366,434 | 3,220,912 | |||||||
|
|
|
|
|
|||||
| Operating income |
123,596 | 115,182 | ||||||
| Interest and Other Financing Costs, net |
80,917 | 101,595 | ||||||
|
|
|
|
|
|||||
| Income Before Income Taxes |
42,679 | 13,587 | ||||||
| Provision (Benefit) for Income Taxes |
14,705 | (960 | ) | |||||
|
|
|
|
|
|||||
| Net income |
27,974 | 14,547 | ||||||
| Less: Net income attributable to noncontrolling interests |
226 | 640 | ||||||
|
|
|
|
|
|||||
| Net income attributable to ARAMARK Holdings stockholders |
$ | 27,748 | $ | 13,907 | ||||
|
|
|
|
|
|||||
| Earnings per share attributable to ARAMARK Holdings stockholders: |
||||||||
| Basic: |
$ | 0.14 | $ | 0.07 | ||||
| Diluted: |
$ | 0.13 | $ | 0.07 | ||||
| Weighted Average Shares Outstanding: |
||||||||
| Basic |
201,364 | 203,109 | ||||||
| Diluted |
208,326 | 209,690 | ||||||
The accompanying notes are an integral part of these condensed consolidated financial statements.
F-48
Table of Contents
ARAMARK HOLDINGS CORPORATION AND SUBSIDIARIES
CONDENSED CONSOLIDATED STATEMENTS OF INCOME
(Unaudited)
(In Thousands)
| Nine Months Ended June 28, 2013 |
Nine Months Ended June 29, 2012 |
|||||||
| Sales |
$ | 10,429,682 | $ | 10,104,266 | ||||
|
|
|
|
|
|||||
| Costs and Expenses: |
||||||||
| Cost of services provided |
9,481,859 | 9,140,888 | ||||||
| Depreciation and amortization |
404,512 | 395,968 | ||||||
| Selling and general corporate expenses |
164,181 | 151,638 | ||||||
|
|
|
|
|
|||||
| 10,050,552 | 9,688,494 | |||||||
|
|
|
|
|
|||||
| Operating income |
379,130 | 415,772 | ||||||
| Interest and Other Financing Costs, net |
341,392 | 356,387 | ||||||
|
|
|
|
|
|||||
| Income from Continuing Operations Before Income Taxes |
37,738 | 59,385 | ||||||
| Provision for Income Taxes |
6,476 | 11,901 | ||||||
|
|
|
|
|
|||||
| Income from Continuing Operations |
31,262 | 47,484 | ||||||
| Income from Discontinued Operations, net of tax |
— | 297 | ||||||
|
|
|
|
|
|||||
| Net income |
31,262 | 47,781 | ||||||
| Less: Net income attributable to noncontrolling interests |
804 | 2,444 | ||||||
|
|
|
|
|
|||||
| Net income attributable to ARAMARK Holdings stockholders |
$ | 30,458 | $ | 45,337 | ||||
|
|
|
|
|
|||||
| Earnings per share attributable to ARAMARK Holdings stockholders: |
||||||||
| Basic: |
||||||||
| Income from Continuing Operations |
$ | 0.15 | $ | 0.22 | ||||
| Income from Discontinued Operations |
— | 0.00 | ||||||
|
|
|
|
|
|||||
| Net income attributable to ARAMARK Holdings stockholders |
$ | 0.15 | $ | 0.22 | ||||
|
|
|
|
|
|||||
| Diluted: |
||||||||
| Income from Continuing Operations |
$ | 0.15 | $ | 0.21 | ||||
| Income from Discontinued Operations |
— | 0.00 | ||||||
|
|
|
|
|
|||||
| Net income attributable to ARAMARK Holdings stockholders |
$ | 0.15 | $ | 0.21 | ||||
|
|
|
|
|
|||||
| Weighted Average Shares Outstanding: |
||||||||
| Basic |
201,607 | 203,191 | ||||||
| Diluted |
208,703 | 209,703 | ||||||
The accompanying notes are an integral part of these condensed consolidated financial statements.
F-49
Table of Contents
ARAMARK HOLDINGS CORPORATION AND SUBSIDIARIES
CONDENSED CONSOLIDATED STATEMENTS OF COMPREHENSIVE INCOME
(Unaudited)
(In Thousands)
| Three Months Ended June 28, 2013 |
Three Months Ended June 29, 2012 |
|||||||
| Net income |
$ | 27,974 | $ | 14,547 | ||||
| Other comprehensive income (loss), net of tax: |
||||||||
| Pension plan adjustments |
(571 | ) | 386 | |||||
| Foreign currency translation adjustments |
(7,197 | ) | (9,939 | ) | ||||
| Fair value of cash flow hedges |
3,797 | 701 | ||||||
|
|
|
|
|
|||||
| Other comprehensive income (loss), net of tax |
(3,971 | ) | (8,852 | ) | ||||
|
|
|
|
|
|||||
| Comprehensive income |
24,003 | 5,695 | ||||||
| Less: Net income attributable to noncontrolling interests |
226 | 640 | ||||||
|
|
|
|
|
|||||
| Comprehensive income attributable to ARAMARK stockholders |
$ | 23,777 | $ | 5,055 | ||||
|
|
|
|
|
|||||
| Nine Months Ended June 28, 2013 |
Nine Months Ended June 29, 2012 |
|||||||
| Net income |
$ | 31,262 | $ | 47,781 | ||||
| Other comprehensive income (loss), net of tax: |
||||||||
| Pension plan adjustments |
(1,701 | ) | 1,158 | |||||
| Foreign currency translation adjustments |
(31,153 | ) | (15,171 | ) | ||||
| Fair value of cash flow hedges |
12,740 | 34,920 | ||||||
|
|
|
|
|
|||||
| Other comprehensive income (loss), net of tax |
(20,114 | ) | 20,907 | |||||
|
|
|
|
|
|||||
| Comprehensive income |
11,148 | 68,688 | ||||||
| Less: Net income attributable to noncontrolling interests |
804 | 2,444 | ||||||
|
|
|
|
|
|||||
| Comprehensive income attributable to ARAMARK stockholders |
$ | 10,344 | $ | 66,244 | ||||
|
|
|
|
|
|||||
The accompanying notes are an integral part of these condensed consolidated financial statements.
F-50
Table of Contents
ARAMARK HOLDINGS CORPORATION AND SUBSIDIARIES
CONDENSED CONSOLIDATED STATEMENTS OF CASH FLOWS
(Unaudited)
(In Thousands)
| Nine Months Ended June 28, 2013 |
Nine Months Ended June 29, 2012 |
|||||||
| Cash flows from operating activities: |
||||||||
| Net income |
$ | 31,262 | $ | 47,781 | ||||
| Adjustments to reconcile net income to net cash provided by operating activities: |
||||||||
| Depreciation and amortization |
404,512 | 395,968 | ||||||
| Income taxes deferred |
(46,454 | ) | (44,734 | ) | ||||
| Share-based compensation expense |
12,328 | 12,539 | ||||||
| Changes in noncash working capital |
(328,085 | ) | (312,150 | ) | ||||
| Other operating activities |
62,763 | 37,277 | ||||||
|
|
|
|
|
|||||
| Net cash provided by operating activities |
136,326 | 136,681 | ||||||
|
|
|
|
|
|||||
| Cash flows from investing activities: |
||||||||
| Purchases of property and equipment, client contract investments and other |
(263,591 | ) | (226,725 | ) | ||||
| Disposals of property and equipment |
8,740 | 8,094 | ||||||
| Proceeds from divestitures |
919 | 4,457 | ||||||
| Acquisition of certain businesses, net of cash acquired |
(22,566 | ) | (151,317 | ) | ||||
| Other investing activities |
24,425 | 2,124 | ||||||
|
|
|
|
|
|||||
| Net cash used in investing activities |
(252,073 | ) | (363,367 | ) | ||||
|
|
|
|
|
|||||
| Cash flows from financing activities: |
||||||||
| Proceeds from long-term borrowings |
3,223,127 | 391,797 | ||||||
| Payments of long-term borrowings |
(3,048,041 | ) | (279,079 | ) | ||||
| Net change in funding under the Receivables Facility |
36,200 | 27,395 | ||||||
| Distribution in connection with spin-off of Seamless Holdings |
(47,352 | ) | — | |||||
| Proceeds from issuance of common stock |
4,882 | 5,805 | ||||||
| Repurchase of common stock |
(38,419 | ) | (20,762 | ) | ||||
| Other financing activities |
(53,577 | ) | (10,826 | ) | ||||
|
|
|
|
|
|||||
| Net cash provided by financing activities |
76,820 | 114,330 | ||||||
|
|
|
|
|
|||||
| Decrease in cash and cash equivalents |
(38,927 | ) | (112,356 | ) | ||||
| Cash and cash equivalents, beginning of period |
136,748 | 213,390 | ||||||
|
|
|
|
|
|||||
| Cash and cash equivalents, end of period |
$ | 97,821 | $ | 101,034 | ||||
|
|
|
|
|
|||||
The accompanying notes are an integral part of these condensed consolidated financial statements.
F-51
Table of Contents
ARAMARK HOLDINGS CORPORATION AND SUBSIDIARIES
CONDENSED CONSOLIDATED STATEMENT OF EQUITY
FOR THE NINE MONTHS ENDED JUNE 28, 2013
(Unaudited)
(In Thousands)
| Total | Total ARAMARK Holdings Stockholders’ Equity |
Common Stock |
Capital Surplus |
Accumulated Deficit |
Accumulated Other Comprehensive Loss |
Treasury Stock |
Noncontrolling Interest |
|||||||||||||||||||||||||
| Balance, September 28, 2012 |
$ | 966,864 | $ | 933,017 | $ | 2,159 | $ | 1,636,128 | $ | (444,479 | ) | $ | (73,745 | ) | $ | (187,046 | ) | $ | 33,847 | |||||||||||||
|
|
|
|
|
|
|
|
|
|
|
|
|
|
|
|
|
|||||||||||||||||
| Net income |
30,674 | 30,458 | 30,458 | 216 | ||||||||||||||||||||||||||||
| Other comprehensive income (loss) |
(20,114 | ) | (20,114 | ) | (20,114 | ) | ||||||||||||||||||||||||||
| Capital contributions from issuance of common stock |
20,437 | 20,437 | 28 | 20,409 | ||||||||||||||||||||||||||||
| Compensation expense related to stock incentive plans |
12,328 | 12,328 | 12,328 | |||||||||||||||||||||||||||||
| Tax benefits related to stock incentive plans |
3,566 | 3,566 | 3,566 | |||||||||||||||||||||||||||||
| Decrease in common stock subject to repurchase obligation, net |
13,903 | 13,903 | 13,903 | |||||||||||||||||||||||||||||
| Purchases of common stock |
(60,167 | ) | (60,167 | ) | (60,167 | ) | ||||||||||||||||||||||||||
| Distribution of Seamless Holdings |
(138,173 | ) | (104,110 | ) | (104,110 | ) | (34,063 | ) | ||||||||||||||||||||||||
|
|
|
|
|
|
|
|
|
|
|
|
|
|
|
|
|
|||||||||||||||||
| Balance, June 28, 2013 |
$ | 829,318 | $ | 829,318 | $ | 2,187 | $ | 1,686,334 | $ | (518,131 | ) | $ | (93,859 | ) | $ | (247,213 | ) | $ | — | |||||||||||||
|
|
|
|
|
|
|
|
|
|
|
|
|
|
|
|
|
|||||||||||||||||
The accompanying notes are an integral part of these condensed consolidated financial statements.
F-52
Table of Contents
ARAMARK HOLDINGS CORPORATION AND SUBSIDIARIES
CONDENSED CONSOLIDATED STATEMENT OF EQUITY
FOR THE NINE MONTHS ENDED JUNE 29, 2012
(Unaudited)
(In Thousands)
| Total | Total ARAMARK Holdings Stockholders’ Equity |
Common Stock |
Capital Surplus |
Accumulated Deficit |
Accumulated Other Comprehensive Loss |
Treasury Stock |
Noncontrolling Interest |
|||||||||||||||||||||||||
| Balance, September 30, 2011 |
$ | 882,465 | $ | 850,686 | $ | 2,123 | $ | 1,593,711 | $ | (548,030 | ) | $ | (77,345 | ) | $ | (119,773 | ) | $ | 31,779 | |||||||||||||
|
|
|
|
|
|
|
|
|
|
|
|
|
|
|
|
|
|||||||||||||||||
| Net income |
46,873 | 45,337 | 45,337 | 1,536 | ||||||||||||||||||||||||||||
| Other comprehensive income |
20,907 | 20,907 | 20,907 | |||||||||||||||||||||||||||||
| Capital contributions from issuance of common stock |
25,297 | 25,297 | 33 | 25,264 | ||||||||||||||||||||||||||||
| Compensation expense related to stock incentive plans |
12,539 | 12,539 | 12,539 | |||||||||||||||||||||||||||||
| Tax benefits related to stock incentive plans |
4,466 | 4,466 | 4,466 | |||||||||||||||||||||||||||||
| Increase in common stock subject to repurchase obligation, net |
(13,337 | ) | (13,337 | ) | (13,337 | ) | ||||||||||||||||||||||||||
| Purchases of common stock |
(51,296 | ) | (51,296 | ) | (51,296 | ) | ||||||||||||||||||||||||||
| Distributions to noncontrolling interest |
(457 | ) | (457 | ) | ||||||||||||||||||||||||||||
|
|
|
|
|
|
|
|
|
|
|
|
|
|
|
|
|
|||||||||||||||||
| Balance, June 29, 2012 |
$ | 927,457 | $ | 894,599 | $ | 2,156 | $ | 1,622,643 | $ | (502,693 | ) | $ | (56,438 | ) | $ | (171,069 | ) | $ | 32,858 | |||||||||||||
|
|
|
|
|
|
|
|
|
|
|
|
|
|
|
|
|
|||||||||||||||||
The accompanying notes are an integral part of these condensed consolidated financial statements.
F-53
Table of Contents
ARAMARK HOLDINGS CORPORATION AND SUBSIDIARIES
NOTES TO CONDENSED CONSOLIDATED FINANCIAL STATEMENTS (UNAUDITED)
(1) BASIS OF PRESENTATION:
On January 26, 2007, ARAMARK Holdings Corporation (the “Company” or “Holdings”), a Delaware corporation controlled by investment funds associated with GS Capital Partners, CCMP Capital Advisors, J.P. Morgan Partners, Thomas H. Lee Partners and Warburg Pincus LLC (collectively, the “Sponsors”), Joseph Neubauer, Chairman and former Chief Executive Officer of ARAMARK, and certain other members of the Company’s management, acquired all of the outstanding shares of ARAMARK Corporation (“ARAMARK Corporation”).
The condensed consolidated financial statements include the accounts of the Company and all of its subsidiaries in which a controlling financial interest is maintained. For those material consolidated subsidiaries in which the Company’s ownership is less than 100%, the outside stockholders’ interests are shown as noncontrolling interest in the accompanying Condensed Consolidated Balance Sheets. All significant intercompany transactions and accounts have been eliminated.
The condensed consolidated financial statements included herein have been prepared by the Company pursuant to the rules and regulations of the Securities and Exchange Commission (“SEC”) and should be read in conjunction with the audited consolidated financial statements, and the notes to those statements, for the fiscal year ended September 28, 2012. The condensed consolidated balance sheet as of September 28, 2012 was derived from audited financial statements which have been prepared in accordance with generally accepted accounting principles in the United States (“U.S. GAAP”). Certain information and footnote disclosures normally included in consolidated financial statements prepared in accordance with U.S. GAAP have been condensed or omitted pursuant to such rules and regulations, although the Company believes that the disclosures made are adequate to make the information not misleading. In the opinion of the Company, the statements include all adjustments, which are of a normal, recurring nature, required for a fair presentation for the periods presented. The results of operations for interim periods are not necessarily indicative of the results for a full year, due to the seasonality of some of the Company’s business activities and the possibility of changes in general economic conditions. Certain amounts in the prior period’s financial statements have been reclassified to conform with the current year classifications. The reclassifications had no effect on net income.
(2) ACQUISITIONS AND DIVESTITURES:
Fiscal 2013
Spin-off of Seamless Holdings Corporation
On October 29, 2012, the Company completed the spin-off of its majority interest in Seamless North America, LLC (“Seamless”) to its stockholders.
In the spin-off, ARAMARK Corporation distributed all of the issued and outstanding shares of the common stock of Seamless Holdings Corporation (“Seamless Holdings”), an entity formed for the purpose of completing the spin-off and whose assets primarily consist of the Company’s former interest in Seamless, to its parent company and sole stockholder, ARAMARK Intermediate. Thereafter, ARAMARK Intermediate distributed such shares to the Company, its parent company and sole stockholder, who then distributed all of the shares of Seamless Holdings on a pro rata basis to the holders of Holdings common stock as of October 26, 2012, the record date, through a tax-free stock dividend. Each ARAMARK Holdings stockholder received one share of Seamless Holdings common stock for each share of ARAMARK Holdings common stock held as of the record date.
F-54
Table of Contents
Until October 29, 2012, Seamless Holdings and its subsidiaries were part of the Company and its assets, liabilities, results of operations, and cash flows are included in the amounts reported in these condensed consolidated financial statements until that date.
Following the spin-off, Seamless Holdings is an independent company and the Company retains no ownership interest in Seamless Holdings or Seamless. However, one member of the Seamless Holdings board of directors also serves on ARAMARK Corporation’s board of directors.
In connection with the completion of the spin-off, Seamless Holdings, ARAMARK Corporation, ARAMARK Intermediate and the Company entered into a Distribution Agreement, Seamless Holdings and the Company entered into a Tax Matters Agreement and ARAMARK Corporation entered into a Transition Services Agreement with each of Seamless Holdings and Seamless. These agreements, as well as several additional ancillary agreements, govern the future relationships among the various parties involved in the spin-off. None of the agreements are expected to have a material impact on the Company’s financial position, results of operations, or liquidity.
As a result of this continuing involvement, the Company does not present Seamless Holdings and its subsidiaries as a discontinued operation. The Company’s proforma results of operations for fiscal 2013 and fiscal 2012 would not have been materially different than reported assuming the spin-off and related transactions had occurred at the beginning of the prior year period.
Fiscal 2012
Acquisitions
On October 3, 2011, ARAMARK Refreshment Services, LLC, a subsidiary of the Company, purchased all of the outstanding shares of capital stock of Van Houtte USA Holdings, Inc. (doing business as “Filterfresh”), a provider of office coffee services in the United States, for cash consideration of approximately $145.2 million. The acquisition was financed with cash on hand and borrowings under the Company’s revolving credit facility. Under the terms of the purchase agreement, if a certain significant customer relationship was not maintained within a specific timeframe, the Company was entitled to a refund of a portion of the purchase price. During the second quarter of fiscal 2012, the Company received a refund of approximately $7.4 million related to the termination of this customer relationship.
As part of the acquisition of Filterfresh, the Company acquired a subsidiary with a redeemable noncontrolling interest. The Company classifies redeemable noncontrolling interests outside of stockholders’ equity in the Condensed Consolidated Balance Sheets in “Common Stock Subject to Repurchase and Other.” As of June 28, 2013 and September 28, 2012, the redeemable noncontrolling interest related to the subsidiary was approximately $10.3 million and $10.4 million, respectively. For the three and nine months ended June 28, 2013, net income attributable to redeemable noncontrolling interest was $0.2 million and $0.6 million, respectively. Distributions to redeemable noncontrolling interest was $0.7 million for the nine months ended June 28, 2013. For the three and nine months ended June 29, 2012, net income attributable to redeemable noncontrolling interest was $0.3 million and $0.9 million, respectively. Distributions to redeemable noncontrolling interest was $0.7 million for the nine months ended June 29, 2012.
For the three and nine months ended June 29, 2012, $25.3 million and $85.4 million of sales, respectively, and ($0.3) million and ($2.0) million of net loss, respectively, which included transition and integration costs, were recorded in the Condensed Consolidated Statements of Income related to the acquisition.
F-55
Table of Contents
(3) SUPPLEMENTAL FINANCIAL INFORMATION:
The Company made interest payments of approximately $298.0 million and $317.4 million and income tax payments of approximately $65.0 million and $69.6 million during the nine months ended June 28, 2013 and June 29, 2012, respectively.
As of June 28, 2013 and September 28, 2012, “Accumulated other comprehensive loss” consists of pension plan adjustments (net of tax) of approximately ($52.0) million and ($50.3) million, respectively, foreign currency translation adjustment (net of tax) of approximately ($10.7) million and $20.4 million, respectively, fair value of cash flow hedges (net of tax) of approximately ($20.4) million and ($33.1) million, respectively, and share of equity investees’ accumulated other comprehensive loss (net of tax) of approximately ($10.8) million and ($10.8) million, respectively.
For the three and nine months ended June 28, 2013 and June 29, 2012, the tax effects on comprehensive income (loss) were as follows (in thousands):
| Three Months Ended June 28, 2013 |
Three Months Ended June 29, 2012 |
|||||||
| Foreign currency translation adjustments |
$ | 4,658 | $ | (2,364 | ) | |||
| Fair value of cash flow hedges |
(2,651 | ) | (153 | ) | ||||
| Pension plan adjustments |
398 | (207 | ) | |||||
| Nine Months Ended June 28, 2013 |
Nine Months Ended June 29, 2012 |
|||||||
| Foreign currency translation adjustments |
$ | 11,679 | $ | 3,438 | ||||
| Fair value of cash flow hedges |
(8,187 | ) | (21,654 | ) | ||||
| Pension plan adjustments |
1,009 | (629 | ) | |||||
(4) SEVERANCE AND ASSET WRITE-DOWNS:
During the second quarter of fiscal 2013, the Company initiated a series of actions and further developed its plans to drive efficiency through the consolidation and centralization of its operations. As a result, the Company recorded charges during the second quarter of fiscal 2013 of approximately $40.8 million for severance and related costs. During the third quarter of fiscal 2013, the Company enhanced the benefits under its severance policy which resulted in an additional charge of approximately $6.6 million related to planned terminations initiated during the second quarter. In addition, during the second quarter of fiscal 2013, the Company recorded charges of approximately $11.7 million for goodwill impairments (see Note 5) and other asset write-downs of approximately $11.4 million primarily related to the write-offs of certain client contractual investments.
(5) GOODWILL AND OTHER INTANGIBLE ASSETS:
Goodwill represents the excess of the fair value of consideration paid for an acquired entity over the fair value of assets acquired and liabilities assumed in a business combination. Goodwill is not amortized and is subject to an impairment test that the Company conducts annually or more frequently if a change in circumstances or the occurrence of events indicates that potential impairment exists, using discounted cash flows.
During the second quarter of fiscal 2013, the Company recorded an impairment charge of approximately $11.7 million in the Food and Support Services—International segment to write-off all of the goodwill associated with its reporting units in Spain and Korea. The impairment charge is included in “Cost of services provided” in the Condensed Consolidated Statement of Income. The impairment charge resulted from continued economic weakness in Spain and recent reductions in government support for the Healthcare and Education sectors, two of the primary sectors of the Spanish reporting unit. In Korea, the Company undertook a recent strategic analysis of
F-56
Table of Contents
the Korean reporting unit, which prompted the impairment analysis in the second quarter. The completion of the step two impairment analyses confirmed that goodwill for both reporting units was impaired. The Company estimated these nonrecurring fair value measurements using a discounted cash flow valuation methodology, a Level 3 measurement, which included making assumptions about the future profitability and cash flows of the business.
Changes in total goodwill during the nine months ended June 28, 2013 follow (in thousands):
| Segment |
September 28, 2012 |
Acquisitions and Divestitures |
Impairment | Translation and Other |
June 28, 2013 |
|||||||||||||||
| Food and Support Services—North America |
$ | 3,701,137 | $ | 7,398 | $ | — | $ | (113,477 | ) | $ | 3,595,058 | |||||||||
| Food and Support Services—International |
454,552 | — | (11,698 | ) | (9,431 | ) | 433,423 | |||||||||||||
| Uniform and Career Apparel |
573,785 | — | — | — | 573,785 | |||||||||||||||
|
|
|
|
|
|
|
|
|
|
|
|||||||||||
| $ | 4,729,474 | $ | 7,398 | $ | (11,698 | ) | $ | (122,908 | ) | $ | 4,602,266 | |||||||||
|
|
|
|
|
|
|
|
|
|
|
|||||||||||
The amounts for acquisitions during fiscal 2013 may be revised upon final determination of the purchase price allocations. The other adjustments to the Food and Support Services—North America segment primarily represents the goodwill impact of the Seamless Holdings spin-off (see Note 2).
Other intangible assets consist of (in thousands):
| June 28, 2013 | September 28, 2012 | |||||||||||||||||||||||
| Gross Amount |
Accumulated Amortization |
Net Amount |
Gross Amount |
Accumulated Amortization |
Net Amount |
|||||||||||||||||||
| Customer relationship assets |
$ | 1,884,733 | $ | (1,189,340 | ) | $ | 695,393 | $ | 1,897,933 | $ | (1,064,492 | ) | $ | 833,441 | ||||||||||
| Trade names |
757,040 | (1,583 | ) | 755,457 | 763,127 | (1,419 | ) | 761,708 | ||||||||||||||||
|
|
|
|
|
|
|
|
|
|
|
|
|
|||||||||||||
| $ | 2,641,773 | $ | (1,190,923 | ) | $ | 1,450,850 | $ | 2,661,060 | $ | (1,065,911 | ) | $ | 1,595,149 | |||||||||||
|
|
|
|
|
|
|
|
|
|
|
|
|
|||||||||||||
Acquisition-related intangible assets consist of customer relationship assets, the ARAMARK trade name and other trade names. Customer relationship assets are being amortized principally on a straight-line basis over the expected period of benefit, 5 to 24 years, with a weighted average life of approximately 11 years. The ARAMARK trade name is an indefinite lived intangible asset and is not amortizable but is evaluated for impairment at least annually.
Amortization of intangible assets for the nine months ended June 28, 2013 and June 29, 2012 was approximately $143.9 million and $149.1 million, respectively.
F-57
Table of Contents
(6) BORROWINGS:
As of June 28, 2013 and September 28, 2012, all of the Company’s indebtedness was held by the Company’s wholly-owned subsidiary, ARAMARK Corporation, except for the 8.625% / 9.275% Senior Notes due 2016 (“Holdings Notes”). Long-term borrowings at June 28, 2013 and September 28, 2012 are summarized in the following table (in thousands):
| June 28, 2013 |
September 28, 2012 |
|||||||
| Senior secured revolving credit facility |
$ | 142,024 | $ | — | ||||
| 8.625% / 9.375% Senior Notes, due April 2016 |
— | 595,486 | ||||||
| Senior secured term loan facility, due January 2014 |
— | 650,913 | ||||||
| Senior secured term loan facility, due July 2016 |
3,285,350 | 2,637,920 | ||||||
| Senior secured term loan facility, due September 2019 |
1,393,310 | — | ||||||
| 8.50% senior notes, due February 2015 |
— | 1,280,000 | ||||||
| Senior floating rate notes, due February 2015 |
— | 500,000 | ||||||
| 5.75% senior notes, due March 2020 |
1,000,000 | — | ||||||
| Receivables Facility, due January 2015 |
300,000 | 263,800 | ||||||
| Capital leases |
54,248 | 49,584 | ||||||
| Other |
42,124 | 31,064 | ||||||
|
|
|
|
|
|||||
| 6,217,056 | 6,008,767 | |||||||
| Less—current portion |
(71,139 | ) | (37,462 | ) | ||||
|
|
|
|
|
|||||
| $ | 6,145,917 | $ | 5,971,305 | |||||
|
|
|
|
|
|||||
On January 26, 2007, ARAMARK Corporation (i) entered into a $4.15 billion senior secured term loan facility with an original maturity date of January 26, 2014, (ii) issued $1.28 billion of 8.50% senior notes due 2015 (the “Fixed Rate Notes”) and $500 million of senior floating rate notes due 2015 (the “Floating Rate Notes”), (iii) entered into a $600 million senior secured revolving credit facility with an original six-year maturity, and (iv) entered into a synthetic letter of credit facility for up to $250 million (which was reduced to $200 million in January 2008).
In the second quarter of fiscal 2013, ARAMARK Corporation completed a refinancing, repurchasing all of the outstanding notes of both ARAMARK Corporation as well as the Holdings Notes issued at Holdings. ARAMARK Corporation refinanced that debt with new term loans and new notes as described herein.
Senior Secured Credit Agreement
Senior Secured Term Loan Facilities
Amendment Agreement No. 4
On February 22, 2013, ARAMARK Corporation entered into Amendment Agreement No. 4 (“Amendment Agreement No. 4”) to the Amended and Restated Credit Agreement dated as of March 26, 2010 (as amended, the “Credit Agreement”) which provided for, among other things, additional term loans and the extension of a portion of the revolving credit facility. On March 7, 2013, ARAMARK Corporation borrowed $1,400 million of term loans pursuant to Amendment Agreement No. 4. The new term loans were borrowed by ARAMARK Corporation with an original issue discount of 0.50%. The term loans under Amendment Agreement No. 4 mature on September 7, 2019. These term loans have a Eurocurrency rate margin, with respect to the U.S. dollar denominated, Canadian dollar denominated and Euro denominated term loans, of 3.00% and base rate margin on U.S. dollar denominated base rate term loans of 2.00%. Eurocurrency rate borrowings have a minimum LIBOR rate of 1.00% and base rate borrowings have a minimum rate of 2.00%.
F-58
Table of Contents
Amendment Agreement No. 4 also increases the applicable margins for ARAMARK Corporation’s existing term loans and the fee rates on letter of credit deposits with respect to the synthetic letter of credit facility. From and after the effective date of Amendment Agreement No. 4, (A) the Eurocurrency rate margin and letter of credit fees with respect to the U.S. dollar denominated, Canadian dollar denominated and Euro denominated term loans and extended maturity letter of credit deposits increased 0.25% to 3.50%, (B) the margin on U.S. dollar denominated base rate term loans increased 0.25% to 2.50% and (C) the margins on yen denominated term loans and sterling denominated term loans increased 0.125% to 3.50%.
Amendment Agreement No. 4 also provides for an increase in the maximum Consolidated Secured Debt Ratio to reflect the additional secured indebtedness associated with the new term loan borrowings and provides certain additional flexibility with respect to the restricted payments covenant. As of June 28, 2013, we were in compliance with the Consolidated Secured Debt Ratio.
During the second quarter of fiscal 2013, approximately $14.0 million of third-party costs directly attributable to the term loans borrowed pursuant to Amendment Agreement No. 4 were capitalized and are included in “Other Assets” in the Condensed Consolidated Balance Sheets, of which approximately $6.2 million were paid to entities affiliated with GS Capital Partners and J.P. Morgan Partners.
Amendment Agreement No. 3
On December 20, 2012, ARAMARK Corporation amended the senior secured credit agreement (“Amendment Agreement No. 3”) to, among other things, borrow $670 million of new term loans with a maturity date of July 26, 2016. The proceeds of the new term loans were used primarily to repay approximately $650 million of existing term loans with a maturity date of January 26, 2014 and to fund certain discounts, fees and costs associated with the amendment. The existing term loans repaid in connection with Amendment Agreement No. 3 included U.S. dollar denominated term loans as well as non-U.S. dollar term loans and consisted of the remaining balance of the term loans maturing in January 2014. The new term loans were borrowed by ARAMARK Corporation with an original issue discount of 0.25%.
During the first quarter of fiscal 2013, approximately $11.6 million of third-party costs directly attributable to Amendment Agreement No. 3 were expensed and are included in “Interest and Other Financing Costs, net” in the Condensed Consolidated Statements of Income. Approximately $4.6 million of the third-party costs were paid to entities affiliated with GS Capital Partners and J.P. Morgan Partners.
Amendment Agreement No. 2
On February 29, 2012, ARAMARK Corporation entered into Amendment Agreement No. 2 (“Amendment Agreement No. 2”) to the Credit Agreement. Amendment Agreement No. 2 extended the maturity date of an aggregate U.S. dollar equivalent of approximately $1,231.6 million of ARAMARK Corporation’s term loans and $66.7 million of letter of credit deposits securing ARAMARK Corporation’s synthetic letter of credit facility to July 26, 2016. Consenting lenders received a one-time amendment fee of approximately $3.2 million in the aggregate on their total loan commitments.
During the second quarter of fiscal 2012, approximately $7.5 million of third-party costs directly attributable to Amendment Agreement No. 2 were expensed and are included in “Interest and Other Financing Costs, net” in the Condensed Consolidated Statements of Income. Approximately $4.5 million of the third-party costs were paid to entities affiliated with GS Capital Partners and J.P. Morgan Partners.
Senior Secured Revolving Credit Facility
Amendment Agreement No. 4
Amendment Agreement No. 4 provides for the extension, from January 26, 2015 to January 26, 2017, of the maturity of $500 million in revolving lender commitments of the existing $550 million revolving credit facility. The maturity date of the extended revolving credit facilities would accelerate to April 26, 2016 if term loans
F-59
Table of Contents
under the Credit Agreement that are due on July 26, 2016 remain outstanding on April 26, 2016. Third party costs directly attributable to the revolving credit facility of approximately $2.8 million were capitalized and are included in “Other Assets” in the Condensed Consolidated Balance Sheets, of which approximately $0.6 million were paid to entities affiliated with GS Capital Partners and J.P. Morgan Partners.
Amendment Agreement No. 5
On March 22, 2013, ARAMARK Corporation entered into Amendment Agreement No. 5 (“Amendment Agreement No. 5”) to the Credit Agreement. Amendment Agreement No. 5 increased the aggregate revolving loan commitments made available to ARAMARK Corporation under the Credit Agreement by $55.0 million to $605.0 million.
8.625% / 9.375% Senior Notes due 2016
On April 18, 2011, the Company completed a private placement of $600 million, net of a 1% discount, in aggregate principal amount of 8.625% / 9.375% Senior Notes due 2016. Interest on the Holdings Notes accrues at the rate of 8.625% per annum with respect to interest payments made in cash and 9.375% per annum with respect to any payment in-kind interest. The Holdings Notes are obligations of the Company, are not guaranteed by ARAMARK Corporation and its subsidiaries and are structurally subordinated to all existing and future indebtedness and other liabilities of ARAMARK Corporation and its subsidiaries.
5.75% Senior Notes due 2020
On March 7, 2013, ARAMARK Corporation issued $1,000 million of 5.75% Senior Notes due 2020 (the “Senior Notes”) pursuant to a new indenture, dated as of March 7, 2013 (the “Indenture”), entered into by ARAMARK Corporation. The Senior Notes were issued at par. The Senior Notes were sold only to qualified institutional buyers pursuant to Rule 144A under the Securities Act of 1933, as amended (the “Securities Act”), and to certain persons in offshore transactions in reliance on Regulation S, under the Securities Act. The Senior Notes are unsecured obligations of ARAMARK Corporation. The Senior Notes rank equal in right of payment to all of ARAMARK Corporation’s existing and future senior debt and senior in right of payment to all of ARAMARK Corporation’s existing and future debt that is expressly subordinated in right of payment to the Senior Notes. The Senior Notes are guaranteed on a senior, unsecured basis by substantially all of the domestic subsidiaries of ARAMARK Corporation. Interest on the Senior Notes is payable on March 15 and September 15 of each year, commencing on September 15, 2013. The Senior Notes and guarantees are structurally subordinated to all of the liabilities of any of ARAMARK Corporation’s subsidiaries that do not guarantee the Senior Notes. The Senior Notes mature on March 15, 2020.
Prior to March 15, 2015, ARAMARK Corporation may redeem up to 40% of the Senior Notes with the proceeds from one or more qualified equity offerings at a price equal to 105.750% of the principal amount of the Senior Notes redeemed, plus accrued and unpaid interest and additional interest, if any, to the date of redemption. In addition, at any time prior to March 15, 2015, ARAMARK Corporation may redeem all or a portion of the Senior Notes at a price equal to 100% of the principal amount of the Senior Notes redeemed plus a “make whole” premium and accrued and unpaid interest and additional interest, if any, to the date of redemption. Thereafter, ARAMARK Corporation has the option to redeem all or a portion of the Senior Notes at any time at the redemption prices set forth in the Indenture.
In the event of certain types of changes of control, the holders of the Senior Notes may require ARAMARK Corporation to purchase for cash all or a portion of their Senior Notes at a purchase price equal to 101% of the principal amount of such Senior Notes, plus accrued and unpaid interest, if any, to the date of repurchase.
The Indenture contains covenants limiting ARAMARK Corporation’s ability and the ability of its restricted subsidiaries to: incur additional indebtedness or issue certain preferred shares; pay dividends and make certain distributions, investments and other restricted payments; create certain liens; sell assets; enter into transactions
F-60
Table of Contents
with affiliates; limit the ability of restricted subsidiaries to make payments to ARAMARK Corporation; enter into sale and leaseback transactions; merge, consolidate, sell or otherwise dispose of all or substantially all of ARAMARK Corporation’s assets; and designate ARAMARK Corporation’s subsidiaries as unrestricted subsidiaries. The Indenture also provides for events of default which, if any of them occurs, would permit or require the principal of and accrued interest on the Senior Notes to become or to be declared due and payable.
During the second quarter of fiscal 2013, approximately $13.8 million of third-party costs directly attributable to the Senior Notes were capitalized and are included in “Other Assets” in the Condensed Consolidated Balance Sheets. Approximately $7.3 million of the third-party costs were paid to entities affiliated with GS Capital Partners and J.P. Morgan Partners.
Registration Rights Agreement
On March 7, 2013, ARAMARK Corporation entered into a registration rights agreement (the “Registration Rights Agreement”) among the guarantors named therein and Goldman, Sachs & Co. and J.P. Morgan Securities LLC, as representatives of the several initial purchasers, with respect to the Senior Notes. In the Registration Rights Agreement, ARAMARK Corporation agreed to, among other things, (1) file an exchange offer registration statement pursuant to which ARAMARK Corporation will offer exchange notes with terms identical in all material respects to, and evidencing the same indebtedness as, the Senior Notes, in exchange for such notes (but which exchange notes will not contain terms with respect to transfer restrictions or provide for the additional interest described below); and (2) use commercially reasonable efforts to cause the exchange offer registration statement to be declared effective under the Securities Act. ARAMARK Corporation has agreed to use commercially reasonable efforts to cause the exchange offer to be consummated or, if required, to have one or more shelf registration statements declared effective, within 390 days after the issue date of the Senior Notes.
If ARAMARK Corporation fails to satisfy this obligation (a “registration default”), the annual interest rate on the Senior Notes will increase by 0.25%. The annual interest rate on the Senior Notes will increase by an additional 0.25% for each subsequent 90-day period during which the registration default continues, up to a maximum additional interest rate of 1.00% per year over the applicable interest rate in the Indenture. If the registration default is corrected, the applicable interest rate on the Senior Notes will revert to the original level.
Repurchase of 8.50% Senior Notes due 2015, Senior Floating Rate Notes due 2015 and 8.625% / 9.375% Senior Notes due 2016
Tender Offer
In February 2013, ARAMARK Corporation and the Company commenced a tender offer to purchase for cash any and all of the Holdings Notes and the Fixed Rate Notes and the Floating Rate Notes (collectively, the “Notes”). On March 7, 2013, ARAMARK Corporation used a portion of the aggregate proceeds of the Senior Notes offering and the borrowings under the new term loans pursuant to Amendment Agreement No. 4 to purchase all Notes tendered by March 6, 2013, the early tender date. On March 7, 2013, ARAMARK Corporation issued redemption notices for the portions of ARAMARK Corporation’s Fixed Rate Notes and Floating Rate Notes that remained outstanding, including accrued and unpaid interest, as of March 7, 2013, which provides for the redemption of such notes on April 6, 2013 at prices of 100% of the principal amount thereof. On March 7, 2013, the Company issued a redemption notice for the portion of the Holdings Notes that remained outstanding as of March 7, 2013, including accrued and unpaid interest, which notices provide for the redemption of the Holdings Notes on May 1, 2013 at a price of 101% of the principal amount thereof.
On March 7, 2013, ARAMARK Corporation and the Company deposited sufficient funds in trust with the trustee under the indenture governing the Notes in full and complete satisfaction and discharge of the remaining aggregate principal amount of such notes, including accrued and unpaid interest (the “Satisfaction and Discharge”). As a result of the Satisfaction and Discharge, the trustee became the primary obligor for payment of the remaining Notes on or about the redemption notice date of March 7, 2013. ARAMARK Corporation and the
F-61
Table of Contents
Company had a contingent obligation for payment of the Notes were the trustee to default on its payment obligations. The Company believed the risk of such default was remote and therefore did not recorded a related liability. The remaining Fixed Rate Notes and Floating Rate Notes were redeemed by the trustee on April 6, 2013. The remaining Holdings Notes were redeemed by the trustee on May 1, 2013.
During the second quarter of fiscal 2013, in connection with the tender offer and Satisfaction and Discharge, the Company recorded $39.8 million of charges to “Interest and Other Financing Costs, net” in the Condensed Consolidated Statements of Income, consisting of $12.9 million of third party costs for the tender offer premium and $26.9 million of non-cash charges for the write-off of deferred financing costs.
(7) DERIVATIVE INSTRUMENTS:
The Company enters into contractual derivative arrangements to manage changes in market conditions related to interest on debt obligations, foreign currency exposures and exposure to fluctuating natural gas, gasoline and diesel fuel prices. Derivative instruments utilized during the period include interest rate swap agreements, foreign currency forward exchange contracts, and gasoline and diesel fuel agreements. All derivative instruments are recognized as either assets or liabilities on the balance sheet at fair value at the end of each quarter. The counterparties to the Company’s contractual derivative agreements are all major international financial institutions. The Company is exposed to credit loss in the event of nonperformance by these counterparties. The Company continually monitors its positions and the credit ratings of its counterparties, and does not anticipate nonperformance by the counterparties. For designated hedging relationships, the Company formally documents the hedging relationship and its risk management objective and strategy for undertaking the hedge, the hedging instrument, the hedged item, the nature of the risk being hedged, how the hedging instrument’s effectiveness in offsetting the hedged risk will be assessed prospectively and retrospectively, and a description of the method of measuring ineffectiveness. The Company also formally assesses, both at the hedge’s inception and on an ongoing basis, whether the derivatives that are used in hedging transactions are highly effective in offsetting cash flows of hedged items.
Cash Flow Hedges
The Company previously entered into $1.0 billion of interest rate swap agreements, fixing the rate on a like amount of variable rate borrowings. During the third quarter of fiscal 2013, the Company entered into $300 million of forward starting interest rate swap agreements to hedge the cash flow risk of variability in interest payments on variable rate borrowings. The Company entered into an additional $600 million of forward starting interest rate swap agreements to hedge the cash flow risk of variability in interest payments on variable rate borrowings subsequent to June 28, 2013. Changes in the fair value of a derivative that is designated as and meets all the required criteria for a cash flow hedge are recorded in accumulated other comprehensive income (loss) and reclassified into earnings as the underlying hedged item affects earnings. As of June 28, 2013 and September 28, 2012, approximately ($16.5) million and ($28.1) million of unrealized net of tax losses related to the interest rate swaps were included in “Accumulated other comprehensive loss,” respectively. The hedge ineffectiveness for these cash flow hedging instruments during the nine months ended June 28, 2013 and June 29, 2012 was not material.
The Company previously entered into a $169.6 million amortizing cross currency swap to mitigate the risk of variability in principal and interest payments on the Canadian subsidiary’s variable rate debt denominated in U.S. dollars. The agreement fixes the rate on the variable rate borrowings and mitigates changes in the Canadian dollar/U.S. dollar exchange rate. In March 2012, the cross currency swap was amended to match the terms of the Canadian subsidiary’s debt that was impacted by Amendment Agreement No. 2. A portion of the swap was amended and extended to match the terms related to its variable rate debt denominated in U.S. dollars that was extended under Amendment Agreement No. 2. The Company has designated the amended swap as cash flow hedges. During the nine months ended June 28, 2013 and June 29, 2012, approximately $4.7 million and ($1.1) million of unrealized net of tax gains (losses) related to the swap were added to “Accumulated other comprehensive loss,” respectively. Approximately ($5.5) million and $4.6 million were reclassified to offset net
F-62
Table of Contents
translation gains (losses) on the foreign currency denominated debt during the nine months ended June 28, 2013 and June 29, 2012, respectively. As of June 28, 2013 and September 28, 2012, unrealized net of tax losses of approximately ($3.9) million and ($5.0) million related to the cross currency swap were included in “Accumulated other comprehensive loss,” respectively. The hedge ineffectiveness for this cash flow hedging instrument during the nine months ended June 28, 2013 was not material. As a result of amending the cross currency swap, the hedge ineffectiveness for the nine months ended June 29, 2012 was approximately $3.0 million, which was recorded in “Interest and Other Financing Costs, net” in the Condensed Consolidated Statements of Income.
As a result of Amendment Agreement No. 3, the Company de-designated the cross currency swap that hedged the Canadian subsidiary’s term loan with a maturity date of January 26, 2014. Prior to Amendment Agreement No. 3, these contracts met the required criteria to be designated as cash flow hedging instruments. As a result, approximately $3.2 million was reclassified from “Accumulated other comprehensive loss” in the Condensed Consolidated Balance Sheets to “Interest and Other Financing Costs, net” in the Condensed Consolidated Statements of Income during the nine months ended June 28, 2013.
The Company previously entered into a series of pay fixed/receive floating natural gas hedge agreements based on a NYMEX price in order to limit its exposure to price increases for natural gas, primarily in the Uniform and Career Apparel segment. As of June 28, 2013, the Company has no contracts outstanding. There was no hedge ineffectiveness for the nine months ended June 29, 2012.
The following table summarizes the net of tax effect of our derivatives designated as cash flow hedging instruments on Comprehensive Income (in thousands):
| Three Months Ended June 28, 2013 |
Three Months Ended June 29, 2012 |
|||||||
| Interest rate swap agreements |
$ | 5,297 | $ | (576 | ) | |||
| Cross currency swap agreements |
(1,500 | ) | 858 | |||||
| Natural gas hedge agreements |
— | 101 | ||||||
|
|
|
|
|
|||||
| $ | 3,797 | $ | 383 | |||||
|
|
|
|
|
|||||
| Nine Months Ended June 28, 2013 |
Nine Months Ended June 29, 2012 |
|||||||
| Interest rate swap agreements |
$ | 11,595 | $ | 28,725 | ||||
| Cross currency swap agreements |
1,145 | 5,336 | ||||||
| Natural gas hedge agreements |
— | 40 | ||||||
|
|
|
|
|
|||||
| $ | 12,740 | $ | 34,101 | |||||
|
|
|
|
|
|||||
Derivatives not Designated in Hedging Relationships
The Company elected to de-designate the cross currency swaps that were hedged against the Canadian subsidiary’s term loan with a maturity date of January 26, 2014 due to the repayment of the term loan as a result of Amendment Agreement No. 3. As a result, on a prospective basis, changes in the fair value of these swaps are recorded in earnings. For the three and nine months ended June 28, 2013, the Company recorded a pretax gain (loss) of approximately $2.4 million and $4.6 million for the change in the fair value of these swaps in “Interest and Other Financing Costs, net” in the Condensed Consolidated Statements of Income, respectively. The changes in the fair value of these swaps are expected to offset future currency transaction gains and losses on a U.S. dollar denominated intercompany loan between the Company and its Canadian subsidiary.
The Company entered into a series of pay fixed/receive floating gasoline and diesel fuel agreements based on the Department of Energy weekly retail on-highway index in order to limit its exposure to price fluctuations for gasoline and diesel fuel. As of June 28, 2013, the Company has contracts for approximately 1.3 million
F-63
Table of Contents
gallons outstanding for fiscal 2013 and fiscal 2014. During the nine months ended June 28, 2013, the Company entered into contracts totaling approximately 0.8 million gallons. The Company does not record its gasoline and diesel fuel agreements as hedges for accounting purposes. As such, changes in the fair value of these contracts will be recorded in earnings. During the nine months ended June 28, 2013, the Company recorded a pretax gain (loss) of ($0.6) million in the Condensed Consolidated Statements of Income for the change in the fair value on these agreements. During the nine months ended June 29, 2012, the Company recorded a pretax gain (loss) of ($0.9) million in the Condensed Consolidated Statements of Income for the change in the fair value on these agreements, respectively.
As of June 28, 2013, the Company had foreign currency forward exchange contracts outstanding with notional amounts of €88.4 million and £44.2 million to mitigate the risk of changes in foreign currency exchange rates on intercompany loans to certain international subsidiaries. Gains and losses on these foreign currency exchange contracts are recognized in income currently as the contracts were not designated as hedging instruments, substantially offsetting currency transaction gains and losses on the intercompany loans.
The following table summarizes the location and fair value, using Level 2 inputs, of the Company’s derivatives designated and not designated as hedging instruments in our Condensed Consolidated Balance Sheets (in thousands):
| Balance Sheet Location | June 28, 2013 | September 28, 2012 | ||||||||
| ASSETS |
||||||||||
| Designated as hedging instruments: |
||||||||||
| Interest rate swap agreements |
Other Assets | $ | 1,149 | $ | — | |||||
|
|
|
|
|
|||||||
| 1,149 | — | |||||||||
|
|
|
|
|
|||||||
| Not designated as hedging instruments: |
||||||||||
| Foreign currency forward exchange contracts |
Prepayments | 1,186 | 251 | |||||||
| Gasoline and diesel fuel agreements |
Prepayments | 144 | 696 | |||||||
|
|
|
|
|
|||||||
| 1,330 | 947 | |||||||||
|
|
|
|
|
|||||||
| $ | 2,479 | $ | 947 | |||||||
|
|
|
|
|
|||||||
| LIABILITIES |
||||||||||
| Designated as hedging instruments: |
||||||||||
| Interest rate swap agreements |
Accrued Expenses | $ | 6,739 | $ | — | |||||
| Interest rate swap agreements |
Other Noncurrent Liabilities | 21,729 | 46,484 | |||||||
| Cross currency swap agreements |
Other Noncurrent Liabilities | 14,541 | 45,406 | |||||||
|
|
|
|
|
|||||||
| 43,009 | 91,890 | |||||||||
|
|
|
|
|
|||||||
| Not designated as hedging instruments: |
||||||||||
| Cross currency swap agreements |
Accrued Expenses | 12,096 | — | |||||||
|
|
|
|
|
|||||||
| $ | 55,105 | $ | 91,890 | |||||||
|
|
|
|
|
|||||||
F-64
Table of Contents
The following table summarizes the location of (gain) loss reclassified from “Accumulated other comprehensive loss” into earnings for derivatives designated as hedging instruments and the location of (gain) loss from the derivatives not designated as hedging instruments in the Condensed Consolidated Statements of Income (in thousands):
| Account | Three Months Ended June 28, 2013 |
Three Months Ended June 29, 2012 |
||||||||
| Designated as hedging instruments: |
||||||||||
| Interest rate swap agreements |
Interest Expense | $ | 5,740 | $ | 5,508 | |||||
| Cross currency swap agreements |
Interest Expense | 250 | 1,741 | |||||||
| Natural gas hedge agreements |
Cost of services provided | — | 147 | |||||||
|
|
|
|
|
|||||||
| $ | 5,990 | $ | 7,396 | |||||||
|
|
|
|
|
|||||||
| Not designated as hedging instruments: |
||||||||||
| Cross currency swap agreements |
Interest Expense | $ | (2,429 | ) | $ | — | ||||
| Gasoline and diesel fuel agreements |
Cost of services provided | 250 | 2,419 | |||||||
| Foreign currency forward exchange contracts |
Interest Expense | 1,764 | (3,886 | ) | ||||||
|
|
|
|
|
|||||||
| $ | (415 | ) | $ | (1,467 | ) | |||||
|
|
|
|
|
|||||||
| Account | Nine Months Ended June 28, 2013 |
Nine Months Ended June 29, 2012 |
||||||||
| Designated as hedging instruments: |
||||||||||
| Interest rate swap agreements |
Interest Expense | $ | 16,950 | $ | 60,966 | |||||
| Cross currency swap agreements |
Interest Expense | 3,256 | 5,671 | |||||||
| Natural gas hedge agreements |
Cost of services provided | — | 276 | |||||||
|
|
|
|
|
|||||||
| $ | 20,206 | $ | 66,913 | |||||||
|
|
|
|
|
|||||||
| Not designated as hedging instruments: |
||||||||||
| Cross currency swap agreements |
Interest Expense | $ | (1,408 | ) | $ | — | ||||
| Gasoline and diesel fuel agreements |
Cost of services provided | 119 | 1,416 | |||||||
| Foreign currency forward exchange contracts |
Interest Expense | (4,278 | ) | (2,146 | ) | |||||
|
|
|
|
|
|||||||
| $ | (5,567 | ) | $ | (730 | ) | |||||
|
|
|
|
|
|||||||
At June 28, 2013, the net of tax loss expected to be reclassified from “Accumulated other comprehensive loss” into earnings over the next twelve months based on current market rates is approximately $13.3 million.
(8) CAPITAL STOCK:
Pursuant to the Stockholders Agreement of the Company, upon termination of employment from the Company or one of its subsidiaries, members of the Company’s management (other than Mr. Neubauer) who hold shares of common stock of the Company can cause the Company to repurchase all of their initial investment shares (as defined) or shares acquired as a result of the exercise of Installment Stock Purchase Opportunities at appraised fair market value. Generally, payment for shares repurchased could be, at the Company’s option, in cash or installment notes, which would be effectively subordinated to all indebtedness of ARAMARK Corporation. The amount of this potential repurchase obligation has been classified outside of stockholders’ equity, which reflects the Company’s investment basis and capital structure in the Company’s condensed consolidated financial statements. The amount of common stock subject to repurchase as of June 28, 2013 and September 28, 2012 was $153.6 million and $167.5 million, which is based on approximately 9.5 million and 11.0 million shares of common stock of the Company valued at $16.21 and $15.17 per share, respectively. The fair value of the common stock subject to repurchase is calculated using discounted cash flow techniques and
F-65
Table of Contents
comparable public company trading multiples. Inputs used in the discounted cash flow analysis include the weighted average cost of capital, long-term revenue growth rates, long-term EBIT margins and residual growth rates. Inputs used in the comparable public company trading multiples include the last-twelve-months’ EBITDA multiple, forward EBITDA multiples and control premium. During the nine months ended June 28, 2013 and June 29, 2012, approximately $60.2 million and $51.3 million of common stock of the Company was repurchased, respectively, and has been reflected in the Company’s condensed consolidated financial statements. The Stockholders Agreement, the senior secured credit agreement and the indenture governing the Senior Notes contain limitations on the amount the Company can expend for such share repurchases.
(9) SHARE-BASED COMPENSATION:
The Company adopted the Fourth Amended and Restated ARAMARK Holdings Corporation 2007 Management Stock Incentive Plan (the “Amended Stock Incentive Plan”) on June 20, 2013. The Amended Stock Incentive Plan now provides for the grant of restricted stock units and restricted stock in addition to stock options. The Company also approved a new form of non-qualified stock option award agreement which provides for 100% time-based vesting. Options granted under earlier forms of non-qualified discretionary stock option agreements provided for 50% time-based vesting and 50% performance-based vesting. Finally, the Company offered to holders of outstanding Installment Stock Purchase Opportunities (“ISPOs”) the ability to exchange such awards for restricted stock and non-qualified stock options, which were granted pursuant to a restricted stock award agreement and a replacement stock option award agreement, respectively, with Holdings. On June 20, 2013, the Compensation and Human Resources Committee of the Company approved a new restricted stock award agreement and non-qualified replacement stock option award agreement to be used in connection with the exchange. Subsequent to June 28, 2013, as a result of the exchange, outstanding ISPOs were converted into approximately 0.2 million of restricted stock awards and approximately 1.1 million of non-qualified replacement stock option awards. The accounting for this modification will be reflected beginning in the fourth quarter of fiscal 2013.
During the three and nine months ended June 28, 2013, share-based compensation expense was approximately $3.5 million, before taxes of $1.4 million, and approximately $12.3 million, before taxes of $4.9 million, respectively. During the three and nine months ended June 29, 2012, share-based compensation expense was approximately $0.9 million, before taxes of $0.4 million, and approximately $12.5 million, before taxes of $4.9 million, respectively.
Stock Options
Time-Based Options
The compensation cost charged to expense during the three and nine months ended June 28, 2013 for Time-Based Options was approximately $1.8 million and $5.8 million, respectively. The compensation cost charged to expense during the three and nine months ended June 29, 2012 for Time-Based Options was approximately $2.1 million and $6.2 million, respectively.
Performance-Based Options
During the three and nine months ended June 28, 2013, the Company recognized a charge to expense of approximately $1.5 million and $4.9 million for Performance-Based Options, respectively. During the three and nine months ended June 29, 2012, the Company recognized a reduction to expense of approximately ($2.1) million and a charge to expense of approximately $3.5 million for Performance-Based Options, respectively. During the third quarter of fiscal 2012, the Company reversed approximately $2.4 million of compensation expense related to expense previously recognized for the Performance-Based Options as meeting the 2012 EBIT performance target was not probable.
F-66
Table of Contents
Installment Stock Purchase Opportunities
The Company recorded approximately $0.2 million and $0.8 million of compensation expense related to ISPOs during the three and nine months ended June 28, 2013, respectively. The Company recorded approximately $0.5 million and $0.8 million of compensation expense related to ISPOs during the three and nine months ended June 29, 2012, respectively.
Seamless Unit Options
The Company recognized compensation expense of approximately $0.2 million for Seamless unit options during the nine months ended June 28, 2013. During the three and nine months ended June 29, 2012, the Company recognized compensation expense of approximately $0.4 million and $1.5 million for Seamless unit options, respectively.
Deferred Stock Units
The Company granted 42,462 deferred stock units during the nine months ended June 28, 2013. The compensation cost charged to expense during the nine months ended June 28, 2013 for deferred stock units was approximately $0.6 million. The Company granted 34,480 deferred stock units during the nine months ended June 29, 2012. The compensation cost charged to expense during the nine months ended June 29, 2012 for deferred stock units was approximately $0.5 million.
(10) ACCOUNTS RECEIVABLE SECURITIZATION:
ARAMARK Corporation has an agreement (the “Receivables Facility”) with several financial institutions whereby it sells on a continuous basis an undivided interest in all eligible trade accounts receivable, as defined in the Receivables Facility. The maximum amount available under the facility is $300 million, which expires in January 2015. Pursuant to the Receivables Facility, ARAMARK Corporation formed ARAMARK Receivables, LLC, a wholly-owned, consolidated, bankruptcy-remote subsidiary. ARAMARK Receivables, LLC was formed for the sole purpose of buying and selling receivables generated by certain subsidiaries of ARAMARK Corporation. Under the Receivables Facility, ARAMARK Corporation and certain of its subsidiaries transfer without recourse all of their accounts receivable to ARAMARK Receivables, LLC. As collections reduce previously transferred interests, interests in new, eligible receivables are transferred to ARAMARK Receivables, LLC, subject to meeting certain conditions. At June 28, 2013 and September 28, 2012, the amount of outstanding borrowings under the Receivables Facility was $300.0 million and $263.8 million and is included in “Long-Term Borrowings,” respectively.
(11) EQUITY INVESTMENTS:
The Company’s principal equity method investment is its 50% ownership interest in AIM Services Co., Ltd., a Japanese food and support services company (approximately $183.6 million and $233.4 million at June 28, 2013 and September 28, 2012, respectively, which is included in “Other Assets” in the Condensed Consolidated Balance Sheets). Summarized financial information for AIM Services Co., Ltd. follows (in thousands):
| Three Months Ended June 28, 2013 |
Three Months Ended June 29, 2012 |
|||||||
| Sales |
$ | 398,610 | $ | 471,782 | ||||
| Gross profit |
47,148 | 55,495 | ||||||
| Net income |
6,803 | 8,723 | ||||||
| Nine Months Ended June 28, 2013 |
Nine Months Ended June 29, 2012 |
|||||||
| Sales |
$ | 1,294,082 | $ | 1,431,878 | ||||
| Gross profit |
149,553 | 165,833 | ||||||
| Net income |
22,183 | 26,319 | ||||||
F-67
Table of Contents
The period to period comparisons of the summarized financial information for AIM Services Co., Ltd., presented in U.S. dollars above, is significantly impacted by currency translation. ARAMARK’s equity in undistributed earnings of AIM Services Co., Ltd., net of amortization related to purchase accounting for the 2007 Transaction, was $2.8 million and $8.0 million for the three and nine months ended June 28, 2013, respectively. ARAMARK’s equity in undistributed earnings of AIM Services Co., Ltd., net of amortization related to purchase accounting for the 2007 Transaction, was $3.3 million and $10.0 million for the three and nine months ended June 29, 2012, respectively.
(12) BUSINESS SEGMENTS:
Sales and operating income by reportable segment follow (in thousands):
| Sales |
Three Months Ended June 28, 2013 |
Three Months Ended June 29, 2012 |
||||||
| Food and Support Services—North America |
$ | 2,405,860 | $ | 2,319,566 | ||||
| Food and Support Services—International |
727,516 | 673,907 | ||||||
| Uniform and Career Apparel |
356,654 | 342,621 | ||||||
|
|
|
|
|
|||||
| $ | 3,490,030 | $ | 3,336,094 | |||||
|
|
|
|
|
|||||
| Operating Income |
Three Months Ended June 28, 2013 |
Three Months Ended June 29, 2012 |
||||||
| Food and Support Services—North America |
$ | 73,146 | $ | 74,110 | ||||
| Food and Support Services—International |
28,694 | 22,979 | ||||||
| Uniform and Career Apparel |
35,388 | 30,386 | ||||||
|
|
|
|
|
|||||
| 137,228 | 127,475 | |||||||
| Corporate |
(13,632 | ) | (12,293 | ) | ||||
|
|
|
|
|
|||||
| Operating Income |
123,596 | 115,182 | ||||||
| Interest and other financing costs, net |
(80,917 | ) | (101,595 | ) | ||||
|
|
|
|
|
|||||
| Income Before Income Taxes |
$ | 42,679 | $ | 13,587 | ||||
|
|
|
|
|
|||||
| Sales |
Nine Months Ended June 28, 2013 |
Nine Months Ended June 29, 2012 |
||||||
| Food and Support Services—North America |
$ | 7,217,759 | $ | 7,053,423 | ||||
| Food and Support Services—International |
2,154,567 | 2,030,425 | ||||||
| Uniform and Career Apparel |
1,057,356 | 1,020,418 | ||||||
|
|
|
|
|
|||||
| $ | 10,429,682 | $ | 10,104,266 | |||||
|
|
|
|
|
|||||
| Operating Income |
Nine Months Ended June 28, 2013 |
Nine Months Ended June 29, 2012 |
||||||
| Food and Support Services—North America |
$ | 298,935 | $ | 301,429 | ||||
| Food and Support Services—International |
37,877 | 65,822 | ||||||
| Uniform and Career Apparel |
89,761 | 86,971 | ||||||
|
|
|
|
|
|||||
| 426,573 | 454,222 | |||||||
| Corporate |
(47,443 | ) | (38,450 | ) | ||||
|
|
|
|
|
|||||
| Operating Income |
379,130 | 415,772 | ||||||
| Interest and other financing costs, net |
(341,392 | ) | (356,387 | ) | ||||
|
|
|
|
|
|||||
| Income from Continuing Operations Before Income Taxes |
$ | 37,738 | $ | 59,385 | ||||
|
|
|
|
|
|||||
F-68
Table of Contents
In the first and second fiscal quarters, within the Food and Support Services—North America segment, historically there has been a lower level of activity at the sports, entertainment and recreational food service operations that is partly offset by increased activity in the educational operations. However, in the third and fourth fiscal quarters, historically there has been a significant increase at sports, entertainment and recreational accounts that is partially offset by the effect of summer recess on the educational accounts.
Food and Support Services—North America sales and operating income for the nine months ended June 28, 2013 were negatively affected by Hurricane Sandy and the National Hockey League lockout. Food and Support Services—North America operating income for the three and nine months ended June 28, 2013 includes $6.6 million and $33.7 million of severance and related costs, respectively. Food and Support Services—North America operating income for the nine months ended June 28, 2013 also includes $6.8 million of asset write-offs and other income recognized of approximately $14.0 million relating to the recovery of the Company’s investment (possessory interest) at one of the National Park Service (“NPS”) sites in the Sports, Leisure and Corrections sector, which was terminated in the current year. Food and Support Services—North America operating income for the nine months ended June 29, 2012 includes transition and integration costs of $4.3 million related to the Filterfresh acquisition and a favorable risk insurance adjustment of $1.7 million related to favorable claims experience.
Food and Support Services—International operating income for the nine months ended June 28, 2013 includes $12.8 million of severance and related costs and $16.3 million of goodwill impairment charges and other asset write-offs. Food and Support Services—International operating income for the nine months ended June 29, 2012 includes a favorable adjustment of $1.5 million related to a non-income tax settlement in the U.K. and $2.1 million of severance related expenses.
Uniform and Career Apparel operating income for the nine months ended June 28, 2013 includes a net charge of approximately $3.5 million related to a multiemployer pension withdrawal and a preliminary settlement of wage and hour claims, net of a favorable risk insurance adjustment and severance related expenses of $3.7 million. Uniform and Career Apparel operating income for the nine months ended June 29, 2012 includes a favorable risk insurance adjustment of $5.7 million related to favorable claims experience and severance related expenses of $4.0 million.
Corporate expenses include share-based compensation expense (see Note 9). Corporate expenses for the nine months ended June 28, 2013 includes $0.9 million of severance and related costs.
Interest and Other Financing Costs, net, for the nine month period of fiscal 2013 was favorably impacted by the maturity of interest rate swaps during fiscal 2012. Interest and Other Financing Costs, net, for the nine months ended June 28, 2013 includes charges of $39.8 million in connection with the tender offer and Satisfaction and Discharge (see Note 6), consisting of $12.9 million of third party costs for the tender offer premium and $26.9 million of non-cash charges for the write-off of deferred financing costs. Interest and Other Financing Costs, net, for the nine month period of fiscal 2013 also includes approximately $11.6 million of third-party costs incurred related to Amendment Agreement No. 3 to the senior secured credit agreement (see Note 6) and approximately $3.2 million of hedge ineffectiveness related to the repayment of the Canadian subsidiary’s term loan with a maturity date of January 26, 2014 (see Note 7). Interest and Other Financing Costs, net, for the nine month periods of fiscal 2012 includes $10.5 million of third-party costs related to Amendment Agreement No. 2 (see Note 6) and the amendment of the Company’s Canadian subsidiary cross currency swap (see Note 7).
(13) NEW ACCOUNTING STANDARD UPDATES:
In December 2011, the FASB issued an accounting standard update (“ASU”) that requires companies with financial instruments and derivative instruments that are offset on the balance sheet or subject to a master netting arrangement to provide additional disclosures regarding the instruments impact on a company’s financial position. In January 2013, the FASB issued an accounting standard update to clarify the scope of this ASU. The guidance is effective for the Company beginning in the first quarter of fiscal 2014. The Company is currently evaluating the impact of this pronouncement.
F-69
Table of Contents
In September 2011, the FASB issued an accounting standard update that simplifies how entities test goodwill for impairment. The amendment permits an entity to first assess qualitative factors to determine whether it is more likely than not that the fair value of a reporting unit is less than its carrying amount as a basis for determining whether it is necessary to perform the two-step goodwill impairment test. The Company adopted the guidance beginning in fiscal 2013 which did not have a material impact on the condensed consolidated financial statements.
In June 2011, the FASB issued an accounting standard update that modifies the presentation of comprehensive income in the financial statements. The standard requires an entity to present the total of comprehensive income, the components of net income, and the components of other comprehensive income either in a single continuous statement of comprehensive income or in two separate but consecutive statements. This standard eliminates the current option to report other comprehensive income and its components in the statement of changes in equity. The Company adopted the guidance retrospectively beginning in the first quarter of fiscal 2013 which only resulted in changes to the presentation of the condensed consolidated financial statements.
In June 2012, the FASB issued an accounting standard update which amends the guidance on testing indefinite-lived intangible assets, other than goodwill, for impairment. The amendment permits an entity to perform a qualitative impairment assessment before proceeding to the two-step impairment test. The Company adopted the guidance beginning in fiscal 2013 which did not have a material impact on the condensed consolidated financial statements.
In February 2013, the FASB issued an accounting standard update which requires companies to disclose information about reclassifications out of accumulated other comprehensive income (“AOCI”). Companies also are required to present reclassifications by component when reporting changes in AOCI balances. For significant items reclassified out of AOCI to net income in their entirety in the period, companies must report the effect of the reclassifications on the respective line items in the statement where net income is presented. The guidance is effective for the Company beginning in the first quarter of fiscal 2014. The Company is currently evaluating the impact of this pronouncement.
(14) COMMITMENTS AND CONTINGENCIES:
Certain of the Company’s lease arrangements, primarily vehicle leases, with terms of one to eight years, contain provisions related to residual value guarantees. The maximum potential liability to the Company under such arrangements was approximately $110.9 million at June 28, 2013 if the terminal fair value of vehicles coming off lease was zero. Consistent with past experience, management does not expect any significant payments will be required pursuant to these arrangements. No amounts have been accrued for guarantee arrangements at June 28, 2013.
From time to time, the Company and its subsidiaries are party to various legal actions, proceedings and investigations involving claims incidental to the conduct of their business, including those brought by clients, consumers, employees, government entities and third parties under, among others, federal, state, international, national, provincial and local employment laws, wage and hour laws, discrimination laws, immigration laws, human health and safety laws, import and export controls and customs laws, environmental laws, false claims or whistleblower statutes, minority, women and disadvantaged business enterprise statutes, tax codes, antitrust and competition laws, consumer protection statutes, procurement regulations, intellectual property laws, food safety and sanitation laws, cost and accounting principles, the Foreign Corrupt Practices Act, the U.K. Bribery Act, other anti-corruption laws, lobbying laws, motor carrier safety laws, data privacy laws and alcohol licensing and service laws, or alleging negligence and/or breaches of contractual and other obligations. Based on information currently available, advice of counsel, available insurance coverage, established reserves and other resources, the Company does not believe that any such actions are likely to be, individually or in the aggregate, material to its
F-70
Table of Contents
business, financial condition, results of operations or cash flows. However, in the event of unexpected further developments, it is possible that the ultimate resolution of these matters, or other similar matters, if unfavorable, may be materially adverse to the Company’s business, financial condition, results of operations or cash flows.
In 2011, the Company was informed that an Illinois state civil action had been filed against a subsidiary of the Company by an unnamed Relator under the Illinois Whistleblower Reward and Protection Act in the Circuit Court of Cook County, Illinois County Department, Law Division. During the third quarter of fiscal 2013, this matter was settled, payments were made pursuant to the terms of the settlement, and the case was dismissed with prejudice.
(15) FAIR VALUE OF ASSETS AND LIABILITIES:
Fair value is defined as the price that would be received to sell an asset or paid to transfer a liability in an orderly transaction between market participants at the measurement date. Assets and liabilities recorded at fair value are classified based upon the level of judgment associated with the inputs used to measure their fair value. The hierarchical levels related to the subjectivity of the valuation inputs are defined as follows:
| • | Level 1—inputs to the valuation methodology are quoted prices (unadjusted) for identical assets or liabilities in active markets |
| • | Level 2—inputs to the valuation methodology include quoted prices for similar assets and liabilities in active markets, and inputs that are observable for the asset or liability, either directly or indirectly, for substantially the full term of the financial instrument |
| • | Level 3—inputs to the valuation methodology are unobservable and significant to the fair value measurement |
Recurring Fair Value Measurements
The Company’s financial instruments consist primarily of cash and cash equivalents, accounts receivable, accounts payable, borrowings and derivatives. Management believes that the carrying value of cash and cash equivalents, accounts receivable and accounts payable are representative of their respective fair values. In conjunction with the fair value measurement of the derivative instruments, the Company made an accounting policy election to measure the credit risk of its derivative instruments, that are subject to master netting agreements, on a net basis by counterparty portfolio. The fair value of the Company’s debt at June 28, 2013 and September 28, 2012 was $6,235.1 million and $6,052.9 million, respectively. The carrying value of the Company’s debt at June 28, 2013 and September 28, 2012 was $6,217.1 million and $6,008.8 million, respectively. The fair values were computed using market quotes, if available, or based on discounted cash flows using market interest rates as of the end of the respective periods. The inputs utilized in estimating the fair value of the Company’s debt has been classified as level 2 in the fair value hierarchy levels.
The following table presents the changes in the Company’s common stock subject to repurchase for which level 3 inputs were significant to their valuation for the nine months ended June 28, 2013 (in thousands):
| Common Stock Subject to Repurchase |
||||
| Balance, September 28, 2012 |
$ | 167,461 | ||
| Issuances of common stock |
1,904 | |||
| Repurchases of common stock |
(26,324 | ) | ||
| Change in fair market value of common stock |
10,517 | |||
|
|
|
|||
| Balance, June 28, 2013 |
$ | 153,558 | ||
|
|
|
|||
F-71
Table of Contents
(16) EARNINGS PER SHARE:
Basic earnings per share is computed using the weighted average number of common shares outstanding during the periods presented. Diluted earnings per share is computed using the weighted average number of common shares outstanding adjusted to include the potentially dilutive effect of share-based awards.
The following table sets forth the computation of basic and diluted earnings per share attributable to ARAMARK Holdings stockholders (in thousands, except per share data):
| Three Months Ended June 28, 2013 |
Three Months Ended June 29, 2012 |
Nine Months Ended June 28, 2013 |
Nine Months Ended June 29, 2012 |
|||||||||||||
| Earnings: |
||||||||||||||||
| Income from Continuing Operations attributable to ARAMARK Holdings stockholders |
$ | 27,748 | $ | 13,907 | $ | 30,458 | $ | 45,040 | ||||||||
| Income from Discontinued Operations |
— | — | — | 297 | ||||||||||||
|
|
|
|
|
|
|
|
|
|||||||||
| Net income attributable to ARAMARK Holdings stockholders |
$ | 27,748 | $ | 13,907 | $ | 30,458 | $ | 45,337 | ||||||||
|
|
|
|
|
|
|
|
|
|||||||||
| Shares: |
||||||||||||||||
| Basic weighted-averages shares outstanding |
201,364 | 203,109 | 201,607 | 203,191 | ||||||||||||
| Effect of dilutive securities |
6,962 | 6,581 | 7,096 | 6,512 | ||||||||||||
|
|
|
|
|
|
|
|
|
|||||||||
| Diluted weighted-averages shares outstanding |
208,326 | 209,690 | 208,703 | 209,703 | ||||||||||||
|
|
|
|
|
|
|
|
|
|||||||||
| Basic Earnings Per Share: |
||||||||||||||||
| Income from Continuing Operations |
$ | 0.14 | $ | 0.07 | $ | 0.15 | $ | 0.22 | ||||||||
| Income from Discontinued Operations |
— | — | — | 0.00 | ||||||||||||
|
|
|
|
|
|
|
|
|
|||||||||
| Net income attributable to ARAMARK Holdings stockholders |
$ | 0.14 | $ | 0.07 | $ | 0.15 | $ | 0.22 | ||||||||
|
|
|
|
|
|
|
|
|
|||||||||
| Diluted Earnings Per Share: |
||||||||||||||||
| Income from Continuing Operations |
$ | 0.13 | $ | 0.07 | $ | 0.15 | $ | 0.21 | ||||||||
| Income from Discontinued Operations |
— | — | — | 0.00 | ||||||||||||
|
|
|
|
|
|
|
|
|
|||||||||
| Net income attributable to ARAMARK Holdings stockholders |
$ | 0.13 | $ | 0.07 | $ | 0.15 | $ | 0.21 | ||||||||
|
|
|
|
|
|
|
|
|
|||||||||
Share-based awards to purchase 2.8 million and 4.5 million shares were outstanding at June 28, 2013 and June 29, 2012, respectively, but were not included in the computation of diluted earnings per common share as their effect would have been antidilutive. In addition, Performance-Based Options to purchase 8.1 million and 8.7 million shares were outstanding at June 28, 2013 and June 29, 2012, respectively, but were not included in the computation of diluted earnings per share, as the performance targets were not met.
F-72
Table of Contents
To the Board of Directors and Shareholders of
AIM SERVICES Co., Ltd.
Tokyo, Japan:
We have audited the accompanying consolidated financial statements of AIM SERVICES Co., Ltd. and its subsidiaries (the “Company”), which comprise the consolidated balance sheets as of March 31, 2013 and 2012, and the related consolidated statements of income, comprehensive income, changes in equity, and cash flows for each of the three years in the period ended March 31, 2013, and the related notes to the consolidated financial statements (all expressed in Japanese yen).
We conducted our audits in accordance with auditing standards generally accepted in the United States of America. Those standards require that we plan and perform the audit to obtain reasonable assurance about whether the financial statements are free of material misstatement. An audit includes consideration of internal control over financial reporting as a basis for designing audit procedures that are appropriate in the circumstances, but not for the purpose of expressing an opinion on the effectiveness of the Company’s internal control over financial reporting. Accordingly, we express no such opinion. An audit also includes examining, on a test basis, evidence supporting the amounts and disclosures in the financial statements, assessing the accounting principles used and significant estimates made by management, as well as evaluating the overall financial statement presentation. We believe that our audits provide a reasonable basis for our opinion.
Management’s Responsibility for the Consolidated Financial Statements
Management is responsible for the preparation and fair presentation of these consolidated financial statements in accordance with accounting principles generally accepted in the United States of America; this includes the design, implementation, and maintenance of internal control relevant to the preparation and fair presentation of consolidated financial statements that are free from material misstatement, whether due to fraud or error.
Auditors’ Responsibility
Our responsibility is to express an opinion on these consolidated financial statements based on our audits. We conducted our audits in accordance with auditing standards generally accepted in the United States of America. Those standards require that we plan and perform the audit to obtain reasonable assurance about whether the consolidated financial statements are free from material misstatement. An audit involves performing procedures to obtain audit evidence about the amounts and disclosures in the consolidated financial statements. The procedures selected depend on the auditor’s judgment, including the assessment of the risks of material misstatement of the consolidated financial statements, whether due to fraud or error. In making those risk assessments, the auditor considers internal control relevant to the Company’s preparation and fair presentation of the consolidated financial statements in order to design audit procedures that are appropriate in the circumstances, but not for the purpose of expressing an opinion on the effectiveness of the Company’s internal control. Accordingly, we express no such opinion. An audit also includes evaluating the appropriateness of accounting policies used and the reasonableness of significant accounting estimates made by management, as well as evaluating the overall presentation of the consolidated financial statements. We believe that the audit evidence we have obtained is sufficient and appropriate to provide a basis for our audit opinion.
Opinion
In our opinion, the consolidated financial statements referred to above present fairly, in all material respects, the financial position of AIM SERVICES Co., Ltd. and its subsidiaries as of March 31, 2013 and 2012, and the results of their operations and their cash flows for each of the three years in the period ended March 31, 2013 in accordance with accounting principles generally accepted in Japan (“Japanese GAAP”).
F-73
Table of Contents
Emphasis of Matter
Japanese GAAP varies in certain significant respects from accounting principles generally accepted in the United States of America. Information relating to the nature and effect of such differences is presented in Note 14 to the consolidated financial statements. Our opinion is not modified with respect to this matter.
Convenience Translations
Our audits also comprehended the translation of Japanese yen amounts into U.S. dollar amounts and, in our opinion, such translation has been made in conformity with the basis stated in Note 1. Such U.S. dollar amounts are presented solely for the convenience of readers outside Japan.
/s/ DELOITTE TOUCHE TOHMATSU LLC
Tokyo, Japan
September 9, 2013
F-74
Table of Contents
AIM SERVICES Co., Ltd. and Subsidiaries
March 31, 2013 and 2012
| Thousands of Yen | Thousands of U.S. Dollars (Note 1) |
|||||||||||
| 2013 | 2012 | 2013 | ||||||||||
| ASSETS |
||||||||||||
| CURRENT ASSETS: |
||||||||||||
| Cash and cash equivalents (Note 2.b) |
¥ | 7,709,209 | ¥ | 7,825,451 | $ | 82,013 | ||||||
| Marketable securities (Notes 2.d and 3) |
99,970 | |||||||||||
| Receivables: |
||||||||||||
| Trade notes |
2,241 | 817 | 24 | |||||||||
| Trade accounts |
14,292,354 | 14,620,648 | 152,046 | |||||||||
| Other |
167,262 | 128,022 | 1,780 | |||||||||
| Inventories (Notes 2.c and 4) |
1,762,801 | 1,691,468 | 18,753 | |||||||||
| Short-term loans |
3,117 | 4,299 | 33 | |||||||||
| Deposit (Notes 2.b and 12) |
3,500,000 | 6,000,000 | 37,234 | |||||||||
| Deferred tax assets (Notes 2.p and 7) |
1,814,557 | 1,768,432 | 19,304 | |||||||||
| Prepaid expenses and other |
352,779 | 313,812 | 3,753 | |||||||||
| Allowance for doubtful accounts |
(8,933 | ) | (12,273 | ) | (95 | ) | ||||||
|
|
|
|
|
|
|
|||||||
| Total current assets |
29,595,387 | 32,440,646 | 314,845 | |||||||||
|
|
|
|
|
|
|
|||||||
| PROPERTY, PLANT AND EQUIPMENT (Notes 2.f, 2.h, 2.m, 2.n, 8 and 9): |
||||||||||||
| Land |
292,423 | 298,843 | 3,111 | |||||||||
| Buildings and structures |
1,209,382 | 1,157,137 | 12,866 | |||||||||
| Machinery and equipment |
288,072 | 269,507 | 3,064 | |||||||||
| Furniture and fixtures |
1,731,085 | 1,547,960 | 18,416 | |||||||||
| Lease assets |
1,594,140 | 1,065,994 | 16,959 | |||||||||
|
|
|
|
|
|
|
|||||||
| Total |
5,115,102 | 4,339,441 | 54,416 | |||||||||
| Accumulated depreciation |
(2,834,722 | ) | (2,360,896 | ) | (30,157 | ) | ||||||
|
|
|
|
|
|
|
|||||||
| Net property, plant and equipment |
2,280,380 | 1,978,545 | 24,259 | |||||||||
|
|
|
|
|
|
|
|||||||
| INTANGIBLE FIXED ASSETS (Note 2.h): |
||||||||||||
| Software (Note 2.g) |
690,359 | 533,918 | 7,344 | |||||||||
| Goodwill (Note 2.a) |
1,252,233 | 1,570,171 | 13,321 | |||||||||
| Other assets |
51,830 | 49,564 | 552 | |||||||||
|
|
|
|
|
|
|
|||||||
| Total intangible fixed assets |
1,994,422 | 2,153,653 | 21,217 | |||||||||
|
|
|
|
|
|
|
|||||||
| INVESTMENTS AND OTHER ASSETS: |
||||||||||||
| Investment securities (Notes 2.d and 3) |
756,298 | 707,179 | 8,046 | |||||||||
| Investment in an associated company (Note 2.e) |
910,378 | 836,715 | 9,685 | |||||||||
| Golf membership (Note 2.i) |
190,155 | 203,910 | 2,023 | |||||||||
| Lease deposits (Note 2.k) |
908,267 | 920,251 | 9,662 | |||||||||
| Insurance deposits (Note 2.k) |
413,418 | 397,135 | 4,398 | |||||||||
| Deferred tax assets (Notes 2.p and 7) |
479,500 | 522,264 | 5,101 | |||||||||
| Other assets (Note 5) |
265,756 | 433,006 | 2,827 | |||||||||
| Allowance for doubtful accounts |
(71,445 | ) | (77,303 | ) | (760 | ) | ||||||
|
|
|
|
|
|
|
|||||||
| Total investments and other assets |
3,852,327 | 3,943,157 | 40,982 | |||||||||
|
|
|
|
|
|
|
|||||||
| TOTAL |
¥ | 37,722,516 | ¥ | 40,516,001 | $ | 401,303 | ||||||
|
|
|
|
|
|
|
|||||||
Continued on following page.
F-75
Table of Contents
AIM SERVICES Co., Ltd. and Subsidiaries
Consolidated Balance Sheets
March 31, 2013 and 2012
| Thousands of Yen | Thousands of U.S. Dollars (Note 1) |
|||||||||||
| 2013 | 2012 | 2013 | ||||||||||
| LIABILITIES AND EQUITY |
||||||||||||
| CURRENT LIABILITIES: |
||||||||||||
| Payables: |
||||||||||||
| Trade notes |
¥ | 220,560 | ¥ | 240,009 | $ | 2,346 | ||||||
| Trade accounts (Note 12) |
8,050,403 | 8,425,860 | 85,643 | |||||||||
| Other |
396,519 | 107,394 | 4,218 | |||||||||
| Income tax payable |
1,273,328 | 1,913,103 | 13,546 | |||||||||
| Consumption tax payable |
1,008,494 | 1,018,512 | 10,729 | |||||||||
| Accrued bonuses to employees |
3,587,549 | 3,458,791 | 38,165 | |||||||||
| Accrued bonuses to directors and corporate auditors |
29,250 | 29,250 | 311 | |||||||||
| Other accrued expenses |
6,819,843 | 6,751,363 | 72,552 | |||||||||
| Other current liabilities (Notes 2.m and 8) |
1,534,547 | 1,334,676 | 16,325 | |||||||||
|
|
|
|
|
|
|
|||||||
| Total current liabilities |
22,920,493 | 23,278,958 | 243,835 | |||||||||
|
|
|
|
|
|
|
|||||||
| LONG-TERM LIABILITIES: |
||||||||||||
| Employees’ retirement benefits (Notes 2.l and 5) |
1,109,515 | 1,218,329 | 11,803 | |||||||||
| Retirement benefits for directors and corporate auditors (Note 2.l) |
63,596 | 56,066 | 677 | |||||||||
| Long-term lease obligations (Notes 2.m and 8) |
747,683 | 573,545 | 7,954 | |||||||||
| Other long-term liabilities (Notes 2.n and 9) |
228,645 | 232,067 | 2,432 | |||||||||
|
|
|
|
|
|
|
|||||||
| Total long-term liabilities |
2,149,439 | 2,080,007 | 22,866 | |||||||||
|
|
|
|
|
|
|
|||||||
| EQUITY (Notes 6 and 13) |
||||||||||||
| Common stock—authorized, 7,000,000 shares; issued, 556 shares in 2013 and 2012; and class shares subject to call option—authorized, 14,000,000 shares; issued, 11,507,826 shares in 2013 and 2012 |
1,909,797 | 1,909,797 | 20,317 | |||||||||
| Class A shares—authorized, 7,000,000 shares; issued, no shares in 2013 and 2012 |
||||||||||||
| Additional paid-in capital |
2,591,398 | 2,591,398 | 27,568 | |||||||||
| Retained earnings (Note 2.q) |
8,766,148 | 11,339,464 | 93,257 | |||||||||
| Treasury stock—at cost: |
||||||||||||
| Common stock—2 shares in 2013 and 2012; and class shares subject to call option—11,507,826 shares in 2013 and 2012 |
(680,820 | ) | (680,820 | ) | (7,243 | ) | ||||||
| Accumulated other comprehensive income (Note 2.t) |
||||||||||||
| Unrealized gain(loss) on available-for-sale securities |
66,061 | (2,803 | ) | 703 | ||||||||
|
|
|
|
|
|
|
|||||||
| Total equity |
12,652,584 | 15,157,036 | 134,602 | |||||||||
|
|
|
|
|
|
|
|||||||
| TOTAL |
¥ | 37,722,516 | ¥ | 40,516,001 | $ | 401,303 | ||||||
|
|
|
|
|
|
|
|||||||
See notes to consolidated financial statements.
F-76
Table of Contents
AIM SERVICES Co., Ltd. and Subsidiaries
Consolidated Statements of Income
Years Ended March 31, 2013, 2012 and 2011
| Thousands of Yen | Thousands of U.S. Dollars (Note 1) |
|||||||||||||||
| 2013 | 2012 | 2011 | 2013 | |||||||||||||
| NET SALES (Note 2.s) |
¥ | 151,125,577 | ¥ | 147,608,039 | ¥ | 144,862,497 | $ | 1,607,719 | ||||||||
| COST OF SALES (Notes 8 and 12) |
133,416,552 | 130,143,576 | 126,605,907 | 1,419,325 | ||||||||||||
|
|
|
|
|
|
|
|
|
|||||||||
| Gross profit |
17,709,025 | 17,464,463 | 18,256,590 | 188,394 | ||||||||||||
| SELLING, GENERAL AND ADMINISTRATIVE |
||||||||||||||||
| EXPENSES (Notes 2.j, 8 and 12) |
12,252,188 | 11,640,463 | 12,013,783 | 130,342 | ||||||||||||
|
|
|
|
|
|
|
|
|
|||||||||
| Operating income |
5,456,837 | 5,824,000 | 6,242,807 | 58,052 | ||||||||||||
|
|
|
|
|
|
|
|
|
|||||||||
| OTHER INCOME (EXPENSES): |
||||||||||||||||
| Interest and dividend income |
21,252 | 22,957 | 13,649 | 226 | ||||||||||||
| Interest expense |
(24,168 | ) | (21,356 | ) | (16,500 | ) | (257 | ) | ||||||||
| Loss on impairment of long-lived assets (Note 2.h) |
(2,749 | ) | (14,614 | ) | (29 | ) | ||||||||||
| Gain on sales of shares of subsidiaries (Note 2.a) |
313,669 | |||||||||||||||
| Equity in earnings of associated company (Note 2.e) |
97,328 | 110,410 | 112,078 | 1,035 | ||||||||||||
| Other—net |
22,990 | 43,631 | (24,708 | ) | 245 | |||||||||||
|
|
|
|
|
|
|
|
|
|||||||||
| Other income—net |
114,653 | 141,028 | 398,188 | 1,220 | ||||||||||||
|
|
|
|
|
|
|
|
|
|||||||||
| INCOME BEFORE INCOME TAXES AND NONCONTROLLING INTERESTS |
5,571,490 | 5,965,028 | 6,640,995 | 59,272 | ||||||||||||
|
|
|
|
|
|
|
|
|
|||||||||
| INCOME TAXES (Notes 2.p and 7): |
||||||||||||||||
| Current |
2,714,671 | 2,927,892 | 3,163,705 | 28,880 | ||||||||||||
| Deferred |
(36,737 | ) | 110,495 | 12,316 | (391 | ) | ||||||||||
|
|
|
|
|
|
|
|
|
|||||||||
| Total income taxes |
2,677,934 | 3,038,387 | 3,176,021 | 28,489 | ||||||||||||
|
|
|
|
|
|
|
|
|
|||||||||
| NET INCOME |
2,893,556 | 2,926,641 | 3,464,974 | 30,783 | ||||||||||||
| NONCONTROLLING INTERESTS IN NET INCOME |
(8,666 | ) | ||||||||||||||
|
|
|
|
|
|
|
|
|
|||||||||
| NET INCOME ATTRIBUTABLE TO OWNERS OF PARENT COMPANY |
¥ | 2,893,556 | ¥ | 2,926,641 | ¥ | 3,456,308 | $ | 30,783 | ||||||||
|
|
|
|
|
|
|
|
|
|||||||||
| Yen | U.S. Dollars (Note 1) |
|||||||||||||||
| 2013 | 2012 | 2011 | 2013 | |||||||||||||
| PER SHARE OF COMMON STOCK (Note 2.r): |
||||||||||||||||
| Net income |
¥ | 5,223,024.82 | ¥ | 5,282,745.54 | ¥ | 6,238,824.08 | $ | 55,564.09 | ||||||||
| Cash dividends applicable to the year |
9,831,000 | 2,641,000 | 3,119,000 | 104,585 | ||||||||||||
See notes to consolidated financial statements.
F-77
Table of Contents
AIM SERVICES Co., Ltd. and Subsidiaries
Consolidated Statements of Comprehensive Income
Years Ended March 31, 2013, 2012 and 2011
| Thousands of Yen | Thousands of U.S. Dollars (Note 1) |
|||||||||||||||
| 2013 | 2012 | 2011 | 2013 | |||||||||||||
| NET INCOME |
¥ | 2,893,556 | ¥ | 2,926,641 | ¥ | 3,464,974 | $ | 30,783 | ||||||||
| OTHER COMPREHENSIVE INCOME: |
||||||||||||||||
| Unrealized gain (loss) on available-for-sale securities (net of tax) |
68,864 | 4,806 | (40,691 | ) | 733 | |||||||||||
|
|
|
|
|
|
|
|
|
|||||||||
| Total other comprehensive income (loss) |
68,864 | 4,806 | (40,691 | ) | 733 | |||||||||||
|
|
|
|
|
|
|
|
|
|||||||||
| COMPREHENSIVE INCOME (Note 2.t) |
¥ | 2,962,420 | ¥ | 2,931,447 | ¥ | 3,424,283 | $ | 31,516 | ||||||||
|
|
|
|
|
|
|
|
|
|||||||||
| TOTAL COMPREHENSIVE INCOME ATTRIBUTABLE TO: |
||||||||||||||||
| Owners of parent |
¥ | 2,962,420 | ¥ | 2,931,447 | ¥ | 3,415,617 | $ | 31,516 | ||||||||
| Noncontrolling interests |
8,666 | |||||||||||||||
See notes to consolidated financial statements.
F-78
Table of Contents
0AIM SERVICES Co., Ltd. and Subsidiaries
Consolidated Statements of Changes in Equity
Years Ended March 31, 2013, 2012 and 2011
| Thousands of yen | ||||||||||||||||||||||||||||||||
| Outstanding Number of Shares of Common Stock |
Common Stock |
Additional Paid-in Capital |
Retained Earnings |
Treasury Stock |
Unrealized Gain (Loss) on Available- for-Sale Securities |
Noncontrol- ling Interests |
Total Equity | |||||||||||||||||||||||||
| BALANCE, APRIL 1, 2010 |
554 | ¥ | 1,909,797 | ¥ | 2,591,398 | 8,379,127 | ¥ | (680,820 | ) | ¥ | 33,082 | ¥ | 52,511 | ¥ | 12,285,095 | |||||||||||||||||
| Net income |
3,456,308 | 3,456,308 | ||||||||||||||||||||||||||||||
| Cash dividends, ¥3,088,000 per share |
(1,710,752 | ) | (1,710,752 | ) | ||||||||||||||||||||||||||||
| Net change in the year |
(40,691 | ) | (52,511 | ) | (93,202 | ) | ||||||||||||||||||||||||||
|
|
|
|
|
|
|
|
|
|
|
|
|
|
|
|
|
|||||||||||||||||
| BALANCE, MARCH 31, 2011 |
554 | 1,909,797 | 2,591,398 | 10,124,683 | (680,820 | ) | (7,609 | ) | 13,937,449 | |||||||||||||||||||||||
| Net income |
2,926,641 | 2,926,641 | ||||||||||||||||||||||||||||||
| Cash dividends, ¥3,090,000 per share |
(1,711,860 | ) | (1,711,860 | ) | ||||||||||||||||||||||||||||
| Net change in the year |
4,806 | 4,806 | ||||||||||||||||||||||||||||||
|
|
|
|
|
|
|
|
|
|
|
|
|
|
|
|
|
|||||||||||||||||
| BALANCE, MARCH 31, 2012 |
554 | 1,909,797 | 2,591,398 | 11,339,464 | (680,820 | ) | (2,803 | ) | 15,157,036 | |||||||||||||||||||||||
| Net income |
2,893,556 | 2,893,556 | ||||||||||||||||||||||||||||||
| Cash dividends, ¥9,868,000 per share |
(5,466,872 | ) | (5,466,872 | ) | ||||||||||||||||||||||||||||
| Net change in the year |
68,864 | 68,864 | ||||||||||||||||||||||||||||||
|
|
|
|
|
|
|
|
|
|
|
|
|
|
|
|
|
|||||||||||||||||
| BALANCE, MARCH 31, 2013 |
554 | ¥ | 1,909,797 | ¥ | 2,591,398 | ¥ | 8,766,148 | ¥ | (680,820 | ) | ¥ | 66,061 | ¥ | 12,652,584 | ||||||||||||||||||
|
|
|
|
|
|
|
|
|
|
|
|
|
|
|
|
|
|||||||||||||||||
| Thousands of U.S. Dollars (Note 1) | ||||||||||||||||||||||||
| Common Stock |
Additional Paid-in Capital |
Retained Earnings |
Treasury Stock |
Unrealized Gain (Loss) on Available- for-Sale Securities |
Total Equity |
|||||||||||||||||||
| BALANCE, MARCH 31, 2012 |
$ | 20,317 | $ | 27,568 | $ | 120,633 | $ | (7,243 | ) | $ | (30 | ) | $ | 161,245 | ||||||||||
| Net income |
30,783 | 30,783 | ||||||||||||||||||||||
| Cash dividends, $104,979 per share |
(58,159 | ) | (58,159 | ) | ||||||||||||||||||||
| Net change in the year |
733 | 733 | ||||||||||||||||||||||
|
|
|
|
|
|
|
|
|
|
|
|
|
|||||||||||||
| BALANCE, MARCH 31, 2013 |
$ | 20,317 | $ | 27,568 | $ | 93,257 | $ | (7,243 | ) | $ | 703 | $ | 134,602 | |||||||||||
|
|
|
|
|
|
|
|
|
|
|
|
|
|||||||||||||
See notes to consolidated financial statements.
F-79
Table of Contents
AIM SERVICES Co., Ltd. and Subsidiaries
Consolidated Statements of Cash Flows
Years Ended March 31, 2013, 2012 and 2011
| Thousands of Yen | Thousands of U.S. Dollars (Note 1) |
|||||||||||||||
| 2013 | 2012 | 2011 | 2013 | |||||||||||||
| OPERATING ACTIVITIES: |
||||||||||||||||
| Income before income taxes and noncontrolling interests |
¥ | 5,571,490 | ¥ | 5,965,028 | ¥ | 6,640,995 | $ | 59,272 | ||||||||
|
|
|
|
|
|
|
|
|
|||||||||
| Adjustments for: |
||||||||||||||||
| Income taxes—paid |
(3,362,203 | ) | (2,039,547 | ) | (3,251,018 | ) | (35,768 | ) | ||||||||
| Depreciation and amortization |
816,840 | 738,495 | 758,497 | 8,690 | ||||||||||||
| Amortization of goodwill |
317,938 | 317,938 | 342,707 | 3,382 | ||||||||||||
| (Reversal of) provision for allowance for doubtful receivables |
(1,472 | ) | (17,219 | ) | 2,996 | (16 | ) | |||||||||
| Equity in earnings of an associated company |
(97,328 | ) | (110,410 | ) | (112,078 | ) | (1,035 | ) | ||||||||
| Loss (gain) on sales of property, plant and equipment |
5,280 | (1,194 | ) | (296 | ) | 56 | ||||||||||
| Loss on disposal of property, plant and equipment |
5,763 | 7,304 | 39,460 | 61 | ||||||||||||
| Gain on sales of shares of subsidiaries |
(313,669 | ) | ||||||||||||||
| Loss on impairment of long-lived assets |
2,749 | 14,614 | 29 | |||||||||||||
| Asset retirement cost |
86 | |||||||||||||||
| Write-off of investment securities |
9,696 | 77,343 | ||||||||||||||
| Decrease (increase) in receivables—trade accounts |
326,483 | (986,530 | ) | (306,755 | ) | 3,473 | ||||||||||
| Increase in inventories |
(71,333 | ) | (232,712 | ) | (39,287 | ) | (759 | ) | ||||||||
| Decrease (increase) in interest receivable |
302 | (594 | ) | (69 | ) | 3 | ||||||||||
| (Decrease) increase in trade payables |
(394,907 | ) | 861,880 | (31,788 | ) | (4,201 | ) | |||||||||
| (Decrease) increase in interest payable |
(244 | ) | 244 | |||||||||||||
| (Increase) decrease in other current assets |
(33,864 | ) | 423,385 | (35,216 | ) | (360 | ) | |||||||||
| Increase in other current liabilities |
458,095 | 1,088,654 | 137,721 | 4,874 | ||||||||||||
| Increase (decrease) in accrued bonuses to employees |
128,757 | (52,642 | ) | (250,230 | ) | 1,370 | ||||||||||
| Increase in accrued bonuses to directors and corporate auditors |
100 | |||||||||||||||
| (Decrease) increase in accrued employees’ retirement benefits |
(108,814 | ) | (105,136 | ) | 98,674 | (1,158 | ) | |||||||||
| Increase (decrease) in accrued retirement benefits for director and corporate auditors |
7,530 | (24,277 | ) | (6,394 | ) | 80 | ||||||||||
| Prepaid pension costs |
133,121 | 64,655 | (3,514 | ) | 1,416 | |||||||||||
| Other—net |
32,059 | 1,805 | (14,761 | ) | 341 | |||||||||||
|
|
|
|
|
|
|
|
|
|||||||||
| Total adjustments |
(1,835,004 | ) | (42,079 | ) | (2,907,247 | ) | (19,522 | ) | ||||||||
|
|
|
|
|
|
|
|
|
|||||||||
| Net cash provided by operating activities—(Forward) |
¥ | 3,736,486 | ¥ | 5,922,949 | ¥ | 3,733,748 | $ | 39,750 | ||||||||
|
|
|
|
|
|
|
|
|
|||||||||
Continued on following page.
F-80
Table of Contents
AIM SERVICES Co., Ltd. and Subsidiaries
Consolidated Statements of Cash Flows
Years Ended March 31, 2013, 2012 and 2011
| Thousands of Yen | Thousands of U.S. Dollars (Note 1) |
|||||||||||||||
| 2013 | 2012 | 2011 | 2013 | |||||||||||||
| Net cash provided by operating activities—(Forward) |
¥ | 3,736,486 | ¥ | 5,922,949 | ¥ | 3,733,748 | $ | 39,750 | ||||||||
|
|
|
|
|
|
|
|
|
|||||||||
| INVESTING ACTIVITIES: |
||||||||||||||||
| Purchases of marketable securities |
(99,970 | ) | (99,963 | ) | ||||||||||||
| Redemption of marketable securities |
100,000 | 100,000 | 100,000 | 1,064 | ||||||||||||
| Purchases of property, plant and equipment |
(355,616 | ) | (549,038 | ) | (296,820 | ) | (3,783 | ) | ||||||||
| Proceeds from sales of property, plant and equipment |
1,431 | 2,363 | 6,727 | 15 | ||||||||||||
| Purchases of software |
(327,493 | ) | (253,142 | ) | (196,091 | ) | (3,484 | ) | ||||||||
| Purchases of other intangible assets |
(3,022 | ) | (730 | ) | (386 | ) | (32 | ) | ||||||||
| Proceeds from sales of intangible assets |
51 | |||||||||||||||
| Purchases of investment securities |
(10,804 | ) | (15,880 | ) | (19,627 | ) | (115 | ) | ||||||||
| Proceeds from sales of investment securities |
57,861 | 26,845 | 616 | |||||||||||||
| Disbursements for purchases of shares of subsidiary |
(85,946 | ) | ||||||||||||||
| Proceeds from sales of shares of subsidiaries |
651,099 | |||||||||||||||
| Refund from (deposit to) a subsidiary of a shareholder |
2,497,890 | (6,004,069 | ) | (2,090 | ) | 26,573 | ||||||||||
| Proceeds from collections of loans |
3,486 | 3,972 | 8,387 | 37 | ||||||||||||
| Proceeds from (disbursements) for rental deposits of headquarter |
390,609 | (441,442 | ) | |||||||||||||
| Other |
(48,320 | ) | (106,035 | ) | (3,625 | ) | (514 | ) | ||||||||
|
|
|
|
|
|
|
|
|
|||||||||
| Net cash provided by (used in) investing activities |
1,915,413 | (6,505,075 | ) | (379,726 | ) | 20,377 | ||||||||||
|
|
|
|
|
|
|
|
|
|||||||||
| FINANCING ACTIVITIES: |
||||||||||||||||
| Increase in short-term bank loans |
13,500,000 | 12,800,000 | 6,600,000 | 143,617 | ||||||||||||
| Decrease in short-term bank loans |
(13,500,000 | ) | (14,800,000 | ) | (4,600,000 | ) | (143,617 | ) | ||||||||
| Repayments of capital lease obligation |
(301,269 | ) | (202,090 | ) | (98,818 | ) | (3,205 | ) | ||||||||
| Dividends paid |
(5,466,872 | ) | (1,711,860 | ) | (1,710,752 | ) | (58,158 | ) | ||||||||
|
|
|
|
|
|
|
|
|
|||||||||
| Net cash (used in) provided by financing activities |
(5,768,141 | ) | (3,913,950 | ) | 190,430 | (61,363 | ) | |||||||||
|
|
|
|
|
|
|
|
|
|||||||||
| NET (DECREASE) INCREASE IN CASH AND CASH EQUIVALENTS |
(116,242 | ) | (4,496,076 | ) | 3,544,452 | (1,236 | ) | |||||||||
| CASH AND CASH EQUIVALENTS, BEGINNING OF YEAR |
7,825,451 | 12,321,527 | 8,777,075 | 83,249 | ||||||||||||
|
|
|
|
|
|
|
|
|
|||||||||
| CASH AND CASH EQUIVALENTS, END OF YEAR |
¥ | 7,709,209 | ¥ | 7,825,451 | ¥ | 12,321,527 | $ | 82,013 | ||||||||
|
|
|
|
|
|
|
|
|
|||||||||
Continued on following page.
F-81
Table of Contents
AIM SERVICES Co., Ltd. and Subsidiaries
Consolidated Statements of Cash Flows
Years Ended March 31, 2013, 2012 and 2011
ADDITIONAL INFORMATION
Interest payments for the years ended March 31, 2013, 2012 and 2011 were as follows:
| Thousands of Yen | Thousands of U.S. Dollars (Note 1) |
|||||||||||||||
| 2013 | 2012 | 2011 | 2013 | |||||||||||||
| Interest payments |
¥ | 24,168 | ¥ | 21,600 | ¥ | 16,256 | $ | 257 | ||||||||
Non-cash investing and financing activities were as follows:
| Thousands of Yen | Thousands of U.S. Dollars (Note 1) |
|||||||||||||||
| 2013 | 2012 | 2011 | 2013 | |||||||||||||
| Sales of shares of subsidiaries: |
||||||||||||||||
| Current assets |
¥ | 605,625 | ||||||||||||||
| Fixed assets |
813,154 | |||||||||||||||
| Current liabilities |
(831,100 | ) | ||||||||||||||
| Long-term liabilities |
(41,348 | ) | ||||||||||||||
| Gain on sales of shares of subsidiaries |
313,669 | |||||||||||||||
|
|
|
|||||||||||||||
| Gross proceeds from sales of shares of subsidiaries |
860,000 | |||||||||||||||
| Cash and cash equivalents of the sold subsidiaries |
(208,901 | ) | ||||||||||||||
|
|
|
|||||||||||||||
| Net proceeds from sales of shares of subsidiaries |
¥ | 651,099 | ||||||||||||||
|
|
|
|||||||||||||||
| Acquisition of lease assets and obligations under finance leases |
¥ | 541,644 | ¥ | 371,433 | ¥ | 497,665 | $ | 5,762 | ||||||||
On March 31, 2011, the Company sold all shares of the common stock of its wholly owned subsidiary, Nissho Linen Supply Co., Ltd. (“Nissho”), to a third party (see Note 2.a for further information). The cash flows of Nissho from January 1, 2010 to March 31, 2011 were included in the consolidated statement of cash flows for the year ended March 31, 2011.
See notes to consolidated financial statements.
F-82
Table of Contents
AIM SERVICES Co., Ltd. and Subsidiaries
Notes to Consolidated Financial Statements
1. BASIS OF PRESENTING CONSOLIDATED FINANCIAL STATEMENTS
AIM SERVICES Co., Ltd. (the “Company”) mainly provides business dining services in Japan and is owned 50 percent by ARAMARK Corporation and 50 percent by Mitsui & Co., Ltd.
The accompanying consolidated financial statements have been prepared in accordance with the provisions set forth in the Companies Act of Japan (the “Companies Act”) and in conformity with accounting principles generally accepted in Japan (“Japanese GAAP”). Japanese GAAP varies in certain significant respects from accounting principles generally accepted in the United States of America (“U.S. GAAP”). Information relating to the nature and effect of such differences is presented in Note 14 to the consolidated financial statements.
In preparing these consolidated financial statements, certain reclassifications and rearrangements, including additions of the consolidated statements of cash flows and footnote disclosures, have been made to the consolidated financial statements issued domestically in order to present them in a form which is more familiar to readers outside Japan. In addition, certain reclassifications have been made in the 2012 and 2011 consolidated financial statements to conform to the classifications used in 2013.
The consolidated financial statements are stated in Japanese yen, the currency of the country in which the Company is incorporated and operates. The translation of Japanese yen amounts into U.S. dollar amounts is included solely for the convenience of readers outside Japan and has been made at the rate of ¥94 to $1, the approximate rate of exchange at March 31, 2013. Such translation should not be construed as a representation that the Japanese yen amounts could be converted into U.S. dollars at that or any other rate.
2. SUMMARY OF SIGNIFICANT ACCOUNTING POLICIES
| a. | Consolidation—The consolidated financial statements as of March 31, 2013 include the accounts of the Company and all 11 (11 in 2012 and 12 in 2011) subsidiaries (together, the “Group”). |
| An investment in an associated company (a company over which the Company has the ability to exercise significant influence) is accounted for by the equity method. Refer to Note 2.e. |
| The excess of the cost of an acquisition over the fair value of the net assets of the acquired subsidiaries at the date of acquisition is represented as “Goodwill” on the consolidated balance sheets and is being amortized on a straight-line basis over a period from 10 to 13 years. |
| Intercompany balances and transactions have been eliminated in consolidation. Unrealized profit included in assets resulting from transactions within the Group is eliminated. |
| The Company acquired the remaining 5.37% of ownership interest in Nissho on March 18, 2011 and sold all shares of the common stock of Nissho to Yamashita Co, a third party on March 31, 2011 to redeploy the Company’s capital to its core food servicing businesses. Nissho had been a subsidiary of the Company engaged in the linen supply businesses and had a December 31 fiscal year-end. As the Company sold its shares on March 31, 2011, Nissho’s income and loss, and cash flows from January 1, 2010 to March 31, 2011 were included in the Company’s consolidated financial statements. The gross proceeds from the sale were ¥860,000 thousand, and the gain from the sale was ¥313,669 thousand. Nissho’s net income after tax during the three months from January 1, 2011 to March 31, 2011 amounted to ¥12,453 thousand. |
| b. | Cash and Cash Equivalents—Cash equivalents are short-term investments that are readily convertible into cash and that are exposed to insignificant risk of changes in value. Cash equivalents include time deposits and benefit bonds of securities investment trusts, all of which mature or become due within three months of the date of acquisition. |
F-83
Table of Contents
| Deposit is a contract in which cash is trusted to the subsidiary of the Company’s shareholder. The cash can be readily withdrawn within a few days, however the Company does not have the intention to do so as the Company has sufficient working capital and do not need this deposit within a short period of time (i.e., three months). Based on this, the Company did not treat Deposit as Cash and Cash Equivalents. |
| c. | Inventories—Inventories are mainly stated at the latest purchase price which approximates the first-in, first-out cost method. In accordance with Accounting Standard Board of Japan (the “ASBJ”) Statement No. 9, “Accounting Standard for Measurement of Inventories,” inventories held for sale in the ordinary course of business are measured at the lower of cost or net selling value, which is defined as the selling price less additional estimated manufacturing costs and estimated direct selling expenses. The replacement cost may be used in place of the net selling value, if appropriate. |
| d. | Marketable and Investment Securities—Marketable and investment securities are classified and accounted for, depending on management’s intent, as follows: (1) held-to-maturity debt securities, which are expected to be held to maturity with the positive intent and ability to hold to maturity, are reported at amortized cost and (2) available-for-sale securities, which are not classified as the aforementioned securities, are reported at fair value with unrealized gains and losses, net of applicable taxes, reported in a separate component of equity. |
| Declines in fair value of held-to-maturity and available-for-sale securities are analyzed to determine if the decline is temporary or “other than temporary.” When other than temporary declines occur, the investment is reduced to its fair value and the amount of the reduction is reported as a loss. Any subsequent increases in other than temporary declines in fair value will not be realized until the securities are sold. |
| Non-marketable available-for-sale securities are stated at cost determined by the moving-average cost method. For other than temporary declines in fair value, non-marketable available-for-sale securities are reduced to net realizable value by a charge to income. |
| e. | Investment in Associated Company—The Company uses the equity method of accounting for its investment in and earnings or losses of an associated company that the Company does not control but over which the Company does exert significant influence. Significant influence is generally deemed to exist if the Company has an ownership interest in the voting stock of an investee of between 20% and 50%. The Company determines whether a decline in fair value is other than temporary by considering various factors, such as historical financial data, product development activities and the overall health of the affiliate’s industry. If the Company considers any such decline to be other than temporary, then a write-down to the estimated fair value is recorded. |
| f. | Property, Plant and Equipment—Property, plant and equipment are stated at cost. Depreciation of property, plant and equipment of the Group is computed substantially by the declining-balance method at rates based on the estimated useful lives of the assets, while the straight-line method is applied to the buildings which were acquired after April 1, 1998. The range of useful lives is principally from 3 to 47 years for buildings and structures, from 2 to 10 years for machinery and equipment, from 5 to 20 years for furniture and fixtures, and 5 years for lease assets. |
| Amendments to the Corporate Tax Law in Japan have resulted in changes to the depreciation methods used for property, plant and equipment acquired since April 1, 2007. Prior to these amendments, the Group’s depreciation methods were based on a depreciation limit of 95% and a residual value of 5% of the acquisition price of an asset. This depreciation limit and residual value were removed and the full acquisition price can now be depreciated to the nominal value of ¥1 at the end of the asset’s useful life, either on a straight-line basis or on a declining-balance basis. The depreciation rates for both methods, set forth by the Corporate Tax Law, were also amended. Assets acquired on or after April 1, 2007 are depreciated according to the new depreciation methods while existing assets acquired on or before March 31, 2007 are depreciated based on the traditional methods with the depreciation limit written off equally over 5 years. |
F-84
Table of Contents
| Effective April 1, 2012, as a result of the revision of Japanese corporate tax law in Japan, the Company and its consolidated subsidiaries changed their depreciation method for property, plant and equipment acquired on or after April 1, 2012 to the method stipulated under the revised corporate tax law. The effect of this change was immaterial. |
| g. | Software— Acquired computer software licenses are capitalised on the basis of the costs incurred to acquire and bring to use the specific software. Costs directly associated with identifiable and unique software products, which are likely to generate economic benefits exceeding costs beyond one year, are recognized as intangible assets. Software is carried at cost less accumulated amortization, which is calculated using the straight-line method over the estimated useful lives of 5 years. |
| h. | Impairment of Long-Lived Assets—The Group reviews its long-lived assets including goodwill for impairment whenever events or changes in circumstance indicate the carrying amount of an asset or asset group may not be recoverable. An impairment loss would be recognized if the carrying amount of an asset or asset group exceeds the sum of the undiscounted future cash flows expected to result from the continued use and eventual disposition of the asset or asset group. The impairment loss would be measured as the amount by which the carrying amount of the asset exceeds its recoverable amount, which is the higher of the discounted cash flows from the continued use and eventual disposition of the asset or the net selling price at disposition. |
| For the fiscal years ended March 31, 2013 and March 31, 2012, the Company wrote down the book value of its idle facilities amounting to ¥2,749 thousand ($29 thousand) and ¥14,614 thousand, respectively, as an impairment loss. |
| i. | Golf Membership—Golf membership is stated at cost. For other than temporary declines in fair value, golf membership is reduced to net realizable value by a charge to income. |
| j. | Operating Rights—Operating rights are mainly the right to operate the kiosk in factories which were acquired in December 2005 as part of a business acquisition. Operating rights are carried at cost less accumulated amortization, which is calculated by the straight-line method over 5 years, and were fully amortized during the year ended March 31, 2011. Amortization expenses for the years ended March 31, 2011 amounted to ¥18,947 thousand. |
| k. | Lease Deposits and Insurance Deposits—Lease deposits are mainly related to the Group’s office spaces and are refundable at the termination of each lease contract. |
| Insurance deposits consist of life insurance and non-life insurance policies for employees, for which the Company is the named beneficiary. Most of the insurance deposits are refundable. |
| l. | Retirement and Pension Plans—The Company and certain subsidiaries have defined benefit corporate pension plans covering substantially all of their regular employees. The Group accounts for the liability for retirement benefits based on projected benefit obligations and plan assets at the balance sheet date. |
| Retirement benefits to directors and corporate auditors are provided at the amount which would be required if all directors and corporate auditors retired at the balance sheet date. |
| m. | Leases—In March 2007, the ASBJ issued an Accounting Standard—ASBJ Statement No. 13, “Accounting Standard for Lease Transaction and its Implementation Guidance” and ASBJ Guidance No. 16, “Guidance on Accounting Standard for Lease Transactions.” The new standard and related implementation guidance eliminated a transitional rule where companies were allowed to account for finance leases that did not transfer ownership at the end of the lease term as operating leases and required the companies to recognize them as finance leases on their balance sheet. |
| In accordance with new accounting standard for lease, the Company capitalized all finance leases on its consolidated balance sheets and is depreciating the lease assets by the straight-line method over their respective lease terms. However, finance leases that do not transfer ownership and whose commencement day falls prior to April 1, 2008 continue to be accounted for as an operating lease with required disclosure in the notes in accordance with an exceptional rule in the new accounting standard. |
F-85
Table of Contents
| n. | Asset Retirement Obligations—In March 2008, the ASBJ issued Accounting Standard—ASBJ Statement No. 18, “Accounting Standard for Asset Retirement Obligations” and ASBJ Guidance No. 21, “Guidance on Accounting Standard for Asset Retirement Obligations.” The new standard and related implementation guidance require companies to recognize asset retirement obligations as liabilities and the corresponding asset retirement costs as tangible fixed assets. |
| The Group leases several corporate and regional offices and has installed leasehold improvements, such as partitions, counters and phone systems, in these leased properties. Most lease agreements in Japan require the lessee to restore the leased property to its original condition, including removal of the leasehold improvements the lessee has installed when the lessee moves out of the leased property. As a result, the Group will incur certain future costs for the restorations that are required under the lease agreements. |
| o. | Financial Instruments—In March 2008, the ASBJ revised Accounting Standard—ASBJ Statement No. 10, “Accounting Standard for Financial Instruments” and issued ASBJ Guidance No. 19, “Guidance on Disclosures about Fair Value of Financial Instruments.” This revised standard and related implementation guidance expanded the disclosure requirements relating to the fair value measurements of financial instruments. This standard and implementation guidance were effective for the fiscal years ending on or after March 31, 2010. The adoption of ASBJ Statement No. 10 and related guidance did not have an impact on its consolidated financial position and results of operations. |
| p. | Income Taxes—The Group adopted the accounting standard for interperiod allocation of income taxes based on the asset and liability method. Deferred income taxes are recorded to reflect the impact of temporary differences between assets and liabilities recognized for financial reporting purposes and such amounts recognized for tax purposes. These deferred taxes are measured by applying currently enacted tax laws to the temporary differences. The Group determined the recoverability of deferred tax assets based on all future information currently available. |
| Amendments to the Japanese tax regulations were enacted into law on November 30, 2011. As a result of these amendments, the statutory income tax rate will be reduced from approximately 40% to 38% effective from the year beginning April 1, 2012, and to approximately 35% effective from the year beginning April 1, 2015 and thereafter. Consequently, the statutory income tax rate utilized for deferred tax assets and liabilities expected to be settled or realized in the period from April 1, 2012 to March 31, 2015 is approximately 38% and for periods subsequent to March 31, 2015 the rate is approximately 35%. The adjustments to deferred tax assets and liabilities resulting from the reduction in the tax rate was an increase in income taxes of ¥176,903 thousand and have been reflected in income taxes in the consolidated statement of income for the year ended March 31, 2012. |
| q. | Appropriations of Retained Earnings—Appropriations of retained earnings at each year-end are reflected in the consolidated financial statements in the year following shareholders’ approval. |
| r. | Per Share Information—Basic net income per share is computed by dividing net income available to common shareholders by the weighted-average number of common shares outstanding for the period. Cash dividends per share presented in the accompanying consolidated statement of income are dividends applicable to the respective years including dividends to be paid after the end of the year. |
| s. | Revenue Recognition—Most of the operating businesses of the Group have contractual relationships with customers. In these businesses, revenue is recognized in the period in which the services are provided pursuant to the terms of the contracts. Revenue from dining, delivery food and beverage services is recognized upon delivery of food and beverage products. |
| t. | Presentation of Comprehensive Income—In June 2010, the ASBJ issued Accounting Standard—ASBJ Statement No. 25, “Accounting Standard for Presentation of Comprehensive Income.” This new standard requires the presentation of comprehensive income and other comprehensive income on financial statements. This standard was effective for the consolidated financial statements for the periods ending on or after March 31, 2011. The Company presented Accumulated other comprehensive |
F-86
Table of Contents
| income as of March 31, 2013 and 2012 in the balance sheets, comprehensive income for the years ended March 31, 2013, 2012 and 2011 in the statements of comprehensive income. |
| u. | Dividend distribution—Dividend distribution to the Company’s shareholders is recognized as a liability in the Group’s financial statements in the period in which the dividends are approved by the Company’s shareholders. |
| v. | Accounting Changes and Error Corrections—In December 2009, the ASBJ issued ASBJ Statement No. 24, “Accounting Standard for Accounting Changes and Error Corrections” and ASBJ Guidance No. 24, “Guidance on Accounting Standard for Accounting Changes and Error Corrections.” Accounting treatments under this standard and guidance are as follows: (1) Changes in Accounting Policies—When a new accounting policy is applied following revision of an accounting standard, the new policy is applied retrospectively unless the revised accounting standard includes specific transitional provisions, in which case the entity shall comply with the specific transitional provisions. (2) Changes in Presentation—When the presentation of financial statements is changed, prior-period financial statements are reclassified in accordance with the new presentation. (3) Changes in Accounting Estimates—A change in an accounting estimate is accounted for in the period of the change if the change affects that period only, and is accounted for prospectively if the change affects both the period of the change and future periods. (4) Corrections of Prior-Period Errors—When an error in prior-period financial statements is discovered, those statements are restated. |
3. MARKETABLE AND INVESTMENT SECURITIES
Marketable and investment securities at March 31, 2013 and 2012 consisted of the following:
| Thousands of Yen | Thousands of U.S. Dollars |
|||||||||||
| 2013 | 2012 | 2013 | ||||||||||
| Current—Marketable securities (debt securities) |
¥ | ¥ | 99,970 | $ | ||||||||
|
|
|
|
|
|
|
|||||||
| Total |
¥ | ¥ | 99,970 | $ | ||||||||
|
|
|
|
|
|
|
|||||||
| Non-current-Investment securities: |
||||||||||||
| Marketable equity securities |
¥ | 432,653 | ¥ | 385,114 | $ | 4,603 | ||||||
| Non-marketable equity securities |
323,645 | 322,065 | 3,443 | |||||||||
|
|
|
|
|
|
|
|||||||
| Total |
¥ | 756,298 | ¥ | 707,179 | $ | 8,046 | ||||||
|
|
|
|
|
|
|
|||||||
Information regarding marketable equity securities classified as available-for-sale and held-to-maturity debt securities at March 31, 2013 and 2012 was as follows:
| Thousands of Yen | ||||||||||||||||
| Cost | Unrealized Gains |
Unrealized Losses |
Fair Value |
|||||||||||||
| March 31, 2013 |
||||||||||||||||
| Available-for-sale marketable equity securities |
¥ | 249,142 | ¥ | 193,616 | ¥ | 10,105 | ¥ | 432,653 | ||||||||
|
|
|
|
|
|
|
|
|
|||||||||
| Total |
¥ | 249,142 | ¥ | 193,616 | ¥ | 10,105 | ¥ | 432,653 | ||||||||
|
|
|
|
|
|
|
|
|
|||||||||
| March 31, 2012 |
||||||||||||||||
| Available-for-sale marketable equity securities |
¥ | 296,911 | ¥ | 104,557 | ¥ | 16,354 | ¥ | 385,114 | ||||||||
| Held-to-maturity debt securities |
99,970 | 99,970 | ||||||||||||||
|
|
|
|
|
|
|
|
|
|||||||||
| Total |
¥ | 396,881 | ¥ | 104,557 | ¥ | 16,354 | ¥ | 485,084 | ||||||||
|
|
|
|
|
|
|
|
|
|||||||||
F-87
Table of Contents
| Thousands of U.S. Dollars | ||||||||||||||||
| Cost | Unrealized Gains |
Unrealized Losses |
Fair Value |
|||||||||||||
| March 31, 2013 |
||||||||||||||||
| Available-for-sale marketable equity securities |
$ | 2,650 | $ | 2,060 | $ | 107 | $ | 4,603 | ||||||||
|
|
|
|
|
|
|
|
|
|||||||||
| Total |
$ | 2,650 | $ | 2,060 | $ | 107 | $ | 4,603 | ||||||||
|
|
|
|
|
|
|
|
|
|||||||||
Carrying amounts of available-for-sale securities whose fair value is not readily determinable as of March 31, 2013 and 2012 were as follows:
| Thousands of Yen | Thousands of U.S. Dollars |
|||||||||||
| 2013 | 2012 | 2013 | ||||||||||
| Available-for-sale—Non-marketable equity securities |
¥ | 323,645 | ¥ | 322,065 | $ | 3,443 | ||||||
4. INVENTORIES
Inventories at March 31, 2013 and 2012 consisted of the following:
| Thousands of Yen | Thousands of U.S. Dollars |
|||||||||||
| 2013 | 2012 | 2013 | ||||||||||
| Merchandise |
¥ | 498,042 | ¥ | 490,857 | $ | 5,298 | ||||||
| Raw materials |
1,037,374 | 985,407 | 11,036 | |||||||||
| Supplies |
227,385 | 215,204 | 2,419 | |||||||||
|
|
|
|
|
|
|
|||||||
| Total |
¥ | 1,762,801 | ¥ | 1,691,468 | $ | 18,753 | ||||||
|
|
|
|
|
|
|
|||||||
5. LIABILITY FOR EMPLOYEES’ RETIREMENT BENEFITS
The Company and certain subsidiaries have defined benefit corporate pension plans for employees.
Under most circumstances, employees terminating their employment are entitled to retirement benefits determined based on the rate of pay at the time of termination, years of service and certain other factors. Such retirement benefits are made in the form of a lump-sum severance payment from the Company or from certain subsidiaries and annuity payments from a trustee. Employees are entitled to larger payments if the termination is involuntary, by retirement at the mandatory retirement age, or by death.
The liability for employees’ retirement benefits at March 31, 2013 and 2012 consisted of the following:
| Thousands of Yen | Thousands of U.S. Dollars |
|||||||||||
| 2013 | 2012 | 2013 | ||||||||||
| Projected benefit obligation |
¥ | 9,250,237 | ¥ | 9,044,586 | $ | 98,407 | ||||||
| Fair value of plan assets |
(7,198,328 | ) | (6,232,419 | ) | (76,578 | ) | ||||||
| Unrecognized actuarial loss |
(1,082,833 | ) | (1,867,398 | ) | (11,520 | ) | ||||||
|
|
|
|
|
|
|
|||||||
| Net amount on the consolidated balance sheets |
969,076 | 944,769 | 10,309 | |||||||||
| Prepaid pension costs (included in other assets) |
(140,439 | ) | (273,560 | ) | (1,494 | ) | ||||||
|
|
|
|
|
|
|
|||||||
| Employees’ retirement benefits |
¥ | 1,109,515 | ¥ | 1,218,329 | $ | 11,803 | ||||||
|
|
|
|
|
|
|
|||||||
F-88
Table of Contents
The components of net periodic benefit costs are as follows:
| Thousands of Yen | Thousands of U.S. Dollars |
|||||||||||||||
| 2013 | 2012 | 2011 | 2013 | |||||||||||||
| Service cost |
¥ | 590,253 | ¥ | 544,854 | ¥ | 541,931 | $ | 6,279 | ||||||||
| Interest cost |
90,884 | 153,935 | 147,971 | 967 | ||||||||||||
| Expected return on plan assets |
(124,615 | ) | (114,443 | ) | (118,221 | ) | (1,326 | ) | ||||||||
| One-time amortization of prior service credit |
(37,370 | ) | ||||||||||||||
| Recognized actuarial loss |
264,415 | 166,003 | 113,761 | 2,813 | ||||||||||||
|
|
|
|
|
|
|
|
|
|||||||||
| Net periodic benefit costs |
¥ | 820,937 | ¥ | 750,349 | ¥ | 648,072 | $ | 8,733 | ||||||||
|
|
|
|
|
|
|
|
|
|||||||||
Assumptions used for the years ended March 31, 2013, 2012 and 2011 are set forth as follows:
| 2013 | 2012 | 2011 | ||||
| Discount rate |
From 0.7% to 1.1% | From 0.7% to 1.1% | 2.0% | |||
| Expected rate of return on plan assets |
2.0% | 2.0% | 2.0% | |||
| Amortization period of prior service credit relating to the plan amendment |
One-time amortization when incurred | |||||
| Recognition period of actuarial gain/loss |
From 5 to 12 years | From 5 to 12 years | From 5 to 12 years |
6. EQUITY
The significant provisions in the Companies Act that affect financial and accounting matters are summarized below:
a. Dividends
Under the Companies Act, companies can pay dividends at any time during the fiscal year in addition to the year-end dividend upon resolution at the shareholders meeting. If companies meet certain criteria such as (1) having a Board of Directors, (2) having independent auditors, and (3) the term of service of the directors is prescribed as one year rather than two years of normal term by its articles of incorporation, the Board of Directors may declare dividends (except for dividends in-kind) at any time during the fiscal year if the company has prescribed so in its articles of incorporation. The Company meets the above criteria.
The Companies Act permits companies to distribute dividends-in-kind (non-cash assets) to shareholders subject to a certain limitation and additional requirements.
Semiannual interim dividends may also be paid once a year upon resolution by the Board of Directors if the articles of incorporation of the company so stipulate. The Companies Act provides certain limitations on the amounts available for dividends or the purchase of treasury stock. The limitation is defined as the amount available for distribution to the shareholders, but the amount of net assets after dividends must be maintained at no less than ¥3,000 thousand.
b. Increases/Decreases and Transfer of Common Stock, Reserve and Surplus
The Companies Act requires that an amount equal to 10% of dividends must be appropriated as a legal reserve (a component of retained earnings) or as additional paid-in capital (a component of capital surplus) depending on the equity account charged upon the payment of such dividends until the total of the aggregate amount of legal reserve and additional paid-in capital equals 25% of the common stock. Under the Companies Act, the total amount of additional paid-in capital and legal reserve may be reversed without limitation. The Companies Act also provides that common stock, legal reserve, additional paid-in capital, other capital surplus
F-89
Table of Contents
and retained earnings can be transferred among the accounts under certain conditions upon resolution of the shareholders.
c. Treasury Stock and Treasury Stock Acquisition Rights
The Companies Act also allows for companies to purchase treasury stock and dispose of such treasury stock by resolution of the Board of Directors. The amount of treasury stock purchased cannot exceed the amount available for distribution to the shareholders which is determined by specific formula. Under the Companies Act, stock acquisition rights, which were previously presented as a liability, are now presented as a separate component of equity. The Companies Act also provides that companies can purchase both treasury stock acquisition rights and treasury stock. Such treasury stock acquisition rights are presented as a separate component of equity or deducted directly from stock acquisition rights.
Class shares subject to call option included a call option which allowed the Company, at its option, to exchange all of the class shares subject to call option for new common shares at an exchange ratio of 20,000 class shares to 1 new common share. On November 1, 2007, the Company exercised its call options and exchanged all of its issued class shares for new shares of common stock. Class A shares are the shares without the right for the distribution of residual property.
F-90
Table of Contents
7. INCOME TAXES
The tax effects of temporary differences which resulted in deferred tax assets at March 31, 2013 and 2012 are as follows:
| Thousands of Yen | Thousands of U.S. Dollars |
|||||||||||
| 2013 | 2012 | 2013 | ||||||||||
| Current: |
||||||||||||
| Deferred tax assets: |
||||||||||||
| Accrued bonuses to employees |
¥ | 1,363,008 | ¥ | 1,318,875 | $ | 14,500 | ||||||
| Accrued enterprise taxes |
114,388 | 111,822 | 1,217 | |||||||||
| Accrued social insurance contributions by employer |
214,909 | 205,592 | 2,286 | |||||||||
| Accrued business office taxes |
16,343 | 17,265 | 174 | |||||||||
| Accrued rent |
54,203 | 76,532 | 577 | |||||||||
| Other |
51,706 | 38,346 | 550 | |||||||||
|
|
|
|
|
|
|
|||||||
| Total |
1,814,557 | 1,768,432 | 19,304 | |||||||||
|
|
|
|
|
|
|
|||||||
| Net deferred tax assets |
¥ | 1,814,557 | ¥ | 1,768,432 | $ | 19,304 | ||||||
|
|
|
|
|
|
|
|||||||
| Non-current: |
||||||||||||
| Deferred tax assets: |
||||||||||||
| Employees’ retirement benefits |
¥ | 392,198 | ¥ | 391,557 | $ | 4,172 | ||||||
| Retirement benefits for directors and corporate auditors |
22,429 | 19,789 | 239 | |||||||||
| Impairment loss on investment securities |
43,841 | 43,843 | 466 | |||||||||
| Impairment loss on golf membership |
11,110 | 11,113 | 118 | |||||||||
| Impairment loss on long-lived assets |
61,495 | 66,281 | 654 | |||||||||
| Allowance for doubtful accounts |
24,120 | 27,339 | 257 | |||||||||
| Asset retirement obligations |
24,085 | 19,492 | 256 | |||||||||
| Other |
33,251 | 49,947 | 354 | |||||||||
| Less valuation allowance |
(68,655 | ) | (76,099 | ) | (730 | ) | ||||||
|
|
|
|
|
|
|
|||||||
| Total |
543,874 | 553,262 | 5,786 | |||||||||
|
|
|
|
|
|
|
|||||||
| Deferred tax liabilities—net unrealized gain on available-for-sale securities |
64,374 | 30,998 | 685 | |||||||||
|
|
|
|
|
|
|
|||||||
| Total |
64,374 | 30,998 | 685 | |||||||||
|
|
|
|
|
|
|
|||||||
| Net deferred tax assets |
¥ | 479,500 | ¥ | 522,264 | $ | 5,101 | ||||||
|
|
|
|
|
|
|
|||||||
F-91
Table of Contents
A reconciliation between the normal effective statutory tax rate and the actual effective tax rate reflected in the accompanying consolidated statements of income for the years ended March 31, 2013, 2012 and 2011 is as follows:
| 2013 | 2012 | 2011 | ||||||||||
| Normal effective statutory tax rate |
38 | % | 40 | % | 40 | % | ||||||
| Expenses not deductible for income tax purposes |
1 | 1 | 1 | |||||||||
| Non-deductible per capita levy of local taxes |
6 | 5 | 5 | |||||||||
| Non-deductible amortization of goodwill |
2 | 2 | 2 | |||||||||
| Effect of amendments to the Japanese tax regulations |
3 | |||||||||||
| Other—net |
1 | |||||||||||
|
|
|
|
|
|
|
|||||||
| Actual effective tax rate |
48 | % | 51 | % | 48 | % | ||||||
|
|
|
|
|
|
|
|||||||
As discussed in Note 2.p, the tax rate applied to the Company will be reduced approximately from 40% to 38% effective from the year beginning April 1, 2012, and to approximately 35% effective from the year beginning April 1, 2015 and thereafter. The effect of adjustments to deferred assets and liabilities resulting from the reduction in the tax rate was an increase in income taxes of ¥176,903 thousand and have been reflected in income taxes in the consolidate statement of income for the year ended March 31, 2012.
8. LEASES
The Group leases certain machinery, dining support service related equipment, office space and other assets.
Rent expenses for operating leases for the years ended March 31, 2013, 2012 and 2011 amounted to ¥1,295,970 thousand ($13,787 thousand), ¥1,207,902 thousand and ¥1,466,046 thousand, respectively.
Lease payments under finance leases for the years ended March 31, 2013, 2012 and 2011 were ¥30,952 thousand ($329 thousand), ¥132,016 thousand and ¥250,035 thousand, respectively.
Obligations under finance leases and future minimum payments under noncancelable operating leases were as follows:
| Thousands of Yen | Thousands of U.S. Dollars |
|||||||||||||||
| 2013 | 2013 | |||||||||||||||
| Finance Leases |
Operating Leases |
Finance Leases |
Operating Leases |
|||||||||||||
| Due within one year |
¥ | 320,960 | ¥ | 106,320 | $ | 3,414 | $ | 1,131 | ||||||||
| Due after one year |
747,683 | 174,243 | 7,954 | 1,854 | ||||||||||||
|
|
|
|
|
|
|
|
|
|||||||||
| Total |
¥ | 1,068,643 | ¥ | 280,563 | $ | 11,368 | $ | 2,985 | ||||||||
|
|
|
|
|
|
|
|
|
|||||||||
As discussed in Note 2.m, the Company accounts for leases which existed at the transition date of the new accounting standards on April 1, 2008 and do not transfer ownership of the leased property to the lessee as operating lease transactions.
For the year ended March 31, 2013, such leases no longer existed due to expiration or cancellation.
F-92
Table of Contents
Pro forma information of such leased property existing at the transition date on an “as if capitalized” basis for the year ended March 31, 2012 was as follows:
| Thousands of Yen | ||||||||||||
| 2012 | ||||||||||||
| Machinery and Equipment |
Furniture and Fixtures |
Software | ||||||||||
| Acquisition cost |
¥ | 3,945 | ¥ | 332,194 | ¥ | 336,139 | ||||||
| Accumulated depreciation |
(3,737 | ) | (300,178 | ) | (303,915 | ) | ||||||
|
|
|
|
|
|
|
|||||||
| Net leased asset |
¥ | 208 | ¥ | 32,016 | ¥ | 32,224 | ||||||
|
|
|
|
|
|
|
|||||||
Depreciation expense and interest expense as if capitalized:
| Thousands of Yen | Thousands of U.S. Dollars |
|||||||||||||||
| 2013 | 2012 | 2011 | 2013 | |||||||||||||
| Depreciation expense |
¥ | 28,981 | ¥ | 124,449 | ¥ | 235,812 | $ | 308 | ||||||||
| Interest expense |
360 | 2,299 | 6,856 | 4 | ||||||||||||
|
|
|
|
|
|
|
|
|
|||||||||
| Total |
¥ | 29,341 | ¥ | 126,748 | ¥ | 242,668 | $ | 312 | ||||||||
|
|
|
|
|
|
|
|
|
|||||||||
Depreciation expense and interest expense, which are not reflected in the accompanying consolidated statements of income, are computed by the straight-line method and the interest method, respectively.
9. ASSET RETIREMENT OBLIGATIONS
The Company recognizes asset retirement obligations for its headquarters and some regional offices on the basis of lease agreements. To estimate asset retirement obligations, the Company uses the estimated useful lives for periods ranging from 5 to 29 years and discount rates ranging from 0.326% to 2.130%.
For the year ended March 31, 2013, the Company added ¥9,577 thousand ($102 thousand) to the balance of asset retirement cost because it has become clear that retirement cost for some assets will be more than the estimation previously calculated.
The following represent the changes in asset retirement obligations for the years ended March 31, 2013 and 2012:
| Thousands of Yen | Thousands of U.S. Dollars |
|||||||||||
| 2013 | 2012 | 2013 | ||||||||||
| Asset retirement obligations at beginning of year |
¥ | 131,213 | ¥ | 199,444 | $ | 1,396 | ||||||
| Additions to asset retirement obligations |
3,904 | 6,430 | 42 | |||||||||
| Accretion of discount |
2,368 | 2,340 | 25 | |||||||||
| Liabilities settled during the year |
(1,239 | ) | (77,001 | ) | (13 | ) | ||||||
| Revision to estimate |
9,577 | 102 | ||||||||||
|
|
|
|
|
|
|
|||||||
| Asset retirement obligations at end of year |
¥ | 145,823 | ¥ | 131,213 | $ | 1,552 | ||||||
|
|
|
|
|
|
|
|||||||
F-93
Table of Contents
10. FINANCIAL INSTRUMENTS
(1) Financial Instruments
The Company obtains operating funds through loans from financial institutions such as banks, and excess funds are invested only in short-term deposit with banks and deposited with subsidiaries of shareholders. Interest rates for the loans are determined based on discussion with the financial institutions considering the current short-term money market.
Credit risks for notes receivable and accounts receivable are managed based on internal risk management policy.
The Company’s investment securities mainly consist of equity securities. For listed shares, the Company reviews their fair value on a quarterly basis.
(2) Fair Value of Financial Instruments
The carrying amounts of financial instruments recorded in the Company’s consolidated balance sheets and their estimated fair values as of March 31, 2013 and 2012 are as follows:
| Thousands of Yen | Thousands of U.S. Dollars |
|||||||||||||||||||||||
| 2013 | 2012 | 2013 | ||||||||||||||||||||||
| Carrying Amount (*) |
Fair Value (*) |
Carrying Amount (*) |
Fair Value (*) |
Carrying Amount (*) |
Fair Value (*) |
|||||||||||||||||||
| Cash and cash equivalents |
¥ | 7,709,209 | ¥ | 7,709,209 | ¥ | 7,825,451 | ¥ | 7,825,451 | $ | 82,013 | $ | 82,013 | ||||||||||||
| Notes receivable and accounts receivable |
14,294,595 | 14,294,595 | 14,621,465 | 14,621,465 | 152,070 | 152,070 | ||||||||||||||||||
| Marketable securities— |
||||||||||||||||||||||||
| Held-to-maturity debt securities |
99,970 | 99,970 | ||||||||||||||||||||||
| Deposit |
3,500,000 | 3,500,000 | 6,000,000 | 6,000,000 | 37,234 | 37,234 | ||||||||||||||||||
| Investment securities— |
||||||||||||||||||||||||
| Available-for-sale marketable equity securities |
432,653 | 432,653 | 385,114 | 385,114 | 4,603 | 4,603 | ||||||||||||||||||
| Notes payable and accounts payable |
(8,270,963 | ) | (8,270,963 | ) | (8,665,869 | ) | (8,665,869 | ) | (87,989 | ) | (87,989 | ) | ||||||||||||
| (*) | ( ) indicates liability account. |
In accordance with the requirement of ASBJ Statement No. 10, “Accounting Standard for Financial Instruments,” the Company has provided the above fair value estimates and the following information about valuation methodologies.
Cash and cash equivalents
Due to nature of cash and cash equivalents, the fair value approximates the carrying value.
Notes receivable and accounts receivable
As these are settled in a short-term period, the fair value approximates the carrying value.
Marketable securities
Due to the nature and remaining terms of held-to-maturity debt securities, the fair value approximates the amortized cost.
F-94
Table of Contents
Deposit
As these are settled in a short-term period, the fair value approximates the carrying value.
Investment securities
Equity securities are valued using quoted market prices.
Notes payable and accounts payable
As these are settled in a short-term period, the fair value approximates the carrying value.
Because unlisted shares do not have market price and future cash flows are not estimable, it was determined that obtaining fair value information for non-marketable equity securities was not practicable. Thus, unlisted shares, whose carrying amount as of March 31, 2013 and 2012 were ¥1,234,022 thousand ($13,128 thousand) and ¥1,158,780 thousand, respectively, are not included in “Investment securities—Available-for-sale marketable equity securities” in the list above.
11. SEGMENT INFORMATION
Information about industry segments of the Group for the years ended March 31, 2013, 2012 and 2011 is set forth below. In March 2011, the Company disposed of its Linen Supply Services.
Industry Segments
a. Sales and Operating Income
| Thousands of Yen | ||||||||||||||||||||||||
| 2013 | ||||||||||||||||||||||||
| Food Business | Office Coffee and Tea Services |
Other Services | Total | Eliminations/ Corporate |
Consolidated | |||||||||||||||||||
| Sales to customers |
¥ | 144,335,546 | ¥ | 6,503,205 | ¥ | 286,826 | ¥ | 151,125,577 | ¥ | 151,125,577 | ||||||||||||||
| Intersegment sales |
2,032,169 | 1,356,948 | 272,106 | 3,661,223 | ¥ | (3,661,223 | ) | |||||||||||||||||
|
|
|
|
|
|
|
|
|
|
|
|
|
|||||||||||||
| Total sales |
146,367,715 | 7,860,153 | 558,932 | 154,786,800 | (3,661,223 | ) | 151,125,577 | |||||||||||||||||
| Operating expenses |
138,497,390 | 7,736,571 | 621,821 | 146,855,782 | (1,187,042 | ) | 145,668,740 | |||||||||||||||||
|
|
|
|
|
|
|
|
|
|
|
|
|
|||||||||||||
| Operating income (loss) |
¥ | 7,870,325 | ¥ | 123,582 | ¥ | (62,889 | ) | ¥ | 7,931,018 | ¥ | (2,474,181 | ) | ¥ | 5,456,837 | ||||||||||
|
|
|
|
|
|
|
|
|
|
|
|
|
|||||||||||||
b. Total Assets, Depreciation, Capital Expenditures and Information about Goodwill
| Thousands of Yen | ||||||||||||||||||||||||
| 2013 | ||||||||||||||||||||||||
| Food Business | Office Coffee and Tea Services |
Other Services | Total | Eliminations/ Corporate |
Consolidated | |||||||||||||||||||
| Total assets |
¥ | 28,308,623 | ¥ | 2,930,439 | ¥ | 38,242 | ¥ | 31,277,304 | ¥ | 6,445,212 | ¥ | 37,722,516 | ||||||||||||
| Depreciation and other |
412,729 | 207,923 | 448 | 621,100 | 195,740 | 816,840 | ||||||||||||||||||
| Capital expenditures |
657,684 | 285,038 | 942,722 | 345,938 | 1,288,660 | |||||||||||||||||||
| Goodwill: |
||||||||||||||||||||||||
| Unamortized balance |
656,522 | 595,711 | 1,252,233 | 1,252,233 | ||||||||||||||||||||
| Amortization |
119,368 | 198,570 | 317,938 | 317,938 | ||||||||||||||||||||
F-95
Table of Contents
a. Sales and Operating Income
| Thousands of U.S. Dollars | ||||||||||||||||||||||||
| 2013 | ||||||||||||||||||||||||
| Food Business | Office Coffee and Tea Services |
Other Services | Total | Eliminations/ Corporate |
Consolidated | |||||||||||||||||||
| Sales to customers |
$ | 1,535,485 | $ | 69,183 | $ | 3,051 | $ | 1,607,719 | $ | 1,607,719 | ||||||||||||||
| Intersegment sales |
21,618 | 14,436 | 2,895 | 38,949 | $ | (38,949 | ) | |||||||||||||||||
|
|
|
|
|
|
|
|
|
|
|
|
|
|||||||||||||
| Total sales |
1,557,103 | 83,619 | 5,946 | 1,646,668 | (38,949 | ) | 1,607,719 | |||||||||||||||||
| Operating expenses |
1,473,376 | 82,304 | 6,615 | 1,562,295 | (12,628 | ) | 1,549,667 | |||||||||||||||||
|
|
|
|
|
|
|
|
|
|
|
|
|
|||||||||||||
| Operating income (loss) |
$ | 83,727 | $ | 1,315 | $ | (669 | ) | $ | 84,373 | $ | (26,321 | ) | $ | 58,052 | ||||||||||
|
|
|
|
|
|
|
|
|
|
|
|
|
|||||||||||||
b. Total Assets, Depreciation, Capital Expenditures and Information about Goodwill
| Thousands of U.S. Dollars | ||||||||||||||||||||||||
| 2013 | ||||||||||||||||||||||||
| Food Business | Office Coffee and Tea Services |
Other Services |
Total | Eliminations/ Corporate |
Consolidated | |||||||||||||||||||
| Total assets |
$ | 301,156 | $ | 31,175 | $ | 407 | $ | 332,738 | $ | 68,565 | $ | 401,303 | ||||||||||||
| Depreciation and other |
4,391 | 2,212 | 5 | 6,608 | 2,082 | 8,690 | ||||||||||||||||||
| Capital expenditures |
6,997 | 3,032 | 10,029 | 3,680 | 13,709 | |||||||||||||||||||
| Goodwill: |
||||||||||||||||||||||||
| Unamortized balance |
6,984 | 6,337 | 13,321 | 13,321 | ||||||||||||||||||||
| Amortization |
1,270 | 2,112 | 3,382 | 3,382 | ||||||||||||||||||||
a. Sales and Operating Income
| Thousands of Yen | ||||||||||||||||||||||||
| 2012 | ||||||||||||||||||||||||
| Food Business | Office Coffee and Tea Services |
Other Services | Total | Eliminations/ Corporate |
Consolidated | |||||||||||||||||||
| Sales to customers |
¥ | 140,895,794 | ¥ | 6,529,919 | ¥ | 182,326 | ¥ | 147,608,039 | ¥ | 147,608,039 | ||||||||||||||
| Intersegment sales |
2,027,093 | 1,331,024 | 267,648 | 3,625,765 | ¥ | (3,625,765 | ) | |||||||||||||||||
|
|
|
|
|
|
|
|
|
|
|
|
|
|||||||||||||
| Total sales |
142,922,887 | 7,860,943 | 449,974 | 151,233,804 | (3,625,765 | ) | 147,608,039 | |||||||||||||||||
| Operating expenses |
134,730,976 | 7,885,922 | 511,873 | 143,128,771 | (1,344,732 | ) | 141,784,039 | |||||||||||||||||
|
|
|
|
|
|
|
|
|
|
|
|
|
|||||||||||||
| Operating income (loss) |
¥ | 8,191,911 | ¥ | (24,979 | ) | ¥ | (61,899 | ) | ¥ | 8,105,033 | ¥ | (2,281,033 | ) | ¥ | 5,824,000 | |||||||||
|
|
|
|
|
|
|
|
|
|
|
|
|
|||||||||||||
b. Total Assets, Depreciation, Impairment Loss, Capital Expenditures and Information about Goodwill
| Thousands of Yen | ||||||||||||||||||||||||
| 2012 | ||||||||||||||||||||||||
| Food Business | Office Coffee and Tea Services |
Other Services | Total | Eliminations/ Corporate |
Consolidated | |||||||||||||||||||
| Total assets |
¥ | 28,135,318 | ¥ | 3,111,591 | ¥ | 41,890 | ¥ | 31,288,799 | ¥ | 9,227,202 | ¥ | 40,516,001 | ||||||||||||
| Depreciation and other |
391,714 | 157,196 | 505 | 549,415 | 189,080 | 738,495 | ||||||||||||||||||
| Capital expenditures |
407,875 | 290,053 | 872 | 698,800 | 258,009 | 956,809 | ||||||||||||||||||
| Goodwill: |
||||||||||||||||||||||||
| Unamortized balance |
775,889 | 794,282 | 1,570,171 | 1,570,171 | ||||||||||||||||||||
| Amortization |
119,368 | 198,570 | 317,938 | 317,938 | ||||||||||||||||||||
F-96
Table of Contents
a. Sales and Operating Income
| Thousands of Yen | ||||||||||||||||||||||||||||
| 2011 | ||||||||||||||||||||||||||||
| Food Business | Office Coffee and Tea Services |
Linen Supply |
Other Services |
Total | Eliminations/ Corporate |
Consolidated | ||||||||||||||||||||||
| Sales to customers |
¥ | 136,036,998 | ¥ | 6,747,427 | ¥ | 1,827,560 | ¥ | 250,512 | ¥ | 144,862,497 | ¥ | 144,862,497 | ||||||||||||||||
| Intersegment sales |
2,043,682 | 1,286,006 | 701,305 | 272,856 | 4,303,849 | ¥ | (4,303,849 | ) | ||||||||||||||||||||
|
|
|
|
|
|
|
|
|
|
|
|
|
|
|
|||||||||||||||
| Total sales |
138,080,680 | 8,033,433 | 2,528,865 | 523,368 | 149,166,346 | (4,303,849 | ) | 144,862,497 | ||||||||||||||||||||
| Operating expenses |
129,709,807 | 7,950,403 | 2,278,133 | 604,631 | 140,542,974 | (1,923,284 | ) | 138,619,690 | ||||||||||||||||||||
|
|
|
|
|
|
|
|
|
|
|
|
|
|
|
|||||||||||||||
| Operating income (loss) |
¥ | 8,370,873 | ¥ | 83,030 | ¥ | 250,732 | ¥ | (81,263 | ) | ¥ | 8,623,372 | ¥ | (2,380,565 | ) | ¥ | 6,242,807 | ||||||||||||
|
|
|
|
|
|
|
|
|
|
|
|
|
|
|
|||||||||||||||
Intersegment sales and operating expenses of Food Business for the year ended March 31, 2011 have been corrected due to an immaterial error from ¥1,166,926 thousand to ¥2,043,682 thousand and from ¥128,833,051 thousand to ¥129,709,807 thousand, respectively. In addition, intersegment sales and operating expenses of Eliminations/Corporate for the year ended March 31, 2011 have been corrected from ¥(3,427,093) thousand to ¥(4,303,849) thousand and from ¥(1,046,528) thousand to ¥(1,923,284) thousand, respectively.
b. Total Assets, Depreciation, Capital Expenditures and Information about Goodwill
| Thousands of Yen | ||||||||||||||||||||||||||||
| 2011 | ||||||||||||||||||||||||||||
| Food Business | Office Coffee and Tea Services |
Linen Supply |
Other Services |
Total | Eliminations/ Corporate |
Consolidated | ||||||||||||||||||||||
| Total assets |
¥ | 27,149,121 | ¥ | 3,146,105 | ¥ | 40,485 | ¥ | 30,335,711 | ¥ | 8,111,664 | ¥ | 38,447,375 | ||||||||||||||||
| Depreciation and other |
329,801 | 115,262 | ¥ | 68,755 | 214 | 514,032 | 244,465 | 758,497 | ||||||||||||||||||||
| Capital expenditures |
622,455 | 298,000 | 3,524 | 526 | 924,505 | 516,488 | 1,440,993 | |||||||||||||||||||||
| Goodwill: |
||||||||||||||||||||||||||||
| Unamortized balance |
895,257 | 992,852 | 1,888,109 | 1,888,109 | ||||||||||||||||||||||||
| Amortization |
119,368 | 198,570 | 24,769 | 342,707 | 342,707 | |||||||||||||||||||||||
Presentation for the year ended March 31, 2011 was corrected to add information about goodwill in accordance with ASBJ Statement No. 17, “Accounting Standard for Disclosures about Segments of an Enterprise and Related Information” and ASBJ Guidance No. 20, “Guidance on Accounting Standard for Disclosures about Segments of an Enterprise and Related Information.”
The Company has no branch offices or subsidiaries in foreign countries, therefore geographic segment information has not been disclosed. Also, sales to foreign customers have not been presented because neither the Company nor its subsidiaries recorded foreign sales for the years ended March 31, 2013, 2012 and 2011.
F-97
Table of Contents
12. RELATED PARTY TRANSACTIONS
Transactions between the Company and subsidiaries of shareholders and other related parties for the years ended March 31, 2013, 2012 and 2011 were as follows:
| Thousands of Yen | Thousands of U.S. Dollars |
|||||||||||||||
| 2013 | 2012 | 2011 | 2013 | |||||||||||||
| Tax accountant fee to corporate auditors |
¥ | 2,357 | ¥ | 2,014 | ¥ | 2,014 | $ | 25 | ||||||||
| Purchase transactions with subsidiaries of shareholders during the year |
11,366,274 | 10,688,971 | 9,995,806 | 120,918 | ||||||||||||
| Deposit made to subsidiaries of shareholders during the year (*) |
5,679,641 | 4,892,076 | 1,460,273 | 60,422 | ||||||||||||
| Note: | (*) Deposit made to subsidiaries of shareholders generally has terms of less than one month. The amounts in the table represent the average balances of the deposits during the year. |
The balances due to or from these subsidiaries of shareholders at March 31, 2013 and 2012 were as follows:
| Thousands of Yen | Thousands of U.S. Dollars |
|||||||||||
| 2013 | 2012 | 2013 | ||||||||||
| Deposits to subsidiaries of shareholders |
3,500,000 | 6,000,000 | 37,234 | |||||||||
| Accounts payable to subsidiaries of shareholders |
2,004,693 | 1,940,478 | 21,327 | |||||||||
13. SUBSEQUENT EVENT
On June 21, 2013, the shareholders of the Company approved payments of cash dividends to the shareholders of record on March 31, 2013 of ¥1,044 thousand ($11 thousand) per share or a total of ¥578,376 thousand ($6,153 thousand) at the Company’s ordinary general meeting of shareholders.
14. RECONCILIATION TO U.S. GAAP
The consolidated financial statements of the Group are prepared in accordance with Japanese GAAP, which varies in certain significant respects from U.S. GAAP. The following are reconciliations of equity and net income of the Company applying U.S. GAAP instead of Japanese GAAP.
The Group’s equity as of March 31, 2013 and 2012 is reconciled as follows:
| Thousands of Yen | Thousands of U.S. Dollars |
|||||||||||
| 2013 | 2012 | 2013 | ||||||||||
| Equity in accordance with Japanese GAAP |
¥ | 12,652,584 | ¥ | 15,157,036 | $ | 134,602 | ||||||
|
|
|
|
|
|
|
|||||||
| Differences arising from different accounting for: |
||||||||||||
| a. Goodwill, intangible assets and other business combination related adjustments |
6,998,290 | 7,288,273 | 74,450 | |||||||||
| b. Accrued vacation |
(2,399,827 | ) | (2,311,800 | ) | (25,530 | ) | ||||||
| c. Employees’ retirement benefits |
(1,408,285 | ) | (2,223,798 | ) | (14,982 | ) | ||||||
| d. Capital leases |
(12,745 | ) | (16,452 | ) | (136 | ) | ||||||
| e. Tax effect of adjustments |
(50,481 | ) | 60,040 | (537 | ) | |||||||
|
|
|
|
|
|
|
|||||||
| Total |
3,126,952 | 2,796,263 | 33,265 | |||||||||
|
|
|
|
|
|
|
|||||||
| Equity in accordance with U.S. GAAP |
¥ | 15,779,536 | ¥ | 17,953,299 | $ | 167,867 | ||||||
|
|
|
|
|
|
|
|||||||
F-98
Table of Contents
The Group’s net income for the years ended March 31, 2013, 2012 and 2011 is reconciled as follows:
| Thousands of Yen | Thousands of U.S. Dollars |
|||||||||||||||
| 2013 | 2012 | 2011 | 2013 | |||||||||||||
| Net income in accordance with Japanese GAAP |
¥ | 2,893,556 | ¥ | 2,926,641 | ¥ | 3,456,308 | $ | 30,783 | ||||||||
|
|
|
|
|
|
|
|
|
|||||||||
| Differences arising from different accounting for: |
||||||||||||||||
| a. Goodwill, intangible assets and other business combination related adjustments |
(289,983 | ) | (95,983 | ) | (88,190 | ) | (3,086 | ) | ||||||||
| b. Accrued vacation |
(88,027 | ) | (45,588 | ) | (13,270 | ) | (936 | ) | ||||||||
| c. Employees’ retirement benefits |
99,262 | 36,265 | (19,564 | ) | 1,056 | |||||||||||
| d. Capital leases |
3,707 | (2,944 | ) | 7,716 | 39 | |||||||||||
| e. Tax effect of adjustments |
143,326 | 226,435 | 173,776 | 1,525 | ||||||||||||
|
|
|
|
|
|
|
|
|
|||||||||
| Total |
(131,715 | ) | 118,185 | 60,468 | (1,402 | ) | ||||||||||
|
|
|
|
|
|
|
|
|
|||||||||
| Net income in accordance with U.S. GAAP |
¥ | 2,761,841 | ¥ | 3,044,826 | ¥ | 3,516,776 | $ | 29,381 | ||||||||
|
|
|
|
|
|
|
|
|
|||||||||
ASC 220, “Comprehensive Income,” establishes rules for the reporting of comprehensive income and its components. The following table summarizes the components of comprehensive income under U.S. GAAP for the years ended March 31, 2013, 2012 and 2011:
| Thousands of Yen | Thousands of U.S. Dollars | |||||||||||||||||||||||
| 2013 | 2013 | |||||||||||||||||||||||
| Gain (loss) before income tax expense |
Income tax (expense) benefit |
Gain (loss) after income tax expense |
Gain (loss) before income tax expense |
Income tax (expense) benefit |
Gain (loss) after income tax expense |
|||||||||||||||||||
| Net income |
¥ | 2,761,841 | $ | 29,381 | ||||||||||||||||||||
| Other comprehensive income: |
||||||||||||||||||||||||
| Unrealized gain (loss) on available-for-sale securities |
¥ | 102,240 | ¥ | (33,376 | ) | 68,864 | $ | 1,087 | $ | (354 | ) | 733 | ||||||||||||
|
|
|
|
|
|
|
|
|
|
|
|
|
|||||||||||||
| Total |
102,240 | (33,376 | ) | 68,864 | 1,087 | (354 | ) | 733 | ||||||||||||||||
|
|
|
|
|
|
|
|
|
|
|
|
|
|||||||||||||
| Gain (loss) associated with employees’ retirement benefits |
644,294 | (228,389 | ) | 415,905 | 6,854 | (2,429 | ) | 4,425 | ||||||||||||||||
| Reclassification adjustments for loss included in net income |
71,957 | (25,458 | ) | 46,499 | 766 | (272 | ) | 494 | ||||||||||||||||
|
|
|
|
|
|
|
|
|
|
|
|
|
|||||||||||||
| Total |
716,251 | (253,847 | ) | 462,404 | 7,620 | (2,701 | ) | 4,919 | ||||||||||||||||
|
|
|
|
|
|
|
|
|
|
|
|
|
|||||||||||||
| Other comprehensive income |
818,491 | (287,223 | ) | 531,268 | 8,707 | (3,055 | ) | 5,652 | ||||||||||||||||
|
|
|
|
|
|
|
|
|
|
|
|
|
|||||||||||||
| Comprehensive income |
¥ | 3,293,109 | $ | 35,033 | ||||||||||||||||||||
|
|
|
|
|
|||||||||||||||||||||
F-99
Table of Contents
| Thousands of Yen | ||||||||||||
| 2012 | ||||||||||||
| |
Gain (loss) before income tax expense |
|
|
Income tax (expense) benefit |
|
|
Gain (loss) after income tax expense |
| ||||
| Net income |
¥ | 3,044,826 | ||||||||||
| Other comprehensive income: |
||||||||||||
| Unrealized gain (loss) on available-for-sale securities |
¥ | (10,237 | ) | ¥ | 8,781 | (1,456 | ) | |||||
| Reclassification adjustments for loss included in net income |
9,696 | (3,434 | ) | 6,262 | ||||||||
|
|
|
|
|
|
|
|||||||
| Total |
(541 | ) | 5,347 | 4,806 | ||||||||
|
|
|
|
|
|
|
|||||||
| Gain (loss) associated with employees’ retirement benefits |
(423,086 | ) | 167,941 | (255,145 | ) | |||||||
| Reclassification adjustments for loss included in net income |
49,835 | (17,073 | ) | 32,762 | ||||||||
|
|
|
|
|
|
|
|||||||
| Total |
(373,251 | ) | 150,868 | (222,383 | ) | |||||||
|
|
|
|
|
|
|
|||||||
| Other comprehensive income |
(373,792 | ) | 156,215 | (217,577 | ) | |||||||
|
|
|
|
|
|
|
|||||||
| Comprehensive income |
¥ | 2,827,249 | ||||||||||
|
|
|
|||||||||||
| Thousands of Yen | ||||||||||||
| 2011 | ||||||||||||
| |
Gain (loss) before income tax expense |
|
|
Income tax (expense) benefit |
|
|
Gain (loss) after income tax expense |
| ||||
| Net income |
¥ | 3,516,776 | ||||||||||
| Other comprehensive income: |
||||||||||||
| Unrealized gain (loss) on available-for-sale securities |
¥ | (69,214 | ) | ¥ | 28,523 | (40,691 | ) | |||||
|
|
|
|
|
|
|
|||||||
| Total |
(69,214 | ) | 28,523 | (40,691 | ) | |||||||
|
|
|
|
|
|
|
|||||||
| Gain (loss) associated with employees’ retirement benefits |
(443,337 | ) | 178,824 | (264,513 | ) | |||||||
| Reclassification adjustments for loss included in net income |
16,844 | (6,290 | ) | 10,554 | ||||||||
|
|
|
|
|
|
|
|||||||
| Total |
(426,493 | ) | 172,534 | (253,959 | ) | |||||||
|
|
|
|
|
|
|
|||||||
| Other comprehensive income |
(495,707 | ) | 201,057 | (294,650 | ) | |||||||
|
|
|
|
|
|
|
|||||||
| Comprehensive income |
¥ | 3,222,126 | ||||||||||
|
|
|
|||||||||||
The analysis of changes in equity under U.S. GAAP is as follows:
| Thousands of Yen | Thousands of U.S. Dollars |
|||||||||||||||
| 2013 | 2012 | 2011 | 2013 | |||||||||||||
| Equity at beginning of year |
¥ | 17,953,299 | ¥ | 16,837,910 | ¥ | 15,379,047 | $ | 190,993 | ||||||||
| Total comprehensive income (net of tax) |
3,293,109 | 2,827,249 | 3,222,126 | 35,033 | ||||||||||||
| Cash dividends |
(5,466,872 | ) | (1,711,860 | ) | (1,710,752 | ) | (58,159 | ) | ||||||||
| Noncontrolling interests |
(52,511 | ) | ||||||||||||||
|
|
|
|
|
|
|
|
|
|||||||||
| Equity at end of year |
¥ | 15,779,536 | ¥ | 17,953,299 | ¥ | 16,837,910 | $ | 167,867 | ||||||||
|
|
|
|
|
|
|
|
|
|||||||||
F-100
Table of Contents
The following is a summary of the significant adjustments made to equity and net income to reconcile the Japanese GAAP results with U.S. GAAP. The paragraphs below refer to the corresponding items set forth above.
| a. | Business Combinations |
Under Japanese GAAP, the Business Accounting Council issued a Statement of Opinion, “Accounting for Business Combinations” in October 2003 which was effective for fiscal years beginning on or after April 1, 2006. Before this statement, there was no specific accounting standard addressing accounting for business combinations; therefore, companies followed common business practices dictated by the Commercial Code of Japan (the “Code”), currently code of the Companies Act.
Under the purchase method generally applied by Japanese companies, goodwill is measured as the excess of purchase price over the carrying values of the individual assets acquired and liabilities assumed at the acquisition date. Subsequently, the goodwill is amortized on a straight-line basis over a number of years that may vary, depending on the nature of the acquired business.
Under U.S. GAAP, all business combinations (excluding combinations of entities under common control) are accounted for using the acquisition method as defined in ASC 805, “Business Combinations.” ASC 805 requires that the net assets, tangible and identifiable intangible assets less liabilities of the acquired company be recorded at fair value, with the excess of the cost of an acquired company over the fair value of the acquired net assets recorded as goodwill. Also, after the adoption of ASC 350, “Intangibles—Goodwill and Other,” goodwill and recognized indefinite-lived intangible assets in a business combination are not amortized, but are tested for impairment at least annually, as well as on an interim basis if events or changes in circumstances indicate that the goodwill or indefinite-lived intangible assets might be impaired. Separate intangible assets that are not deemed to have an indefinite life are amortized over their expected economic life and also tested for impairment.
In 2000, the Company purchased 100% of the outstanding common stock of KK Kizembo (“Kizembo”). In December 2005, the Company purchased 100% of the common stock of Yamato Corporation (“Yamato”). In July 2002, the Company purchased 100% of the common stock of Atlas Co. (“Atlas”) which owned 52.8% of the common stock of Mefos Co. (“Mefos”); subsequently, Atlas acquired the remaining 47.2% of common stock of Mefos in a series of step acquisitions that concluded in December 2005.
In March 2006, the Company and Atlas merged, with the Company as the surviving entity. As a result of the merger, the Company directly held 100% of the common stock of Mefos. Under Japanese GAAP, and in line with the Code, the Company consolidated the net carrying amount of the assets and liabilities of Mefos and wrote off the unamortized amount of goodwill related to the previous acquisition of Atlas and its subsidiary, Mefos.
Under U.S. GAAP, the March 2006 merger between the Company and Atlas was accounted for as a transfer of net assets or equity interests between entities under common control. Such transfer is accounted for by the receiving entity (the Company) at the carrying amounts, including goodwill in the accounts of the transferring entity (Atlas) at the date of the transfer. Consequently, the one-time accelerated goodwill amortization charge is reversed for U.S. GAAP reporting purposes.
On November 1, 2007, the Company completed its merger with Yamato.
On April 1, 2008, the Company completed its merger with its wholly owned subsidiaries, Kizembo and AIM Dining Support Co., Ltd. All assets and liabilities of these entities were transferred to the Company at the appropriate carrying amount and there is no impact on the Company’s consolidated financial statements or the reconciliation to U.S. GAAP.
F-101
Table of Contents
Goodwill:
The following table presents the carrying amount of goodwill under Japanese GAAP and U.S. GAAP as of March 31, 2013 and 2012:
| Thousands of Yen | Thousands of U.S. Dollars | |||||||||||||||||||||||||||||||||||||||
| 2013 | 2013 | |||||||||||||||||||||||||||||||||||||||
| Japanese GAAP | U.S. GAAP | Japanese GAAP | U.S. GAAP | |||||||||||||||||||||||||||||||||||||
| Acquired |
Carrying Amount |
Accumulated Amortization |
Net Carrying Amount |
Carrying Amount, Net of Impairment |
Goodwill Related Reconciliation Item |
Carrying Amount |
Accumulated Amortization |
Net Carrying Amount |
Carrying Amount, Net of Impairment |
Goodwill Related Reconciliation Item |
||||||||||||||||||||||||||||||
| Kizembo |
¥ | 482,935 | ¥ | (482,935) | ¥ | 332,018 | ¥ | 332,018 | $ | 5,138 | $ | (5,138 | ) | $ | 3,532 | $ | 3,532 | |||||||||||||||||||||||
| Mefos |
6,175,740 | (5,519,219 | ) | ¥ | 656,521 | 1,875,532 | 1,219,011 | 65,699 | (58,715 | ) | $ | 6,984 | 19,952 | 12,968 | ||||||||||||||||||||||||||
| Yamato |
2,982,465 | (2,386,753 | ) | 595,712 | 1,918,419 | 1,322,707 | 31,728 | (25,391 | ) | 6,337 | 20,408 | 14,071 | ||||||||||||||||||||||||||||
|
|
|
|
|
|
|
|
|
|
|
|
|
|
|
|
|
|
|
|
|
|||||||||||||||||||||
| Total |
¥ | 9,641,140 | ¥ | (8,388,907) | ¥ | 1,252,233 | ¥ | 4,125,969 | ¥ | 2,873,736 | $ | 102,565 | $ | (89,244 | ) | $ | 13,321 | $ | 43,892 | $ | 30,571 | |||||||||||||||||||
|
|
|
|
|
|
|
|
|
|
|
|
|
|
|
|
|
|
|
|
|
|||||||||||||||||||||
| Thousands of Yen | ||||||||||||||||||||
| 2012 | ||||||||||||||||||||
| Japanese GAAP | U.S. GAAP | |||||||||||||||||||
| Acquired Company |
Carrying Amount |
Accumulated Amortization |
Net Carrying Amount |
Carrying Amount, Net of Impairment |
Goodwill Related Reconciliation Item |
|||||||||||||||
| Kizembo |
¥ | 482,935 | ¥ | (482,935 | ) | ¥ | 332,018 | ¥ | 332,018 | |||||||||||
| Mefos |
6,175,740 | (5,399,851 | ) | ¥ | 775,889 | 1,875,532 | 1,099,643 | |||||||||||||
| Yamato |
2,982,465 | (2,188,183 | ) | 794,282 | 2,112,419 | 1,318,137 | ||||||||||||||
|
|
|
|
|
|
|
|
|
|
|
|||||||||||
| Total |
¥ | 9,641,140 | ¥ | (8,070,969 | ) | ¥ | 1,570,171 | ¥ | 4,319,969 | ¥ | 2,749,798 | |||||||||
|
|
|
|
|
|
|
|
|
|
|
|||||||||||
For U.S. GAAP reporting purposes, the Company recognized goodwill impairment loss of ¥194,000 thousand ($2,063 thousand) for the year ended March 31, 2013 in connection with goodwill of Yamato, which represents the office coffee and tea services (the “OCS”) business reporting unit. Goodwill was impaired primarily due to reduced profitability of the OCS business reporting unit resulting from macro and micro economic factors surrounding the OCS business reporting unit.
The amount of the impairment was determined based on the estimated fair value of the OCS business reporting unit using a discounted cash flow model as compared to the carrying amount of the OCS business reporting unit, including goodwill.
For the years ended March 31, 2013, 2012 and 2011, the net income reconciliation item related to goodwill represents the reversal of the goodwill amortization charge amounting to ¥317,938 thousand ($3,382 thousand), ¥317,938 thousand and ¥317,938 thousand, respectively, recorded under Japanese GAAP and the recognition of goodwill impairment loss under U.S. GAAP as referred above.
Under Japanese GAAP, the estimated aggregate amortization expense for goodwill for the next five years is as follows:
| Year Ending March 31 |
Thousands of Yen | Thousands of U.S. Dollars |
||||||
| 2014 |
¥ | 317,938 | $ | 3,382 | ||||
| 2015 |
317,938 | 3,382 | ||||||
| 2016 |
317,938 | 3,382 | ||||||
| 2017 |
119,368 | 1,270 | ||||||
| 2018 |
119,368 | 1,270 | ||||||
F-102
Table of Contents
Adjustment to intangible assets:
Under Japanese GAAP, the Company did not recognize identifiable intangible assets, other than goodwill, as part of purchase price allocation in a business combination.
In connection with the above-mentioned acquisitions, under U.S. GAAP, the Company recognized identifiable intangible assets and is amortizing those over the expected economic life of each intangible asset. The table below presents the gross carrying amount, accumulated amortization and net carrying amount, in total and by major class of intangible assets acquired in the above-mentioned business combinations as of March 31, 2013 and 2012:
| Thousands of Yen | Thousands of U.S. Dollars | |||||||||||||||||||||||||||||||||||
| 2013 | 2012 | 2013 | ||||||||||||||||||||||||||||||||||
| Gross Carrying Amount |
Accumulated Amortization |
Net Carrying Amount |
Gross Carrying Amount |
Accumulated Amortization |
Net Carrying Amount |
Gross Carrying Amount |
Accumulated Amortization |
Net Carrying Amount |
||||||||||||||||||||||||||||
| Customer contracts |
¥ | 7,366,836 | ¥ | (3,579,582) | ¥ | 3,787,254 | ¥ | 7,366,836 | ¥ | (3,165,661) | ¥ | 4,201,175 | $ | 78,371 | $ | (38,081 | ) | $ | 40,290 | |||||||||||||||||
| Trademarks |
361,723 | 361,723 | 361,723 | 361,723 | 3,848 | 3,848 | ||||||||||||||||||||||||||||||
|
|
|
|
|
|
|
|
|
|
|
|
|
|
|
|
|
|
|
|||||||||||||||||||
| Total |
¥ | 7,728,559 | ¥ | (3,579,582) | ¥ | 4,148,977 | ¥ | 7,728,559 | ¥ | (3,165,661) | ¥ | 4,562,898 | $ | 82,219 | $ | (38,081 | ) | $ | 44,138 | |||||||||||||||||
|
|
|
|
|
|
|
|
|
|
|
|
|
|
|
|
|
|
|
|||||||||||||||||||
For the years ended March 31, 2013, 2012 and 2011, the net income reconciliation item related to intangible assets represents the intangible assets amortization charge recognized under U.S. GAAP amounting to ¥413,921 thousand ($4,403 thousand), ¥413,921 thousand and ¥413,921 thousand, respectively.
Customer contracts are being amortized on a straight-line basis over periods of 14 to 20 years. Trademarks are not amortized but are tested for impairment at least annually, as well as on an interim basis if events or changes in the circumstances indicate that the trademarks might be impaired.
Under U.S. GAAP, the estimated aggregate amortization expense for intangible assets acquired for the next five years is as follows:
| Year Ending March 31 |
Thousands of Yen |
Thousands of U.S. Dollars |
||||||
| 2014 |
¥ | 413,921 | $ | 4,403 | ||||
| 2015 |
413,921 | 4,403 | ||||||
| 2016 |
413,921 | 4,403 | ||||||
| 2017 |
413,921 | 4,403 | ||||||
| 2018 |
413,921 | 4,403 | ||||||
Other adjustments in connection with business combinations:
The following table represents a summary of other adjustments in connection with the Yamato business combination as described above as of March 31, 2013 and 2012 and for the years ended March 31, 2011:
| Thousands of Yen | Thousands of U.S. Dollars |
|||||||||||||||
| 2013 | 2012 | 2011 | 2013 | |||||||||||||
| As of March 31, 2013 |
As of March 31, 2012 |
Year Ended March 31, 2011 |
As of March 31, 2013 |
|||||||||||||
| Amortization of deferred revenue recognized under U.S. GAAP which was not recognized under Japanese GAAP (*) |
¥ | 7,793 | ||||||||||||||
| Land |
¥ | (24,423 | ) | ¥ | (24,423 | ) | $ | (259 | ) | |||||||
|
|
|
|
|
|
|
|
|
|||||||||
| Total |
¥ | (24,423 | ) | ¥ | (24,423 | ) | ¥ | 7,793 | $ | (259 | ) | |||||
|
|
|
|
|
|
|
|
|
|||||||||
F-103
Table of Contents
| (*) | Under Japanese GAAP, Yamato, the acquired company, had arrangements that required Yamato’s customers to pay a certain amount of revenue at the start of the contract prior to the acquisition date. These up-front payments were characterized as non-refundable and were related to services to be provided in future years. Yamato recognized these payments as revenue when cash is received. Under U.S. GAAP, the up-front payments are deferred over the longer of the contractual life of an arrangement or the customer relationship life. In addition, if the balance sheet of an acquired entity immediately before the acquisition date includes deferred revenue, the acquiring entity is required to recognize a liability if such deferred revenue represents a legal obligation assumed by the acquiring entity. The amount assigned to that liability is based on its estimated fair value at the acquisition date. |
Business combinations adjustments summary:
The following table summarizes the U.S. GAAP adjustments related to the above-mentioned business combinations:
| Thousands of Yen | Thousands of U.S. Dollars | |||||||||||||||||||||||||||
| 2013 | 2012 | 2011 | 2013 | |||||||||||||||||||||||||
| As of March 31, 2013 |
Year Ended March 31, 2013 |
As of March 31, 2012 |
Year Ended March 31, 2012 |
Year Ended March 31, 2011 |
As of March 31, 2013 |
Year Ended March 31, 2013 |
||||||||||||||||||||||
| Goodwill |
¥ | 2,873,736 | ¥ | 123,938 | ¥ | 2,749,798 | ¥ | 317,938 | ¥ | 317,938 | $ | 30,571 | $ | 1,317 | ||||||||||||||
| Intangible assets |
4,148,977 | (413,921 | ) | 4,562,898 | (413,921 | ) | (413,921 | ) | 44,138 | (4,403 | ) | |||||||||||||||||
| Land and deferred revenue |
(24,423 | ) | (24,423 | ) | 7,793 | (259 | ) | |||||||||||||||||||||
|
|
|
|
|
|
|
|
|
|
|
|
|
|
|
|||||||||||||||
| Total |
¥ | 6,998,290 | ¥ | (289,983) | ¥ | 7,288,273 | ¥ | (95,983 | ) | ¥ | (88,190) | $ | 74,450 | $ | (3,086 | ) | ||||||||||||
|
|
|
|
|
|
|
|
|
|
|
|
|
|
|
|||||||||||||||
b. Accrued Vacation
Japanese GAAP does not specifically require a company to accrue liabilities for future compensated absences (short-term employee benefits). Under U.S. GAAP, in accordance with ASC 710, “Compensation—General,” absences such as vacations are accrued when earned by employees.
c. Employees’ Retirement Benefits
Japanese GAAP and U.S. GAAP follow similar principles in accounting for retirement benefit obligations; however, there are currently several differences in the detailed application of these principles (See Note g for Recent Accounting Pronouncements Adopted and to Be Adopted in Future Periods for Retirement Benefits in Japanese GAAP).
The following represent the most relevant differences between Japanese GAAP and U.S. GAAP in connection with assumptions used to calculate the pension liability:
| (1) | Unlike U.S. GAAP, there is no corridor approach and actuarial gain or loss is always amortized under Japanese GAAP. Instead, Japanese GAAP allows the entity to use the same assumed discount rate as the prior year if it fluctuates within the permitted range as described in (3) below. |
| (2) | Under Japanese GAAP, the prior service credits of ¥37,370 thousand which were recognized as a result of amendments of the pension plans were included in net periodic pension credit entirely in the year ended March 31, 2011. Under U.S. GAAP, the prior service credit was recognized as a charge to other comprehensive income at the date of amendment and amortized as a component of net periodic pension cost over the average remaining service period. Unamortized prior service credits as of March 31, 2013 and March 31, 2012 were ¥210,783 thousand ($2,242 thousand) and ¥237,224 thousand, respectively, and were included in accumulated other comprehensive income. |
F-104
Table of Contents
| (3) | Under Japanese GAAP, it is acceptable to select the same discount rate as the prior year as long as there would be only a minor difference between the projected benefit obligations estimated using the rate as of the balance sheet date and the one estimated using the prior year’s rate. However, there is no such exception under U.S. GAAP. |
| (4) | Under Japanese GAAP, it is not required to recognize the overfunded or underfunded status of a defined benefit postretirement plan in accumulated other comprehensive income in the balance sheet. Under U.S. GAAP, such amounts are recognized in accumulated other comprehensive income, net of tax, in the balance sheet, and also the actuarial gains or losses and prior service costs that arise during the period but are not recognized as components of net periodic benefit cost are recognized as a component of other comprehensive income. |
The liability for employees’ retirement benefits at March 31, 2013 and 2012 under U.S. GAAP consisted of the following:
| Thousands of Yen | Thousands of U.S. Dollars |
|||||||||||
| 2013 | 2012 | 2013 | ||||||||||
| Projected benefit obligation |
¥ | (9,575,689 | ) | ¥ | (9,400,986 | ) | $ | (101,869 | ) | |||
| Fair value of plan assets |
7,198,328 | 6,232,419 | 76,578 | |||||||||
|
|
|
|
|
|
|
|||||||
| Net liability under U.S. GAAP |
(2,377,361 | ) | (3,168,567 | ) | (25,291 | ) | ||||||
|
|
|
|
|
|
|
|||||||
| Net liability under Japanese GAAP: |
||||||||||||
| Employees’ retirement benefits |
(1,109,515 | ) | (1,218,329 | ) | (11,803 | ) | ||||||
| Prepaid pension costs |
140,439 | 273,560 | 1,494 | |||||||||
|
|
|
|
|
|
|
|||||||
| Total |
(969,076 | ) | (944,769 | ) | (10,309 | ) | ||||||
|
|
|
|
|
|
|
|||||||
| Equity reconciliation item |
¥ | (1,408,285 | ) | ¥ | (2,223,798 | ) | $ | (14,982 | ) | |||
|
|
|
|
|
|
|
|||||||
Under U.S. GAAP, the components of net periodic benefit costs for the years ended March 31, 2013, 2012 and 2011 are as follows:
| Thousands of Yen | Thousands of U.S. Dollars |
|||||||||||||||
| 2013 | 2012 | 2011 | 2013 | |||||||||||||
| Service cost |
¥ | 676,744 | ¥ | 656,630 | ¥ | 648,075 | $ | 7,199 | ||||||||
| Interest cost |
101,071 | 125,660 | 119,879 | 1,075 | ||||||||||||
| Amortization of prior service credit |
(26,442 | ) | (26,899 | ) | (26,550 | ) | (281 | ) | ||||||||
| Expected return on plan assets |
(128,097 | ) | (118,041 | ) | (117,162 | ) | (1,363 | ) | ||||||||
| Recognized actuarial loss |
98,399 | 76,734 | 43,394 | 1,047 | ||||||||||||
|
|
|
|
|
|
|
|
|
|||||||||
| Net periodic benefit costs under U.S. GAAP |
721,675 | 714,084 | 667,636 | 7,677 | ||||||||||||
| Net periodic benefit costs under Japanese GAAP |
820,937 | 750,349 | 648,072 | 8,733 | ||||||||||||
|
|
|
|
|
|
|
|
|
|||||||||
| Net income reconciliation item |
¥ | (99,262 | ) | ¥ | (36,265 | ) | ¥ | 19,564 | $ | (1,056 | ) | |||||
|
|
|
|
|
|
|
|
|
|||||||||
F-105
Table of Contents
The U.S. GAAP assumptions used for the years ended March 31, 2013, 2012 and 2011 are set forth below:
| 2013 | 2012 | 2011 | ||||||||||
| Discount rate |
1.10 | % | 1.10 | % | 1.50 | % | ||||||
| Expected rate of return on plan assets |
2.0 | % | 2.0 | % | 2.0 | % | ||||||
| Amortization period of prior service credit relating to the plan amendment |
From 8 to 12 years | From 8 to 12 years | From 8 to 12 years | |||||||||
| Recognition period of actuarial gain/loss |
From 8 to 12 years | From 5 to 12 years | From 5 to 12 years | |||||||||
d. Capital Leases
Previously, Japanese GAAP permitted finance leases that did not transfer ownership of the leased property to a lessee to be accounted for as operating lease transactions if certain “as if capitalized” information was disclosed in the notes to the lessee’s financial statements. However, as explained in Note 2.m, the new accounting standard for lease required the Company to capitalize finance leases on its consolidated balance sheet.
Finance leases that do not transfer ownership and whose commencement day falls prior to the first year of implementation of this accounting standard may continue to be accounted for as an operating lease with required pro forma disclosure in the notes in accordance with an exception rule in the new accounting standard. Refer to Notes 2.m and 8.
U.S. GAAP requires the application of ASC 840, “Leases,” in order to determine whether a lease should be classified as an operating or capital lease. The Group analyzed its leases in accordance with the criteria specified in ASC 840 and determined that certain of its leases should be capitalized.
The following table presents a summary of the differences between Japanese GAAP and U.S. GAAP for lease-related assets and liabilities as of March 31, 2013, 2012 and 2011, and income statement related information for the years ended March 31, 2013, 2012 and 2011:
| Thousands of Yen | Thousands of U.S. Dollars |
|||||||||||||||
| 2013 | 2012 | 2011 | 2013 | |||||||||||||
| Machinery and equipment |
¥ | 69,451 | ¥ | 77,032 | ¥ | 91,666 | $ | 739 | ||||||||
| Furniture and fixtures |
533,333 | 886,733 | 1,211,962 | 5,674 | ||||||||||||
| Other assets |
18,713 | 50,694 | 95,727 | 198 | ||||||||||||
| Accumulated depreciation |
(285,510 | ) | (608,492 | ) | (1,006,895 | ) | (3,037 | ) | ||||||||
| Lease obligation |
(348,732 | ) | (422,504 | ) | (406,439 | ) | (3,710 | ) | ||||||||
| Other long-term liabilities |
85 | 471 | ||||||||||||||
|
|
|
|
|
|
|
|
|
|||||||||
| Net impact on equity |
¥ | (12,745 | ) | ¥ | (16,452 | ) | ¥ | (13,508 | ) | $ | (136 | ) | ||||
|
|
|
|
|
|
|
|
|
|||||||||
| Reversal of operating lease expense |
¥ | 170,842 | ¥ | 259,943 | ¥ | 390,044 | $ | 1,817 | ||||||||
| Lease asset depreciation under U.S. GAAP |
(158,839 | ) | (253,049 | ) | (367,066 | ) | (1,690 | ) | ||||||||
| Lease related interest expense under U.S. GAAP |
(8,296 | ) | (9,838 | ) | (15,262 | ) | (88 | ) | ||||||||
|
|
|
|
|
|
|
|
|
|||||||||
| Lease related impact on net income before income tax |
¥ | 3,707 | ¥ | (2,944 | ) | ¥ | 7,716 | $ | 39 | |||||||
|
|
|
|
|
|
|
|
|
|||||||||
F-106
Table of Contents
e. Tax Effect of Adjustments
Accounting for income taxes in accordance with Japanese GAAP is substantially similar to accounting for income taxes in accordance with ASC 740, “Income Taxes.” Other than the deferred tax impact related to the U.S. GAAP reconciliation items, there is no material difference in connection with accounting for income taxes resulting from the application of U.S. GAAP.
The following table illustrates the impact on the Japanese GAAP deferred tax assets and liabilities in the Group’s consolidated balance sheets as a result of the U.S. GAAP adjustments as of March 31, 2013 and 2012:
| Thousands of Yen | Thousands of U.S. Dollars | |||||||||||||||||||||||
| 2013 | 2013 | |||||||||||||||||||||||
| Japanese GAAP Balances |
ASC 740 Applied to U.S. GAAP Adjustments |
U.S. GAAP Balances |
Japanese GAAP Balances |
ASC 740 Applied to U.S. GAAP Adjustments |
U.S. GAAP Balances |
|||||||||||||||||||
| Balance sheet: |
||||||||||||||||||||||||
| Current deferred tax assets |
¥ | 1,814,557 | ¥ | 906,836 | ¥ | 2,721,393 | $ | 19,304 | $ | 9,647 | $ | 28,951 | ||||||||||||
| Non-current deferred tax assets |
479,500 | 13,110 | 492,610 | 5,101 | 140 | 5,241 | ||||||||||||||||||
| Non-current deferred tax liabilities |
(970,427 | ) | (970,427 | ) | (10,324 | ) | (10,324 | ) | ||||||||||||||||
|
|
|
|
|
|
|
|
|
|
|
|
|
|||||||||||||
| Net deferred tax assets |
¥ | 2,294,057 | ¥ | (50,481 | ) | ¥ | 2,243,576 | $ | 24,405 | $ | (537 | ) | $ | 23,868 | ||||||||||
|
|
|
|
|
|
|
|
|
|
|
|
|
|||||||||||||
| Thousands of Yen | ||||||||||||
| 2012 | ||||||||||||
| Japanese GAAP Balances |
ASC 740 Applied to U.S. GAAP Adjustments |
U.S. GAAP Balances |
||||||||||
| Balance sheet: |
||||||||||||
| Current deferred tax assets |
¥ | 1,768,432 | ¥ | 874,041 | ¥ | 2,642,473 | ||||||
| Non-current deferred tax assets |
522,264 | 49,377 | 571,641 | |||||||||
| Non-current deferred tax liabilities |
(863,378 | ) | (863,378 | ) | ||||||||
|
|
|
|
|
|
|
|||||||
| Net deferred tax assets |
¥ | 2,290,696 | ¥ | 60,040 | ¥ | 2,350,736 | ||||||
|
|
|
|
|
|
|
|||||||
Tax effects arising from U.S. GAAP adjustments for the years ended March 31, 2013, 2012 and 2011 were charged or credited to the following items:
| Thousands of Yen | Thousands of U.S. Dollars |
|||||||||||||||
| 2013 | 2012 | 2011 | 2013 | |||||||||||||
| Income taxes |
¥ | 143,326 | ¥ | 226,435 | ¥ | 173,776 | $ | 1,525 | ||||||||
| Other comprehensive income: employees’ retirement benefits |
(253,847 | ) | 150,868 | 172,534 | (2,701 | ) | ||||||||||
|
|
|
|
|
|
|
|
|
|||||||||
| Total tax effects |
¥ | (110,521 | ) | ¥ | 377,303 | ¥ | 346,310 | $ | (1,176 | ) | ||||||
|
|
|
|
|
|
|
|
|
|||||||||
U.S. GAAP adjustments related to the reversal of goodwill amortization charges recorded under Japanese GAAP have no tax effects since they are not deductible for tax purposes under Japanese Tax Laws and Regulations.
F-107
Table of Contents
f. Cash and Cash Equivalents
The adjustment in the statements of cash flows to U.S. GAAP from Japanese GAAP mainly consisted of certain lease transactions which are only accounted for as capital leases under U.S. GAAP. Lease payments related to such are presented in financing activities under U.S. GAAP rather than operating activities under Japanese GAAP.
The following table represents the Group’s condensed consolidated information related to the statements of cash flows under U.S. GAAP for the years ended March 31, 2013, 2012 and 2011:
| Thousands of Yen | Thousands of U.S. Dollars |
|||||||||||||||
| 2013 | 2012 | 2011 | 2013 | |||||||||||||
| Net cash provided by operating activities |
¥ | 3,896,823 | ¥ | 6,087,013 | ¥ | 4,108,530 | $ | 41,456 | ||||||||
| Net cash provided by (used in) investing activities |
1,916,363 | (6,427,498 | ) | (379,726 | ) | 20,387 | ||||||||||
| Net cash used in financing activities |
(5,929,428 | ) | (4,155,591 | ) | (184,352 | ) | (63,079 | ) | ||||||||
|
|
|
|
|
|
|
|
|
|||||||||
| Net (decrease) increase in cash and cash equivalents |
(116,242 | ) | (4,496,076 | ) | 3,544,452 | (1,236 | ) | |||||||||
| Cash and cash equivalents at beginning of year |
7,825,451 | 12,321,527 | 8,777,075 | 83,249 | ||||||||||||
|
|
|
|
|
|
|
|
|
|||||||||
| Cash and cash equivalents at end of year |
¥ | 7,709,209 | ¥ | 7,825,451 | ¥ | 12,321,527 | $ | 82,013 | ||||||||
|
|
|
|
|
|
|
|
|
|||||||||
g. Recent Accounting Pronouncements Adopted and to Be Adopted in Future Periods
U.S. GAAP
In October 2009, the FASB issued Accounting Standard Update regarding the accounting for multiple-deliverable arrangements, Accounting Standard Update No. 2009-13, “Revenue Recognition (Topic 605).” The guidance addresses the accounting for multiple-deliverable arrangements to enable vendors to account for products or services (deliverables) separately rather than as a combined unit. The amendments in this guidance were effective prospectively for revenue arrangements entered into or materially modified in fiscal years beginning on or after June 15, 2010. The effect of the adoption of this guidance on the Company’s financial position and results of operations was immaterial.
In January 2010, the FASB issued Accounting Standard Update which requires an additional disclosure and clarifies existing disclosure requirements related to fair value measurements, Accounting Standard Update No. 2010-06, “Fair Value Measurements and Disclosures (Topic 820)—Improving Disclosures about Fair Value Measurements.” The guidance requires additional disclosure of significant transfers in and out of Level 1 and Level 2 fair value measurements and activity in Level 3 fair value measurement. This guidance also clarifies existing disclosure requirements regarding the level of disaggregation and valuation inputs and techniques. This guidance was effective for interim and annual reporting periods beginning after December 15, 2009, except for the disclosure of the Level 3 activity of purchases, sales, issuances, and settlements on a gross basis, which was effective for interim and annual reporting periods beginning after December 15, 2010. The adoption of this guidance had no impact on the Company’s financial position and results of operations.
In May 2011, the FASB issued Accounting Standard Update No. 2011-04, “Fair Value Measurement (Topic 820)—Amendments to Achieve Common Fair Value Measurement and Disclosure Requirements in U.S. GAAP and IFRSs.” The guidance amends the terms used in the requirements for fair value measurements and disclosures under ASC 820, “Fair Value Measurement.” It also amends certain principles and requirements
F-108
Table of Contents
of fair value measurements and disclosures, and expands the disclosure requirements. This guidance was effective for interim and annual reporting periods beginning after December 15, 2011. The adoption of this guidance had no impact on the Company’s financial position and results of operations.
In June 2011, the FASB issued Accounting Standard Update No. 2011-05, “Comprehensive Income (Topic 220)—Presentation of Comprehensive Income.” The guidance eliminates the option to present the components of other comprehensive income as part of the statement of changes in equity and requires that all non-owner changes in equity be presented either in a single continuous statement of comprehensive income or in two separate but consecutive statements. This guidance was effective retrospectively for fiscal years, and interim periods within those years, beginning after December 15, 2011. The adoption of this provision had no impact on the Company’s financial position and results of operations.
In September 2011, the FASB issued Accounting Standards Update No. 2011-08, “Intangibles—Goodwill and Other (Topic 350)—Testing Goodwill for Impairments.” The guidance allows companies an option to first assess qualitative factors to determine whether it is more likely than not that the fair value of a reporting unit is less than its carrying amount as a basis for determining if it is necessary to perform the two-step quantitative goodwill impairment test. Under the guidance, a reporting entity is no longer required to calculate the fair value of a reporting unit unless the entity determines, based on the qualitative assessment, that it is more likely than not that its fair value is less than its carrying amount. The guidance was effective for annual and interim goodwill impairment tests performed for fiscal years beginning after December 15, 2011. The effect of the adoption of this guidance on the Company’s financial position and results of operations was immaterial.
In December 2011, the FASB issued Accounting Standards Update No. 2011-11 “Balance sheet (Topic 210).” The guidance requires a reporting entity to disclose information about offsetting and related arrangements to enable financial statement users to understand the effect of such arrangements on the statement of financial position as well as to improve comparability of balance sheets prepared under U.S. GAAP and International Financial Reporting Standards. The guidance is required to be applied retrospectively and is effective for annual periods for fiscal years beginning on or after January 1, 2013. The Company does not expect its adoption will have a material impact on its financial position and results of operations.
In July 2012, the FASB issued Accounting Standards Update No. 2012-02, “Intangibles—Goodwill and Other (Topic 350) : Testing Indefinite-lived Intangible Assets for Impairment” The guidance allows entities an option to first assess qualitative factors to determine whether it is more likely than not that indefinite lived intangible assets are impaired as a basis for determining if it is necessary to perform the quantitative impairment test. Under the new guidance, entities are no longer required to calculate the fair value of the assets unless the entities determine, based on the qualitative assessment, that it is more likely than not that indefinite lived intangible assets is impaired. The new guidance is effective for annual and interim impairment tests performed for fiscal years beginning after September 15, 2012. The Company does not expect its adoption will have a material impact on its financial position and results of operations.
In February 2013, the FASB issued Accounting Standards Update No. 2013-02, “Comprehensive Income (Topic 220): Reporting of Amounts Reclassified Out of Accumulated Other Comprehensive Income”. The guidance requires entities to report the significant reclassifications out of accumulated other comprehensive income if the amount is required to be reclassified in its entirety to net income. For other amounts that are not required to be reclassified in their entirety to net income in the same reporting period, an entity is required to cross-reference other disclosures required that provide additional detail about those amounts.
In February 2013, the FASB issued Accounting Standard Update No. 2013-04, “Liabilities (Topic 405): Obligations Resulting from Joint and Several Liability Arrangements for Which the Total Amount of the Obligation Is Fixed at the Reporting Date (a consensus of the FASB Emerging Issues Task Force)”. This guidance requires an entity to measure obligations resulting from joint and several liability arrangements for which the total amount of the obligation within the scope of this guidance is fixed at the reporting date, as the
F-109
Table of Contents
sum of the amount the reporting entity agreed to pay on the basis of its arrangement among its co-obligors, plus any additional amount the reporting entity expects to pay on behalf of its co-obligors. The new guidance is effective for fiscal years, and interim periods within those years, beginning after December 15, 2013. The Company does not expect its adoption will have a material impact on its financial position and results of operations.
Japanese GAAP
In December 2009, the ASBJ issued Accounting Standard—ASBJ Statement No. 24, “Accounting Standard for Accounting Changes and Error Corrections” and ASBJ Implementation Guidance No. 24, “Guidance on Accounting Standard for Accounting Changes and Error Corrections.” This new standard and implementation guidance clarify the treatment for retrospective applications to past financial statements when changes in accounting policies, changes in presentations and corrections of prior period errors are made, as well as the treatment for changes in accounting estimates, as required in the global accounting standards. This standard and implementation guidance apply to accounting changes and corrections of prior period errors which are made after the beginning of the fiscal year beginning on or after April 1, 2011. The effect of adoption of this provision on the Company’s financial position and results of operations was immaterial.
In March 2011, the ASBJ issued Accounting Standard—ASBJ Statement No. 22, “Revised Accounting Standard for Consolidated Financial Statements”, ASBJ Guidance No. 15, “Revised Guidance on Disclosures about Certain Special Purpose Entities,” ASBJ Guidance No. 22, “Revised Guidance on Determining a Subsidiary and an Affiliate” and PITF No. 20, “Revised Practical Solution on Application of the Control Criteria and Influence Criteria to Investment Associations.” These revisions are aimed to provide a short-term improvement to the existing standards to address current treatment for certain special purpose entities. Those pronouncements will be effective for the annual periods beginning on or after April 1, 2013. Early adoption is permitted. The Company does not expect adoption of those pronouncements will have a significant impact on its financial position and results of operations.
In May 2012, the ASBJ issued Accounting Standard—ASBJ Statement No. 26, “Accounting Standard for Retirement Benefits” and ASBJ Guidance No. 25, “Guidance on Accounting Standard for Retirement Benefits.” The standard and the guidance replace previous standards and guidance for retirement benefits and include (a) recognition of actuarial gains and losses and past service costs to be recognized in profit and loss as other comprehensive income after adjusting for tax effects and the deficit or surplus would be recognized as a liability or asset, (b) the choice of the method of attributing expected benefit to periods between straight-line basis and benefit formula basis and (c) enhancement of disclosures. The standard and guidance will be effective for the end of annual periods beginning on or after April 1, 2013. The Company is currently evaluating the potential impact from adopting the standard and guidance on its financial position and results of operations.
F-110
Table of Contents
Shares
ARAMARK Holdings Corporation
Common Stock

Prospectus
| Goldman, Sachs & Co. | J.P. Morgan | Credit Suisse | Morgan Stanley |
| Barclays | BofA Merrill Lynch | RBC Capital Markets | Wells Fargo Securities | |||
| Baird | PNC Capital Markets LLC | Rabo Securities | Ramirez & Co., Inc. | |||
| Santander | SMBC Nikko | The Williams Capital Group, L.P. |
, 2013
Table of Contents
PART II
INFORMATION NOT REQUIRED IN PROSPECTUS
| Item 13. | Other Expenses of Issuance and Distribution. |
The following table sets forth the costs and expenses, other than underwriting discounts and commissions, payable solely by the Registrant in connection with the offer and sale of the securities being registered. All amounts are estimates except the registration fee.
| SEC registration fee |
$ | 13,640.00 | ||
| FINRA filing fee |
* | |||
| Exchange listing fee |
* | |||
| Blue Sky fees and expenses |
* | |||
| Transfer agent’s fee |
* | |||
| Printing and engraving expenses |
* | |||
| Legal fees and expenses |
* | |||
| Accounting fees and expenses |
* | |||
| Liability insurance for directors and officers |
* | |||
| Miscellaneous |
* | |||
|
|
|
|||
| Total |
* | |||
|
|
|
| * | To be completed by amendment. |
| Item 14. | Indemnification of Directors and Officers. |
ARAMARK Holdings Corporation is incorporated under the laws of Delaware.
Section 145 of the Delaware General Corporation Law (the “DGCL”) grants each corporation organized thereunder the power to indemnify any person who is or was a director, officer, employee or agent of a corporation or enterprise against expenses, including attorneys’ fees, judgments, fines and amounts paid in settlement actually and reasonably incurred by him in connection with any threatened, pending or completed action, suit or proceeding, whether civil, criminal, administrative or investigative, other than an action by or in the right of the corporation, by reason of being or having been in any such capacity, if he acted in good faith in a manner reasonably believed to be in, or not opposed to, the best interests of the corporation, and, with respect to any criminal action or proceeding, had no reasonable cause to believe his conduct was unlawful.
Section 102(b)(7) of the DGCL enables a corporation in its certificate of incorporation or an amendment thereto to eliminate or limit the personal liability of a director to the corporation or its stockholders of monetary damages for violations of the directors’ fiduciary duty of care, except (i) for any breach of the director’s duty of loyalty to the corporation or its stockholders, (ii) for acts or omissions not in good faith or that involve intentional misconduct or a knowing violation of law, (iii) pursuant to Section 174 of the DGCL (providing for liability of directors for unlawful payment of dividends or unlawful stock purchases or redemptions) or (iv) for any transaction from which a director derived an improper personal benefit.
The amended and restated certificate of incorporation of ARAMARK Corporation provides that we must indemnify our directors and officers to the fullest extent authorized by the Delaware General Corporation Law as the same exists or may hereafter be amended (but, in the case of any such amendment, only to the extent that such amendment permits the Corporation to provide broader indemnification rights than such law permitted the Corporation to provide prior to such amendment). We will also pay expenses incurred in defending any such proceeding in advance of its final disposition upon delivery to us of an undertaking, by or on behalf of an indemnified person, to repay all amounts so advanced if it should be determined ultimately that such person is not entitled to be indemnified under this section or otherwise.
II-1
Table of Contents
The indemnification rights set forth above shall not be exclusive of any other right which an indemnified person may have or hereafter acquire under any statute, provision of our Certificate of Incorporation, our By-Laws, agreement, vote of stockholders or directors or otherwise.
We maintain insurance to protect ourselves and our directors, officers and representatives against any such expense, liability or loss, whether or not we would have the power to indemnify him against such expense, liability or loss under the Delaware General Corporation Law.
| Item 15. | Recent Sales of Unregistered Securities. |
Equity Securities
During the ten months ended July 26, 2013, we granted to certain of our employees (i) 4,769,764 time-based stock options, (ii) 462,500 performance-based stock options, (iii) 350,000 installment stock purchase opportunities, (iv) 1,247,056 restricted stock units and (v) 42,462 deferred stock units. These securities were issued under the Company’s equity incentive plan without registration in reliance on the exemptions afforded by Section 4(a)(2) of the Securities Act and Rule 701 promulgated thereunder.
On July 29, 2013 we closed an exchange offer for our outstanding installment stock purchase opportunities. In the exchange offer, 51 employees exchanged 1,334,000 installment stock purchase opportunities for 225,262 shares of restricted stock and 1,108,738 time based stock options. These securities were issued under the Company’s equity incentive plan without registration in reliance on the exemptions afforded by Section 4(a)(2) of the Securities Act and Rule 701 promulgated thereunder.
During the fiscal year ended September 28, 2012, we granted to certain of our employees (i) 2,699,000 time-based stock options, (ii) 2,699,000 performance-based stock options, (iii) 920,000 installment stock purchase opportunities, (iv) 3,500,000 Seamless unit options, and (v) 34,480 deferred stock units. These securities were issued under the Company’s equity incentive plans without registration in reliance on the exemptions afforded by Section 4(a)(2) of the Securities Act and Rule 701 promulgated thereunder.
During the fiscal year ended September 30, 2011, we granted to certain of our employees (i) 2,112,000 time-based stock options, (ii) 2,112,000 performance-based stock options, (iii) 1,000,000 installment stock purchase opportunities, (iv) 6,000,000 Seamless unit options, and (v) 71,594 deferred stock units. These securities were issued under the Company’s equity incentive plans without registration in reliance on the exemptions afforded by Section 4(a)(2) of the Securities Act and Rule 701 promulgated thereunder.
During the fiscal year ended October 1, 2010, we granted to certain of our employees (i) 4,176,000 time-based stock options, (ii) 4,176,000 performance-based stock options, and (iii) 32,015 deferred stock units. These securities were issued under the Company’s equity incentive plans without registration in reliance on the exemptions afforded by Section 4a(2) of the Securities Act and Rule 701 promulgated thereunder.
Debt Securities
On March 7, 2013, ARAMARK Corporation issued $1,000,000,000 5.75% Senior Notes due 2020 at a price of 100.00% of their face value resulting in approximately $986.8 million of gross proceeds, which was used, together with other funds of the Company, to fund cash tender offers for certain of our notes and to fund fees, expenses and premiums in connection with certain amendments to our senior credit agreement. The initial purchasers for these notes were Goldman, Sachs & Co., J.P. Morgan Securities LLC, Barclays Capital Inc., Merrill Lynch, Pierce, Fenner & Smith Incorporated, Wells Fargo Securities, LLC, Rabo Securities USA, Inc., PNC Capital Markets LLC, Santander Investment Securities, Inc. and SMBC Nikko Capital Markets Limited.
On April 28, 2011, we issued $600,000,000 8.625%/9.375% Senior Notes due 2016 at a price of 99.00% of their face value resulting in approximately $579.5 million of gross proceeds, which was used to make a $711.7
II-2
Table of Contents
million distribution to our stockholders and to pay fees and expenses related to the extension of our revolving credit facility. The initial purchasers for these notes were J.P. Morgan Securities LLC, Goldman, Sachs & Co., Barclays Capital Inc., Merrill Lynch, Pierce, Fenner & Smith Incorporated, Wells Fargo Securities, LLC, PNC Capital Markets LLC and Santander Investments Securities Inc.
Each of the above offerings of debt securities was offered and sold to qualified institutional buyers pursuant to Rule 144A under the Securities Act or to non-U.S. investors outside the United States in compliance with Regulation S of the Securities Act.
| Item 16. | Exhibits and Financial Statement Schedules. |
(a) Exhibits
See the Exhibit Index immediately following the signature page hereto, which is incorporated by reference as if fully set forth herein.
(b) Financial Statement Schedules
See Index to Consolidated Financial Statements at page F-1.
| Item 17. | Undertakings. |
The undersigned registrant hereby undertakes that:
(1) For purposes of determining any liability under the Securities Act of 1933, the information omitted from the form of prospectus filed as part of this Registration Statement in reliance upon Rule 430A and contained in a form of prospectus filed by the Registrant pursuant to Rule 424(b)(1) or (4) or 497(h) under the Securities Act shall be deemed to be part of this Registration Statement as of the time it was declared effective.
(2) For the purpose of determining any liability under the Securities Act of 1933, each post-effective amendment that contains a form of prospectus shall be deemed to be a new registration statement relating to the securities offered therein, and the offering of such securities at that time shall be deemed to be the initial bona fide offering thereof.
(3) Insofar as indemnification for liabilities arising under the Securities Act of 1933 may be permitted to directors, officers and controlling persons of the registrant pursuant to the foregoing provisions, or otherwise, the registrant has been advised that in the opinion of the Securities and Exchange Commission such indemnification is against public policy as expressed in the Act and is, therefore, unenforceable. In the event that a claim for indemnification against such liabilities (other than the payment by the registrant of expenses incurred or paid by a director, officer or controlling person of the registrant in the successful defense of any action, suit or proceeding) is asserted by such director, officer or controlling person in connection with the securities being registered, the registrant will, unless in the opinion of its counsel the matter has been settled by controlling precedent, submit to a court of appropriate jurisdiction the question whether such indemnification by it is against public policy as expressed in the Act and will be governed by the final adjudication of such issue.
II-3
Table of Contents
SIGNATURES
Pursuant to the requirements of the Securities Act of 1933, as amended, ARAMARK Holdings Corporation has duly caused this Registration Statement to be signed on its behalf by the undersigned, thereunto duly authorized, in the City of Philadelphia, Commonwealth of Pennsylvania, on September 9, 2013.
| ARAMARK HOLDINGS CORPORATION | ||
| By: |
/S/ ERIC J. FOSS | |
| Name: |
Eric J. Foss | |
| Title: |
Chief Executive Officer, President and Director | |
POWER OF ATTORNEY
Each person whose signature appears below hereby constitutes and appoints Stephen R. Reynolds and Harold Dichter and each of them, the true and lawful attorneys-in-fact and agents of the undersigned, with full power of substitution and resubstitution, for and in the name, place and stead of the undersigned, in any and all capacities, to sign any and all amendments (including post-effective amendments) to this registration statement, including any filings pursuant to Rule 462(b) under the Securities Act of 1933, as amended, and to file the same, with all exhibits thereto, and all other documents in connection therewith, with the Securities and Exchange Commission, and hereby grants to such attorneys-in-fact and agents, and each of them, full power and authority to do and perform each and every act and anything necessary to be done, as fully to all intents and purposes as the undersigned might or could do in person, hereby ratifying and confirming all that said attorneys-in-fact and agents, or any of them, or their or his substitute, or substitutes, may lawfully do or cause to be done by virtue hereof.
Pursuant to the requirements of the Securities Act of 1933, this registration statement has been signed by the following persons in the capacities indicated on September 9, 2013.
| Signature |
Capacity | |
| /S/ JOSEPH NEUBAUER Joseph Neubauer |
Chairman of the Board and Director | |
| /S/ ERIC J. FOSS Eric J. Foss |
Chief Executive Officer, President and Director | |
| /S/ L. FREDERICK SUTHERLAND L. Frederick Sutherland |
Executive Vice President, Chief Financial Officer (Principal Financial Officer) | |
| /S/ JOSEPH MUNNELLY Joseph Munnelly |
Senior Vice President, Controller and Chief Accounting Officer (Principal Accounting Officer) | |
| /S/ TODD M. ABBRECHT Todd M. Abbrecht |
Director | |
| /S/ LAWRENCE T. BABBIO, JR. Lawrence T. Babbio, Jr. |
Director | |
| /S/ LEONARD S. COLEMAN, JR. Leonard S. Coleman, Jr. |
Director | |
Table of Contents
| Signature |
Capacity | |
| /S/ THOMAS H. KEAN Thomas H. Kean |
Director | |
| /S/ JAMES E. KSANSNAK James E. Ksansnak |
Director | |
| /S/ KEWSONG LEE Kewsong Lee |
Director | |
| /S/ SANJEEV MEHRA Sanjeev Mehra |
Director | |
| /S/ STEPHEN P. MURRAY Stephen P. Murray |
Director | |
Table of Contents
EXHIBIT INDEX
| Exhibit |
Description | |
| 1.1** | Form of Underwriting Agreement. | |
| 3.1** | Form of Amended and Restated Certificate of Incorporation of ARAMARK Holdings Corporation. | |
| 3.2** | Form of Amended and Restated By-laws of ARAMARK Holdings Corporation. | |
| 4.1 | Indenture, dated as of March 7, 2013, among ARAMARK Corporation, the guarantors named therein and The Bank of New York Mellon, as trustee (incorporated by reference to Exhibit 4.1 to ARAMARK Corporation’s Current Report on Form 8-K filed with the SEC on March 7. 2013 pursuant to the Exchange Act (file number 001-04762)). | |
| 4.2 | Registration Rights Agreement, dated as of March 7, 2013, among ARAMARK Corporation, the guarantors named therein, Goldman, Sachs & Co. and J.P. Morgan Securities LLC, as representatives of the several initial purchasers (incorporated by reference to Exhibit 4.2 to ARAMARK Corporation’s Current Report on Form 8-K filed with the SEC on March 7. 2013 pursuant to the Exchange Act (file number 001-04762)). | |
| 5.1** | Opinion of Simpson Thacher & Bartlett LLP. | |
| 10.1† | Employment Agreement dated November 2, 2004 between ARAMARK Corporation and Joseph Neubauer (incorporated by reference to Exhibit 10.1 to ARAMARK Corporation’s Current Report on Form 8-K/A filed with the SEC on November 8, 2004, pursuant to the Exchange Act (file number 001-04762)). | |
| 10.2† | Amendment, effective as of January 26, 2007, to the Employment Agreement dated November 2, 2004 between ARAMARK Corporation and Joseph Neubauer (incorporated by reference to Exhibit 10.3 to ARAMARK Corporation’s Current Report on Form 8-K filed with the SEC on February 1, 2007, pursuant to the Exchange Act (file number 001-04762)). | |
| 10.3† | Amendment, effective as of November 15, 2007, to the Employment Agreement dated November 2, 2004 between ARAMARK Corporation and Joseph Neubauer (incorporated by reference to Exhibit 10.1 to ARAMARK Corporation’s Current Report on Form 8-K filed with the SEC on November 16, 2007, pursuant to the Exchange Act (file number 001-04762)). | |
| 10.4† | Letter relating to Joseph Neubauer’s Employment Agreement dated November 14, 2008 (incorporated by reference to Exhibit 10.4 to ARAMARK Corporation’s Annual Report on Form 10-K filed with the SEC on December 15, 2008, pursuant to the Exchange Act (file number 001-04762)). | |
| 10.5† | Letter relating to Joseph Neubauer’s Employment Agreement dated May 7, 2012 (incorporated by reference to Exhibit 10.7 to ARAMARK Corporation’s Quarterly Report on Form 10-Q filed with the SEC on May 9, 2012, pursuant to the Exchange Act (file number 001-04762)). | |
| 10.6† | Third Amendment dated as of November 14, 2012 to the Employment Agreement, dated as of November 2, 2004, as amended from time to time, between ARAMARK Corporation and Joseph Neubauer (incorporated by reference to Exhibit 10.4 to ARAMARK Corporation’s Current Report on Form 8-K filed with the SEC on November 19, 2012, pursuant to the Exchange Act (file number 001-04762)). | |
| 10.7† | Letter Agreement dated May 7, 2012 between ARAMARK Corporation and Eric Foss (incorporated by reference to Exhibit 10.4 to ARAMARK Corporation’s Quarterly Report on Form 10-Q filed with the SEC on May 9, 2012, pursuant to the Exchange Act (file number 001-04762)). | |
| 10.8† | Agreement Relating to Employment and Post-Employment Competition dated May 7, 2012 between ARAMARK Corporation and Eric Foss (incorporated by reference to Exhibit 10.5 to ARAMARK Corporation’s Quarterly Report on Form 10-Q filed with the SEC on May 9, 2012, pursuant to the Exchange Act (file number 001-04762)). | |
Table of Contents
| Exhibit |
Description | |
| 10.9† | Amendment, effective as of June 25, 2013, to the Letter Agreement dated May 7, 2012 between ARAMARK Corporation and Eric Foss (incorporated by reference to Exhibit 10.6 to ARAMARK Corporation’s Current Report on Form 8-K filed with the SEC on June 26, 2013, pursuant to the Exchange Act (file number 001-04762)). | |
| 10.10† | Form of Agreement Relating to Employment and Post-Employment Competition and Schedule 1 listing each Executive Officer who is a party to such Agreement (Incorporated by reference to Exhibit 10.1 to ARAMARK Corporation’s Current Report on Form 8-K filed with the SEC on July 19, 2007, pursuant to the Exchange Act (file number 001-04762)). | |
| 10.11† | Form of Amendment to Agreement Relating to Employment and Post-Employment Competition (incorporated by reference to Exhibit 10.8 to ARAMARK Corporation’s Annual Report on Form 10-K filed with the SEC on December 15, 2008, pursuant to the Exchange Act (file number 001-04762)). | |
| 10.12† | Agreement Relating to Employment and Post-Employment Competition dated November 14, 2007 between ARAMARK Corporation and Joseph Munnelly (incorporated by reference to Exhibit 10.2 to ARAMARK Corporation’s Quarterly Report on Form 10-Q filed with the SEC on February 6, 2008, pursuant to the Exchange Act (file number 001-04762)). | |
| 10.13† | Agreement Relating to Employment and Post-Employment Competition dated November 8, 2004 between ARAMARK Corporation and Karen A. Wallace (incorporated by reference to Exhibit 10.21 to ARAMARK Corporation’s Annual Report on Form 10-K filed with the SEC on December 20, 2012, pursuant to the Exchange Act (file number 001-04762)). | |
| 10.14† | Offer Letter dated July 20, 2012 between ARAMARK and Stephen R. Reynolds (incorporated by reference to Exhibit 10.12 to ARAMARK Corporation’s Annual Report on Form 10-K filed with the SEC on December 20, 2012, pursuant to the Exchange Act (file number 001-04762)). | |
| 10.15† | Agreement Relating to Employment and Post-Employment Competition dated December 6, 2012 between ARAMARK Corporation and Stephen R. Reynolds (incorporated by reference to Exhibit 10.13 to ARAMARK Corporation’s Annual Report on Form 10-K filed with the SEC on December 20, 2012, pursuant to the Exchange Act (file number 001-04762)). | |
| 10.16† | Agreement Relating to Employment and Post-Employment Competition dated July 1, 2013 between ARAMARK Corporation and Christina Takoudes Morrison (incorporated by reference to Exhibit 10.1 to ARAMARK Corporation’s Quarterly Report on Form 10-Q filed with the SEC on August 7, 2013, pursuant to the Exchange Act (file number 001-04762)).** | |
| 10.17† | Form of Indemnification Agreement and attached schedule (incorporated by reference to Exhibit 10.4 to ARAMARK Corporation’s Current Report on Form 8-K filed with the SEC on August 10, 2005, pursuant to the Exchange Act (file number 001-04762)). | |
| 10.18† | Indemnification Agreement dated May 7, 2012 between Eric Foss and ARAMARK Corporation (incorporated by reference to Exhibit 10.6 to ARAMARK Corporation’s Quarterly Report on Form 10-Q filed with the SEC on May 9, 2012, pursuant to the Exchange Act (file number 001-04762)). | |
| 10.19† | Indemnification Agreement dated December 15, 2011 between Joseph Munnelly and ARAMARK Corporation (incorporated by reference to Exhibit 10.13 to ARAMARK Corporation’s Annual Report on Form 10-K filed with the SEC on December 15, 2011, pursuant to the Exchange Act (file number 001-04762)). | |
| 10.20† | Indemnification Agreement dated December 12, 2012 between Karen A. Wallace and ARAMARK Corporation (incorporated by reference to Exhibit 10.21 to ARAMARK Corporation’s Annual Report on Form 10-K filed with the SEC on December 20, 2012, pursuant to the Exchange Act (file number 001-04762)). | |
Table of Contents
| Exhibit |
Description | |
| 10.21† | Indemnification Agreement dated December 12, 2012 between Stephen R. Reynolds and ARAMARK Corporation (incorporated by reference to Exhibit 10.22 to ARAMARK Corporation’s Annual Report on Form 10-K filed with the SEC on December 20, 2012, pursuant to the Exchange Act (file number 001-04762)). | |
| 10.22† | Fourth Amended and Restated ARAMARK Holdings Corporation 2007 Management Stock Incentive Plan (incorporated by reference to Exhibit 10.1 to ARAMARK Corporation’s Current Report on Form 8-K filed with the SEC on June 26, 2013, pursuant to the Exchange Act (file number 001-04762)). | |
| 10.23† | Form of Non-Qualified Stock Option Agreement (incorporated by reference to Exhibit 10.5 to ARAMARK Corporation’s Current Report on Form 8-K filed with the SEC on February 1, 2007, pursuant to the Exchange Act (file number 001-04762)). | |
| 10.24† | Form of Non-Qualified Stock Option Agreement (incorporated by reference to Exhibit 10.2 to ARAMARK Corporation’s Quarterly Report on Form 10-Q filed with the SEC on August 8, 2007, pursuant to the Exchange Act (file number 001-04762)). | |
| 10.25† | Form of Non-Qualified Stock Option Agreement (incorporated by reference to Exhibit 10.3 to ARAMARK Corporation’s Current Report on Form 8-K filed with the SEC on November 16, 2007, pursuant to the Exchange Act (file number 001-04762)). | |
| 10.26† | Form of Non-Qualified Stock Option Agreement (incorporated by reference to Exhibit 10.3 to ARAMARK Corporation’s Current Report on Form 8-K filed with the SEC on March 1, 2010, pursuant to the Exchange Act (file number 001-04762)). | |
| 10.27† | Form of Non-Qualified Stock Option Agreement (incorporated by reference to Exhibit 10.3 to ARAMARK Corporation’s Current Report on Form 8-K filed with the SEC on June 22, 2011, pursuant to the Exchange Act (file number 001-04762)). | |
| 10.28† | Amendment to Outstanding Non-Qualified Stock Option Agreements dated March 1, 2010 (incorporated by reference to Exhibit 10.1 to ARAMARK Corporation’s Current Report on Form 8-K filed with the SEC on March 1, 2010, pursuant to the Exchange Act (file number 001-04762)). | |
| 10.29† | Form of Amendment to outstanding Non-Qualified Stock Option Agreements (incorporated by reference to Exhibit 10.4 to ARAMARK Corporation’s Current Report on Form 8-K filed with the SEC on June 22, 2011, pursuant to the Exchange Act (file number 001-04762)). | |
| 10.30† | Form of Non-Qualified Stock Option Agreement (incorporated by reference to Exhibit 10.2 to ARAMARK Corporation’s Quarterly Report on Form 10-Q filed with the SEC on May 9, 2012, pursuant to the Exchange Act (file number 001-04762)). | |
| 10.31† | Form of Non-Qualified Installment Stock Purchase Opportunity Agreement (incorporated by reference to Exhibit 10.2 to ARAMARK Corporation’s Current Report on Form 8-K filed with the SEC on June 22, 2011, pursuant to the Exchange Act (file number 001-04762)). | |
| 10.32† | Form of Non-Qualified Installment Stock Purchase Opportunity Agreement (incorporated by reference to Exhibit 10.3 to ARAMARK Corporation’s Quarterly Report on Form 10-Q filed with the SEC on May 9, 2012, pursuant to the Exchange Act (file number 001-04762)). | |
| 10.33† | Form of Non-Qualified Installment Stock Purchase Opportunity Agreement (incorporated by reference to Exhibit 10.3 to ARAMARK Corporation’s Current Report on Form 8-K filed with the SEC on November 19, 2012, pursuant to the Exchange Act (file number 001-04762)). | |
| 10.34† | Form of Non-Qualified Stock Option Award Agreement (incorporated by reference to Exhibit 10.2 to ARAMARK Corporation’s Current Report on Form 8-K filed with the SEC on June 26, 2013, pursuant to the Exchange Act (file number 001-04762)). | |
Table of Contents
| Exhibit |
Description | |
| 10.35† | Form of Time-Based Restricted Stock Unit Award Agreement with ARAMARK Holdings Corporation (incorporated by reference to Exhibit 10.3 to ARAMARK Corporation’s Current Report on Form 8-K filed with the SEC on June 26, 2013, pursuant to the Exchange Act (file number 00104762)). | |
| 10.36† | Form of Restricted Stock Award Agreement with ARAMARK Holdings Corporation (incorporated by reference to Exhibit 10.4 to ARAMARK Corporation’s Current Report on Form 8-K filed with the SEC on June 26, 2013, pursuant to the Exchange Act (file number 001-04762)). | |
| 10.37† | Form of Replacement Stock Option Award Agreement with ARAMARK Holdings Corporation (incorporated by reference to Exhibit 10.5 to ARAMARK Corporation’s Current Report on Form 8K filed with the SEC on June 26, 2013, pursuant to the Exchange Act (file number 001-04762)). | |
| 10.38† | Schedule 1s to Outstanding Non-Qualified Stock Option Agreements (incorporated by reference to Exhibit 10.18 to ARAMARK Corporation’s Annual Report on Form 10-K filed with the SEC on December 15, 2009, pursuant to the Exchange Act (file number 001-04762)). | |
| 10.39† | Schedules 1 to Outstanding Non-Qualified Stock Option Agreements (incorporated by reference to Exhibit 10.2 to ARAMARK Corporation’s Current Report on Form 8-K filed with the SEC on March 1, 2010, pursuant to the Exchange Act (file number 001-04762)). | |
| 10.40† | New Schedule 1 to Form of Non-Qualified Stock Option Agreement (incorporated by reference to Exhibit 10.2 to ARAMARK Corporation’s Current Report on Form 8-K filed with the SEC on November 18, 2011, pursuant to the Exchange Act (file number 001-04762)). | |
| 10.41† | Revised Schedule 1s to outstanding Non-Qualified Stock Option Agreements (incorporated by reference to Exhibit 10.3 to ARAMARK Corporation’s Current Report on Form 8-K filed with the SEC on November 18, 2011, pursuant to the Exchange Act (file number 001-04762)). | |
| 10.42† | New Schedule 1 to Form of Non-Qualified Stock Option Agreement (incorporated by reference to Exhibit 10.1 to ARAMARK Corporation’s Current Report on Form 8-K filed with the SEC on November 19, 2012, pursuant to the Exchange Act (file number 001-04762)). | |
| 10.43† | Revised Schedule 1s to outstanding Non-Qualified Stock Option Agreements (incorporated by reference to Exhibit 10.2 to ARAMARK Corporation’s Current Report on Form 8-K filed with the SEC on November 19, 2012, pursuant to the Exchange Act (file number 001-04762)). | |
| 10.44† | Amended and Restated ARAMARK 2001 Stock Unit Retirement Plan (incorporated by reference to Exhibit 10.22 to ARAMARK Corporation’s Annual Report on Form 10-K filed with the SEC on December 19, 2003, pursuant to the Exchange Act (file number 001-04762)). | |
| 10.45† | Amended and Restated ARAMARK Savings Incentive Retirement Plan (incorporated by reference to Exhibit 4.1 to ARAMARK Corporation’s Registration Statement on Form S-8 filed with the SEC on February 10, 2011, pursuant to the Securities Act (file number 001-333-172157)). | |
| 10.46† | Amendment to Amended and Restated Savings Incentive Retirement Plan (incorporated by reference to Exhibit 10.4 to ARAMARK Corporation’s Current Report on Form 8-K filed with the SEC on November 18, 2011, pursuant to the Exchange Act (file number 001-04762)). | |
| 10.47† | ARAMARK 2001 Deferred Compensation Plan (incorporated by reference to Exhibit 10.1 to ARAMARK Corporation’s Registration Statement on Form S-8 filed with the SEC on May 24, 2002, pursuant to the Securities Act (Registration No. 333-89120)). | |
| 10.48† | Amended and Restated 2005 Deferred Compensation Plan (incorporated by reference to Exhibit 10.3 to ARAMARK Corporation’s Quarterly Report on Form 10-Q filed with the SEC on August 8, 2007, pursuant to the Exchange Act (file number 001-04762)). | |
| 10.49† | Senior Executive Annual Performance Bonus Plan (incorporated by reference to Exhibit 10.1 to ARAMARK Corporation’s Current Report on Form 8-K filed with the SEC on November 18, 2011, pursuant to the Exchange Act (file number 001-04762)). | |
Table of Contents
| Exhibit |
Description | |
| 10.50† | Amended and Restated Executive Leadership Council Management Incentive Bonus Plan (2013) (incorporated by reference to Exhibit 10.5 to ARAMARK Corporation’s Current Report on Form 8-K filed with the SEC on November 19, 2012, pursuant to the Exchange Act (file number 001-04762)). | |
| 10.51† | ARAMARK Holdings Corporation Hardship Stock Repurchase Policy (incorporated by reference to Exhibit 10.35 to ARAMARK Corporation’s Annual Report on Form 10-K filed with the SEC on December 15, 2011, pursuant to the Exchange Act (file number 001-04762)). | |
| 10.52† | Limited Liquidity Program (incorporated by reference to Exhibit 10.36 to ARAMARK Corporation’s Annual Report on Form 10-K filed with the SEC on December 15, 2011, pursuant to the Exchange Act (file number 001-04762)). | |
| 10.53† | Amended Survivor Income Protection Plan (incorporated by reference to Exhibit 10.5 to ARAMARK Corporation’s Quarterly Report on Form 10-Q filed with the SEC on August 8, 2007, pursuant to the Exchange Act (file number 001-04762)). | |
| 10.54** | Form of Stockholders Agreement. | |
| 10.55** | Registration Rights and Coordination Committee Agreement, dated as of January 26, 2007, by and among ARAMARK Holdings Corporation and the stockholders named therein. | |
| 10.56 | U.S. Pledge and Security Agreement, dated as of January 26, 2007, among ARAMARK Intermediate Holdco Corporation, RMK Acquisition Corporation, ARAMARK Corporation, the Subsidiary Parties from time to time party thereto and Citibank, N.A., as collateral agent (incorporated by reference to Exhibit 10.2 to ARAMARK Corporation’s Current Report on Form 8-K filed with the SEC on February 1, 2007, pursuant to the Exchange Act (file number 001-04762)). | |
| 10.57 | Credit Agreement, dated as of January 26, 2007, as amended and restated as of March 26, 2010, by and among ARAMARK Corporation (as successor to RMK Acquisition Corporation, ARAMARK Canada Ltd., ARAMARK Investments Limited, ARAMARK Ireland Holdings Limited, ARAMARK Holdings GmbH & Co KG, ARAMARK GmbH, ARAMARK Intermediate Holdco Corporation, the Guarantors (as defined therein) party thereto, the Lenders (as defined therein), JPMorgan Chase Bank, N.A., as administrative agent, collateral agent and LC facility issuing bank and the other parties thereto from time to time (incorporated by reference to Exhibit 10.1 to ARAMARK Corporation’s Current Report on Form 8-K filed with the SEC on March 31, 2010, pursuant to the Exchange Act (file number 001-04762)). | |
| 10.58 | Amendment Agreement No. 1, dated as of April 18, 2011, to the Credit Agreement, dated as of January 26, 2007, as amended and restated as of March 26, 2010, by and among ARAMARK Corporation (as successor to RMK Acquisition Corporation), ARAMARK Canada Ltd., ARAMARK Investments Limited, ARAMARK Ireland Holdings Limited, ARAMARK Holdings GmbH & Co KG, ARAMARK GmbH, ARAMARK Intermediate Holdco Corporation, the Guarantors (as defined therein) party thereto, the Lenders (as defined therein), JPMorgan Chase Bank, N.A., as administrative agent, collateral agent and LC facility issuing bank and the other parties thereto from time to time (incorporated by reference to Exhibit 10.1 to ARAMARK Corporation’s Current Report on Form 8-K filed with the SEC on April 18, 2011, pursuant to the Exchange Act (file number 001-04762)). | |
| 10.59 | Amendment Agreement No. 2, dated as of February 29, 2012, to the Credit Agreement, dated as of January 26, 2007, as amended and restated as of March 26, 2010, by and among ARAMARK Corporation (as successor to RMK Acquisition Corporation), ARAMARK Canada Ltd., ARAMARK Investments Limited, ARAMARK Ireland Holdings Limited, ARAMARK Holdings GmbH & Co KG, ARAMARK GmbH, ARAMARK Intermediate Holdco Corporation, the Guarantors (as defined therein) party thereto, the Lenders (as defined therein), JPMorgan Chase Bank, N.A., as administrative agent, collateral agent and LC facility issuing bank and the other parties thereto from time to time (incorporated by reference to Exhibit 10.1 to ARAMARK Corporation’s Current Report on Form 8-K filed with the SEC on March 1, 2012, pursuant to the Exchange Act (file number 001-04672). | |
Table of Contents
| Exhibit |
Description | |
| 10.60 | Amendment Agreement No. 3, dated as of December 20, 2012, to the Credit Agreement, dated as of January 26, 2007, as amended and restated as of March 26, 2010, as amended by Amendment Agreement No. 1 dated as of April 18, 2011 and as amended by Amendment Agreement No. 2 dated as of February 29, 2012, by and among ARAMARK Corporation (as successor to RMK Acquisition Corporation), ARAMARK Canada Ltd., ARAMARK Investments Limited, ARAMARK Ireland Holdings Limited, ARAMARK Holdings GmbH & Co KG, ARAMARK GmbH, ARAMARK Intermediate Holdco Corporation, the Guarantors (as defined therein) party thereto, the Lenders (as defined therein), JPMorgan Chase Bank, N.A., as administrative agent, collateral agent and LC facility issuing bank and the other parties thereto from time to time (incorporated by reference to Exhibit 10.57 to the Company’s Annual Report on Form 10-K filed with the SEC on December 20, 2012, pursuant to the Exchange Act (file number 001-04762)). | |
| 10.61 | Amendment Agreement No. 4, dated as of February 22, 2013, to the Credit Agreement, dated as of January 26, 2007, as amended and restated as of March 26, 2010, as amended by Amendment Agreement No. 1 dated as of April 18, 2011, as amended by Amendment Agreement No. 2 dated as of February 29, 2012 and as amended by Amendment Agreement No. 3 dated as of December 20, 2012 by and among ARAMARK Corporation (as successor to RMK Acquisition Corporation), ARAMARK Canada Ltd., ARAMARK Investments Limited, ARAMARK Ireland Holdings Limited, ARAMARK Holdings GmbH & Co KG, ARAMARK GmbH, ARAMARK Intermediate Holdco Corporation, the Guarantors (as defined therein) party thereto, the Lenders (as defined therein), JPMorgan Chase Bank, N.A., as administrative agent, collateral agent and LC facility issuing bank and the other parties thereto from time to time (incorporated by reference to Exhibit 10.1 to ARAMARK Corporation’s Current Report on Form 8-K filed with the SEC on February 28, 2013, pursuant to the Exchange Act (file number 001-04762)). | |
| 10.62 | Amendment Agreement No. 5, dated as of March 22, 2013, to the Credit Agreement, dated as of January 26, 2007, as amended and restated as of March 26, 2010, as amended by Amendment Agreement No. 1 dated as of April 18, 2011, as amended by Amendment Agreement No. 2 dated as of February 29, 2012, as amended by Amendment Agreement No. 3 dated as of April 20, 2012 and as amended by Amendment Agreement No. 4 dated as of February 22, 2013 by and among ARAMARK Corporation (as successor to RMK Acquisition Corporation), ARAMARK Canada Ltd., ARAMARK Investments Limited, ARAMARK Ireland Holdings Limited, ARAMARK Holdings GmbH & Co KG, ARAMARK GmbH, ARAMARK Intermediate Holdco Corporation, the Guarantors (as defined therein) party thereto, the Lenders (as defined therein), JPMorgan Chase Bank, N.A., as administrative agent, collateral agent and LC facility issuing bank and the other parties thereto from time to time (incorporated by reference to Exhibit 10.1 to ARAMARK Corporation’s Current Report on Form 8-K filed with the SEC on March 28, 2013, pursuant to the Exchange Act (file number 001-04762)). | |
| 10.63 | Assumption Agreement, dated as of March 30, 2007, relating to the Credit Agreement dated as of January 26, 2007 among ARAMARK Corporation, the other Borrowers and Loan Guarantors party thereto, the Lenders party thereto, Citibank, N.A., as administrative agent and collateral agent for the Lenders, and the other parties thereto from time to time (incorporated by reference to Exhibit 99.2 to ARAMARK Corporation’s Current Report on Form 8-K filed with the SEC on April 5, 2007, pursuant to the Exchange Act (file number 001-04762)). | |
| 10.64 | Amended and Restated Master Distribution Agreement effective as of March 5, 2011 between SYSCO Corporation and ARAMARK Food and Support Services Group, Inc. (incorporated by reference to Exhibit 10.1 to ARAMARK Corporation’s Quarterly Report on Form 10-Q filed with the SEC on May 12, 2011, pursuant to the Exchange Act (file number 001-04762)) (Portions omitted pursuant to a request for confidential treatment). | |
| 10.65 | Share Purchase Agreement among Veris plc, ARAMARK Ireland Holdings Limited, ARAMARK Investments Limited and ARAMARK Corporation dated October 2009 (incorporated by reference to Exhibit 10.1 to ARAMARK Corporation’s Current Report on Form 8-K filed with the SEC on November 4, 2009, pursuant to the Exchange Act (file number 001-04762)). | |
Table of Contents
| Exhibit |
Description | |
| 10.66 | Agreement and Plan of Merger by and among MPBP Holdings, Inc., ARAMARK Clinical Technology Services, LLC, RMK Titan Acquisition Corporation, ARAMARK Corporation and the stockholders of MPBP Holdings, Inc. party thereto dated March 18, 2011 (incorporated by reference to Exhibit 10.1 to ARAMARK Corporation’s Current Report on Form 8-K filed with the SEC on March 24, 2011, pursuant to the Exchange Act (file number 001-04762)). | |
| 10.67* | ARAMARK 2005 Deferred Compensation Plan for Directors. | |
| 21.1* | List of subsidiaries of ARAMARK Holdings Corporation. | |
| 23.1* | Consent of Independent Registered Public Accounting Firm—KPMG LLP. | |
| 23.2* | Consent of Independent Auditors—Deloitte Touche Tohmatsu LLC. | |
| 23.3 | Consent of Simpson Thacher & Bartlett LLP (included in exhibit 5.1) | |
| 24.1* | Power of Attorney (included on the signature page hereto). | |
| * | Filed herewith. |
| ** | To be filed by amendment. |
| † | Identifies exhibits that consist of a management contract or compensatory plan or arrangement. |