Attached files
| file | filename |
|---|---|
| 8-K - FORM 8-K - NAVISTAR INTERNATIONAL CORP | d592311d8k.htm |
| EX-99.1 - PRESS RELEASE - NAVISTAR INTERNATIONAL CORP | d592311dex991.htm |
 NYSE:
NAV 3
RD
QUARTER
2013
EARNINGS
PRESENTATION
September 4, 2013
Exhibit 99.2 |
 2
NYSE: NAV
Q3 2013 Earnings –
09/04/2013
Safe Harbor
Statement
Information provided and statements contained in this report that are not purely
historical are forward-looking
statements
within
the
meaning
of
Section
27A
of
the
Securities
Act
of
1933,
as amended, Section
21E of the Securities Exchange Act of 1934, as amended, and the
Private Securities Litigation Reform Act of 1995. Such forward-looking
statements only speak as of the date of this report and the Company assumes
no obligation to update the information included in this report. Such
forward-looking statements include information concerning
our
possible
or
assumed
future
results
of
operations,
including descriptions of our
business
strategy.
These
statements
often
include
words
such
as
“believe,”
“expect,”
“anticipate,”
“intend,”
“plan,”
“estimate,”
or similar expressions. These statements are not
guarantees of performance or results and they involve risks, uncertainties, and
assumptions. For
a
further
description
of
these
factors,
see
the
risk
factors
set forth in our filings with the
Securities and Exchange Commission, including our annual report on Form 10-K
for the fiscal year ended October 31, 2012.
Although we believe that these forward-looking statements are
based on reasonable assumptions, there are many factors that could affect our
actual financial results or results of operations and could cause actual
results to differ materially from those in the forward-looking
statements. All future written and oral forward-looking statements
by
us
or
persons
acting
on
our
behalf
are
expressly
qualified
in
their
entirety
by
the
cautionary
statements contained or referred to above. Except for our ongoing obligations to
disclose material
information
as
required
by
the
federal
securities
laws,
we do not have any obligations
or intention to release publicly any revisions to any forward-looking
statements to reflect events or circumstances in the future or to reflect
the occurrence of unanticipated events. |
 3
NYSE: NAV
Q3 2013 Earnings –
09/04/2013
Other Cautionary Notes
The financial information herein contains audited and unaudited information and
has been prepared by management in good faith and based on data currently
available to the Company.
Certain non-GAAP measures are used in this presentation to assist the
reader in
understanding our core manufacturing business.
We believe this information is
useful
and
relevant
to
assess
and
measure
the
performance
of
our
core
manufacturing business as it illustrates manufacturing performance without regard
to selected historical legacy costs (i.e. pension and other postretirement
costs). It also excludes financial services and other items that may not
be related to the
core manufacturing business or underlying results. Management often uses this
information to assess and measure the underlying performance of our
operating segments.
We have chosen to provide this supplemental information to investors,
analysts,
and
other
interested
parties
to
enable
them
to
perform
additional
analyses of operating results. The non-GAAP numbers are reconciled to the most
appropriate GAAP number in the appendix of this presentation.
|
 NYSE:
NAV Troy Clarke, President & CEO
3
RD
QUARTER
2013
RESULTS |
 5
NYSE: NAV
Q3 2013 Earnings –
09/04/2013
•
2013 Strategic Objectives
•
Q3 2013 Financials
•
Drive to Deliver Update
•
Summary
•
Q&A
3
RD
Quarter
Actions |
 6
NYSE: NAV
Q3 2013 Earnings –
09/04/2013
Introduction
Walter G. Borst
Executive Vice President & Chief Financial Officer
|
 7
NYSE: NAV
Guiding
Principles Near-Term Priorities
•
Quality
•
Cost
•
Sense of Urgency
•
Great Products
•
Customer Satisfaction
•
People
2013
2013
Drive to Deliver
Drive to Deliver
Deliver Our
Deliver Our
2013 Plans
2013 Plans
Hit Our
Hit Our
Launches
Launches
Improve
Improve
Quality
Quality
Sales
Sales
Momentum
Momentum
7
Q3 2013 Earnings –
09/04/2013 |
 8
NYSE: NAV
Q3 2013 Earnings –
09/04/2013
•
EBITDA
•
One-time Costs
•
Global Challenges
•
North America Volumes
•
Positive Cash Performance
•
Structural Cost Savings
•
Increase in Class 8 Order Share
•
Introduction of Cummins ISB 6.7L
•
Non-core Assets Actions
3
RD
Quarter
Summary |
 9
NYSE: NAV
Q3 2013 Earnings –
09/04/2013
Drive to Deliver
Making progress in our turnaround:
Goal
2015 End of year
run rate of
8-10% EBITDA
2012
QUARTERS 1-2 / 2013
QUARTERS 3-4 / 2013
8/27:
Conducted VSP and
RIF to improve cost structure
9/6:
Launched ROIC-focused
strategy
10/23:
Finalized contract
with Cummins
10/26:
Restructured in Brazil
10/30:
Announced closer of
Garland facility
10/31:
Completed equity
offering
10/31:
Ended year with $1.5B
manufacturing cash
11/15:
Launched ProStar
with ISX, ahead of schedule
12/18:
Announced
intent
to
sell stake in Mahindra J.V.
1/6:
Initiated best-in-class
benchmarking initiative
2/12:
Completed
sale
of
equity interests
2/19:
Subleased
Alabama
facility
3/4:
Sold
Workhorse
Custom
Chassis
3/7:
Named
Troy
Clarke
President and CEO
4/11:
Launched
9900i,
PayStar 5900 with Cummins
ISX15L
4/16:
Named
Jack
Allen
COO
4/16:
Achieved
EPA
certification on 13L with SCR
4/29:
Launched
ProStar
with 13L with SCR
5/16:
Announced
the
sale
of Navistar RV
5/20:
Named
Bill
Kozek
President, NA Truck and
Parts
5/28:
Launched
TerraStar
4x4
5/30:
Named Bill Osborne
SVP, Global Quality
6/20:
Announced idling of
West Point facility
6/24:
Named
Walter
Borst
EVP and CFO
7/16:
Launched WorkStar
with 13L with SCR
7/31:
Ended Q3 with $1.087B
manufacturing cash
8/8:
Launched TranStar
with 13L with SCR
8/12:
Navistar and Cummins
reach 10,000 orders
8/28:
Conducted RIF to
improve cost structure
9/3:
Announced expanded
product offering with
Cummins ISB
2014 ACTIONS |
 Walter G. Borst, Executive Vice President & CFO
3
RD
QUARTER
2013
RESULTS
NYSE: NAV |
 11
NYSE: NAV
Q3 2013 Earnings –
09/04/2013
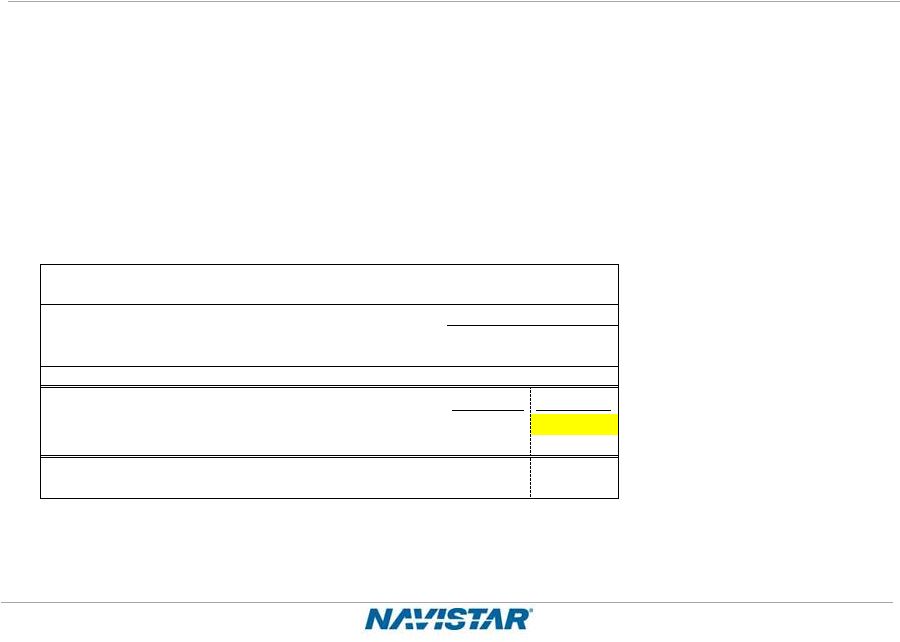
Q3 2013 Year Over Year Results
* Attributable to Navistar International Corporation
Q3 2013
Q3 2012
Change
Revenue (Millions)
$2,861
$3,246
$(385)
Manufacturing Segment Profit
(Loss) (Millions)
$(68)
$0
$(68)
EBITDA
(1)
(Millions)
$(74)
$17
$(91)
Profit (Loss) from Continuing
Operations* (Millions)
$(237)
$80
$(317)
Diluted Profit (Loss) Per Share
from
Continuing
Operations*
(2)
$(2.94)
$1.16
$(4.10)
Notes:
(1)
EBITDA: Excludes $(10) million from discontinued operations.
(2)
Diluted (Loss) Per Share from discontinued operations were $(0.12) in Q3 2013 and
$0.06 in Q3 2012, Average shares outstanding were 80.6 million in Q3
2013 compared to 68.9 million in Q3 2012. Note:
This slide contains non-GAAP information; please see the REG G in
appendix for a detailed reconciliation. |
 12
NYSE: NAV
Q3 2013 Earnings –
09/04/2013
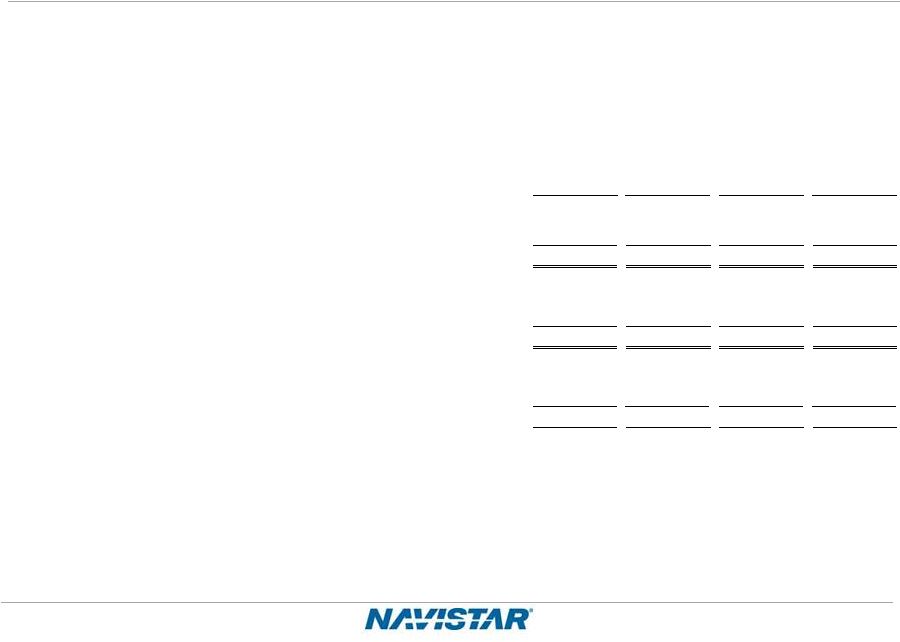
Profit (Loss) from Continuing Operations
Q3 2012 to Q3 2013
$ in millions
80
(237)
(84)
(35)
(248)
50
($300)
($200)
($100)
$0
$100
$200
2012Q3 Actual
Structural Cost
Industry, Volume & Mix
Warranty
Taxes, Interest & Other
2013Q3 Actual |
 13
NYSE: NAV
Q3 2013 Earnings –
09/04/2013
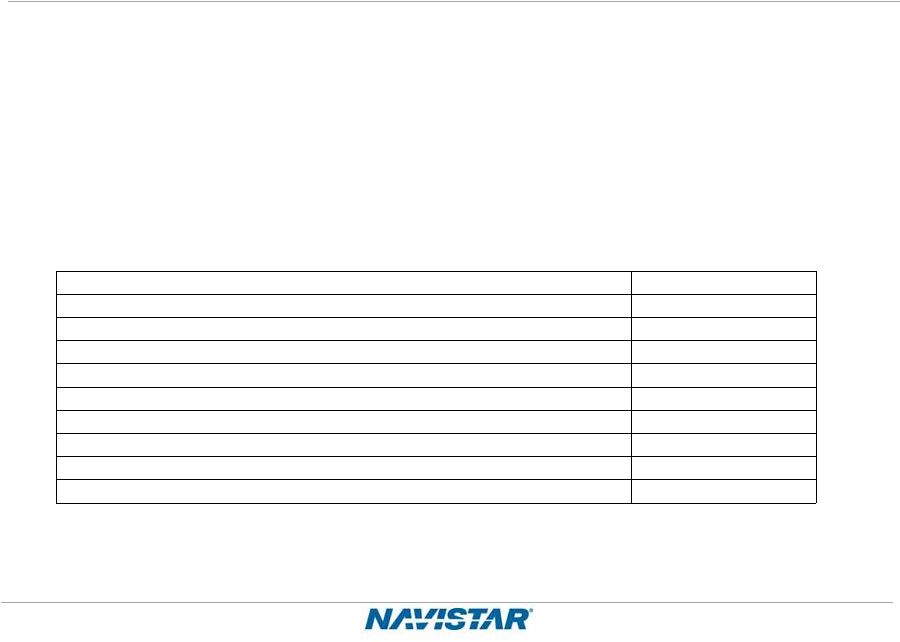
Q3 2013 Manufacturing Cash Update
$ in millions
*Cash balance includes marketable securities.
**As shown on 6/10/2013
Note:
This slide contains non-GAAP information; please see the REG G in
appendix for a detailed reconciliation.
Guidance**
Actual
Q2 2013 Manufacturing Cash Balance*
$1,164
$1,164
Consolidated EBITDA
0 - 50
(74)
Capex / Cash Interest / Pension & OPEB Funding
(190)
(148)
Change in Net Working Capital
46 - 96
147
Debt Payments / Other
(20)
(2)
Q3 2013 Manufacturing Cash Balance*
$1,000 - $1,100
$1,087 |
 14
NYSE: NAV
Q3 2013 Earnings –
09/04/2013
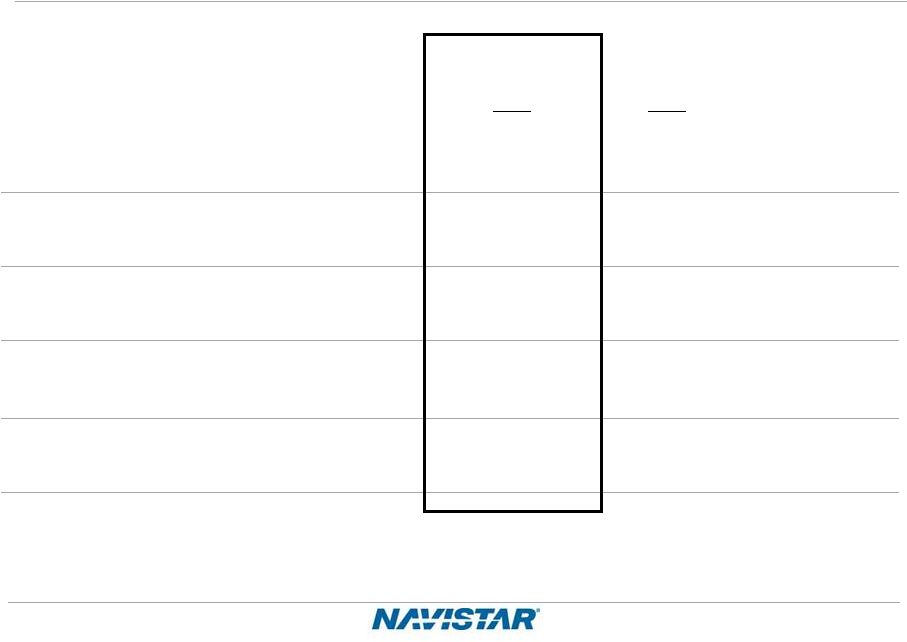
Guidance: Q4 2013 Manufacturing Cash
$ in millions
* Cash balance includes marketable securities.
Note:
This slide contains non-GAAP information; please see the REG G in
appendix for a detailed reconciliation.
Guidance
Q3 2013 Manufacturing Cash Balance*
$1,087
Consolidated EBITDA
0 - 50
Capex / Cash Interest / Pension & OPEB Funding
(173)
Change in Net Working Capital
72 - 122
Debt Payments / Other
14
Q4 2013 Manufacturing Cash Balance*
$1,000 - $1,100 |
 15
NYSE: NAV
Q3 2013 Earnings –
09/04/2013
•
Pleased with 3
rd
Quarter Cash Balance
•
Recapture Recent Market Share Losses
•
Right Size Cost Structure
•
Deliver on Future Profitability Targets
Summary |
 NYSE:
NAV Jack Allen, COO
DRIVE TO DELIVER |
 17
NYSE: NAV
Q3 2013 Earnings –
09/04/2013
Guiding
Principles Near-Term Priorities
•
Quality
•
Cost
•
Sense of Urgency
•
Great Products
•
Customer Satisfaction
•
People
2013
2013
Drive to Deliver
Drive to Deliver
Hit Our
Launches
Improve
Quality
Deliver Our
2013 Plans
Sales
Momentum |
 18
NYSE: NAV
Q3 2013 Earnings –
09/04/2013
Investing in Quality –
Actions Demonstrate Customer Commitment
•
Field campaigns ahead of
schedule
•
Uptime has significantly
improved
•
Positive quality trend continues
with new products |
 19
NYSE: NAV
Q3 2013 Earnings –
09/04/2013
Class 6 –
8 Industry Trends
•
Mixed signals in fundamental economic
drivers
•
Class 8 Q3 industry volumes 8% lower
than prior quarter
•
FY 2013 Class 8 industry volume
205,000 –
215,000
•
FY 2014 Class 8 industry volume grows to
220,000 –
230,000 |
 20
NYSE: NAV
Q3 2013 Earnings –
09/04/2013
15L ISX
•
•
•
13L SCR
•
•
Sales Momentum at Navistar
Majority of model and
configuration rollout complete
10,000+ orders received since
December 1
st
, 2012
Positive performance leads to
repeat orders
3,000,000+ test miles logged
4,500+ orders received since
March 1
st
, 2013 |
 21
NYSE: NAV
Q3 2013 Earnings –
09/04/2013
Market share
Class 8
•
•
Medium Duty
•
Q3 order share 20%, Q3 retail
share 14%
Retail share to improve
Q3 order share 16%, Q3 retail
share 24%
•
Announcement yesterday intended
to reverse this trend |
 22
NYSE: NAV
Q3 2013 Earnings –
09/04/2013
Medium Truck & Bus with Cummins ISB 6.7L
Cummins ISB 6.7L
•
•
•
•
Navistar Proprietary Engines
•
•
Cummins ISB order book open NOW!
Speed to market
Market-proven engine technology
Navistar experience with ISB
Initial production September, shipments
in December 2013
Revised transition plan for mid-range engines
Continue to offer EGR versions of mid-range engines
|
 23
NYSE: NAV
Q3 2013 Earnings –
09/04/2013
•
Structural cost:
•
$236 million in savings to date
•
Additional $50 to $60 million savings initiated for FY 2014
•
North America Parts: Increased profit margins
•
Material cost: Ahead of plan
•
Manufacturing: Closed Garland
•
Defense: Impact of sequestration
•
Global: Social situation in Brazil, foreign exchange, Colombia
Drive to Deliver Progress |
 24
NYSE: NAV
Q3 2013 Earnings –
09/04/2013
•
Encouraged by Market Reception of Class 8 Products
•
Expect Medium-Duty Offerings to Follow Suit
•
Progressing Toward Profitability
•
Building Momentum for 2014
•
8-10% EBITDA Run Rate Goal by End of 2015
Summary |
 NYSE:
NAV Troy Clarke, President & CEO
SUMMARY |
 26
NYSE: NAV
Q3 2013 Earnings –
09/04/2013
•
2014 Areas of Improvement
•
Fixed Cost Savings
•
Structural Cost Savings
•
Manufacturing Optimization
•
Variable Cost Savings
•
Material Cost
•
Design Cost Reductions
Summary
•
8-10% EBITDA run rate goal by end of 2015
•
Improve Market Share |
 NYSE:
NAV APPENDIX |
 28
NYSE: NAV
Q3 2013 Earnings –
09/04/2013
A Leader in Several Commercial Vehicle Segments
Note: Based on market share position determined by brand
Market Share
Q3 FY2013: ~24%
Market Share
Q3 FY2013: ~18%
Market Share
Q3 FY2013: ~12%
U.S. and Canada Class 6-8: |
 29
NYSE: NAV
Q3 2013 Earnings –
09/04/2013
Navistar Financial Corporation
Highlights
•
Q3 2013: $23 million Financial Services Segment Profit
•
Total U.S. financing availability of $768 million as of July 31,
2013 (includes
bank facility availability of $388 million)
•
Debt/Equity Leverage: 2.5 to 1
Retail Notes
Bank Facility
•
$840 million facility ($500
million revolver and $340
million term loan matures in
December 2016)
–
Funding for retail notes,
wholesale notes, retail
accounts, and dealer open
accounts
•
On balance sheet
•
NFSC wholesale trust as of
July 2013
–
$924 million funding facility
–
Variable portion matures
March 2014
–
Term portions mature October
2013 and January 2015
•
On balance sheet
•
Broader product offering
•
Enhanced ability to support
large fleets
•
Better access to less
expensive capital
Dealer Floor Plan |
 30
NYSE: NAV
Q3 2013 Earnings –
09/04/2013
Market Share
We
define
our
“traditional”
markets
to
include
U.S.
and
Canada
and
Class
6
through
8
medium
and
heavy
truck.
We
classify
militarized
commercial
vehicles
sold
to
the
U.S.
and
Canadian
militaries
as
Class
8
severe
service
within
our
“traditional”
markets.
Our
“traditional”
markets
include
CAT-branded
units
sold
to
Caterpillar
under
our
North
America
supply
agreement.
Traditional Market Share
Q1
Q2
Q3
Q4
Full Year
Q1
Q2
Q3
Q4
Full Year
Q1
Q2
Q3
Class 6 and 7 medium trucks
36%
36%
46%
44%
41%
27%
36%
36%
34%
33%
25%
26%
24%
Class 8 heavy trucks
17%
16%
17%
18%
17%
17%
15%
15%
13%
15%
11%
12%
12%
Class 8 severe service trucks
33%
32%
36%
37%
35%
31%
30%
30%
30%
30%
26%
22%
18%
Combined Class 8
21%
19%
21%
22%
21%
19%
18%
18%
17%
18%
14%
15%
14%
Market Share –
U.S. & Canada School Bus and Class 6-8
2011
2012
2013 |
 31
NYSE: NAV
Q3 2013 Earnings –
09/04/2013
Worldwide Truck Chargeouts
We define our “traditional”
markets
to include U.S. and Canada School
bus and Class 6 through 8 medium
and heavy truck. We classify
militarized commercial vehicles
sold to the U.S. and Canadian
militaries as Class 8 severe service
within our “traditional”
markets. Our
“traditional”
markets include CAT-
branded units sold to Caterpillar
under our North America supply
agreement.
FISCAL YEAR 2011
Q1
Q2
Q3
Q4
FULL YEAR
BUS
2,100
2,000
2,200
2,900
9,200
MEDIUM
4,600
7,200
7,400
7,900
27,100
HEAVY
4,700
5,200
6,800
9,000
25,700
SEVERE
2,700
3,200
3,700
3,700
13,300
TOTAL
14,100
17,600
20,100
23,500
75,300
NON-TRADITIONAL MILITARY
100
400
200
700
1,400
EXPANSIONARY
4,900
6,900
8,000
9,500
29,300
WORLDWIDE TRUCK-Continued Ops
19,100
24,900
28,300
33,700
106,000
DISCONTINUED OPERATIONS
400
700
600
700
2,400
WORLDWIDE TRUCK-Total
19,500
25,600
28,900
34,400
108,400
FISCAL YEAR 2012
Q1
Q2
Q3
Q4
FULL YEAR
BUS
1,700
2,600
2,900
2,500
9,700
MEDIUM
4,300
7,100
5,800
4,700
21,900
HEAVY
8,000
7,200
6,300
5,600
27,100
SEVERE
3,300
3,600
3,600
3,100
13,600
TOTAL
17,300
20,500
18,600
15,900
72,300
NON-TRADITIONAL MILITARY
200
400
500
500
1,600
EXPANSIONARY
7,100
7,300
7,600
7,400
29,400
WORLDWIDE TRUCK-Continued Ops
24,600
28,200
26,700
23,800
103,300
DISCONTINUED OPERATIONS
200
200
400
900
1,700
WORLDWIDE TRUCK-Total
24,800
28,400
27,100
24,700
105,000
FISCAL YEAR 2013
Q1
Q2
Q3
Q4
FULL YEAR
BUS
2,000
2,500
2,600
-
7,100
MEDIUM
4,100
4,500
3,400
-
12,000
HEAVY
4,500
4,500
5,900
-
14,900
SEVERE
2,400
2,100
2,800
-
7,300
TOTAL
13,000
13,600
14,700
-
41,300
NON-TRADITIONAL MILITARY
300
300
100
-
700
EXPANSIONARY
6,600
5,900
8,000
-
20,500
WORLDWIDE TRUCK-Continued Ops
19,900
19,800
22,800
-
62,500
DISCONTINUED OPERATIONS
200
200
-
-
400
WORLDWIDE TRUCK-Total
20,100
20,000
22,800
0
62,900 |
 32
NYSE: NAV
Q3 2013 Earnings –
09/04/2013
Worldwide Engine Shipments
Navistar
Q1
Q2
Q3
Q4
Full Year
OEM sales - South America
27,200
37,100
38,200
36,100
138,600
Other OEM sales
4,500
4,400
3,700
3,600
16,200
Intercompany sales
17,300
23,500
22,300
25,700
88,800
Total Shipments
49,000
65,000
64,200
65,400
243,600
Navistar
Q1
Q2
Q3
Q4
Full Year
OEM sales - South America
24,100
25,300
28,600
28,700
106,700
Other OEM sales
2,200
2,000
3,000
2,900
10,100
Intercompany sales
21,600
23,400
20,600
17,500
83,100
Total Shipments
47,900
50,700
52,200
49,100
199,900
Navistar
Q1
Q2
Q3
Q4
Full Year
OEM sales - South America
25,600
30,800
31,000
-
87,400
Other OEM sales
1,900
2,300
2,600
-
6,800
Intercompany sales
16,500
15,100
14,900
-
46,500
Total Shipments
44,000
48,200
48,500
-
140,700
2013
2011
2012 |
 33
NYSE: NAV
Q3 2013 Earnings –
09/04/2013
Order Receipts –
U.S. & Canada
We define our “traditional”
markets to include U.S. and Canada School bus and Class 6 through 8 medium and
heavy truck. We classify militarized commercial
vehicles
sold
to
the
U.S.
and
Canadian
militaries
as
Class
8
severe
service
within
our
“traditional”
markets. Our
“traditional”
markets include
CAT-branded
units
sold
to
Caterpillar
under
our
North
America
supply agreement.
(in units)
2013
2012
Change
2013
2012
Change
School buses
(A)
2,400
2,500
(100)
(4)%
7,000
7,800
(800)
(10)%
Class 6 and 7 medium trucks
2,500
4,000
(1,500)
(38)%
9,600
15,700
(6,100)
(39)%
Class 8 heavy trucks
7,700
5,000
2,700
54%
17,900
18,700
(800)
(4)%
Class 8 severe service trucks
(B)
2,600
3,100
(500)
(16)%
7,000
10,100
(3,100)
(31)%
Total "traditional" markets
15,200
14,600
600
4%
41,500
52,300
(10,800)
(21)%
Combined class 8 trucks
10,300
8,100
2,200
27%
24,900
28,800
(3,900)
(14)%
(A) U.S. and Canada School buses include buses classified as B, C and
D. (B) Truck
segment
net
orders
include
CAT-branded
units
sold
to
Caterpillar
under
our
North
America
supply
agreement.
Order Receipts: U.S. & Canada (Units)
"Traditional" Markets (U.S. and Canada)
%
Change
Three Months
Ended July 31,
%
Change
Nine Months
Ended July 31, |
 34
NYSE: NAV
Q3 2013 Earnings –
09/04/2013
U.S. and Canada Dealer Stock Inventory*
*Includes U.S. and Canada Class 4-8 and school bus inventory, but does not
include U.S. IC Bus or Workhorse Custom Chassis inventory. -
2,000
4,000
6,000
8,000
10,000
12,000
Excludes the
US portion of IC Bus |
 35
NYSE: NAV
Q3 2013 Earnings –
09/04/2013
Frequently Asked Questions
Q1:
What is included in Corporate and Eliminations?
A:
The primary drivers of Corporate and Eliminations are Corporate SG&A, pension
and OPEB expense (excluding amounts allocated to the segments), annual
incentive, manufacturing interest expense, and the elimination of intercompany sales and profit between
segments.
Q2:
What is included in your equity in loss of non-consolidated affiliates?
A:
Equity in loss of non-consolidated affiliates is derived from our ownership
interests in partially-owned affiliates that are not consolidated.
Q3:
What is your net income attributable to non-controlling interests?
A:
Net income attributable to non-controlling interests is the result of the
consolidation of subsidiaries in which we do not own 100%, and is primarily
comprised of Ford's non-controlling interest in our Blue Diamond Parts joint venture.
Q4:
What are your expected 2013 and beyond pension funding requirements?
A:
Future contributions are dependent upon a number of factors, principally the changes in values of plan
assets, changes in interest rates and the impact of any funding relief currently under
consideration. In 2013, we expect to contribute $166 million to meet the minimum required
contributions for all plans. We currently expect that from 2014 through 2016, the Company will
be required to contribute at least $200 million per year in to the Plans, depending on asset
performance and discount rates. This is lower than our previously reported expectations due to
the impact of the Moving Ahead for Progress in the 21st Century Act which was enacted in July
2012. |
 36
NYSE: NAV
Q3 2013 Earnings –
09/04/2013
Frequently Asked Questions
Q5:
What is your expectation for future cash tax payments?
A:
Q6:
What is the current balance of net operating losses as compared to other deferred tax
assets? A:
Q7:
How does your FY 2013 Class 8 industry outlook compare to ACT Research?
A:
Our cash tax payments will remain low in 2013 and will gradually increase as we utilize available net
operating losses (NOLs) and tax credits in the future years.
As of October 31, 2012 the Company has deferred tax assets for U.S. federal NOLs valued
at $318 million, state NOLs valued at $95 million, and foreign NOLs valued at $155 million, for
a total undiscounted cash value of $568 million. In addition to NOLs, the Company has
deferred tax assets for accumulated tax credits of $218 million and other deferred tax assets of $2.1 billion resulting in
net deferred tax assets before valuation allowances of approximately $2.9 billion. Of this amount,
$2.7 billion is subject to a valuation allowance at the end of
FY2012. Reconciliation to ACT:
ACT*
CY to FY adjustment
Total (ACT comparable Class 8 to Navistar)
Original Fcst
Revised Fcst
Navistar Industry Retail Deliveries Combined Class 8 Trucks
215,000
205,000
Navistar difference from ACT
5,800
15,800
2.7%
7.7%
*Source: ACT N.A. Commercial Vehicle Outlook - August 2013
U.S. and Canadian Class 8 Truck Sales
2013
227,800
(7,000)
220,800 |
 37
NYSE: NAV
Q3 2013 Earnings –
09/04/2013
Frequently Asked Questions
Q8:
What is your manufacturing interest expense for Fiscal Year 2013?
A:
Interest expense is forecasted at $251 million.
Q9:
What should we assume for capital expenditures in Fiscal Year 2013?
A:
We plan to come in around $175 million, which is lower than our traditionally
guided capital spending range of $200 million to $300 million for products
and development. Capital spending related to Engineering Integration is
funded through the RZFBs and is not included in that range.
Q10:
For the manufacturing debt currently outstanding in your most recent financial
statement filings, what are the respective maturity dates and principal
amounts outstanding? A:
The amounts and maturity dates are as follows (the values shown below are the
amounts due and exclude the accounting impact of any OID or
bifurcation): Senior Secured Term Loan Credit Facility, due August 17,
2017 $698 million
8.25% Senior Notes due November 1, 2021
$1,200 million
3.0% Senior Subordinated Convertible Notes due October 15, 2014
$570 million
Debt of majority owned dealerships (various maturity dates)
$54 million
Financing arrangements and capital lease obligations (various maturity dates)
$82 million
Loan Agreement related to the 6.5% Tax Exempt Bonds due October 15, 2040
$225 million
Promissory Note due September 30, 2015
$23 million
Financed Lease Obligations
$213 million
Other (various maturity dates)
$33 million
Total
$3,098 million |
 38
NYSE: NAV
Q3 2013 Earnings –
09/04/2013
Frequently Asked Questions
Q11:
You disclosed in your Q2 2013 10Q that included in your results of operations for the
three and six months ended April 30, 2013 out-of-period adjustments,
which represent corrections of prior-period errors related to the accounting for certain
sales transactions financed by GE. What was the impact on your current results and
how will these types of transactions impact future results?
A:
Our operating agreement with GE, our preferred source of retail customer financing
for equipment offered by us and our dealers in the
U.S.,
includes
a
loss
sharing
arrangement
for
certain
credit
losses. The determination was made that certain sales that were
ultimately
financed
by
GE
as
leases,
did
not
qualify
for
revenue
recognition and should have been accounted for as borrowings as
we retained substantial risks of ownership in the leased property. The proceeds
from the initial transfer should have been recorded as an obligation and
amortized to revenue over the term of the financing. In addition, the financed equipment should have been
transferred from inventory to equipment leased to others and depreciated over the
term of the financing. Our financial exposure remains the same regardless of
GE financing as a lease or as a note. That is, we have no additional residual exposure as a result
of these transactions.
Correcting the errors in the second quarter of 2013, which were not material to any
of the prior periods, resulted in an $8 million increase to Net loss in our
Consolidated Statements of Operations for periods prior to fiscal 2013. The adjustments included $37
million of depreciation and $8 million of interest expense related to periods prior
to fiscal 2013. In the future we will have increased depreciation and
interest expense as a result of these transactions and any future transactions that are accounted for similarly. |
 39
NYSE: NAV
Q3 2013 Earnings –
09/04/2013
Q3 2013 Segment Profit
Q3 2013
GAAP
Q3 2012
GAAP
Change
Truck
$(58)
$(26)
$(32)
Engine
$(86)
$(47)
$(39)
Parts
$76
$73
$3
Financial
Services
(1)
$23
$22
$1
Segment Profit (Loss)
$(45)
$22
$(67)
Note:
This slide contains non-GAAP information; please see the REG G in
appendix for a detailed reconciliation.
$ in millions
Notes:
(1)
Total sales and revenues in the Financial Services segment include interest
revenues of $47 million for the three months ended July 31, 2013, and $53
million for the three months ended July 31, 2012. |
 40
NYSE: NAV
Q3 2013 Earnings –
09/04/2013
The
debt
balances
listed
above
include
accounting
impacts
of
any
OID and bifurcation.
Outstanding Debt Balances
(in millions)
July 31, 2013
October 31, 2012
Manufacturing operations:
Senior Secured Term Loan Credit Facility, as Amended, due 2017, net of unamortized
discount of $5 and $9, respectively
693
$
991
8.25%
Senior
Notes,
due
2021,
net
of
unamortized
discount
of
$23
and $28,
respectively
1,177
872
3.0% Senior Subordinated Convertible Notes, due 2014, net of unamortized discount
of $32 and $50, respectively
538
520
Debt of majority-owned dealerships
54
60
Financing arrangements and capital lease obligations
82
140
Loan Agreement related to 6.5% Tax Exempt Bonds, due 2040
225
225
Promissory Note
23
30
Asset-Based Credit Facility
—
—
Financed lease obligations
213
—
Other
33
67
Total Manufacturing operations debt
3,038
2,905
Less: Current portion
116
172
Net long-term Manufacturing operations debt
2,922
$
2,733
Financial Services operations:
July 31, 2013
October 31, 2012
Asset-backed debt issued by consolidated SPEs, at fixed and variable rates, due
serially through 2019
791
$
994
Bank
revolvers,
at
fixed
and
variable
rates,
due
dates
from
2013
through 2019
837
763
Commercial paper, at variable rates, matured in 2013
—
31
Borrowings secured by operating and finance leases, at various rates, due serially
through 2017
58
78
Total Financial Services operations debt
1,686
1,866
Less: Current portion
704
1,033
Net long-term Financial Services operations debt
982
$
833
$
$
$
$
|
 41
NYSE: NAV
Q3 2013 Earnings –
09/04/2013
Manufacturing Cash Flow
Beginning Mfg. Cash
1
Balance
Fiscal 2010
Fiscal 2011
Fiscal 2012
Q1 2013
Q2 2013
Q3 2013
October 31, 2009
1,152
$
October 31, 2010
1,100
$
October 31, 2011
1,186
$
October 31, 2012
1,505
$
January 31, 2013
1,189
$
April 30, 2013
1,164
$
Approximate Cash Flows:
From Operations
409
680
(298)
(203)
(34)
(11)
From Investing / (Cap Ex)
(350)
(485)
(362)
(71)
(232)
(54)
From Financing / (Debt Pay Down)
(110)
(106)
977
(37)
242
3
Exchange Rate Effect
(1)
(3)
2
(5)
(1)
(15)
Net Cash Flow
(52)
$
86
$
319
$
(316)
$
(25)
$
(77)
$
Ending Mfg. Cash
1
Balance:
October 31, 2010
1,100
$
October 31, 2011
1,186
$
October 31, 2012
1,505
$
January 31, 2013
1,189
$
April 30, 2013
1,164
$
July 31, 2013
1,087
$
1
Cash = Cash, Cash Equivalents & Marketable Securities
$ in millions |
 42
NYSE: NAV
Q3 2013 Earnings –
09/04/2013
SEC Regulation G Non-GAAP Reconciliation
The financial measures presented below are unaudited and not in accordance with, or an alternative for,
financial measures presented in accordance with U.S. generally accepted accounting principles
(GAAP). The non-GAAP financial information presented herein should be considered
supplemental to, and not as a substitute for, or superior to, financial measures calculated in accordance with
GAAP.
Manufacturing Segment Results: We
believe manufacturing segment results, which includes the segment results of our Truck, Engine, and Parts reporting segments,
provide meaningful information of our core manufacturing business and therefore we use it to
supplement our GAAP reporting by identifying items that may not be related to the core
manufacturing business. Management often uses this information to assess and measure the
performance of our operating segments. We have chosen to provide this supplemental information to investors, analysts
and other interested parties to enable them to perform additional analyses of operating results, to
illustrate the results of operations giving effect to the non-GAAP adjustments shown in the
below reconciliation, and to provide an additional measure of performance.
Earnings (loss) Before Interest, Income Taxes, Depreciation, and Amortization (“EBITDA”):
We define EBITDA as our consolidated net income (loss) from continuing operations attributable to
Navistar International Corporation, net of tax, plus manufacturing interest expense, income
taxes, and depreciation and amortization. We believe EBITDA provides meaningful information to
the performance of our business and therefore we use it to supplement our GAAP reporting. We have
chosen to provide this supplemental information to investors, analysts and other interested parties to
enable them to perform additional analyses of operating results.
Manufacturing Cash Flow and Manufacturing Cash, Cash Equivalents, and Marketable Securities:
Manufacturing cash flow is used and is presented to aid in developing an understanding of the ability
of our operations to generate cash for debt service and taxes, as well as cash for investments
in working capital, capital expenditures and other liquidity needs. This information is
presented as a supplement to the other data provided because it provides information which we believe is useful to
investors for additional analysis. Our manufacturing cash flow is prepared with marketable securities
being treated as a cash equivalent. Manufacturing cash, cash equivalents, and marketable
securities represents the Company’s consolidated cash, cash equivalents, and marketable
securities excluding cash, cash equivalents, and marketable securities of our financial services
operations. We include marketable securities with our cash and cash equivalents when assessing our
liquidity position as our investments are highly liquid in nature. We have chosen to provide
this supplemental information to investors, analysts and other interested parties to enable
them to perform additional analyses of operating results, to illustrate the results of operations giving effect
to the non-GAAP adjustments shown in the below reconciliation, and to provide an additional
measure of performance. |
 43
NYSE: NAV
Q3 2013 Earnings –
09/04/2013
SEC Regulation G –
Manufacturing Cash Fiscal Year Comparison
Manufacturing cash, cash equivalents, and marketable securities reconciliation:
(Dollars in Millions)
July 31,
2013
October 31,
2012
October 31,
2011
October 31,
2010
Manufacturing segment cash and cash equivalents
413
$
1,059
$
488
$
534
$
Financial services segment cash and cash equivalents
12
28
51
51
Consolidated cash and cash equivalents
425
$
1,087
$
539
$
585
$
Manufacturing marketable securities
674
$
446
$
698
$
566
$
Financial services segment marketable securities
34
20
20
20
Consolidated marketable securities
708
$
466
$
718
$
586
$
Manufacturing segment cash and cash equivalents
413
$
1,059
$
488
$
534
$
Manufacturing marketable securities
674
446
698
566
Manufacturing segment cash, cash equivalents and marketable securities
1,087
$
1,505
$
1,186
$
1,100
$ |
 44
NYSE: NAV
Q3 2013 Earnings –
09/04/2013
SEC Regulation G –
Manufacturing Cash
**Adjusted to exclude marketable securities from the ending balance and to include the change in
marketable securities in the cash flows from investing/capital expenditures line.
Manufacturing segment cash flow reconciliation:
Manufacturing
Operations
Financial
Services
Operations
Adjustments
Condensed
Consolidated
Cash Flows **
(Dollars in Millions)
For the year ended October 31, 2010
Cash flows from operations
409
698
-
1,107
Cash flows from investing / capital expenditures
(350)
492
(576)
(434)
Cash flows from financing / debt pay down
(110)
(1,180)
(10)
(1,300)
Effect of exchange rate changes
(1)
1
-
-
Net cash flows
(52)
11
(586)
(627)
Beginning cash, cash equivalents and marketable securities balance
1,152
60
-
1,212
Ending cash, cash equivalents and marketable securities balance
1,100
$
71
(586)
$
585
$
For the year ended October 31, 2011
Cash flows from operations
680
200
-
880
Cash flows from investing / capital expenditures
(485)
(206)
(132)
(823)
Cash flows from financing / debt pay down
(106)
6
-
(100)
Effect of exchange rate changes
(3)
-
-
(3)
Net cash flows
86
-
(132)
(46)
Beginning cash, cash equivalents and marketable securities balance
1,100
71
(586)
585
Ending cash, cash equivalents and marketable securities balance
1,186
$
71
$
(718)
$
539
$
$
$
$
$
$
$
$
$
$ |
 45
NYSE: NAV
Q3 2013 Earnings –
09/04/2013
SEC Regulation G –
Manufacturing Cash
**Adjusted to exclude marketable securities from the ending balance and to include the change in
marketable securities in the cash flows from investing/capital expenditures line.
Manufacturing segment cash flow reconciliation:
Manufacturing
Operations
Financial
Services
Operations
Adjustments
Condensed
Consolidated
Cash Flows **
(Dollars in Millions)
For the year ended October 31, 2012
Cash flows from operations
(298)
908
-
610
Cash flows from investing / capital expenditures
(362)
108
252
(2)
Cash flows from financing / debt pay down
977
(1,040)
-
(63)
Effect of exchange rate changes
2
1
-
3
Net cash flows
319
(23)
252
548
Beginning cash, cash equivalents and marketable securities balance
1,186
71
(718)
539
Ending cash, cash equivalents and marketable securities balance
1,505
48
(466)
1,087
For nine months ended July 31, 2013
Cash flows from operations
(248)
282
-
34
Cash flows from investing / capital expenditures
(357)
(92)
(242)
(691)
Cash flows from financing / debt pay down
208
(194)
-
14
Effect of exchange rate changes
(21)
2
(19)
Net cash flows
(418)
(2)
(242)
(662)
Beginning cash, cash equivalents and marketable securities balance
1,505
48
(466)
1,087
Ending cash, cash equivalents and marketable securities balance
1,087
46
(708)
425
$
$
$
$
$
$
$
$
$
$
$
$
$
$
$
$ |
 46
NYSE: NAV
SEC Regulation G –
Non-GAAP Reconciliations
$ in millions
Q3 2013 Earnings –
09/04/2013 |
 47
NYSE: NAV
Q3 2013 Earnings –
09/04/2013
SEC Regulation G –
Significant Items Included Within Our Results
(A)
In the third quarter and first nine months of 2013, the Company incurred charges for adjustments to
pre-existing warranties of $48 million and $252 million, respectively. During the third
quarter and first nine months of 2012, the Company recorded charges for adjustments to pre-existing warranties of $30 million and $259 million, respectively. For the
third quarter and first nine months of 2012, the associated tax impact of the charges were income tax
benefits of $101 million and $102 million, respectively. (B)
In the third quarter of 2013, the Company recorded asset impairment charges of $17 million, of which
$13 million was recognized by the Truck segment and $4 million was recognized by the Engine
segment. These charges are the result of our ongoing evaluation of our portfolio of assets to validate their strategic and financial fit, which led to the
discontinuation of certain engineering programs related to products that were determined to be outside
of our core operations or not performing to our expectations. In the second quarter of 2012, the Company recognized asset impairment charges of $38 million that
resulted from the decision to idle Workhorse Custom Chassis business, of which, $28 million was
recognized in the Income (loss) from discontinued operations, net of tax and $10 million was recognized by the Parts segment. In the third quarter and first
nine months of 2012, the associated tax impact of the adjustments recognized in Income (loss) from
discontinued operations, net of tax were income tax benefits of $3 million and $10 million,
respectively. For both the third quarter and first nine months of 2012 the associated tax impact of the charges related to continuing operations were an income tax
benefit of $4 million.
(C)
In the third quarter and first nine months of 2013, the Engine segment recorded charges for
non-conformance penalties of $7 million and $29 million, respectively, primarily for
certain 13L engine sales. In the third quarter and first nine months of 2012, the Engine segment
recorded charges for non-conformance penalties of $10 million and $20 million,
respectively. For both the third quarter and first nine months of 2012, the associated tax impact of
the adjustments were an income tax benefit of $8 million. (D)
Of the total charges for accelerated depreciation in the first nine months of 2013, $20 million was
related to certain assets related to the closure of our Garland Facility, and $19 million,
which included the $4 million recognized in the third quarter of 2013, was primarily related to certain assets affected by the discontinuation of certain engine programs,
particularly the MaxxForce15L. The Truck segment recognized charges of $23 million in the first nine
months of 2013, and the Engine segment recognized charges of $4 million and $16 million, in the
third quarter and first nine months of 2013, respectively. (E)
In the second quarter of 2013, the Company sold its stake in the Mahindra Joint Ventures to Mahindra.
The first nine months of 2013 results include a gain of $26 million from the divestiture, of
which the Truck and Engine segments recognized $15 million and $11 million, respectively. (F)
In May 2013, we divested substantially all of our interest in the operations of Monaco. As a result of
the divestiture, we impaired certain assets and recognized a loss totaling $24 million in the
first nine months of 2013. The loss was included in the Income (loss) from discontinued operations, net of tax.
(G)
As a result of the legal settlement with Deloitte and Touche LLP in December 2012, we received cash
proceeds of $35 million in the first quarter of 2013. (H)
In the second quarter of 2012, we recognized an income tax benefit of $181 million from the release of
a significant portion of our income tax valuation allowance on our Canadian deferred tax assets. The above items relating to 2013 did not have a material impact on taxes due to the valuation
allowances on our U.S. deferred tax assets, which was established in the fourth quarter of
2012. The above items relating to charges in 2012 have been adjusted to reflect the impact of income taxes which are calculated based on the respective periods estimated annual
effective tax rate. The income tax impact of the third quarter of 2012 adjustments reflects the impact
of a change in the third quarter of 2012 to the Company's 2012 estimated annual effective tax
rate. The change is the result of updates to the forecasted earnings and the jurisdictional mix.
Three Months Ended
July 31,
Nine Months Ended
July 31,
(in millions)
2013
2012
2013
2012
Expense (income):
Adjustments to pre-existing warranties
(A)
$
48
$
(71)
$
252
$
157
Asset impairment charges
(B)
17
(7)
17
24
Charges for non-conformance penalties
(C)
7
2
29
12
Accelerated depreciation
(D)
4
—
39
—
Mahindra Joint Ventures divestiture
(E)
2
—
(26)
—
Monaco RV divestiture
(F)
(1)
—
24
—
Legal settlement
(G)
—
—
(35)
—
Income tax valuation allowance release
(H)
—
—
—
(181) |
 48
NYSE: NAV
Q3 2013 Earnings –
09/04/2013
ROIC Definition
(PBT + Mfg Interest + Implied Interest on Operating Leases) X (1-Cash Tax
Rate) Paid-in-Capital –
Treasury Stock + Retained Earnings + Book Value of
Operating Leases + Book Value of Mfg Debt –
Mfg Cash
4
1
–
Excludes significant items such as restructuring, impairments, and engineering
integration expenses
2
–
If an Accumulated Deficit exists, then it will not be included in the
calculation 3
–
Excludes Financial Services Operation debt
4
–
Manufacturing Cash includes Cash and cash equivalents + Marketable
securities
1
2
3 |