Attached files
| file | filename |
|---|---|
| 8-K - HORIZON BANCORP INC /IN/ | hb_8k0821.htm |
Exhibit 99.1

A NASDAQ Traded Company - Symbol HBNC
This presentation may contain forward-looking statements regarding the financial performance, business, and future operations of Horizon Bancorp and its affiliates (collectively, “Horizon”). For these statements, Horizon claims the protection of the safe harbor for forward-looking statements contained in the Private Securities Litigation Reform Act of 1995. Forward-looking statements provide current expectations or forecasts of future events and are not guarantees of future results or performance. As a result, undue reliance should not be placed on these forward-looking statements, which speak only as of the date hereof. We have tried, wherever possible, to identify such statements by using words such as “anticipate,” “estimate,” “project,” “intend,” “plan,” “believe,” “will” and similar expressions, and although management believes that the expectations reflected in such forward-looking statements are accurate and reasonable, actual results may differ materially from those expressed or implied in such statements. Risks and uncertainties that could cause our actual results to differ materially include those set forth in “Item 1A Risk Factors” of Part I of Horizon’s Annual Report on Form 10-K for the fiscal year ended December 31, 2012. Statements in this presentation should be considered in conjunction with such risk factors and the other information publicly available about Horizon, including the information in the filings we make with the Securities and Exchange Commission. Horizon does not undertake, and specifically disclaims any obligation, to publicly release any updates to any forward-looking statement to reflect events or circumstances occurring or arising after the date on which the forward-looking statement is made, or to reflect the occurrence of unanticipated events, except to the extent required by law. Forward-Looking Statements

Insiders 8% Employee Benefit Plans 18% Institutional Investors 26% Name, Title Yrs. Experience Craig M. Dwight, Chairman & CEO 34 Thomas H. Edwards, President & COO 37 Mark E. Secor, CFO 25 James D. Neff, Corp. Secretary 34 Shares Outstanding 8.6 million Market Cap $205 million Dividend Yield 1.7% Price / Tg. Book Value 164.9% Price / LTM EPS 10.3x Price / 2013 Est. EPS 10.3x Assets $1.8 billion Loans, net $1.1 billion Deposits $1.3 billion Tg. Common Equity $124.3 million TCE / TA 7.05% 1st Half 2013 Net Income $11.0 million YTD ROAA 1.25% YTD ROACE 14.46% NPAs/ Loans + OREO 2.35% Company Profile Market Information Financial Highlights Ownership Market and ownership data as of July 22, 2013; financial data at or for the period ending June 30, 2013 Leadership Team - Horizon Bank *
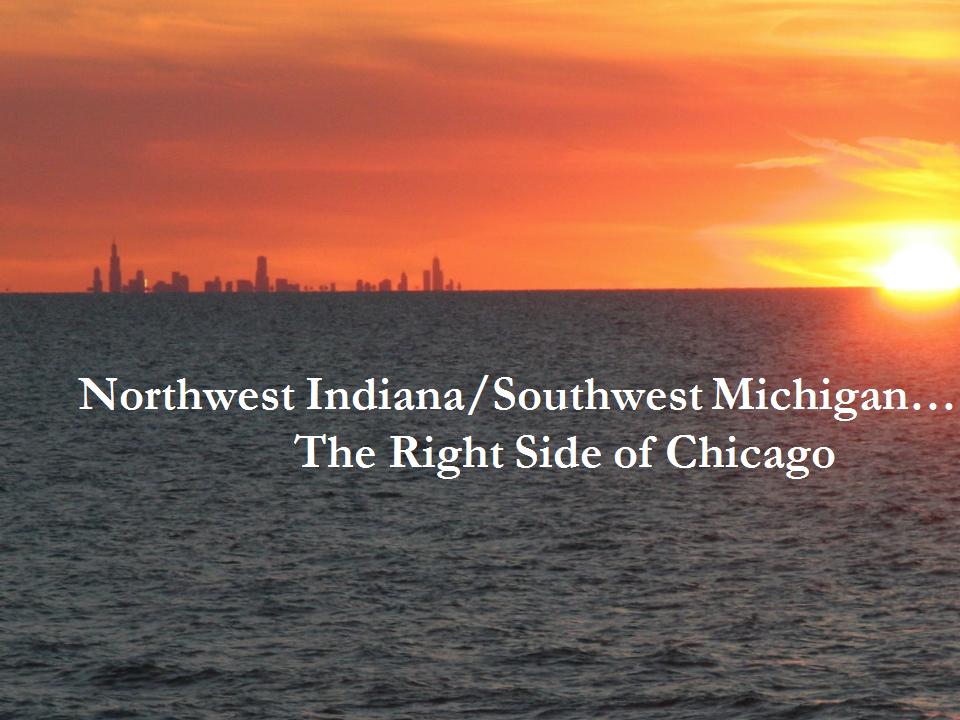
Northwest Indiana/Southwest Michigan… The Right Side of Chicago

29 Locations and Considerable Opportunity for Growth Proposed Carmel Branch *

Horizon Counties Rank # of Branches Deposits (In millions) Deposit Market Share La Porte, IN 1 4 $545 33.3% Porter, IN 6 5 $244 9.3% Johnson, IN 1 5 $221 13.0% Berrien, MI 4 5 $136 7.5% Lake, IN 14 5 $107 1.4% Kalamazoo, MI 15 1 $11 0.4% St. Joseph, IN 12 1 $9 0.2% Elkhart, IN 13 2 $8 0.4% Marion, IN (LPO) NM 1 $0 NM Horizon Total 29 $1,281 Indiana Total 21 23 $1,134 1.1% Michigan Total 85 6 $147 0.1% Deposit Market Share by County and State Opportunity for Significant Market Share Growth Source: SNL Financial; deposit data as of June 30, 2012 *

Market Overview

Earnings Continue to Improve For Banks in Indiana & Michigan Year Indiana (In millions) Michigan (In millions) 2012 $648 $763 2011 $487 $260 2010 $267 -$321 2009 -$101 -$663 2008 -$57 -$2,129 2007 $442 $896 2006 $525 $2,195 Source: UBPR for States of IN & MI Commercial Banks Only *

Source: U.S. Bureau of Labor Statistics; Unemployment rate is not seasonally adjusted in order to compare county vs. state and national data Local Economies Improving Horizon Counties 2006 Baseline Recession Peak May 2013 Peak to May 2013 Change Johnson, IN 3.7% 9.6% 6.8% -3.1% Kalamazoo, MI 4.9% 11.5% 7.1% -5.3% Porter, IN 3.8% 10.6% 7.9% -2.9% Elkhart, IN 5.3% 20.2% 8.2% -10.5% Marion, IN 4.5% 10.6% 8.4% -2.3% Berrien, MI 6.8% 14.6% 8.9% -6.4% St. Joseph, IN 4.9% 12.7% 9.7% -3.0% Lake, IN 5.1% 12.3% 9.8% -2.6% La Porte, IN 5.5% 14.2% 10.1% -4.0% Horizon Average 4.9% 12.9% 8.5% -4.5% Indiana 4.6% 11.5% 8.1% -3.0% Michigan 6.7% 14.8% 8.4% -6.4% United States 4.3% 10.6% 7.3% -3.1% Unemployment Rate Comparison *

What Got Us Here Today

Horizon’s Story Steady Growth Superior Returns Financial Strength Consistent Performance *

Mortgage Warehousing Established Entered St. Joseph Michigan Market Entered South Bend and Elkhart Market Acquired Alliance Bank Entered Lake County Market Acquired American Trust Bank Entered Kalamazoo Michigan Market Entered Indianapolis Market Acquired Heartland Community Bank Acquired Anchor Mortgage 1999 2004 2005 2012 2010 2006 2002 2003 2008 International Liquidity Crisis Full Service Branches 9 14 29 Company on the Move *

Recent Highlights Highest Quarterly and Six-months Earnings in Horizon’s History for the Period Ended June 30, 2013 Surpassed $500 Million in Commercial Loan Balances in June 2013 Two Dividend Increases and 3:2 Stock Split in 2012 Successful Merger & Integration of Heartland Community Bank Opened Three New Offices in 2012 Kalamazoo, Michigan Valparaiso, Indiana Indianapolis, Indiana Technology Upgrades State of the Art Online and Mobile Banking Platform CRM (Customer Relationship Management) *

Record Earnings “Thirteen” Consecutive Years 2000 – 2012 CAGR: 14.6% In Millions 86% Increase Net Income History *
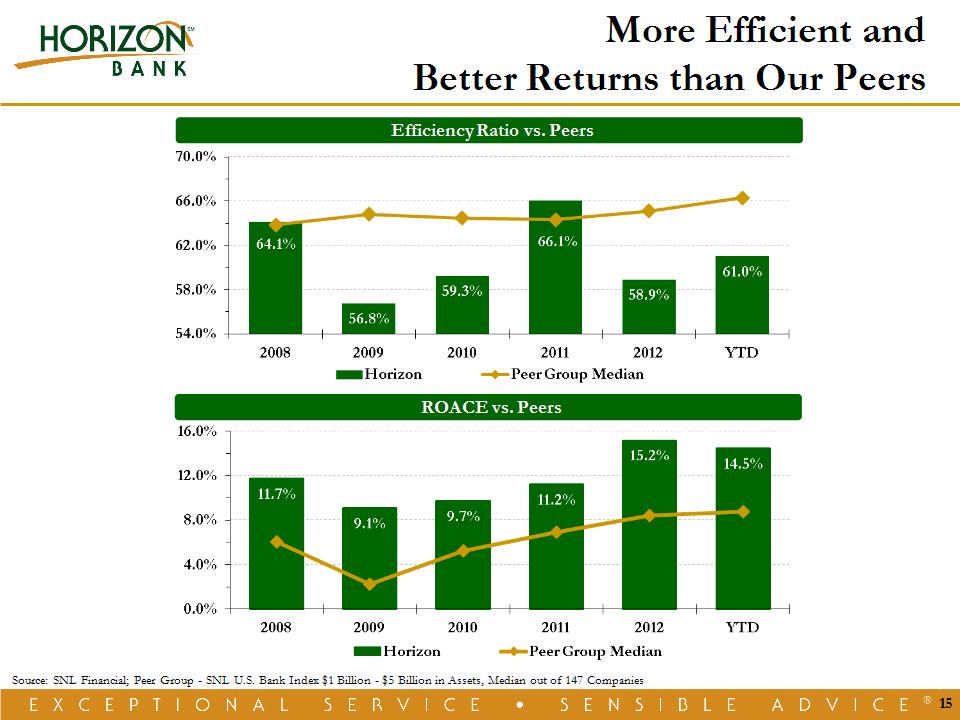
Source: SNL Financial; Peer Group – SNL U.S. Bank Index $1 Billion - $5 Billion in Assets, Median out of 147 Companies More Efficient and Better Returns than Our Peers Efficiency Ratio vs. Peers ROACE vs. Peers *

June 30, 2013 Loan Composition December 31, 2008 Loan Composition Loan Mix Better Positioned For Rising Rates Commercial 11.3% Mtg. Warehouse 5.2% Real Estate 1.9% Consumer (0.2%) 2008 – YTD CAGR *

Am Tru $15.1mm Heartland $70.3mm Commercial Loan Growth June 30, 2013 Commercial Loan Composition 8 15 26 2004 2012 2010 2006 2002 2003 2008 19 Commercial Loan Officer Headcount * Investment in Commercial Lenders Creates Growth

Growth Markets Thriving Kalamazoo Loan and Deposit Growth * * Month averages Indy Loan and Deposit Growth * *

Mortgage Loan Volume Volume & Composition: Three Months Ending Mortgage Business Built for the Long-Term Mortgage Loan Officer Headcount 6 23 32 16 *
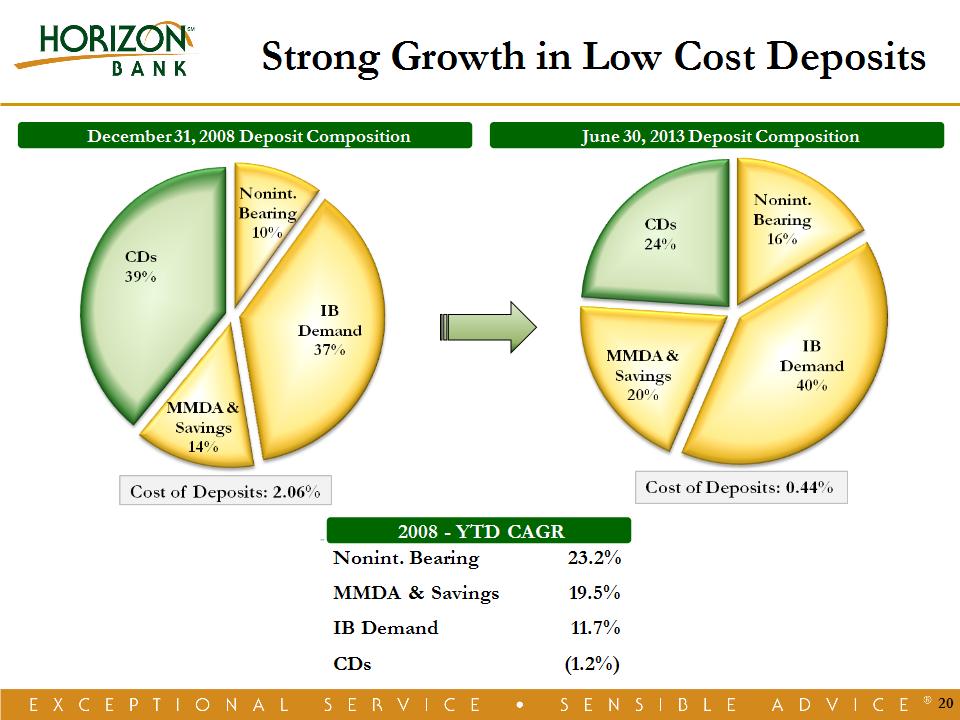
December 31, 2008 Deposit Composition June 30, 2013 Deposit Composition Strong Growth in Low Cost Deposits Nonint. Bearing 23.2% MMDA & Savings 19.5% IB Demand 11.7% CDs (1.2%) 2008 – YTD CAGR *
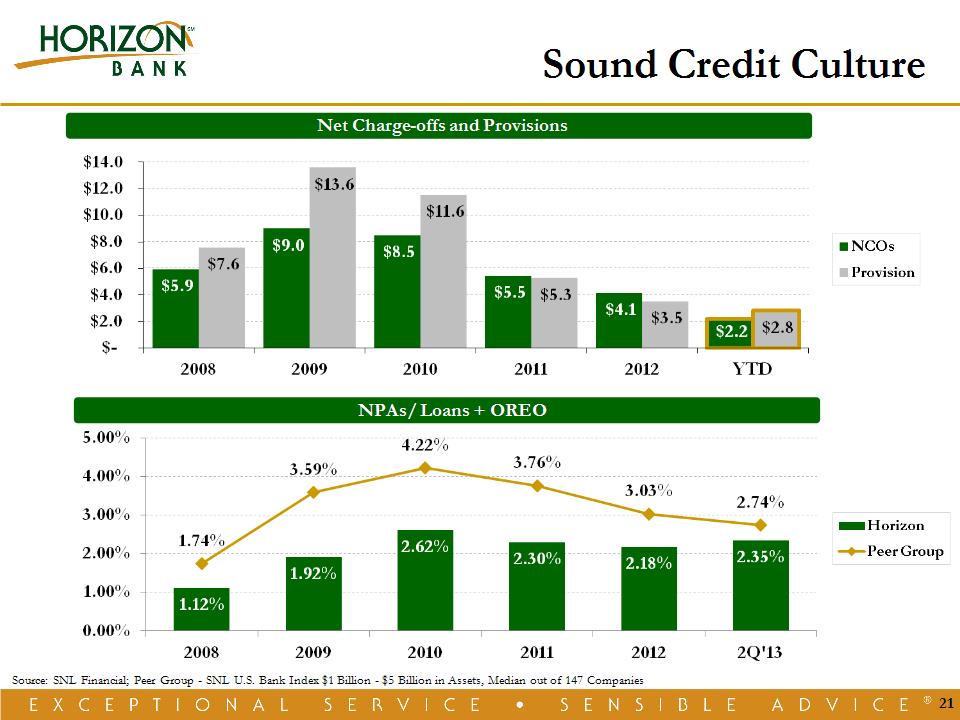
Sound Credit Culture Net Charge-offs and Provisions NPAs/ Loans + OREO * Source: SNL Financial; Peer Group – SNL U.S. Bank Index $1 Billion - $5 Billion in Assets, Median out of 147 Companies

What Will Get Us There Tomorrow *

Balanced & Complementary Business Model Business Banking Retail Banking Wealth Management Retail Mortgage Banking Mortgage Warehousing Complementary Revenue Streams that are Counter-Cyclical to Varying Economic Cycles *

Focus is on Organic Growth People First - Our Employees Get Things Done Focus on Happy Employees Align Pay with Results Measure Success and Growth Beat Last Year Provide Employees the Products and Tools to be Successful Continued Investment in Growth Markets Indy/Central Indiana Kalamazoo Customer Service Guarantees *

Seeking M&A Opportunities Disciplined and Focused Approach Must Meet Internal Targets Considerations Include: EPS Accretion TBV Dilution/Earnback Internal Rate of Return Seeking Indiana and Southwest Michigan Partners Larger MSAs Desired Market Growth Potential Fill in Market Gaps Horizon is an Attractive Investment to Partnering Banks Successful Financial Track Record Improved Liquidity and Shareholder Value Plan *

Why Invest in Horizon *

Shareholder Value Plan - Since 2001 Dividends Uninterrupted Dividends for more than 25 Years Dividend Increases Aligned with Earnings Growth Improving Liquidity Stock Splits in 2001, 2003, 2011 and 2012 Common Stock Issued in Heartland Acquisition Steady Growth in Net Book Value & EPS Russell 2000 Index in 2012 and 2013 *

Highly Regarded For Financial Performance Ranked in the Top 200 Community Banks for Financial Performance for the Years 2008, 2009, 2010, 2011 & 2012 US Banker & ABA Magazines Raymond James – Community Bankers Cup Award 2013 Bank Honor Roll (2nd Consecutive Year) Keefe Bruyette & Woods Recognition Named to Most Successful Banks Quarterly (1st Edition) Merion Capital Group New Financial Metric, “Success Ratio” *
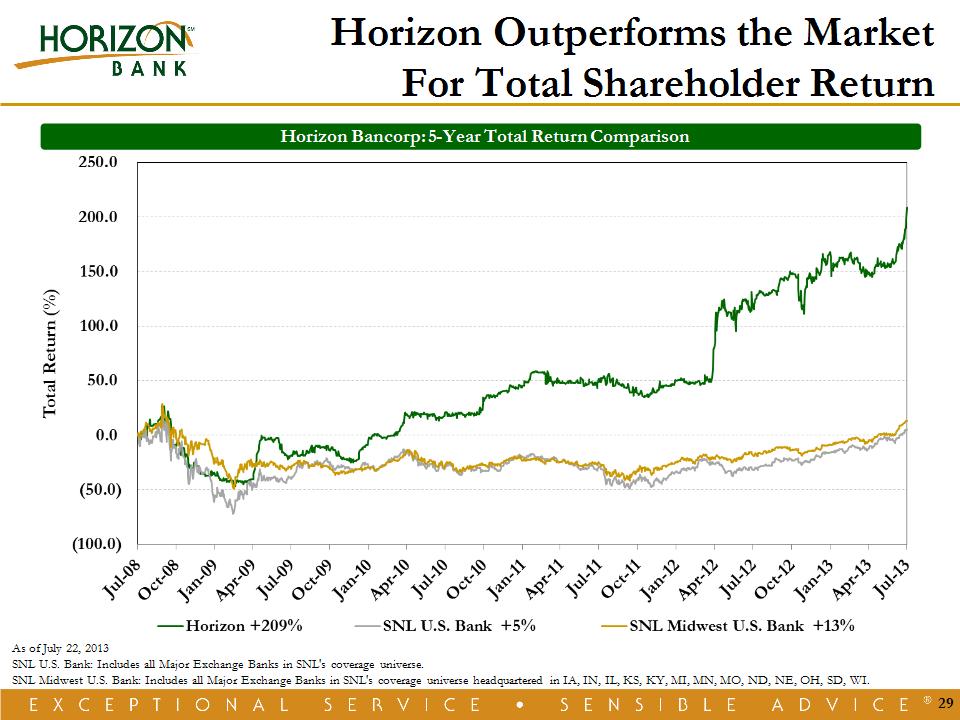
Horizon Outperforms the Market For Total Shareholder Return As of July 22, 2013 SNL U.S. Bank: Includes all Major Exchange Banks in SNL's coverage universe. SNL Midwest U.S. Bank: Includes all Major Exchange Banks in SNL's coverage universe headquartered in IA, IN, IL, KS, KY, MI, MN, MO, ND, NE, OH, SD, WI. Horizon Bancorp: 5-Year Total Return Comparison *
A NASDAQ Traded Company - Symbol HBNC Q&A