Attached files
| file | filename |
|---|---|
| 8-K - 8-K - CARDINAL FINANCIAL CORP | a13-18985_18k.htm |
Exhibit 99.1
|
|
Cardinal Financial Corporation Raymond James 2013 U.S. Bank Conference August 22, 2013 |
|
|
FORWARD LOOKING STATEMENTS Statements contained in this presentation which are not historical facts are forward-looking statements as that item is defined in the Private Securities Litigation Reform Act of 1995. Such forward-looking statements are subject to risks and uncertainties which could cause actual results to differ materially from estimated results. For an explanation of the risks and uncertainties associated with forward-looking statements, please refer to the Company’s Annual Report on Form 10-K for the year ended December 31, 2012 and other reports filed and furnished to the Securities and Exchange Commission. | 2 |
|
|
Aggressive on Sales, CONSERVATIVE ON RISK OUR OPERATING PHILOSOPHY | 3 |

|
|
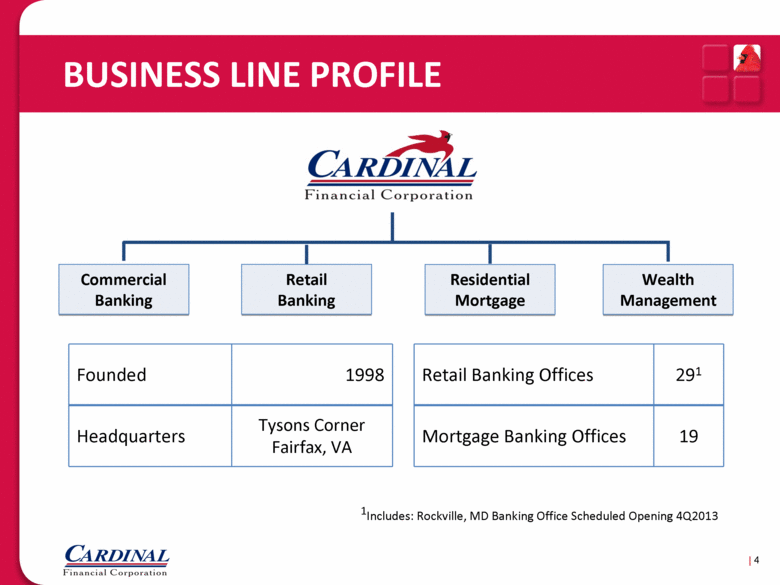
BUSINESS LINE PROFILE | 4 Founded 1998 Retail Banking Offices 291 Headquarters Tysons Corner Fairfax, VA Mortgage Banking Offices 19 Commercial Banking Retail Banking Residential Mortgage Wealth Management 1Includes: Rockville, MD Banking Office Scheduled Opening 4Q2013 |
|
|
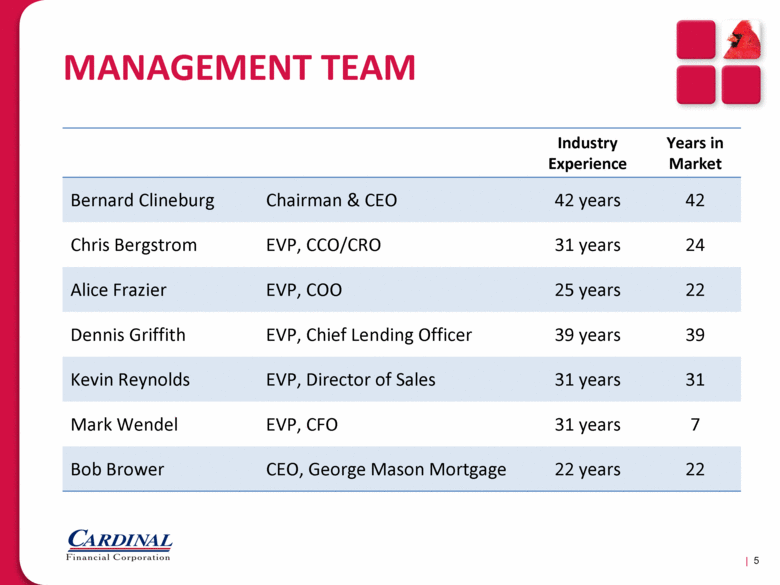
MANAGEMENT TEAM Industry Experience Years in Market Bernard Clineburg Chairman & CEO 42 years 42 Chris Bergstrom EVP, CCO/CRO 31 years 24 Alice Frazier EVP, COO 25 years 22 Dennis Griffith EVP, Chief Lending Officer 39 years 39 Kevin Reynolds EVP, Director of Sales 31 years 31 Mark Wendel EVP, CFO 31 years 7 Bob Brower CEO, George Mason Mortgage 22 years 22 | 5 |
|
|
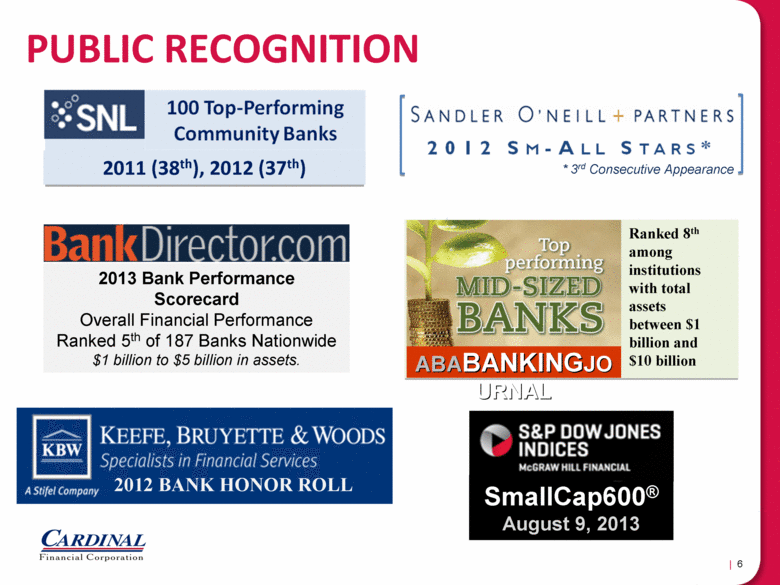
* 3rd Consecutive Appearance PUBLIC RECOGNITION 2011 (38th), 2012 (37th) 2012 BANK HONOR ROLL | 6 ABABANKINGJO URNAL Ranked 8th among institutions with total assets between $1 billion and $10 billion SmallCap600® August 9, 2013 2013 Bank Performance Scorecard Overall Financial Performance Ranked 5th of 187 Banks Nationwide $1 billion to $5 billion in assets. |
|
|
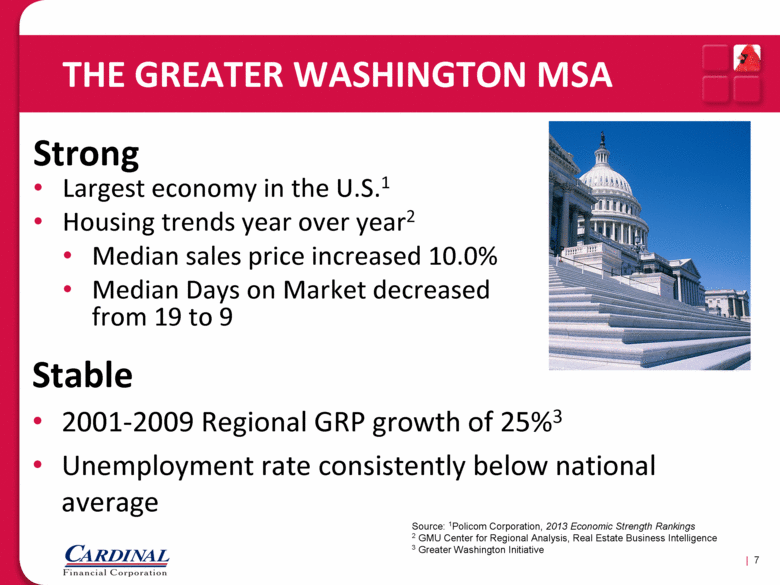
Strong Largest economy in the U.S.1 Housing trends year over year2 Median sales price increased 10.0% Median Days on Market decreased from 19 to 9 Stable 2001-2009 Regional GRP growth of 25%3 Unemployment rate consistently below national average THE GREATER WASHINGTON MSA | 7 Source: 1Policom Corporation, 2013 Economic Strength Rankings 2 GMU Center for Regional Analysis, Real Estate Business Intelligence 3 Greater Washington Initiative |
|
|
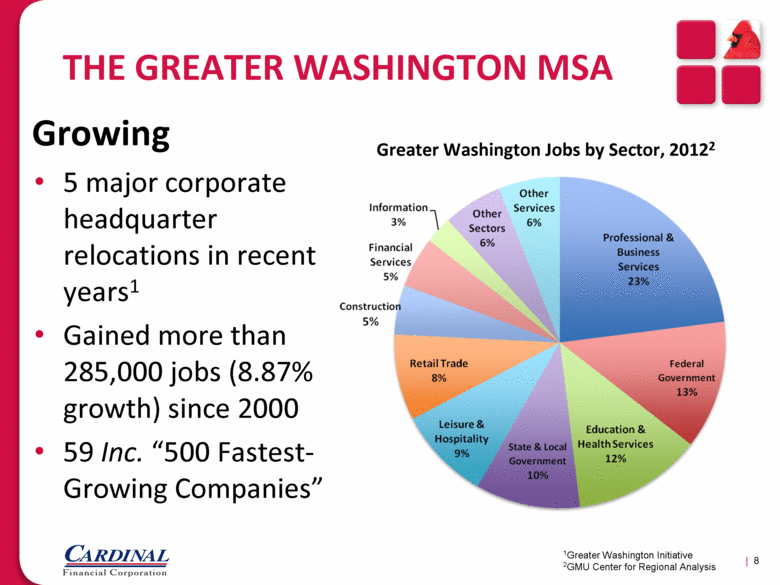
THE GREATER WASHINGTON MSA | 8 Growing 5 major corporate headquarter relocations in recent years1 Gained more than 285,000 jobs (8.87% growth) since 2000 59 Inc. “500 Fastest-Growing Companies” Greater Washington Jobs by Sector, 20122 1Greater Washington Initiative 2GMU Center for Regional Analysis |
|
|
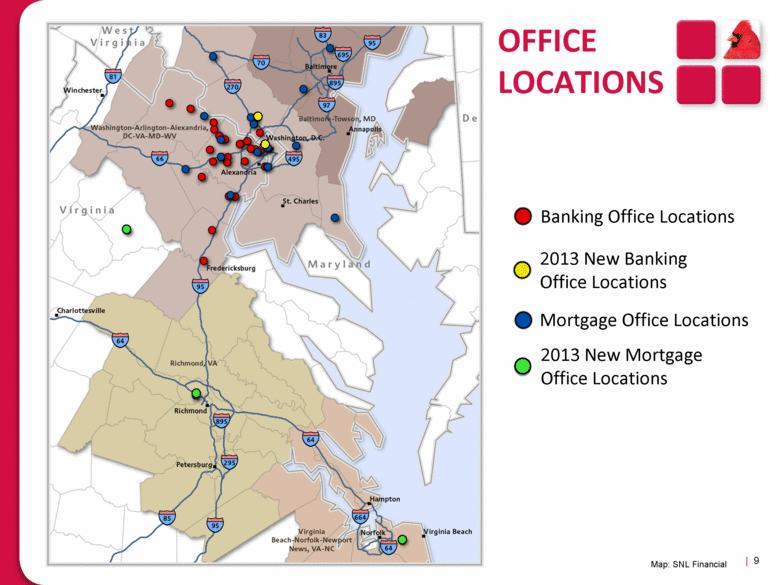
OFFICE LOCATIONS | 9 Map: SNL Financial 2013 New Banking Office Locations Mortgage Office Locations 2013 New Mortgage Office Locations Banking Office Locations |
|
|
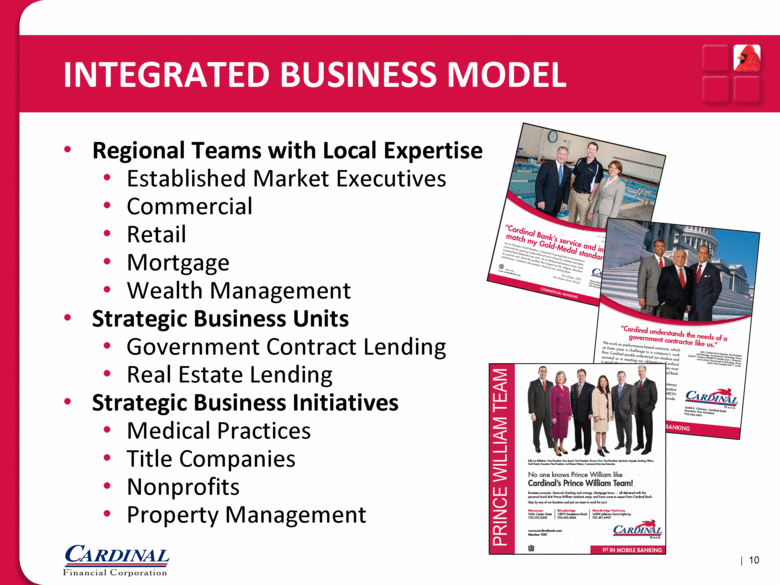
INTEGRATED BUSINESS MODEL Regional Teams with Local Expertise Established Market Executives Commercial Retail Mortgage Wealth Management Strategic Business Units Government Contract Lending Real Estate Lending Strategic Business Initiatives Medical Practices Title Companies Nonprofits Property Management | 10 |
|
|
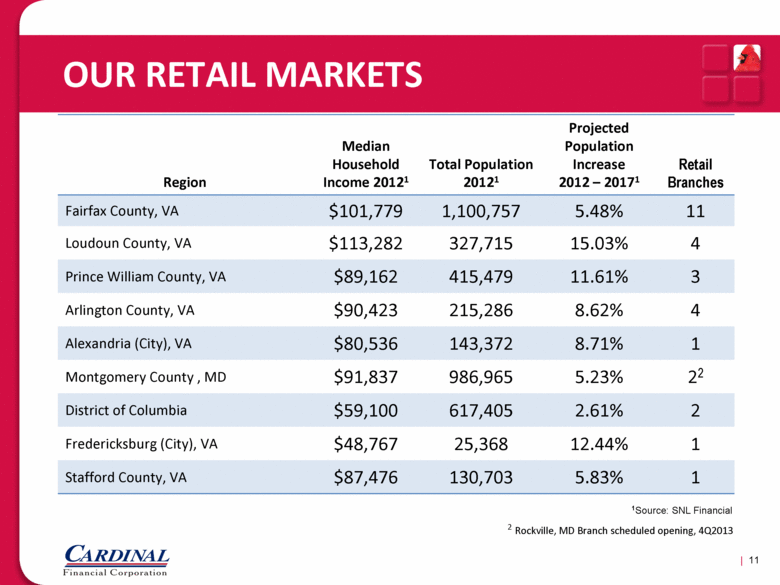
OUR RETAIL MARKETS Region Median Household Income 20121 Total Population 20121 Projected Population Increase 2012 – 20171 Retail Branches Fairfax County, VA $101,779 1,100,757 5.48% 11 Loudoun County, VA $113,282 327,715 15.03% 4 Prince William County, VA $89,162 415,479 11.61% 3 Arlington County, VA $90,423 215,286 8.62% 4 Alexandria (City), VA $80,536 143,372 8.71% 1 Montgomery County , MD $91,837 986,965 5.23% 22 District of Columbia $59,100 617,405 2.61% 2 Fredericksburg (City), VA $48,767 25,368 12.44% 1 Stafford County, VA $87,476 130,703 5.83% 1 | 11 1Source: SNL Financial 2 Rockville, MD Branch scheduled opening, 4Q2013 |
|
|
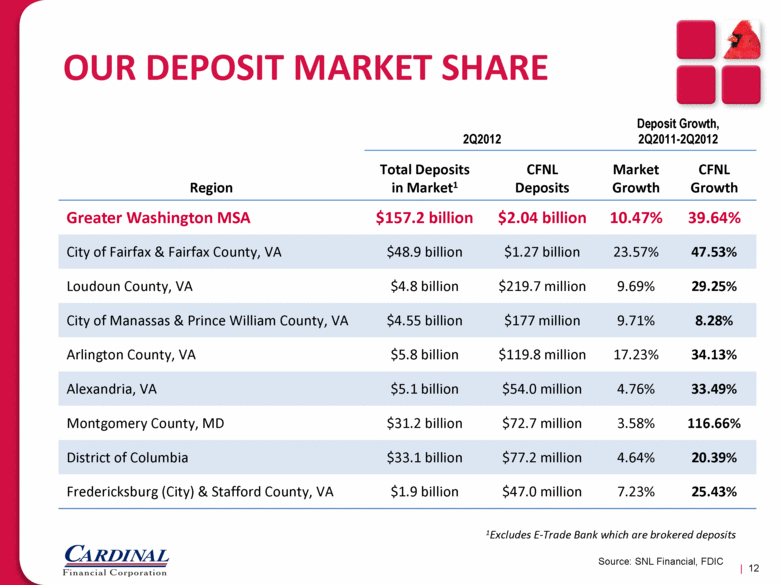
OUR DEPOSIT MARKET SHARE Region 2Q2012 Deposit Growth, 2Q2011-2Q2012 Total Deposits in Market1 CFNL Deposits Market Growth CFNL Growth Greater Washington MSA $157.2 billion $2.04 billion 10.47% 39.64% City of Fairfax & Fairfax County, VA $48.9 billion $1.27 billion 23.57% 47.53% Loudoun County, VA $4.8 billion $219.7 million 9.69% 29.25% City of Manassas & Prince William County, VA $4.55 billion $177 million 9.71% 8.28% Arlington County, VA $5.8 billion $119.8 million 17.23% 34.13% Alexandria, VA $5.1 billion $54.0 million 4.76% 33.49% Montgomery County, MD $31.2 billion $72.7 million 3.58% 116.66% District of Columbia $33.1 billion $77.2 million 4.64% 20.39% Fredericksburg (City) & Stafford County, VA $1.9 billion $47.0 million 7.23% 25.43% | 12 Source: SNL Financial, FDIC 1Excludes E-Trade Bank which are brokered deposits |
|
|
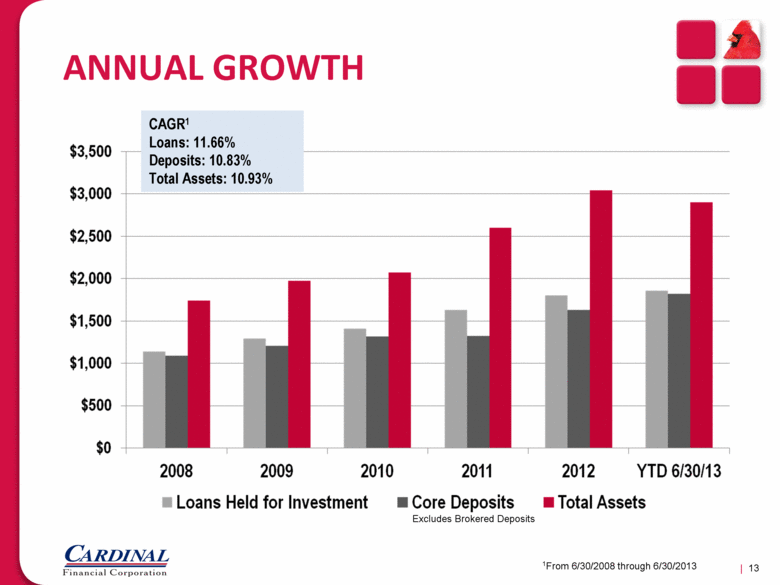
ANNUAL GROWTH | 13 1From 6/30/2008 through 6/30/2013 CAGR1 Loans: 11.66% Deposits: 10.83% Total Assets: 10.93% Excludes Brokered Deposits |
|
|
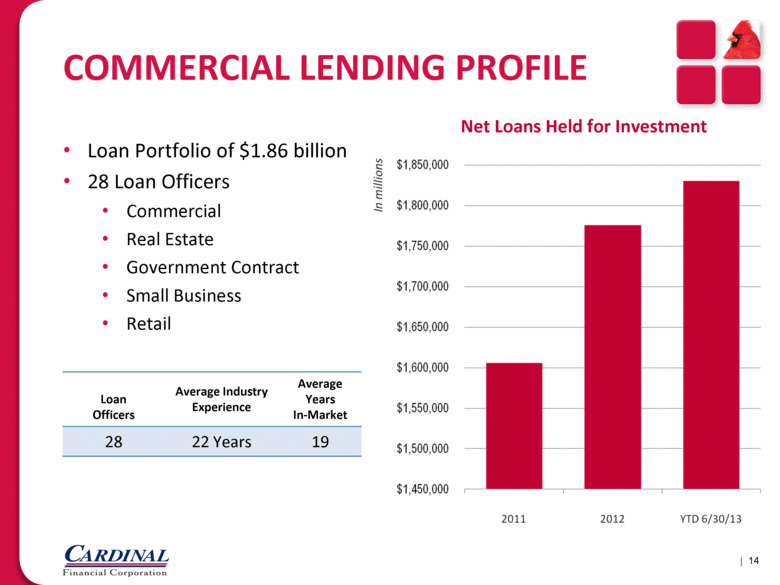
COMMERCIAL LENDING PROFILE Loan Portfolio of $1.86 billion 28 Loan Officers Commercial Real Estate Government Contract Small Business Retail | 14 Net Loans Held for Investment Loan Officers Average Industry Experience Average Years In-Market 28 22 Years 19 |
|
|
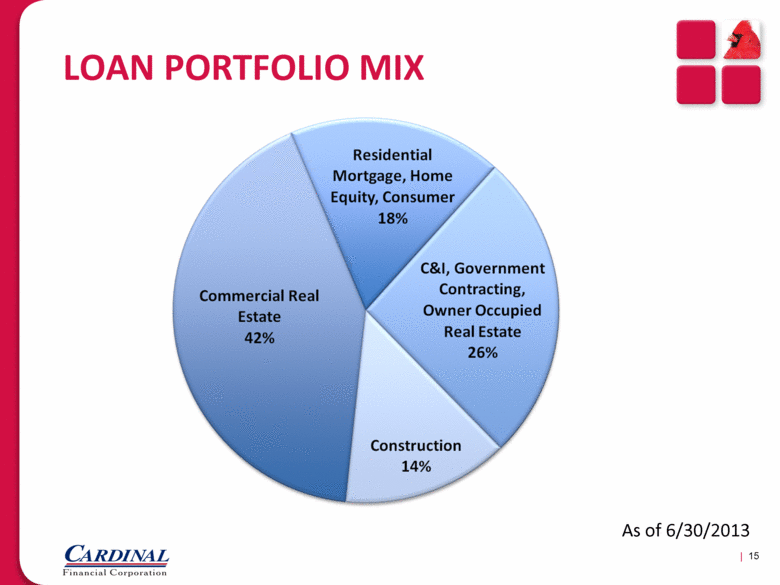
LOAN PORTFOLIO MIX | 15 As of 6/30/2013 |
|
|
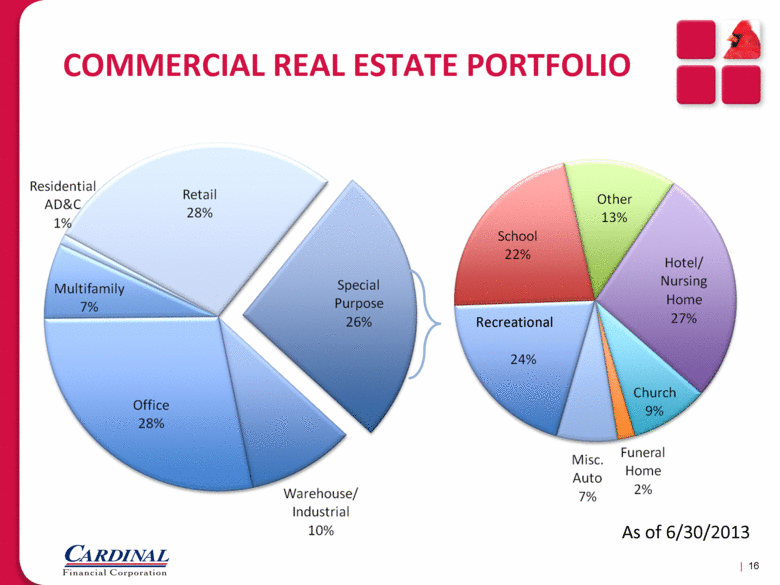
COMMERCIAL REAL ESTATE PORTFOLIO | 16 Recreational As of 6/30/2013 |
|
|
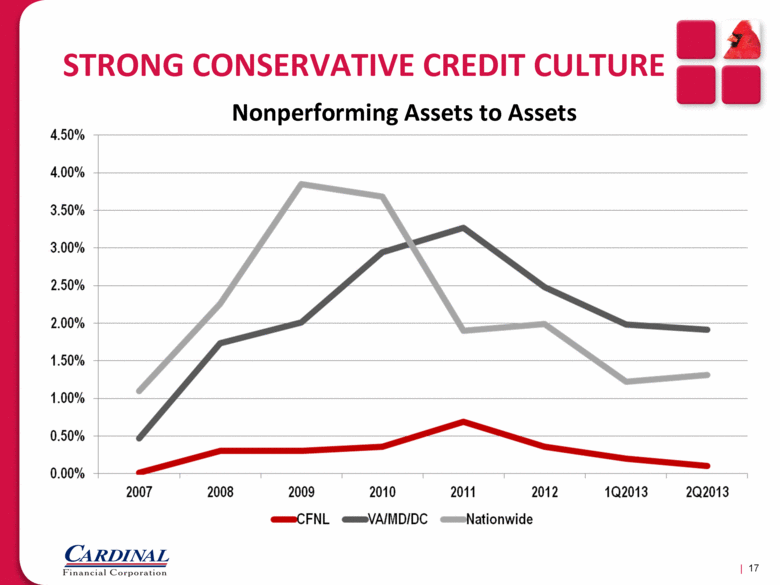
STRONG CONSERVATIVE CREDIT CULTURE | 17 Source: SNL Financial Complete Listing of Peer Group Used in Appendix Nonperforming Assets to Assets |
|
|
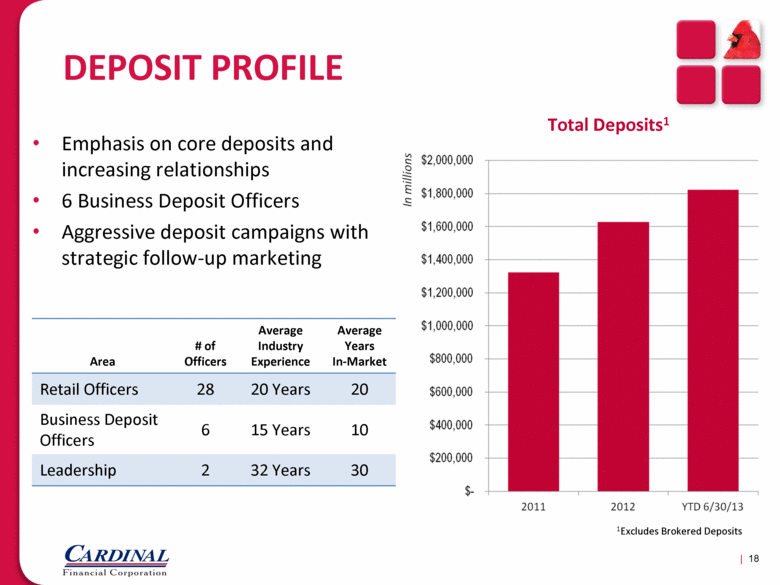
DEPOSIT PROFILE Emphasis on core deposits and increasing relationships 6 Business Deposit Officers Aggressive deposit campaigns with strategic follow-up marketing | 18 Total Deposits1 Area # of Officers Average Industry Experience Average Years In-Market Retail Officers 28 20 Years 20 Business Deposit Officers 6 15 Years 10 Leadership 2 32 Years 30 1Excludes Brokered Deposits |
|
|
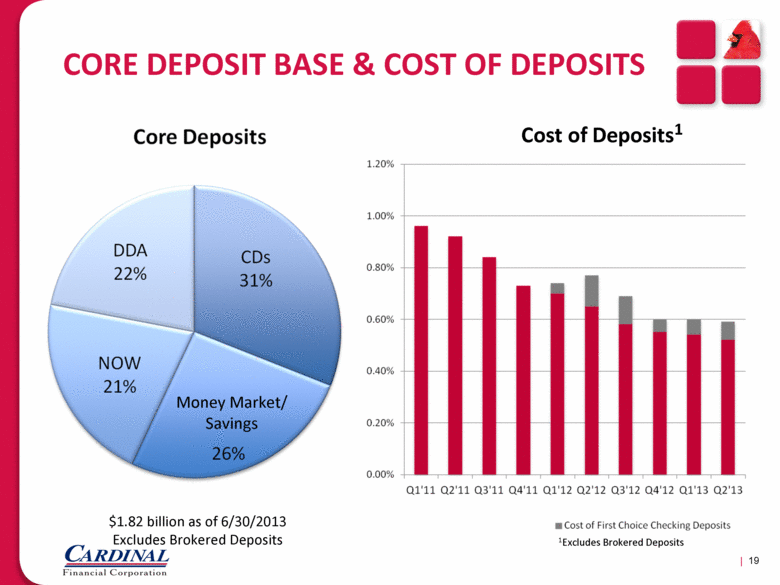
CORE DEPOSIT BASE & COST OF DEPOSITS | 19 Cost of Deposits1 1Excludes Brokered Deposits Money Market/ Savings $1.82 billion as of 6/30/2013 Excludes Brokered Deposits |
|
|
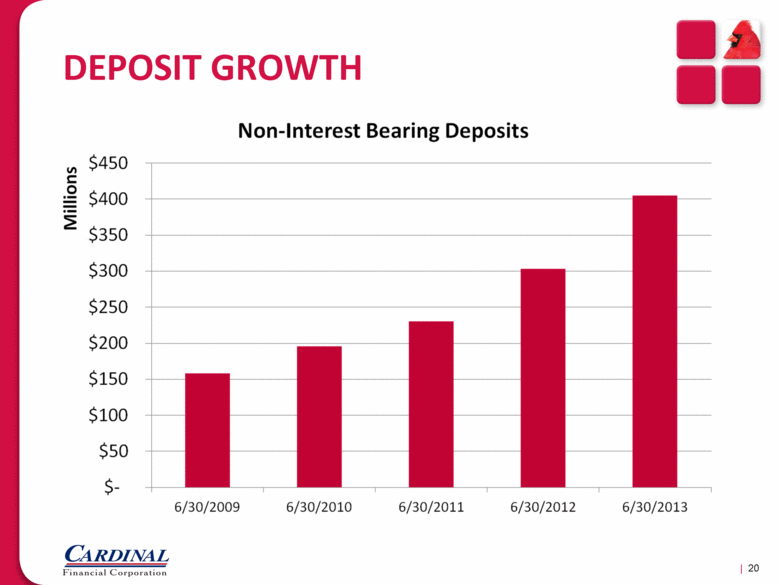
DEPOSIT GROWTH | 20 |
|
|
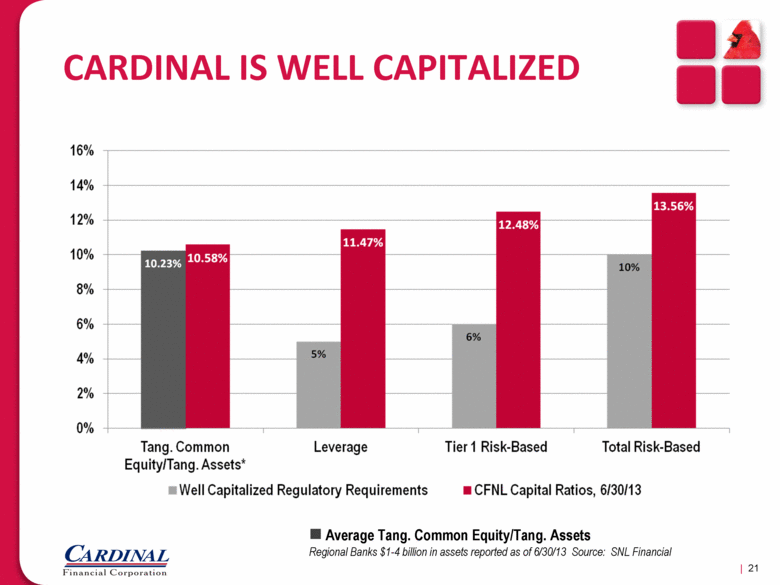
CARDINAL IS WELL CAPITALIZED | 21 Average Tang. Common Equity/Tang. Assets Regional Banks $1-4 billion in assets reported as of 6/30/13 Source: SNL Financial |
|
|
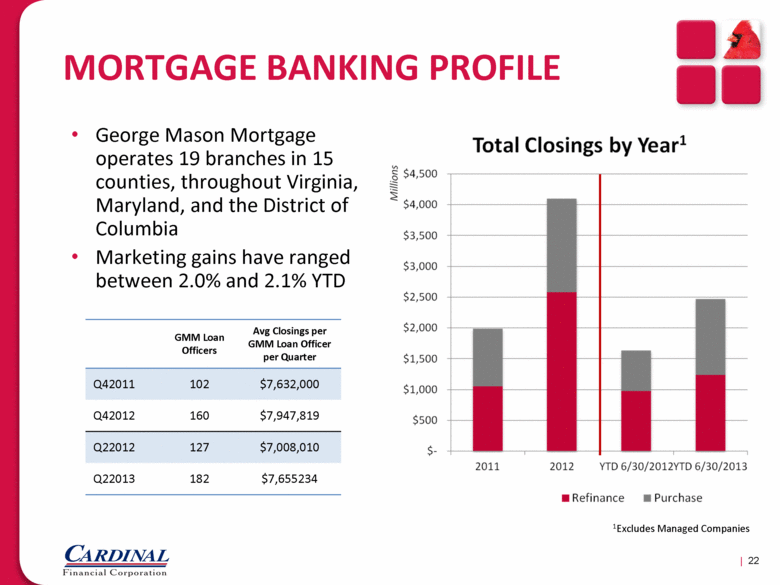
MORTGAGE BANKING PROFILE George Mason Mortgage operates 19 branches in 15 counties, throughout Virginia, Maryland, and the District of Columbia Marketing gains have ranged between 2.0% and 2.1% YTD | 22 GMM Loan Officers Avg Closings per GMM Loan Officer per Quarter Q42011 102 $7,632,000 Q42012 160 $7,947,819 Q22012 127 $7,008,010 Q22013 182 $7,655234 1Excludes Managed Companies |
|
|
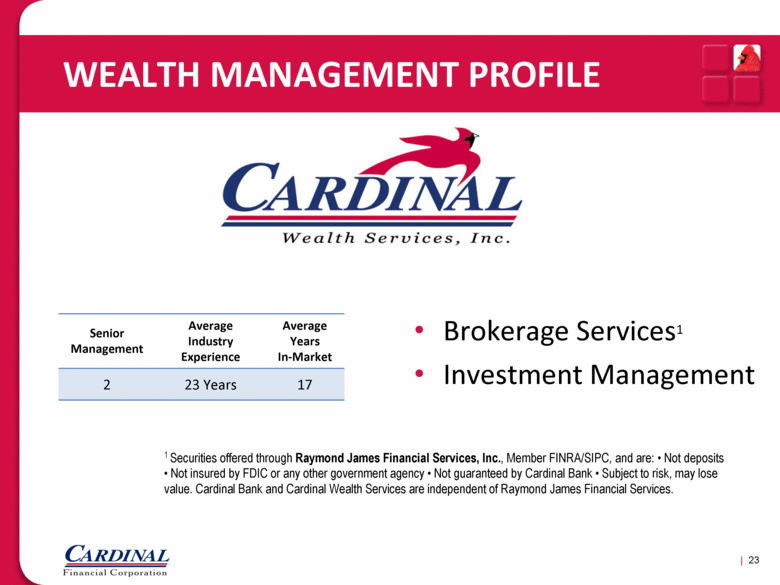
Brokerage Services1 Investment Management WEALTH MANAGEMENT PROFILE 1 Securities offered through Raymond James Financial Services, Inc., Member FINRA/SIPC, and are: • Not deposits • Not insured by FDIC or any other government agency • Not guaranteed by Cardinal Bank • Subject to risk, may lose value. Cardinal Bank and Cardinal Wealth Services are independent of Raymond James Financial Services. | 23 Senior Management Average Industry Experience Average Years In-Market 2 23 Years 17 |
|
|
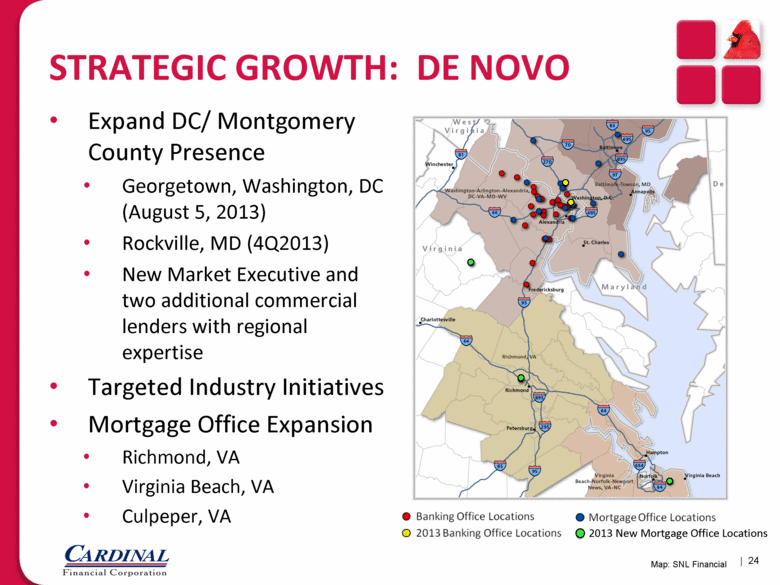
STRATEGIC GROWTH: DE NOVO Expand DC/ Montgomery County Presence Georgetown, Washington, DC (August 5, 2013) Rockville, MD (4Q2013) New Market Executive and two additional commercial lenders with regional expertise Targeted Industry Initiatives Mortgage Office Expansion Richmond, VA Virginia Beach, VA Culpeper, VA | 24 Map: SNL Financial 2013 New Mortgage Office Locations |
|
|
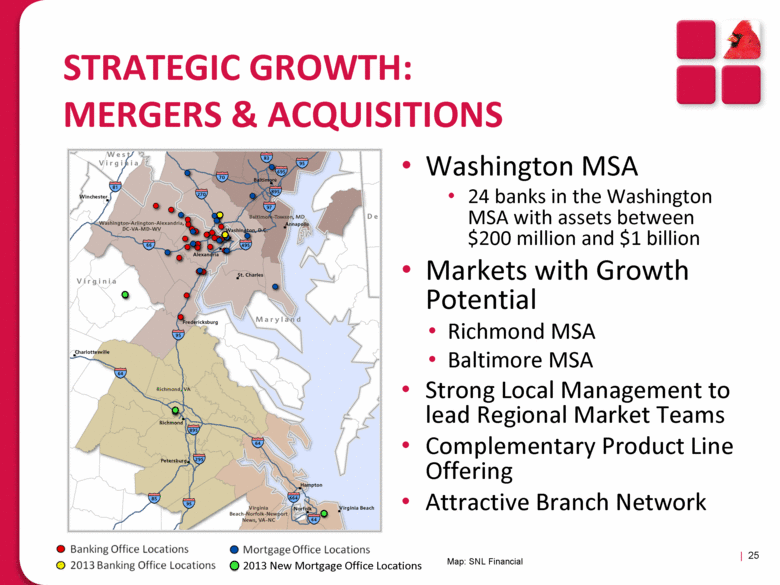
STRATEGIC GROWTH: MERGERS & ACQUISITIONS | 25 Washington MSA 24 banks in the Washington MSA with assets between $200 million and $1 billion Markets with Growth Potential Richmond MSA Baltimore MSA Strong Local Management to lead Regional Market Teams Complementary Product Line Offering Attractive Branch Network Map: SNL Financial 2013 New Mortgage Office Locations |
|
|
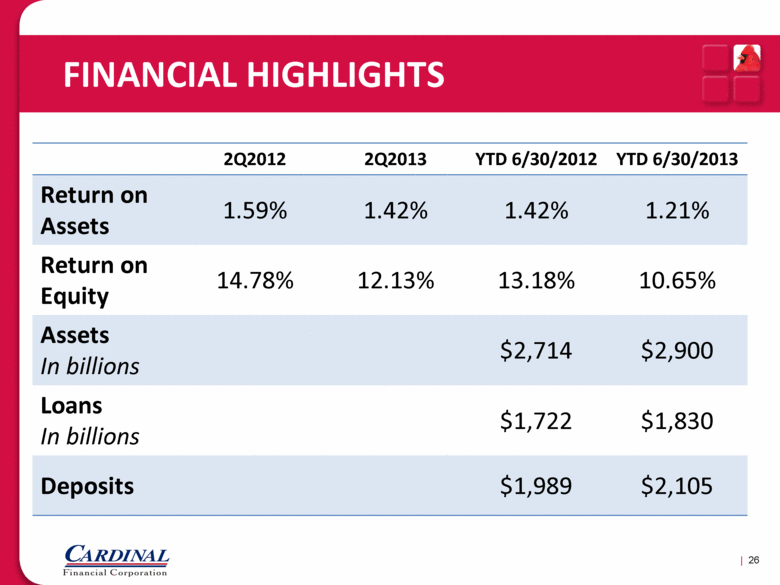
FINANCIAL HIGHLIGHTS 2Q2012 2Q2013 YTD 6/30/2012 YTD 6/30/2013 Return on Assets 1.59% 1.42% 1.42% 1.21% Return on Equity 14.78% 12.13% 13.18% 10.65% Assets In billions $2,714 $2,900 Loans In billions $1,722 $1,830 Deposits $1,989 $2,105 | 26 |
|
|
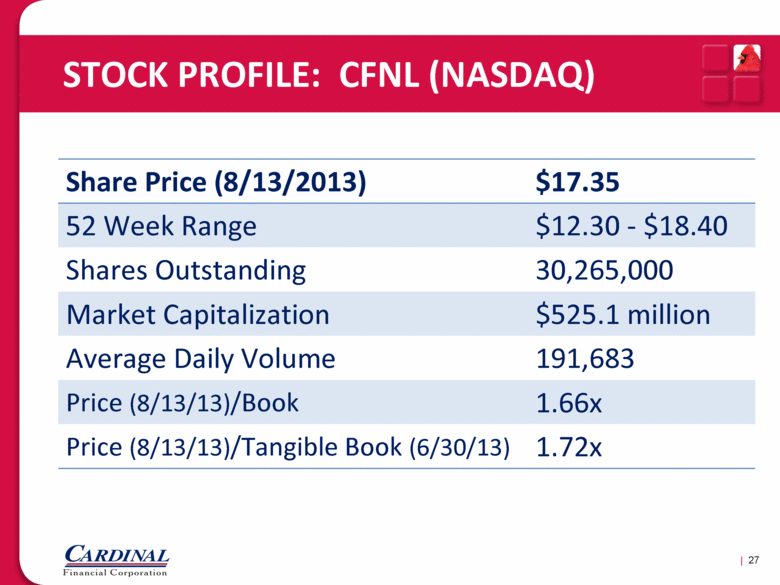
STOCK PROFILE: CFNL (NASDAQ) | 27 Share Price (8/13/2013) $17.35 52 Week Range $12.30 - $18.40 Shares Outstanding 30,265,000 Market Capitalization $525.1 million Average Daily Volume 191,683 Price (8/13/13)/Book 1.66x Price (8/13/13)/Tangible Book (6/30/13) 1.72x |
|
|
INVESTMENT SUMMARY Well-positioned for growth Franchise value in premier market Resilient regional economy Opportunities for organic and M&A growth Strong, experienced management team Excellent asset quality and diversified loan portfolio Diversified revenue stream Shareholder-focused Attractive valuation Dividend has increased 500% since 2009 52% compound annual EPS growth rate over past 5 years | 28 |
|
|
Aggressive on Sales, CONSERVATIVE ON RISK OUR OPERATING PHILOSOPHY | 29 |

|
|
APPENDIX |

|
|
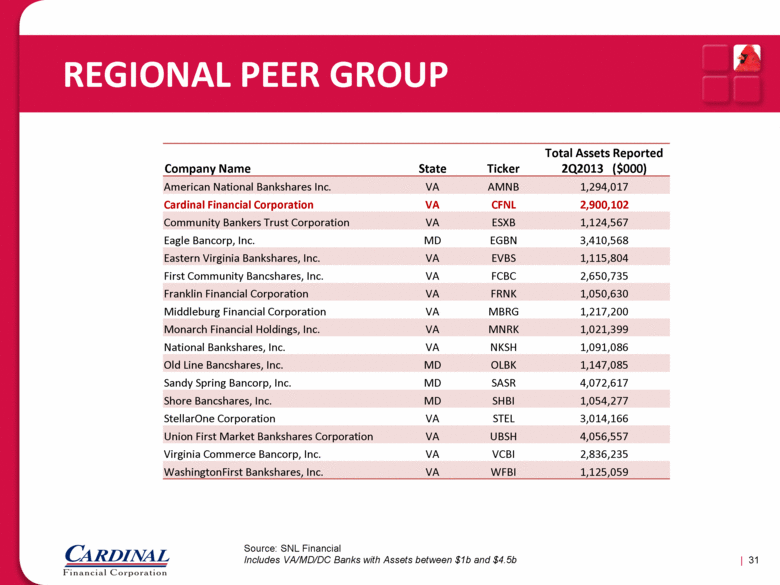
REGIONAL PEER GROUP | 31 Company Name State Ticker Total Assets Reported 2Q2013 ($000) American National Bankshares Inc. VA AMNB 1,294,017 Cardinal Financial Corporation VA CFNL 2,900,102 Community Bankers Trust Corporation VA ESXB 1,124,567 Eagle Bancorp, Inc. MD EGBN 3,410,568 Eastern Virginia Bankshares, Inc. VA EVBS 1,115,804 First Community Bancshares, Inc. VA FCBC 2,650,735 Franklin Financial Corporation VA FRNK 1,050,630 Middleburg Financial Corporation VA MBRG 1,217,200 Monarch Financial Holdings, Inc. VA MNRK 1,021,399 National Bankshares, Inc. VA NKSH 1,091,086 Old Line Bancshares, Inc. MD OLBK 1,147,085 Sandy Spring Bancorp, Inc. MD SASR 4,072,617 Shore Bancshares, Inc. MD SHBI 1,054,277 StellarOne Corporation VA STEL 3,014,166 Union First Market Bankshares Corporation VA UBSH 4,056,557 Virginia Commerce Bancorp, Inc. VA VCBI 2,836,235 WashingtonFirst Bankshares, Inc. VA WFBI 1,125,059 Source: SNL Financial Includes VA/MD/DC Banks with Assets between $1b and $4.5b |
|
|
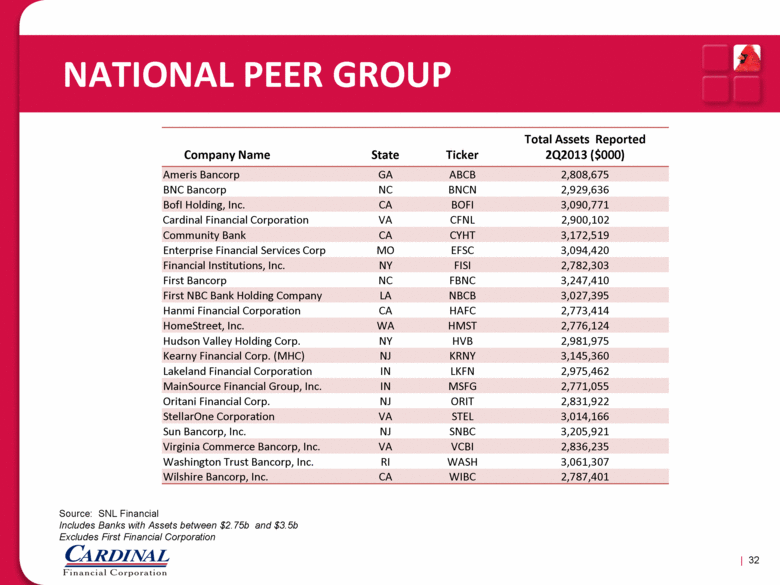
NATIONAL PEER GROUP Company Name State Ticker Total Assets Reported 2Q2013 ($000) Ameris Bancorp GA ABCB 2,808,675 BNC Bancorp NC BNCN 2,929,636 BofI Holding, Inc. CA BOFI 3,090,771 Cardinal Financial Corporation VA CFNL 2,900,102 Community Bank CA CYHT 3,172,519 Enterprise Financial Services Corp MO EFSC 3,094,420 Financial Institutions, Inc. NY FISI 2,782,303 First Bancorp NC FBNC 3,247,410 First NBC Bank Holding Company LA NBCB 3,027,395 Hanmi Financial Corporation CA HAFC 2,773,414 HomeStreet, Inc. WA HMST 2,776,124 Hudson Valley Holding Corp. NY HVB 2,981,975 Kearny Financial Corp. (MHC) NJ KRNY 3,145,360 Lakeland Financial Corporation IN LKFN 2,975,462 MainSource Financial Group, Inc. IN MSFG 2,771,055 Oritani Financial Corp. NJ ORIT 2,831,922 StellarOne Corporation VA STEL 3,014,166 Sun Bancorp, Inc. NJ SNBC 3,205,921 Virginia Commerce Bancorp, Inc. VA VCBI 2,836,235 Washington Trust Bancorp, Inc. RI WASH 3,061,307 Wilshire Bancorp, Inc. CA WIBC 2,787,401 | 32 Source: SNL Financial Includes Banks with Assets between $2.75b and $3.5b Excludes First Financial Corporation |
|
|
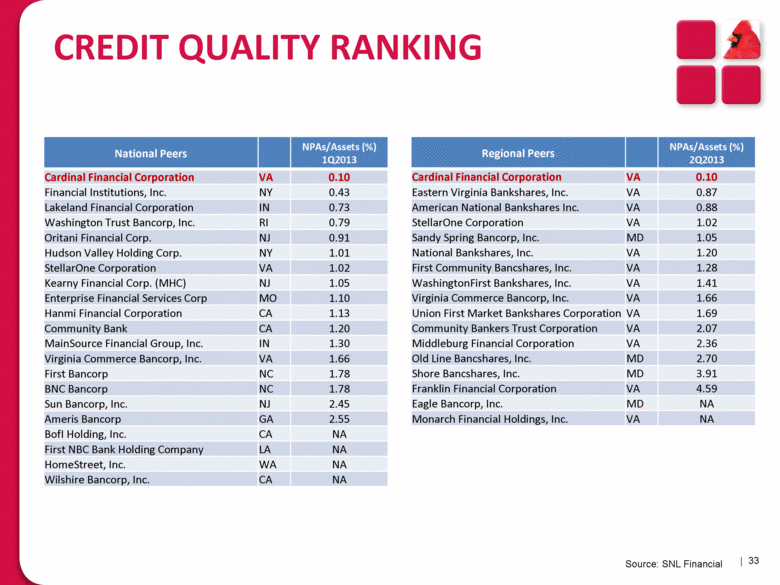
CREDIT QUALITY RANKING National Peers NPAs/Assets (%) 1Q2013 Cardinal Financial Corporation VA 0.10 Financial Institutions, Inc. NY 0.43 Lakeland Financial Corporation IN 0.73 Washington Trust Bancorp, Inc. RI 0.79 Oritani Financial Corp. NJ 0.91 Hudson Valley Holding Corp. NY 1.01 StellarOne Corporation VA 1.02 Kearny Financial Corp. (MHC) NJ 1.05 Enterprise Financial Services Corp MO 1.10 Hanmi Financial Corporation CA 1.13 Community Bank CA 1.20 MainSource Financial Group, Inc. IN 1.30 Virginia Commerce Bancorp, Inc. VA 1.66 First Bancorp NC 1.78 BNC Bancorp NC 1.78 Sun Bancorp, Inc. NJ 2.45 Ameris Bancorp GA 2.55 BofI Holding, Inc. CA NA First NBC Bank Holding Company LA NA HomeStreet, Inc. WA NA Wilshire Bancorp, Inc. CA NA Regional Peers NPAs/Assets (%) 2Q2013 Cardinal Financial Corporation VA 0.10 Eastern Virginia Bankshares, Inc. VA 0.87 American National Bankshares Inc. VA 0.88 StellarOne Corporation VA 1.02 Sandy Spring Bancorp, Inc. MD 1.05 National Bankshares, Inc. VA 1.20 First Community Bancshares, Inc. VA 1.28 WashingtonFirst Bankshares, Inc. VA 1.41 Virginia Commerce Bancorp, Inc. VA 1.66 Union First Market Bankshares Corporation VA 1.69 Community Bankers Trust Corporation VA 2.07 Middleburg Financial Corporation VA 2.36 Old Line Bancshares, Inc. MD 2.70 Shore Bancshares, Inc. MD 3.91 Franklin Financial Corporation VA 4.59 Eagle Bancorp, Inc. MD NA Monarch Financial Holdings, Inc. VA NA | 33 Source: SNL Financial |
|
|
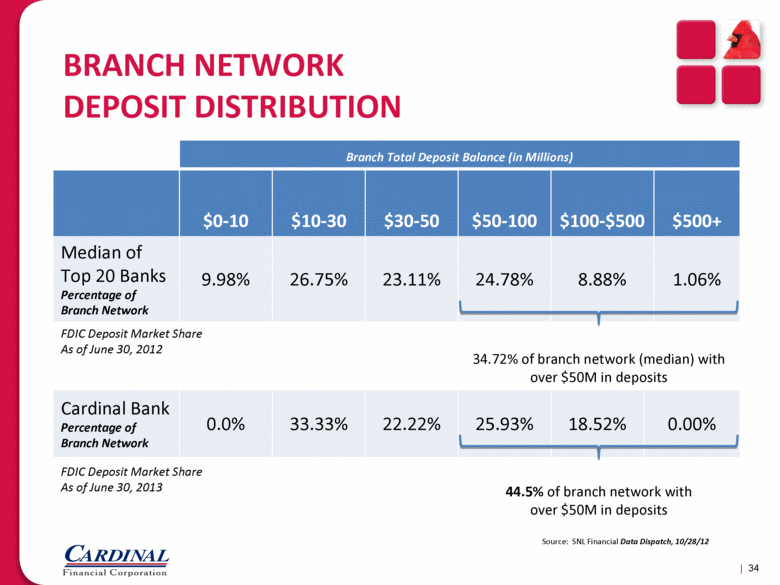
BRANCH NETWORK DEPOSIT DISTRIBUTION | 34 Branch Total Deposit Balance (in Millions) $0-10 $10-30 $30-50 $50-100 $100-$500 $500+ Median of Top 20 Banks Percentage of Branch Network 9.98% 26.75% 23.11% 24.78% 8.88% 1.06% FDIC Deposit Market Share As of June 30, 2012 34.72% of branch network (median) with over $50M in deposits Cardinal Bank Percentage of Branch Network 0.0% 33.33% 22.22% 25.93% 18.52% 0.00% FDIC Deposit Market Share As of June 30, 2013 44.5% of branch network with over $50M in deposits Source: SNL Financial Data Dispatch, 10/28/12 |
|
|
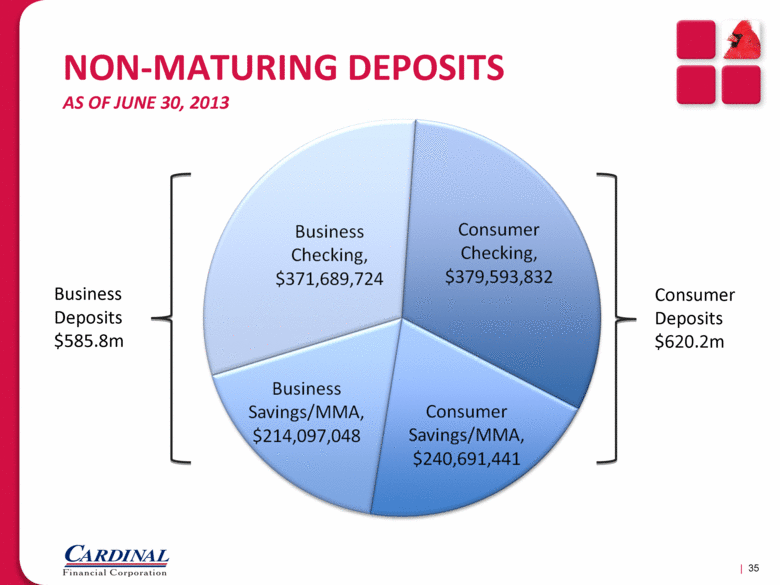
NON-MATURING DEPOSITS AS OF JUNE 30, 2013 | 35 Consumer Deposits $620.2m Business Deposits $585.8m |
|
|
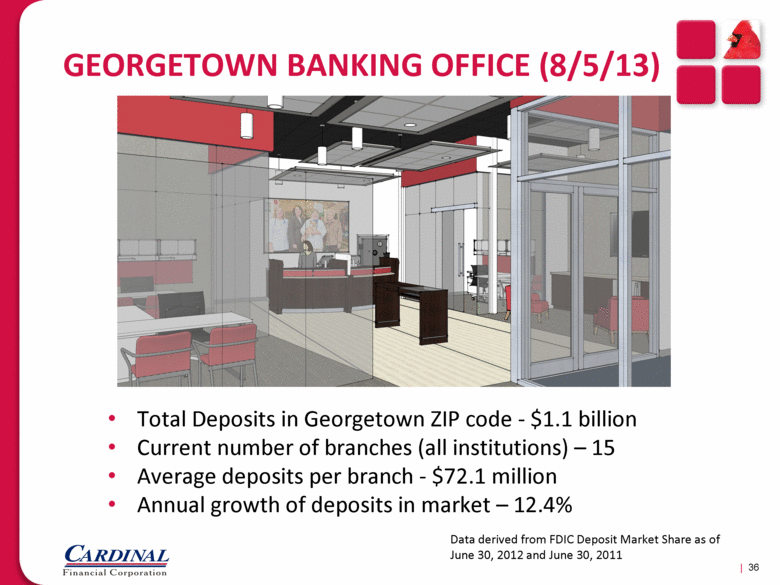
GEORGETOWN BANKING OFFICE (8/5/13) Total Deposits in Georgetown ZIP code - $1.1 billion Current number of branches (all institutions) – 15 Average deposits per branch - $72.1 million Annual growth of deposits in market – 12.4% | 36 Data derived from FDIC Deposit Market Share as of June 30, 2012 and June 30, 2011 |
|
|
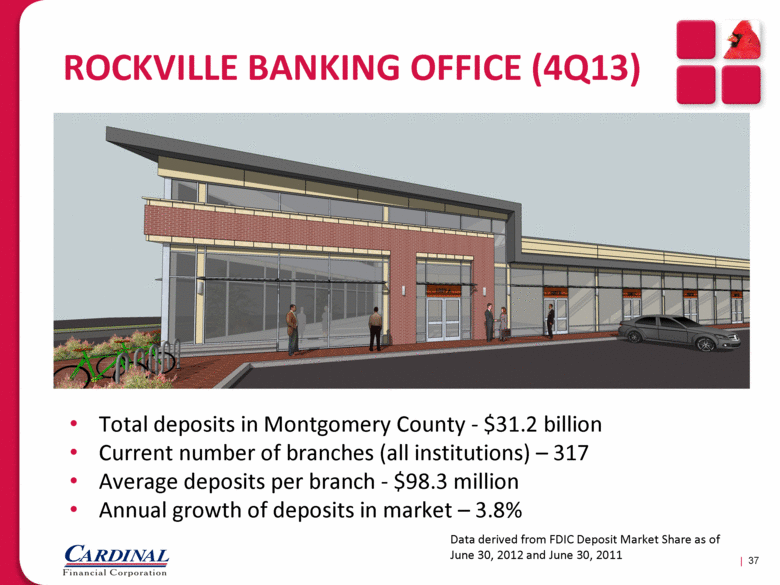
ROCKVILLE BANKING OFFICE (4Q13) | 37 Total deposits in Montgomery County - $31.2 billion Current number of branches (all institutions) – 317 Average deposits per branch - $98.3 million Annual growth of deposits in market – 3.8% Data derived from FDIC Deposit Market Share as of June 30, 2012 and June 30, 2011 |
|
|
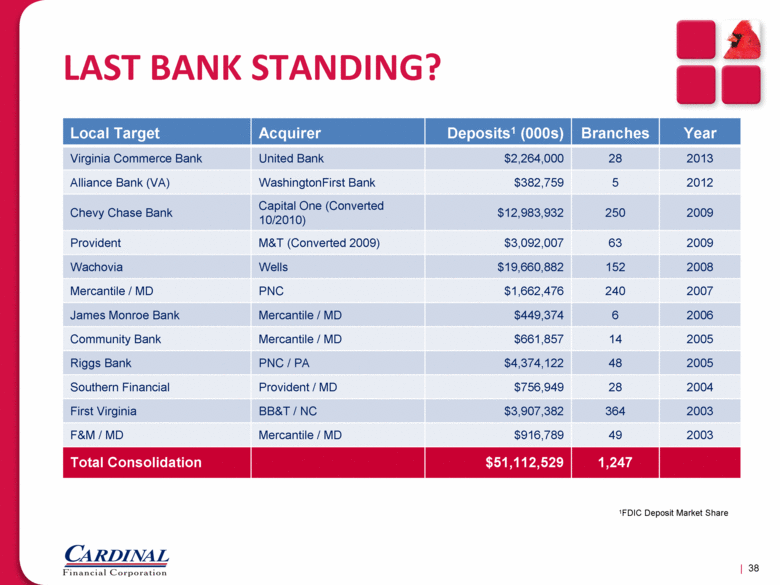
LAST BANK STANDING? Local Target Acquirer Deposits1 (000s) Branches Year Virginia Commerce Bank United Bank $2,264,000 28 2013 Alliance Bank (VA) WashingtonFirst Bank $382,759 5 2012 Chevy Chase Bank Capital One (Converted 10/2010) $12,983,932 250 2009 Provident M&T (Converted 2009) $3,092,007 63 2009 Wachovia Wells $19,660,882 152 2008 Mercantile / MD PNC $1,662,476 240 2007 James Monroe Bank Mercantile / MD $449,374 6 2006 Community Bank Mercantile / MD $661,857 14 2005 Riggs Bank PNC / PA $4,374,122 48 2005 Southern Financial Provident / MD $756,949 28 2004 First Virginia BB&T / NC $3,907,382 364 2003 F&M / MD Mercantile / MD $916,789 49 2003 Total Consolidation $51,112,529 1,247 | 38 1FDIC Deposit Market Share |
|
|
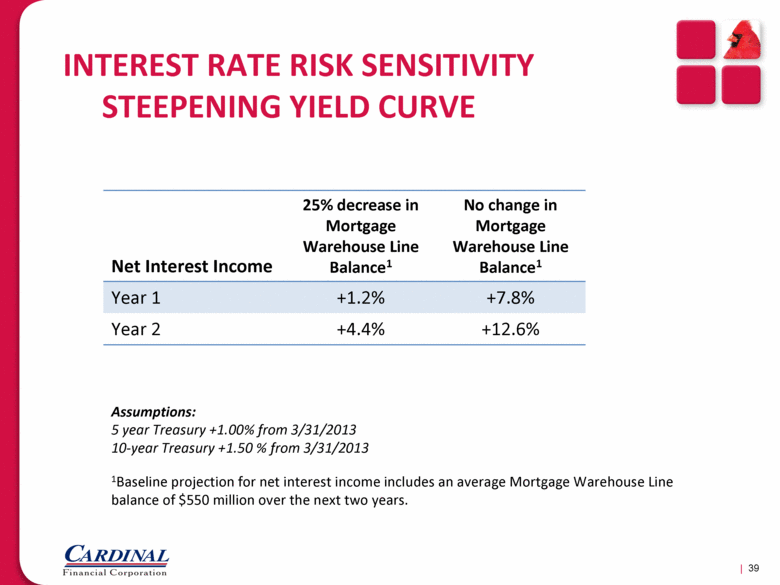
INTEREST RATE RISK SENSITIVITY STEEPENING YIELD CURVE | 39 1Baseline projection for net interest income includes an average Mortgage Warehouse Line balance of $550 million over the next two years. Net Interest Income 25% decrease in Mortgage Warehouse Line Balance1 No change in Mortgage Warehouse Line Balance1 Year 1 +1.2% +7.8% Year 2 +4.4% +12.6% Assumptions: 5 year Treasury +1.00% from 3/31/2013 10-year Treasury +1.50 % from 3/31/2013 |