Attached files
| file | filename |
|---|---|
| EX-21.1 - EX-21.1 - ExOne Co | d578697dex211.htm |
| EX-23.1 - EX-23.1 - ExOne Co | d578697dex231.htm |
Table of Contents
As filed with the Securities and Exchange Commission on August 21, 2013
Registration No. 333-
UNITED STATES
SECURITIES AND EXCHANGE COMMISSION
Washington, D.C. 20549
FORM S-1
REGISTRATION STATEMENT
UNDER
THE SECURITIES ACT OF 1933
The ExOne Company
(Exact name of registrant as specified in its charter)
| Delaware | 3599 | 46-1684608 | ||
| (State or other jurisdiction of incorporation or organization) |
(Primary Standard Industrial Classification Code Number) |
(I.R.S. Employer Identification No.) |
127 Industry Boulevard
North Huntingdon, Pennsylvania 15642
(724) 863-9663
(Address, including zip code, and telephone number, including area code, of registrant’s principal executive offices)
S. Kent Rockwell
Chairman & CEO
The ExOne Company
127 Industry Boulevard
North Huntingdon, Pennsylvania 15642
(724) 863-9663
(Name, address, including zip code, and telephone number, including area code, of agent for service)
Copies to:
| Hannah T. Frank Lewis U. Davis Buchanan Ingersoll & Rooney PC One Oxford Centre 301 Grant Street, 20th Floor Pittsburgh, Pennsylvania 15219-1410 (412) 562-8800 |
JoEllen Lyons Dillon Chief Legal Officer and Corporate Secretary The ExOne Company 127 Industry Boulevard North Huntingdon, Pennsylvania 15642 (724) 863-9663 |
Jonathan H. Talcott Nelson Mullins Riley & Scarborough LLP 101 Constitution Avenue, NW, Suite 900 Washington, DC 20001 (202) 712-2806 |
Approximate date of commencement of proposed sale to the public: As soon as practicable after the effective date of this registration statement.
If any of the securities being registered on this Form are to be offered on a delayed or continuous basis pursuant to Rule 415 under the Securities Act of 1933, as amended (the “Securities Act”), check the following box. ¨
If this Form is filed to register additional securities for an offering pursuant to Rule 462(b) under the Securities Act, please check the following box and list the Securities Act registration statement number of the earlier effective registration statement for the same offering. ¨
If this Form is a post-effective amendment filed pursuant to Rule 462(c) under the Securities Act, check the following box and list the Securities Act registration statement number of the earlier effective registration statement for the same offering. ¨
If this Form is a post-effective amendment filed pursuant to Rule 462(d) under the Securities Act, check the following box and list the Securities Act registration statement number of the earlier effective registration statement for the same offering. ¨
Indicate by check mark whether the registrant is a large accelerated filer, an accelerated filer, a non-accelerated filer or a smaller reporting company. See the definitions of “large accelerated filer,” “accelerated filer” and “smaller reporting company” in Rule 12b-2 of the Exchange Act. (Check one):
| Large accelerated filer | ¨ | Accelerated filer | ¨ | |||
| Non-accelerated filer | x (Do not check if a smaller reporting company) | Smaller reporting company | ¨ |
The Registrant is an “emerging growth company,” as defined in Section 2(a) of the Securities Act. This registration statement complies with the requirements that apply to an issuer that is an emerging growth company.
CALCULATION OF REGISTRATION FEE
|
| ||||||||
| Title of Each Class of Securities to be Registered |
Proposed Number of Shares to be Registered(1) |
Proposed Maximum Offering Price Per Share(2) |
Proposed Maximum Aggregate Offering Price(2) |
Amount of Registration Fee | ||||
| Common Stock, par value $0.01 per share |
3,054,400 | $65.03 | $198,627,632 | $27,092.81 | ||||
|
| ||||||||
|
| ||||||||
| (1) | Includes shares of common stock subject to an over-allotment option granted to the underwriters. |
| (2) | Estimated solely for the purpose of calculating the registration fee in accordance with Rule 457(c) of the Securities Act of 1933, as amended (the “Securities Act”), on the basis of the average of the high and low selling prices of the Registrant’s Common Stock reported on The NASDAQ Global Market as of a date (August 15, 2013) within five business days prior to filing this registration statement. |
The Registrant hereby amends this registration statement on such date or dates as may be necessary to delay its effective date until the Registrant shall file a further amendment which specifically states that this registration statement shall thereafter become effective in accordance with Section 8(a) of the Securities Act or until the registration statement shall become effective on such date as the Securities and Exchange Commission, acting pursuant to said Section 8(a), may determine.
Table of Contents
The information in this preliminary prospectus is not complete and may be changed. We may not sell these securities until the registration statement filed with the Securities and Exchange Commission is effective. This preliminary prospectus is not an offer to sell these securities and it is not soliciting an offer to buy these securities in any jurisdiction where the offer or sale is not permitted.
| PRELIMINARY PROSPECTUS | SUBJECT TO COMPLETION | DATED August 21, 2013 |
2,656,000 Shares

The ExOne Company
Common Stock
We are offering 1,106,000 shares of our common stock, and the selling stockholders are offering 1,550,000 shares of our common stock. We will not receive any proceeds from the sale of shares by our selling stockholders.
Our common stock is listed on The NASDAQ Global Market under the symbol “XONE.” As of August 20, 2013, the last reported sale price of our common stock on The NASDAQ Global Market was $69.29 per share.
Investing in our common stock involves a high degree of risk. Please read “Risk Factors” beginning on page 14 of this prospectus to read about the risks you should consider before investing.
We are an “emerging growth company” under the federal securities laws and will be subject to reduced public company reporting requirements. See “Prospectus Summary — Implications of Being an Emerging Growth Company.”
| Per Share | Total | |||||||
| Public offering price |
$ | $ | ||||||
| Underwriting discounts and commissions(1) |
$ | $ | ||||||
| Proceeds, before expenses, to us(2) |
$ | $ | ||||||
| Proceeds, before expenses, to selling stockholders(2) |
$ | $ | ||||||
| (1) | Please see “Underwriting” beginning on page 112 of this prospectus for additional information regarding the underwriting arrangement. |
| (2) | We estimate that we will incur offering expenses of approximately $ million in connection with the offering. The selling stockholders will each pay us their pro rata portion of the estimated expenses for the offering. |
Some of the selling stockholders have granted the underwriters an option, exercisable within 30 days of the date of this prospectus, to purchase a maximum of 398,400 additional shares of our common stock, at the public offering price, less the underwriting discount, to cover over-allotments of shares, if any. If the underwriters exercise their over-allotment option in full, then the proceeds before expenses will be $ to the selling stockholders.
Neither the Securities and Exchange Commission nor any state securities commission has approved or disapproved of these securities or determined if this prospectus is truthful or complete. Any representation to the contrary is a criminal offense.
The underwriters expect to deliver the shares of our common stock to purchasers against payment on or about , 2013.
FBR
The date of this prospectus is , 2013.
Table of Contents
| 1 | ||||
| 14 | ||||
| 28 | ||||
| 29 | ||||
| 29 | ||||
| 30 | ||||
| 30 | ||||
| 30 | ||||
| 31 | ||||
| 32 | ||||
| 34 | ||||
| MANAGEMENT’S DISCUSSION AND ANALYSIS OF FINANCIAL CONDITION AND RESULTS OF OPERATIONS |
37 | |||
| 63 | ||||
| 85 | ||||
| 97 | ||||
| 99 | ||||
| 102 | ||||
| 104 | ||||
| 106 | ||||
| 110 | ||||
| 112 | ||||
| 117 | ||||
| 120 | ||||
| 120 | ||||
| 120 | ||||
| F-1 |
We have not, and the underwriters have not, authorized anyone to provide you with any information other than that contained in this prospectus or in any free writing prospectus we may authorize to be delivered or made available to you. We take no responsibility for, and can provide no assurance as to the reliability of, any other information that others may give you. This prospectus may only be used where it is legal to offer and sell shares of our common stock. The information in this prospectus may be accurate only as of the date of this prospectus, regardless of the time of delivery of this prospectus or any sale of shares of our common stock. Our business, financial condition, results of operations and prospects may have changed since that date. We will update this prospectus as required by law. We are not, and the underwriters are not, making an offer of these securities in any jurisdiction where the offer is not permitted.
For investors outside the United States: Neither we nor the underwriters have done anything that would permit this offering or possession or distribution of this prospectus in any jurisdiction where action for that purpose is required, other than in the United States. Persons outside the United States who come into possession of this prospectus must inform themselves about, and observe any restrictions relating to, the offering of the shares of common stock and the distribution of this prospectus outside the United States.
We further note that the representations, warranties and covenants made by us in any agreement that is filed as an exhibit to the registration statement of which this prospectus is a part or to any document that is incorporated by reference herein were made solely for the benefit of the parties to such agreement, including, in some cases, for the purpose of allocating risk among the parties to such agreements, and should not be deemed to be a representation, warranty or covenant to you. Moreover, such representations, warranties or covenants were accurate only as of the date when made. Accordingly, such representations, warranties and covenants should not be relied on as accurately representing the current state of our affairs.
Table of Contents
This summary highlights selected information contained elsewhere in this prospectus. This summary is not complete and does not contain all of the information that is important to you or that you should consider before investing in our common stock. You should carefully read the entire prospectus, including the risk factors, financial data, and financial statements included herein, before making a decision about whether to invest in our common stock.
All financial information includes The ExOne Company and its wholly-owned subsidiaries, ExOne Americas LLC (United States), ExOne GmbH (Germany) and Ex One KK (Japan). All financial information for periods prior to January 1, 2013 is of The Ex One Company, LLC, our predecessor company, and its subsidiaries, and all financial information for periods prior to March 27, 2013 include variable interest entities, Troy Metal Fabricating, LLC (“TMF”) and Lone Star Metal Fabrication, LLC (“Lone Star”). Unless the context requires otherwise or we specifically indicate otherwise, the information in this prospectus assumes that the underwriters do not exercise their over-allotment option. As used in this prospectus, unless the context otherwise requires or indicates, the terms “ExOne,” “our Company,” “the Company,” “we,” “our,” “ours,” and “us” refer to The ExOne Company and its wholly-owned subsidiaries.
Overview
The Company
We are a global provider of three dimensional (“3D”) printing machines and printed products, materials and other services to industrial customers. Our business primarily consists of manufacturing and selling 3D printing machines and printing products to specification for our customers using our in-house 3D printing machines. We offer pre-production collaboration and print products for customers through our six production service centers (“PSCs”), which are located in the United States, Germany and Japan. We build 3D printing machines at our facilities in the United States and Germany. We also supply the associated materials, including consumables and replacement parts, and other services, including training and technical support, necessary for purchasers of our machines to print products. We believe that our ability to print in a variety of industrial materials, as well as our industry-leading printing capacity (as measured by build box size and printhead speed), uniquely position us to serve the needs of industrial customers.
Our 3D printing machines use our binder jetting technology, powdered materials, chemical binding agents and integrated software to print 3D products directly from computer models by repeatedly depositing very thin layers of powdered materials and selectively placing chemical binding agents to form the printed product. One of our key industry advantages is that our machines are able to print products in materials which are desired by industrial customers. Currently, our 3D printing machines are able to manufacture casting molds and cores from specialty silica sand and ceramics, which are the traditional materials for these casting products. Of equal importance, our 3D printing machines are capable of direct product materialization by printing in industrial metals, including stainless steel, bronze, iron, and bonded tungsten. We are in varying stages of qualifying additional industrial materials for printing, such as titanium, tungsten carbide, aluminum, and magnesium, and our current material development plan calls for an additional industrial material to be qualified every six months.
We believe that we are a leader in providing 3D printing machines, 3D printed products, materials and other services to industrial customers in the aerospace, automotive, heavy equipment, energy/oil/gas and other industries. In an effort to further solidify this position, the net proceeds from our initial public offering have been earmarked or spent in order to (1) expand our PSC network to fifteen global locations by the end of 2015, (2) increase capacity and upgrade technology in our production facilities in Germany, including consolidating our operations from five buildings located throughout the district of Augsburg to one purpose-built facility, (3) expand our materials development initiatives and achieve our plan of one new industrial material
1
Table of Contents
qualified every six months, (4) select and deploy an Enterprise Resource Planning (“ERP”) system to promote operational efficiency and financial controls globally, (5) payoff existing debt, and (6) deploy working capital to support growth. These uses of proceeds and priorities are consistent with the plan outlined by us during our initial public offering and communicated to our stockholders thereafter. See “Management’s Discussion and Analysis of Financial Condition and Results of Operations — Recent Developments.”
Our revenue growth is driven by increasing customer acceptance of our 3D printing technology. We believe that we can accelerate customer adoption of our technology by delivering turnkey 3D printing services and products, from design through part completion. In developing our next generation 3D printing machine platforms, we successfully focused on achieving the volumetric output rate demanded by our industrial customers. Our refined strategic focus emphasizes all phases of the production cycle, notably enhancements to pre-print, such as Computer Aided Design (“CAD”), simulation, and design optimization, as well as post-print processing, including metal finishing technologies and precision casting capabilities. We are exploring a combination of acquisitions, strategic investments, and/or alliances, some of which we believe will promote advances in pre-print and post-print processing. We intend to use part or all of the proceeds from this offering in order to achieve these and other objectives and for working capital and general corporate purposes to maximize and attain our growth potential. See “Use of Proceeds.”
Our revenues for the six months ended June 30, 2013 were $17.2 million compared to $7.4 million for the six months ended June 30, 2012, and our revenues for the year ended December 31, 2012 were $28.7 million, as compared to $15.3 million for 2011 and $13.4 million for 2010. Our Adjusted EBITDA for the six months ended June 30, 2013 was ($1.2) million as compared to ($3.6) million for the six months ended June 30, 2012, and our Adjusted EBITDA for the year ended December 31, 2012 was ($6.4) million, as compared to ($4.0) million for 2011 and ($3.0) million for 2010. See notes to the table set forth in “Summary Consolidated Financial Data” for a reconciliation of Adjusted EBITDA to net loss attributable to ExOne.
In the six months ended June 30, 2013, we sold nine machines (six S-Max, one S-Print, one M-Lab and one Orion) compared to one machine (S-Max) in the six months ended June 30, 2012. In 2012 we sold thirteen machines (nine S-Max, three S-Print and one S-15) compared to five machines (two S-15, one S-Max, one S-Print and one Other) in 2011 and five machines (two S-15, two S-Max and one Other) in 2010.
We conduct a significant portion of our business with a limited number of customers. During the six months ended June 30, 2013 and 2012, we had two customers and one customer, respectively, that each individually represented 10.0% or greater of total revenue. There were no customers for the year ended December 31, 2012 which individually represented 10.0% or greater of total revenue. During the years ended December 31, 2011 and 2010 we had one customer and three customers, respectively, which individually represented 10.0% or greater of total revenue. Our top five customers represented approximately 45.7% and 37.6% of total revenue for the six months ended June 30, 2013 and 2012, respectively, and approximately 31.7%, 40.9%, and 48.7% of total revenue for the years ended December 31, 2012, 2011, and 2010, respectively. For each of the respective periods, these customers primarily purchased 3D printing machines. Sales of 3D printed products, materials and other services tend to be from repeat customers that may utilize the capability of our PSCs for three months or longer. Sales of 3D printing machines are low volume and generate significant revenue but the same customers do not necessarily buy machines in each period. Timing of customer purchases is dependent on the customer’s capital budgeting cycle, which may vary from period to period. The nature of the revenue from 3D printing machines, as described above, does not leave us dependent upon a single or a limited number of customers. Rather, the timing of the sales can have a material effect on period to period financial results.
2
Table of Contents
Our History
Our business began as the advanced manufacturing business of Extrude Hone Corp., which manufactured its first 3D printing machine in 2003 using licensed technology developed by researchers at the Massachusetts Institute of Technology (“MIT”). In 2005, our business assets were transferred to The Ex One Company, LLC, a Delaware limited liability company, when Extrude Hone Corp. was purchased by another company. In 2007, we were acquired by S. Kent Rockwell through his wholly-owned company Rockwell Forest Products, Inc. (“RFP”). On January 1, 2013, The Ex One Company, LLC was merged with and into a newly created Delaware corporation, which changed its name to The ExOne Company (the “Reorganization”). On February 12, 2013, we completed our initial public offering of our common stock, raising approximately $90.4 million in net proceeds after expenses to us.
Recent Developments
On July 23, 2013, we announced that we have added iron infiltrated with bronze as a new 3D printing material. We believe that the addition of iron to our metal portfolio will be well received by customers in the traditional market for iron. We prioritized our development of iron infiltrated with bronze as a result of general customer interest and the breadth of the manufacturing market. Iron is widely used in the manufacturing of machine tools, automotive parts and general support structures. Manufacturing iron-based products using our 3D printing technology allows for the direct creation of more intricate products than traditional manufacturing processes, and creates a more cost effective alternative to current 3D printing materials such as stainless steel. Additionally, we announced that we have added phenolic and sodium silicate to our suite of binders for use in our 3D printing process. Phenolic binder, used with ceramic sand in the 3D printing of molds and cores, offers customers three benefits: (i) casting higher heat alloys; (ii) creating a higher strength mold or core; and (iii) improving the quality of the casting due to reduced expansion of the mold or core. These capabilities address challenges faced by the automotive, aviation, hydraulic/heavy equipment and pump industries. We believe that the use of sodium silicate will reduce or eliminate the release of fumes and gas in the casting process, helping to reduce costs associated with air ventilation, and electrical and maintenance equipment, which we believe will appeal to casting houses that are in search of cleaner environmental processes.
We also announced on July 31, 2013 that we opened a new PSC in Auburn, Washington to be cost competitive and meet customer demand in the Puget Sound region. The new PSC is an 11,600 square foot leased facility in which we will print molds and cores for foundries in the northwestern U.S. corridor. Full operations are expected to commence in September 2013. This is our sixth PSC worldwide. We also announced that we opened new sales centers in Sao Paulo, Brazil and Shanghai, China using the resources of the Association for Manufacturing Technology, which provides global support to U.S. manufacturers through its technical centers and representative offices in numerous global locations. We expect our sales representatives in each office to focus on targeting customers well suited for our 3D printing technology and to focus on furthering the reach of our expanding sales network in South America and China. Our sales centers are intended to serve as a preliminary step in establishing increased PSC activity in 2014.
On August 1, 2013, we entered into an agreement for the purchase of land in Gersthofen, Germany, in the district of Augsburg to build a new facility. The facility will comprise production, warehouse, service, office and research and development space. On August 14, 2013, we engaged a turnkey provider of construction services for the design and construction of the facility. We intend to consolidate our five existing leased facilities in Augsburg into the new facility, providing expansion capacity to support our global growth strategy.
On August 8, 2013, we announced that we have added bonded tungsten as a new 3D printing material to be used in the design of products to be used in protecting people and their environments from the harmful effects of ionizing radiation.
3
Table of Contents
The Additive Manufacturing Industry and 3D Printing
3D printing is the most common type of an emerging manufacturing technology broadly referred to as additive manufacturing (“AM”). In general, AM is a term used to describe a manufacturing process that produces 3D objects directly from digital or computer models through the repeated deposit of very thin layers of material. 3D printing is the process of joining materials from a digital 3D model, usually layer by layer, to make objects using a printhead, nozzle or other printing technology. The terms “AM” and “3D printing” are increasingly being used interchangeably as the media and marketplace have popularized the term 3D printing rather than AM, the industry term.
AM represents a transformational shift from traditional forms of manufacturing (e.g., machining or tooling), sometimes referred to as subtractive manufacturing. We believe that AM and 3D printing are poised to displace traditional manufacturing methodologies in a growing range of industrial applications. Our 3D printing process differs from other forms of 3D printing processes in that we use a chemical binding agent and focus on industrial products and materials.
ExOne and 3D Printing
We provide 3D printed products, materials and other services primarily to industrial customers and end-market users. We believe that we are an early entrant into the AM industrial products market and are one of the few providers of 3D printing solutions to industrial customers in the aerospace, automotive, heavy equipment and energy/oil/gas industries.
Our binder jetting 3D printing technology was developed over 15 years ago by researchers at MIT. Our machines build or print products from CAD by depositing successive thin layers of particles of materials such as silica sand or metal powder in a “build box.” A moveable printhead passes over each layer and deposits a chemical binding agent in the selected areas where the finished product will be materialized. Each layer can be unique.
Depending on the industrial material used in printing, printed products may need post-production processing. We generally use silica sand or foundry sand for casting, which requires no additional processing. Products printed in other materials, such as glass or metals, need varying amounts of heat treating or other post-processing.
Our Competitive Strengths
We believe that our competitive strengths include:
| • | Volumetric Output Rate. We believe that our 3D printing machines provide us the highest rate of volume output per unit of time among competing AM technologies. Because of our early entrance into the industrial market for AM and our investment in our core 3D printing technology, we have been able to improve the printhead speed and build box size of our machines. As a result, we have made strides in improving the output efficiency of our machines, as measured by volume output per unit of time. For example, the machine cost per cubic inch for our mid-size Flex machine is approximately 5% of the comparable machine cost of its predecessor, the R 2, assuming a constant 80% utilization rate over a five-year period. With continued advances in our core 3D printing technologies, we believe that our cost of production will continue to decline, increasing our ability to compete with subtractive manufacturing processes, particularly for complex products, effectively expanding our addressable market. |
| • | Printing Platform Size. The size of the build box area and the platform upon which we construct a product is important to industrial customers, who may want to either make a high number of products |
4
Table of Contents
| per job run or make an industrial product that has large dimensions and is heavy in final form. The 1,260-liter platform for our S-Max machine is one of the largest commercially available 3D printing build platforms. We believe that our technology and experience give us the potential to develop even larger build platforms to meet the production demands of current and potential industrial customers. In addition, we have created machine platforms in four size ranges in order to cater to the varying demands of our customers. Our two largest platforms, the Max and Print machines, are differentiated from the machines of our competitors in their ability to print in an industrial size and scale. Our M-Lab size platform provides a small build box for lab work and experimentation. |
| • | Industrial Material. Currently, our 3D printing machines are able to manufacture casting molds and cores from specialty silica sand and ceramics, which are the traditional materials for these casting products. Of equal importance, our 3D printing machines are also capable of direct product materialization by printing in industrial metals, including stainless steel, bronze, iron, and bonded tungsten. We are in varying stages of qualifying additional industrial materials for printing, such as titanium, tungsten carbide, aluminum, and magnesium. There is significant demand for products made of these materials. Many AM companies, however, cannot print industrial products in these materials and focus instead on polymer applications. |
| • | Chemical Binding. We use liquid chemical binding agents during the printing process. We believe that our unique chemical binding agent technology can more readily achieve efficiency gains over time than other AM technologies, such as laser-fusing technologies. For instance, in order to increase the print speed of laser-based technologies, another expensive industrial laser must be added to the manufacturing process, raising the unit cost of production. |
| • | International Presence. Since our inception, we have structured our business to cater to major international markets. We have established one or more PSCs in each of North America, Europe, and Asia. Because many of our current or potential customers are global industrial companies, it is important that we have a presence in or near the areas where these companies have manufacturing facilities. |
| • | Co-location of High Value Production. Over the last few years, many U.S. industrial manufacturers have outsourced product supply or otherwise created long, relatively inflexible supply chains for their high-complexity, high-value products. We believe that over the next few years, many of these companies will need to build these products in the United States, near their main manufacturing facilities, in order to be competitive nationally and internationally. We believe we are well positioned to help these manufacturers co-locate the production of products so as to optimize our customers’ supply chains. |
Our Business Strategy
The principal elements of our growth strategy include:
| • | Expand the Network of Production Service Centers. Our PSCs provide a central location for customer collaboration and provide customers with a direct contact point to learn about our 3D printing technology, buy products printed by us, and purchase our machines. By the end of 2015, we plan to expand our PSC network from the current six locations to fifteen locations. Like our current PSCs, we plan to locate the additional PSCs in major industrial centers near existing and potential customers. While we may adjust the final locations based upon market considerations, our 2013 plan includes announcing the opening of an additional location in the United States in addition to the recent Auburn, Washington announcement. Our current plan also includes opening two or more additional locations in the first half of 2014. |
5
Table of Contents
| • | Qualify New Industrial Materials Printable In Our Systems. Currently, our 3D printing machines are capable of printing in silica sand, ceramics, stainless steel, bronze, iron, bonded tungsten, and glass, and we are in varying stages of qualifying additional industrial materials for printing, such as titanium, tungsten carbide, aluminum, and magnesium. By expanding into these other materials, we believe we can expand our market share and better serve our industrial customer base. We established ExOne Materials Application Laboratory (“ExMAL”), which focuses on materials testing. We believe ExMAL will assist us in increasing the rate at which we are able to qualify new materials. ExMAL is led by our Chief Technology Officer, Rick Lucas, whose background includes experience in materials testing and certification. See “Management — Executive Officers and Directors.” |
| • | Increase the Efficiency of Our Machines to Expand the Addressable Market. We intend to invest in further developing our machine technology so as to increase the volume output per unit time that our machines can produce. In 2011, we began selling a new second generation mid-sized platform, the S-Print machine. In addition, we are marketing our new M-Flex machine, and we have a signed purchase order to deliver our first unit in the third quarter of 2013. See “Business — Our Machines and Machine Platforms.” In both cases, the new machines are designed to increase the volume output per unit of time through advances in printhead speed and build box size. Achieving improved production speed and efficiency will expand our potential market for our machines and for products made in our PSCs. |
| • | Focus Upon Customer Training and Education to Promote Awareness. We use our regional PSCs to educate our potential customers. In addition, we have supplied 3D printing equipment to more than 20 universities and research institutions, in hopes of expanding the base of future adopters of our technology. We established the ExOne Training and Education Center (“ExTEC”) in our North Huntingdon, Pennsylvania headquarters. At ExTEC, technicians guide our current and prospective customers in the optimal use of 3D printing and customers gain digital access to our 3D printing knowledge database as it continues to evolve. We make ExTEC accessible to universities, individual customers, employees/trainees, designers, engineers, and others interested in 3D printing. We will continue to educate the marketplace about the advantages of 3D printing. |
| • | Achieve Revenue Balance and Geographic Diversification. Over the long-term, our goal is to balance revenue between machine sales and PSC production, service contracts, and consumables. Machine sales tend to be seasonal, less predictable, and generally more heavily impacted by the macroeconomic cycle, as compared to PSC production, service contracts, and consumables. As we sell more machines, the machine sales portion of our business will be supplemented by related sales of service, replacement parts, and consumables. To avoid being overly dependent on economic conditions in one part of the world, we intend to develop our customer base so that our revenues are balanced across the Americas, Europe, and Asia. As overall revenues increase, maintaining this balance will largely be achieved by targeting specific customers and industries for machine sales and by establishing PSCs in each of our key regions. |
| • | Advance Pre-Print Design and Post-Print Processing Capabilities to Accelerate the Growth of Our 3D Printing Technology. Our next generation 3D printing machine platforms have achieved the volumetric output rate and quality necessary to serve industrial markets on a production scale. We believe that there is an opportunity to similarly advance the pre-print and post-print processing phases of product materialization to more fully exploit the transformative power of our 3D printing machines and drive growth. These opportunities relate to both direct and indirect part materialization. For direct metal production, we believe that enhancing pre-print processes, notably design optimization tools and suitable print material availability, can greatly accelerate our capture of market share in the near-term. Additionally, enhancements to post-print processing will increase the applications for printed products. Through ExMAL, we are developing post-print processing technologies to achieve fully dense metal product materialization without the need for infiltration, and we are exploring technology sharing partnerships to further this initiative. In indirect production utilizing 3D printed molds and cores, advanced performance casting technologies can be leveraged to increase yields and reduce weight of casted products. To address the market opportunity and fill |
6
Table of Contents
| the execution gap, we have developed a suite of processes, many of which are proprietary, for producing high-quality castings through a process that we call ExCAST. ExCAST provides industry guidance and support through all stages of production, from CAD at the design stage, through the 3D materialization of molds and cores, metal casting of the end product and rapid delivery to the end-user. |
| • | Pursue Growth Opportunities Through Acquisitions, Alliances, and/or Strategic Investments. We intend to opportunistically identify and, through acquisitions, alliances and/or strategic investment, integrate and advance complementary businesses, technologies and capabilities. Our goal is to expand the functionality of our products, provide access to new customers and markets, and increase our production capacity. We are in active discussions with parties that we believe can contribute to a superior end-to-end manufacturing process. |
Selling Stockholders
As of June 30, 2013, S. Kent Rockwell, our Chairman and Chief Executive Officer, beneficially owned 37.1% of our common stock through his indirect, sole ownership of two entities: RFP and Rockwell Holdings, Inc. (“RHI”). On August 20, 2013, RHI gifted 450,000 shares of our common stock that it owned to the Rockwell Holdings, Inc. Charitable Remainder Unitrust (the “Lafayette Trust”). The Lafayette Trust is an irrevocable trust, of which Lafayette College is the sole trustee. See “Certain Relationships and Related Party Transactions.”
Following the closing of this offering, Mr. Rockwell is expected to beneficially own 23.50% of our common stock (22.02% if the underwriters exercise the over-allotment option in full).
The underwriters have also agreed to include a limited number of shares to be sold by certain members of our management team in the over-allotment option as described in “Selling Stockholders.” The selling stockholders will pay their pro rata portion of the estimated expenses for the offering. To the extent the actual expenses of the offering exceed estimated expenses, we will bear the additional expense.
Risks Affecting Us
We are subject to numerous risks, including risks that may prevent us from achieving our business objectives or may adversely affect our business, financial condition, results of operations, cash flows and prospects. Please read the section entitled “Risk Factors” beginning on page 14 of this prospectus for a discussion of some of the factors you should carefully consider before deciding to invest in our common stock.
Corporate Information
Our principal executive offices are located at 127 Industry Boulevard, North Huntingdon, Pennsylvania 15642, and our telephone number is (724) 863-9663. Our corporate website address is www.exone.com. The information contained on, or accessible from, our corporate website is not part of this prospectus and you should not consider information contained on our website to be a part of this prospectus or in deciding whether to purchase our common stock.
7
Table of Contents
Implications of Being an Emerging Growth Company
As a company with less than $1.0 billion in revenue during our last fiscal year, we qualify as an “emerging growth company” as defined in the Jumpstart Our Business Startups Act of 2012, or the JOBS Act. An emerging growth company may take advantage of specified reduced reporting requirements and is relieved of certain other significant requirements that are otherwise generally applicable to public companies. As an emerging growth company:
| • | we are exempt from the requirement to obtain an attestation and report from our auditors on the assessment of our internal control over financial reporting pursuant to the Sarbanes-Oxley Act of 2002 (the “Sarbanes-Oxley Act”); |
| • | we are permitted to provide less extensive disclosure about our executive compensation arrangements; |
| • | we are not required to give our stockholders non-binding advisory votes on executive compensation or golden parachute arrangements; and |
| • | we have elected to use an extended transition period for complying with new or revised accounting standards. |
We may take advantage of these provisions for up to five years or such earlier time that we are no longer an emerging growth company. We would cease to be an emerging growth company if we have more than $1.0 billion in annual revenues, qualify as a “large accelerated filer” under the Securities Exchange Act of 1934, as amended (which requires us to have more than $700 million in market value of our common stock held by non-affiliates), or issue more than $1.0 billion of non-convertible debt over a three-year period. We may choose to take advantage of some but not all of these reduced burdens.
8
Table of Contents
The Offering
| Common stock offered by us in primary offering | 1,106,000 shares. | |
| Common stock offered by the selling stockholders in the primary offering |
1,550,000 shares in the aggregate offered by RFP, RHI and the Lafayette Trust. See “Selling Stockholders.” | |
| Additional shares of common stock offered by selling stockholders if over-allotment option exercised in full | 213,400 shares offered by RFP and 185,000 shares in the aggregate offered by the management selling stockholders. See “Selling Stockholders.” | |
| Common stock to be outstanding after the offering | 14,387,608 shares. | |
| Common stock beneficially owned by S. Kent Rockwell after the offering | 3,381,027 shares (3,167,627 shares if the underwriters exercise the over-allotment option in full). | |
| Use of proceeds | We estimate that the net proceeds to us from this offering, after deducting underwriters’ discounts and commissions and our estimated offering expenses, will be approximately $ million. We will not receive any proceeds from the sale of common stock by the selling stockholders. We intend to use the net proceeds from this offering to finance future acquisitions or partnerships and alliances consistent with our business strategy and for working capital and general corporate purposes. | |
| Over-allotment option | RFP, and Messrs. Burns, Hoechsmann, Irvin and Lucas have granted the underwriters a 30-day option to purchase a maximum of 398,400 additional shares of our common stock at the public offering price to cover over-allotments. | |
| Risk factors | You should consider carefully all of the information set forth in this prospectus and, in particular, the specific factors set forth under “Risk Factors” on page 14 of this prospectus, before deciding whether to invest in our common stock. | |
| Dividend policy | We have not historically paid dividends and we do not intend to declare or pay regular dividends on our common stock in the foreseeable future. | |
| NASDAQ Global Market symbol | XONE | |
9
Table of Contents
Unless otherwise indicated, all information in this prospectus excludes:
(i) 500,000 shares of common stock reserved for issuance under our 2013 Equity Incentive Plan (the “Plan”). The Plan provides for automatic increases in the reserve available annually on January 1 from 2014 through 2023 equal to the lesser of (i) 3.0% of the total outstanding shares of common stock as of December 31 of the immediately preceding year or (ii) a number of shares of common stock determined by our Board of Directors, provided that the maximum number of shares authorized under the Plan will not exceed 1,992,242 shares, subject to certain adjustments.
(ii) Options to certain employees to purchase 175,000 shares of common stock issuable upon exercise of such options as of June 30, 2013, at an exercise price of $18.00 per share, which vest in equal annual installments over three years from the date of grant.
(iii) 20,000 shares of restricted stock that were unvested as of June 30, 2013.
10
Table of Contents
Summary Consolidated Financial Data
(dollars in thousands, except per-share amounts)
The following tables set forth certain of our summary consolidated financial data for the periods represented. The financial data as of June 30, 2013, and for the quarter and six months ended June 30, 2013 and 2012 have been derived from our unaudited condensed consolidated financial statements and notes thereto. The financial data as of and for the years ended December 31, 2012, 2011 and 2010 have been derived from our audited consolidated financial statements and notes thereto. We have prepared the unaudited consolidated financial information set forth below on the same basis as our audited consolidated financial statements and have included all adjustments, consisting of only normal recurring adjustments, that we consider necessary for a fair presentation of our financial position and results of operations for such periods. The interim results set forth below are not necessarily indicative of expected results for the year ending December 31, 2013 or for any other future period.
The data presented below should be read in conjunction with, and are qualified in their entirety by reference to “Capitalization,” “Selected Consolidated Financial Data,” “Management’s Discussion and Analysis of Financial Condition and Results of Operations” and our consolidated financial statements and the related notes included elsewhere in this prospectus.
| Quarter Ended June 30, |
Six Months Ended June 30, |
Year Ended December 31, |
||||||||||||||||||||||||||||||
| 2013 | 2012 | 2013 | 2012 | 2012 | 2011 | 2010 | ||||||||||||||||||||||||||
| (unaudited) |
(unaudited) | |||||||||||||||||||||||||||||||
| Statement of consolidated operations and comprehensive loss data: |
||||||||||||||||||||||||||||||||
| Revenue |
$ | 9,230 | $ | 4,676 | $ | 17,164 | $ | 7,398 | $ | 28,657 | $ | 15,290 | $ | 13,440 | ||||||||||||||||||
| Gross profit |
$ | 4,181 | $ | 1,523 | $ | 7,019 | $ | 2,339 | $ | 12,143 | $ | 3,643 | $ | 3,066 | ||||||||||||||||||
| Research and development |
$ | 1,276 | $ | 348 | $ | 2,132 | $ | 832 | $ | 1,930 | $ | 1,531 | $ | 1,153 | ||||||||||||||||||
| Selling, general and administrative* |
$ | 3,908 | $ | 4,262 | $ | 7,476 | $ | 5,948 | $ | 18,285 | $ | 7,286 | $ | 5,978 | ||||||||||||||||||
| Interest expense |
$ | 50 | $ | 110 | $ | 280 | $ | 308 | $ | 842 | $ | 1,570 | $ | 1,114 | ||||||||||||||||||
| Net loss attributable to ExOne* |
$ | (1,120 | ) | $ | (3,609 | ) | $ | (3,034 | ) | $ | (5,138 | ) | $ | (10,168 | ) | $ | (8,037 | ) | $ | (5,508 | ) | |||||||||||
| Net loss attributable to ExOne per common share: |
||||||||||||||||||||||||||||||||
| Basic |
$ | (0.08 | ) | N/A | ** | $ | (0.27 | ) | N/A | ** | N/A | ** | N/A | ** | N/A | ** | ||||||||||||||||
| Diluted |
$ | (0.08 | ) | N/A | ** | $ | (0.27 | ) | N/A | ** | N/A | ** | N/A | ** | N/A | ** | ||||||||||||||||
| * | Selling, general and administrative expense and net loss attributable to ExOne include $200 and $1,785 in equity-based compensation expense for the quarters ended June 30, 2013 and 2012, respectively. Selling, general and administrative expense and net loss attributable to ExOne include $311 and $1,785 in equity-based compensation expense for the six months ended June 30, 2013 and 2012, respectively. Selling, general and administrative expense and net loss attributable to ExOne includes $7,735 in equity-based compensation expense for the year ended December 31, 2012. There was no equity-based compensation expense recorded during 2011 or 2010. |
| ** | Amounts are not comparable as a result of our Reorganization as a corporation on January 1, 2013. |
11
Table of Contents
| June 30, 2013 |
December 31, | |||||||||||||||
| 2012 | 2011 | 2010 | ||||||||||||||
| (unaudited) | ||||||||||||||||
| Consolidated balance sheets data: |
||||||||||||||||
| Working capital (deficit) |
$ | 72,675 | $ | (4,682 | ) | $ | (979 | ) | $ | (13,253 | ) | |||||
| Cash and cash equivalents |
$ | 64,550 | $ | 2,802 | $ | 3,496 | $ | 1,021 | ||||||||
| Property and equipment — net |
$ | 14,309 | $ | 12,467 | $ | 7,919 | $ | 7,990 | ||||||||
| Total assets |
$ | 96,118 | $ | 33,075 | $ | 18,615 | $ | 15,233 | ||||||||
| Line of credit |
$ | — | $ | 528 | $ | — | $ | — | ||||||||
| Demand note payable to member |
$ | — | $ | 8,666 | $ | — | $ | 15,045 | ||||||||
| Long-term debt and lease obligations |
$ | 3,499 | $ | 10,566 | $ | 5,429 | $ | 3,839 | ||||||||
| Redeemable preferred units |
$ | — | $ | — | $ | 18,984 | $ | — | ||||||||
| Preferred units |
$ | — | $ | 18,984 | $ | — | $ | — | ||||||||
| Common units |
$ | — | $ | 10,000 | $ | 10,000 | $ | 10,000 | ||||||||
| Common stock |
$ | 133 | $ | — | $ | — | $ | — | ||||||||
| Additional paid-in capital |
$ | 88,026 | $ | — | $ | — | $ | — | ||||||||
| Total stockholders’ / members’ equity (deficit) |
$ | 84,194 | $ | 41 | $ | (15,599 | ) | $ | (8,277 | ) | ||||||
| Six Months Ended June 30, |
Year Ended December 31, |
|||||||||||||||||||
| 2013 | 2012 | 2012 | 2011 | 2010 | ||||||||||||||||
| (unaudited) | ||||||||||||||||||||
| Statement of consolidated cash flows data: |
||||||||||||||||||||
| Cash used for operating activities |
$ | (7,133 | ) | $ | (7,498 | ) | $ | (9,803 | ) | $ | (2,436 | ) | $ | (5,912 | ) | |||||
| Cash used for investing activities |
$ | (3,875 | ) | $ | (1,518 | ) | $ | (1,724 | ) | $ | (1,080 | ) | $ | (1,795 | ) | |||||
| Cash provided by financing activities |
$ | 72,882 | $ | 6,142 | $ | 11,003 | $ | 5,931 | $ | 7,811 | ||||||||||
| Other data: |
||||||||||||||||||||||||||||
| Quarter Ended June 30, |
Six Months Ended June 30, |
Year Ended December 31, |
||||||||||||||||||||||||||
| 2013 | 2012 | 2013 | 2012 | 2012 | 2011 | 2010 | ||||||||||||||||||||||
| (unaudited) | (unaudited) | (unaudited) | (unaudited) | (unaudited) | ||||||||||||||||||||||||
| Machine units sold: |
||||||||||||||||||||||||||||
| S-15 |
— | — | — | — | 1 | 2 | 2 | |||||||||||||||||||||
| S-Max |
4 | 1 | 6 | 1 | 9 | 1 | 2 | |||||||||||||||||||||
| S-Print |
— | — | 1 | — | 3 | 1 | — | |||||||||||||||||||||
| M-Lab |
— | — | 1 | — | — | — | — | |||||||||||||||||||||
| Orion |
— | — | 1 | — | — | — | — | |||||||||||||||||||||
| Other |
— | — | — | — | — | 1 | 1 | |||||||||||||||||||||
|
|
|
|
|
|
|
|
|
|
|
|
|
|
|
|||||||||||||||
| Total |
4 | 1 | 9 | 1 | 13 | 5 | 5 | |||||||||||||||||||||
|
|
|
|
|
|
|
|
|
|
|
|
|
|
|
|||||||||||||||
| Adjusted EBITDA* |
$ | (279 | ) | $ | (2,666 | ) | $ | (1,182 | ) | $ | (3,636 | ) | $ | (6,389 | ) | $ | (4,004 | ) | $ | (2,993 | ) | |||||||
| * | We define Adjusted EBITDA (earnings before interest, taxes, depreciation and amortization) as net income (loss) attributable to ExOne (as calculated under accounting principles generally accepted in the United States of America (“GAAP”)) plus net income (loss) of noncontrolling interests, provision (benefit) for income taxes, interest expense, depreciation, equity-based compensation associated with our 2013 Equity Incentive Plan and |
12
Table of Contents
| other (income) expense — net. Disclosure in this prospectus of Adjusted EBITDA, which is a non-GAAP financial measure, as defined under the rules of the U.S. Securities and Exchange Commission (“SEC”), is intended as a supplemental measure of our performance that is not required by, or presented in accordance with, GAAP. Adjusted EBITDA should not be considered as an alternative to net income (loss) attributable to ExOne or any other performance measure derived in accordance with GAAP. Our presentation of Adjusted EBITDA should not be construed to imply that our future results will be unaffected by unusual or non-recurring items. |
We believe Adjusted EBITDA is meaningful to our investors to enhance their understanding of our financial performance. Although Adjusted EBITDA is not necessarily a measure of our ability to fund our cash needs, we understand that it is frequently used by securities analysts, investors and other interested parties as a measure of financial performance and to compare our performance with the performance of other companies that report Adjusted EBITDA. Our calculation of Adjusted EBITDA may not be comparable to similarly titled measures reported by other companies.
Reconciliation of Adjusted EBITDA to Net loss attributable to ExOne:
| Quarter Ended June 30, |
Six Months Ended June 30, |
Year Ended December 31, |
||||||||||||||||||||||||||
| 2013 | 2012 | 2013 | 2012 | 2012 | 2011 | 2010 | ||||||||||||||||||||||
| (unaudited) | (unaudited) | (unaudited) | (unaudited) | (unaudited) | (unaudited) | (unaudited) | ||||||||||||||||||||||
| Net loss attributable to ExOne |
$ | (1,120 | ) | $ | (3,609 | ) | $ | (3,034 | ) | $ | (5,138 | ) | $ | (10,168 | ) | $ | (8,037 | ) | $ | (5,508 | ) | |||||||
| Net income attributable to noncontrolling interests |
— | 148 | 138 | 182 | 480 | 420 | 328 | |||||||||||||||||||||
| Interest expense |
50 | 110 | 280 | 308 | 842 | 1,570 | 1,114 | |||||||||||||||||||||
| Provision for income taxes |
72 | 246 | 91 | 234 | 995 | 1,031 | 198 | |||||||||||||||||||||
| Depreciation |
524 | 421 | 1,096 | 805 | 1,683 | 1,170 | 1,072 | |||||||||||||||||||||
| Equity-based compensation* |
200 | — | 311 | — | — | — | — | |||||||||||||||||||||
| Other (income) expense — net |
(5 | ) | 18 | (64 | ) | (27 | ) | (221 | ) | (158 | ) | (197 | ) | |||||||||||||||
|
|
|
|
|
|
|
|
|
|
|
|
|
|
|
|||||||||||||||
| Adjusted EBITDA |
$ | (279 | ) | $ | (2,666 | ) | $ | (1,182 | ) | $ | (3,636 | ) | $ | (6,389 | ) | $ | (4,004 | ) | $ | (2,993 | ) | |||||||
|
|
|
|
|
|
|
|
|
|
|
|
|
|
|
|||||||||||||||
| * | As noted above, amounts reflected for equity-based compensation relate solely to expense incurred in connection with equity-based awards granted under our 2013 Equity Incentive Plan. During both the quarter and six months ended June 30, 2012, we incurred $1,785 of equity-based compensation expense related to the sale of common units by the majority member of the former limited liability company to another existing member of the former limited liability company. During the year ended December 31, 2012, we incurred $7,735 of equity-based compensation expense related to the sale of common units by the majority member of the former limited liability company to other existing members of the former limited liability company. As these transactions are not a part of our 2013 Equity Incentive Plan, we have elected not to consider the related equity-based compensation in measuring Adjusted EBITDA for the respective 2012 periods. There was no equity-based compensation expense recorded by ExOne during 2011 or 2010. |
13
Table of Contents
An investment in our common stock involves risks. You should carefully consider each of the following risks and all of the information set forth in this prospectus before deciding to invest in our common stock. The risks and uncertainties described below are not the only ones we face. If any of the following risks and uncertainties develops into actual events, our business, financial condition, results of operations and cash flows could be materially adversely affected. In that case, the price of our common stock could decline and you may lose all or part of your investment.
Risks Related to Our Business and Industry
We may not be able to significantly increase the number of materials in which we can print products fast enough to meet our business plan.
Our business plan is heavily dependent upon our ability to steadily increase the number of qualified materials in which our machines can print products, because this will increase our addressable market, both as to customers and products for customers. However, qualifying new materials is a complicated engineering task, and there is no way to predict whether, or when, any given material will be qualified. If we cannot hire people with sufficient technical skills to work on qualifying new materials for printing, or if we lack the resources necessary to create a steady flow of new materials, we will not be able to meet our business plan goals and a competitor may emerge that is better at qualifying new materials, either of which would have an adverse effect on our business results.
Our future success in qualifying new materials for printing may attract more competitors into our markets, some which may be much larger than we are.
If we succeed in qualifying a growing number of materials for use in our 3D printing machines, that will increase our addressable market. However, as we create a larger addressable market, our market may become more attractive to other 3D printing companies or large companies that are not 3D printing companies, but which may see an economic opportunity in the markets we have created. Because we are a supplier of 3D printed products to industrial companies, an increase in the number of competitors for our addressable market is likely to adversely affect our business and financial results.
We may not be able to adequately increase demand for our products.
Our business plan is built around a steady increase in the demand for our products. However, only a relatively small number of our potential customers know of the existence of AM and are familiar with its capabilities, and even fewer understand the potential benefits of using AM to manufacture products. If we do not develop effective strategies to raise awareness among potential customers of the benefits of AM and 3D printing, we may be unable to achieve our planned rate of growth, which could adversely affect our results of operations.
We may not be able to hire the number of skilled employees that we need to achieve our business plan.
For our business to grow in accordance with our business plan, we will need to hire and retain additional employees with the technical competence and engineering skills to operate our machines, improve our technology and processes and expand our technological capability to print using an increasing variety of materials. People with these skills are in short supply and may not be available in sufficient numbers to allow us to meet the goals of our business plan. If we cannot obtain the services of a sufficient number of technically skilled employees, we may not be able to achieve our planned rate of growth, which could adversely affect our results of operations.
Our revenues and operating results may fluctuate.
Our revenues and operating results may fluctuate from quarter-to-quarter and year-to-year and are likely to continue to vary due to a number of factors, many of which are not within our control. A significant portion of
14
Table of Contents
our machine orders are typically received during the third or fourth quarter of the fiscal year as a result of the timing of capital expenditures of our customers. Our machines typically are shipped within the quarter or the next quarter after orders are received. Thus, revenues and operating results for any future period are not predictable with any significant degree of certainty. We also typically experience weaker demand for our machines in the first and second quarters. For these reasons, comparing our operating results on a period-to-period basis may not be meaningful. You should not rely on our past results as an indication of our future performance.
Fluctuations in our operating results and financial condition may occur due to a number of factors, including, but not limited to, those listed below and those identified throughout this “Risk Factors” section:
| • | the degree of market acceptance of our products; |
| • | the mix of products that we sell during any period; |
| • | our long sales cycle; |
| • | generally weaker demand for machines in the first and second quarters; |
| • | development of competitive systems by others; |
| • | our response to price competition; |
| • | delays between our expenditures to develop and market new or enhanced machines and products and the generation of sales from those products; |
| • | changes in the amount we spend to promote our products and services; |
| • | the geographic distribution of our sales; |
| • | changes in the cost of satisfying our warranty obligations and servicing our installed base of products; |
| • | our level of research and development activities and their associated costs and rates of success; |
| • | general economic and industry conditions that affect end-user demand and end-user levels of product design and manufacturing, including the adverse effects of the current economic crisis affecting Europe; |
| • | changes in accounting rules and tax laws; and |
| • | changes in interest rates that affect returns on our cash balances and short-term investments. |
Due to the foregoing factors, you should not rely on quarter-to-quarter or year-to-year comparisons of our operating results as an indicator of future performance.
We may not be able to generate operating profits.
Since our inception, we have not generated operating profits. In the event that we are unable to execute on our business plan, we may be unable to generate profits in the future.
Our operating expenses (which include research and development and selling, general and administrative expenses) for the six months ended June 30, 2013, were approximately $9.6 million compared with operating expenses of approximately $6.8 million for the six months ended June 30, 2012. We expect our operating expenses for the year ending December 31, 2013 to be between approximately $18.0 million and $21.0 million. The increases in our research and development expenses are due primarily to continued investment in our 3D printing machine and micromachinery technology and increased costs associated with our materials qualification activities, including additional research and development headcount. The increases in our selling, general and administrative expenses are due primarily to increased expenses in professional service fees (including legal, audit and other consulting expenses) and increased personnel costs associated with an increased headcount (including salaries and related benefits) in making the transition from a private company to a publicly traded company.
15
Table of Contents
We expect that our operating expenses will continue to increase in future periods as we pursue our growth strategies. Based on our current plans, we further expect our operating expenses for the year ending December 31, 2014 to exceed our 2013 operating expenses by 20% to 25%. Any future increases in our research and development expenses and selling, general and administrative expenses will directly affect our future results of operations and may have an effect on our financial condition.
We may not be able to introduce new machines and related industrial materials acceptable to the market or to improve the technology and industrial materials used in our current machines.
Our revenues are derived from the sale of machines for, and products manufactured using, AM. Our market is subject to innovation and technological change. A variety of technologies have the capacity to compete against one another in our market, which is, in part, driven by technological advances and end-user requirements and preferences, as well as the emergence of new standards and practices. Our ability to compete in the industrial AM market depends, in large part, on our success in enhancing and developing new machines, in enhancing our current machines, in enhancing and adding to our technology, and in developing and qualifying new industrial materials in which we can print. We believe that to remain competitive we must continuously enhance and expand the functionality and features of our products and technologies. However, we may not be able to:
| • | Enhance our existing products and technologies; |
| • | Continue to leverage advances in industrial printhead technology; |
| • | Develop new products and technologies that address the increasingly sophisticated and varied needs of prospective end-users, particularly with respect to the physical properties of industrial materials and other consumables; |
| • | Respond to technological advances and emerging industry standards and practices on a cost-effective and timely basis; |
| • | Develop products that are cost-effective or that otherwise gain market acceptance; and |
| • | Adequately protect our intellectual property as we develop new products and technologies. |
If the market does not develop as we expect, our revenues may stagnate or decline.
The marketplace for industrial manufacturing is dominated by conventional manufacturing methods that do not involve AM technology. If AM technology does not gain market acceptance as an alternative for industrial manufacturing, or if the marketplace adopts AM based on a technology other than our technology, we may not be able to increase or sustain the level of sales of our products and machines and our results of operations would be adversely affected as a result.
Loss of key management or sales or customer service personnel could adversely affect our results of operations.
Our future success depends to a significant extent on the skills, experience and efforts of our management and other key personnel. We must continue to develop and retain a core group of management individuals if we are to realize our goal of continued expansion and growth. While we have not previously experienced significant problems attracting and retaining members of our management team and other key personnel, there can be no assurance that we will be able to continue to retain these individuals, and the loss of any or all of these individuals could materially and adversely affect our business. We do not carry key-man insurance on any member of management.
Our international operations pose currency risks, which may adversely affect our operating results.
Our operating results may be affected by volatility in currency exchange rates and our ability to effectively manage our currency transaction and translation risks. In general, we conduct our business, earn revenue and
16
Table of Contents
incur costs in the local currency of the countries in which we operate. As a result, our international operations present risks from currency exchange rate fluctuations. The financial condition and results of operations of each of our foreign operating subsidiaries are reported in the relevant local currency and then translated to U.S. dollars at the applicable currency exchange rate for inclusion in our consolidated financial statements. We do not manage our foreign currency exposure in a manner that would eliminate the effects of changes in foreign exchange rates. Therefore, changes in exchange rates between these foreign currencies and the U.S. dollar will affect the recorded levels of our foreign assets and liabilities, as well as our revenues, cost of goods sold, and operating margins, and could result in exchange losses in any given reporting period.
In the future, we may not benefit from favorable exchange rate translation effects, and unfavorable exchange rate translation effects may harm our operating results. In addition to currency translation risks, we incur currency transaction risks whenever we enter into either a purchase or a sale transaction using a different currency from the currency in which we receive revenues. In such cases we may suffer an exchange loss because we do not currently engage in currency swaps or other currency hedging strategies to address this risk.
Given the volatility of exchange rates, we can give no assurance that we will be able to effectively manage our currency transaction and/or translation risks or that any volatility in currency exchange rates will not have an adverse effect on our results of operations.
One of our principal stockholders will be able to exert substantial influence.
Following the completion of this offering, S. Kent Rockwell, our Chairman and Chief Executive Officer, will beneficially own approximately 23.50% of our common stock (22.02% if the underwriters exercise the over-allotment option in full) and may have effective control over the election of our Board of Directors and the direction of our affairs. As a result, he could exert considerable influence over the outcome of any corporate matter submitted to our stockholders for approval, including the election of directors and any transaction that might cause a change in control, such as a merger or acquisition. Any stockholders who are in favor of a matter that is opposed by Mr. Rockwell would have to obtain a significant number of votes to overrule the votes of Mr. Rockwell.
We may need to raise additional capital from time to time if we are going to meet our growth strategy and may be unable to do so on attractive terms.
Expanding our business to meet our growth strategy may require additional investments of capital from time to time, and our existing sources of cash and any funds generated from operations may not provide us with sufficient capital. For various reasons, including any current noncompliance with existing or future lending arrangements, additional financing may not be available when needed, or may not be available on terms favorable to us. If we fail to obtain adequate capital on a timely basis or if capital cannot be obtained at reasonable costs, we will not be able to achieve our planned rate of growth, which will adversely affect our results of operations.
We are highly dependent upon sales to certain industries.
For our most recent fiscal year ended (December 31, 2012), revenues of machines and products were concentrated to companies in the aerospace (20%), automotive (24%), heavy equipment (26%), and energy/oil/gas (13%) industries and those industries’ respective suppliers. To the extent any of these industries experience a downturn, our results of operations may be adversely affected. Additionally, if any of these industries or their respective suppliers or other providers of manufacturing services develop new technologies or alternatives to manufacture the products that are currently manufactured using our machines, it may adversely affect our results of operations.
We are dependent on a single supplier of printheads.
We currently rely on a single source to supply the printheads used by our machines. While we believe that there are other suppliers of printheads upon which we could rely, we could experience delays and interruptions if our supply is interrupted that might temporarily impact the financial performance of our business.
17
Table of Contents
We may not be able to manage the expansion of our operations effectively in order to achieve our projected levels of growth.
We have expanded our operations significantly in recent periods, and our business plan calls for further expansion over the next several years. We anticipate that further development of our infrastructure and an increase in the number of our employees will be required to achieve our planned broadening of our product offerings and client base, improvements in our machines and materials used in our machines, and our planned international growth. In particular, we must increase our marketing and services staff to support new marketing and service activities and to meet the needs of both new and existing customers. Our future success will depend in part upon the ability of our management to manage our growth effectively. If our management is unsuccessful in meeting these challenges, we may not be able to achieve our anticipated level of growth which would adversely affect our results of operations.
We may not be able to consummate and effectively integrate future acquisitions, if any.
We may from time to time engage in strategic acquisitions and partnerships with third parties if we determine that they will provide future financial and operational benefits. Successful completion of any strategic transaction depends on a number of factors that are not entirely within our control, including our ability to negotiate acceptable terms, conclude satisfactory agreements and obtain all necessary regulatory approvals. In addition, our ability to effectively integrate any potential acquisition into our existing business and culture may not be successful, which could jeopardize future operational performance for the combined businesses. Although we are currently exploring a combination of acquisitions, strategic investments, and/or alliances, some of which we believe will promote advances in pre-print and post-print process, there is no guarantee that we will complete such transactions on favorable terms or at all. The exploration, negotiation, and consummation of acquisitions, strategic investments and/or alliances may involve significant expenditures by us, which may adversely affect our results of operations at the time such expenses are incurred. We may not be able to successfully negotiate and complete a specific acquisition, investment, or alliance. In addition, any acquisition, investment or alliance may not be accretive to ExOne for a period of time which may be significant following the completion of such acquisition, investment or alliance.
Our planned expansion of our international sales is subject to various risks, and failure to manage these risks could adversely affect our results of operations.
Our business is subject to certain risks associated with doing business globally. For our three most recent fiscal years ended (December 31, 2012, 2011 and 2010), our sales outside of the United States were 72.8%, 70.0% and 70.7%, respectively. One of our growth strategies is to pursue opportunities for our business in several areas of the world outside of the United States, any or all of which could be adversely affected by the risks set forth below. Our operations outside of the United States are subject to risks associated with the political, regulatory and economic conditions of the countries in which we operate, such as:
| • | fluctuations in foreign currency exchange rates; |
| • | potentially longer sales and payment cycles; |
| • | potentially greater difficulties in collecting accounts receivable; |
| • | potentially adverse tax consequences; |
| • | reduced protection of intellectual property rights in certain countries; |
| • | difficulties in staffing and managing foreign operations; |
| • | laws and business practices favoring local competition; |
| • | costs and difficulties of customizing products for foreign countries; |
| • | compliance with a wide variety of complex foreign laws, treaties and regulations; |
18
Table of Contents
| • | tariffs, trade barriers and other regulatory or contractual limitations on our ability to sell or develop our products in certain foreign markets; and |
| • | becoming subject to the laws, regulations and court systems of many jurisdictions. |
Any of these factors could materially adversely affect sales of our products to global customers or harm our reputation, which could adversely affect our results of operations.
Global economic, political and social conditions have adversely impacted our sales and may continue to do so.
The uncertain direction and relative strength of the global economy, difficulties in the financial services sector and credit markets, continuing geopolitical uncertainties and other macroeconomic factors all affect spending behavior of potential end-users of our products. The prospects for economic growth in the United States and other countries remain uncertain and may cause end-users to further delay or reduce technology purchases. In particular, a substantial portion of our sales are made to customers in countries in Europe, which is experiencing a significant economic crisis. If global economic conditions remain volatile for a prolonged period or if European economies experience further disruptions, our results of operations could be adversely affected. The global financial crisis affecting the banking system and financial markets has resulted in a tightening of credit markets, lower levels of liquidity in many financial markets and extreme volatility in fixed income, credit, currency and equity markets. These conditions may make it more difficult for our end-users to obtain financing.
Due to our plan to increase our global business activities, we may be adversely affected by violations of the FCPA, similar anti-bribery laws in other jurisdictions in which we currently or may in the future operate, or various international trade and export laws.
Our business plan envisions that we will conduct increasing amounts of business outside of the United States, which will create various domestic and foreign regulatory challenges. The Foreign Corrupt Practices Act of 1977, as amended (the “FCPA”), and similar anti-bribery laws in other jurisdictions generally prohibit U.S.-based companies and their intermediaries from making improper payments to non-U.S. officials for the purpose of obtaining or retaining business. We have policies and controls in place designed to ensure internal and external compliance with these and other anti-bribery laws. To ensure compliance, our anti-bribery policy and training on a global basis provides our employees with procedures, guidelines and information about anti-bribery obligations and compliance. Further, we require our partners, subcontractors, agents and others who work for us or on our behalf to comply with anti-bribery laws. We also have procedures and controls in place designed to ensure internal and external compliance. However, such anti-bribery policy, training, internal controls, and procedures will not always protect us from reckless, criminal or unintentional acts committed by our employees, agents or other persons associated with us. If we are found to be in violation of the FCPA or other anti-bribery laws (either due to the intentional or inadvertent acts of our employees, or due to the intentional or inadvertent acts of others), we could suffer criminal or civil penalties or other sanctions, which could have a material adverse effect on our business. In addition, actual or alleged violations could damage our reputation and adversely affect our results of operations.
We rely on our information technology systems to manage numerous aspects of our business and customer and supplier relationships, and a disruption of these systems could adversely affect our results of operations.
We depend on our information technology, or “IT,” systems to manage numerous aspects of our business and provide analytical information to management. Our IT systems allow us to efficiently purchase products from our suppliers, provide procurement and logistic services, ship products to our customers on a timely basis, maintain cost-effective operations and provide superior service to our customers. Our IT systems are an essential component of our business and growth strategies, and a disruption to our IT systems could significantly limit our ability to manage and operate our business efficiently. These systems are vulnerable to, among other things, damage and interruption from power loss, including as a result of natural disasters, computer system and network failures, loss of telecommunication services, operator negligence, loss of data, security breaches and computer viruses. Any such disruption could adversely affect our results of operations.
19
Table of Contents
We could be subject to personal injury, property damage, product liability, warranty and other claims involving allegedly defective products that we supply.
The products we supply are sometimes used in potentially hazardous applications, such as the assembled parts of an aircraft or automobile, that could result in death, personal injury, property damage, loss of production, punitive damages, and consequential damages. While we have not experienced any such claims to date, actual or claimed defects in the products we supply could result in our being named as a defendant in lawsuits asserting potentially large claims. Any such lawsuit, regardless of merit, could result in material expense, diversion of management time and efforts, and damage to our reputation, and could cause us to fail to retain or attract customers, which could adversely affect our results of operations.
We may not have adequate insurance for potential liabilities.
In the ordinary course of business, we may be subject to various product and non-product related claims, lawsuits and administrative proceedings seeking damages or other remedies arising out of our commercial operations. We maintain insurance to cover our potential exposure for most claims and losses. However, our insurance coverage is subject to various exclusions, self-retentions and deductibles, may be inadequate or unavailable to protect us fully, and may be cancelled or otherwise terminated by the insurer. Furthermore, we face the following additional risks under our insurance coverage:
| • | we may not be able to continue to obtain insurance coverage on commercially reasonable terms, or at all; |
| • | we may be faced with types of liabilities that are not covered under our insurance policies, such as environmental contamination or terrorist attacks, and that exceed any amounts what we may have reserved for such liabilities; |
| • | the amount of any liabilities that we may face may exceed our policy limits and any amounts we may have reserved for such liabilities; and |
| • | we may incur losses resulting from interruption of our business that may not be fully covered under our insurance policies. |
Even a partially uninsured claim of significant size, if successful, could materially adversely affect our business, financial condition, results of operations and liquidity. However, even if we successfully defend ourselves against any such claim, we could be forced to spend a substantial amount of money in litigation expenses, our management could be required to spend valuable time in the defense against these claims and our reputation could suffer, any of which could adversely affect our results of operations.
If any of our manufacturing facilities or PSCs are disrupted, sales of our products may be disrupted, which could result in loss of revenues and an increase in unforeseen costs.
We manufacture our machines at our facilities in Augsburg, Germany and North Huntingdon, Pennsylvania. Our PSCs are located in North Huntingdon, Pennsylvania; Houston, Texas; Troy, Michigan; Auburn, Washington; Augsburg, Germany; and Kanagawa, Japan.
On August 1, 2013, we purchased land in Gersthofen, Germany, in the district of Augsburg to build a new facility. The facility will comprise approximately 150,700 square feet of production, warehouse, service and research and development space as well as approximately 27,600 square feet for offices. We intend to consolidate our five existing leased facilities in Augsburg, which currently occupy an aggregate of approximately 77,500 square feet, into the new facility, providing expansion capacity to support our global growth strategy. We have selected a turnkey provider of construction services that focuses on Central Europe, Great Britain, Austria and Switzerland, to design and construct the new facility. We estimate that we will complete construction of the new facility in the second half of 2014. We estimate that the acquisition and construction of the new facility will cost approximately $20.0 million, which includes approximately $3.9 million to purchase the land.
20
Table of Contents
If the operations of these facilities are materially disrupted, we would be unable to fulfill customer orders for the period of the disruption, we would not be able to recognize revenue on orders, and we might need to modify our standard sales terms to secure the commitment of new customers during the period of the disruption and perhaps longer. Depending on the cause of the disruption, we could incur significant costs to remedy the disruption and resume product shipments. Such a disruption could have an adverse effect on our results of operations.
Under applicable employment laws, we may not be able to enforce covenants not to compete and therefore may be unable to prevent our competitors from benefiting from the expertise of some of our former employees.
We generally enter into non-competition agreements with our employees. These agreements prohibit our employees, if they cease working for us, from competing directly with us or working for our competitors or clients for a limited period. We may be unable to enforce these agreements under the laws of the jurisdictions in which our employees work, including Germany and Japan, and it may be difficult for us to restrict our competitors from benefitting from the expertise of our former employees or consultants developed while working for us. If we cannot demonstrate that our legally protectable interests will be harmed, we may be unable to prevent our competitors from benefiting from the expertise of our former employees or consultants and our ability to remain competitive may be diminished.
Risks Related to Our Intellectual Property
We may not be able to protect our trade secrets and intellectual property.
While some of our technology is licensed under patents belonging to others or is covered by process patents which are owned or applied for by us, much of our key technology is not protected by patents. Since we cannot legally prevent one or more other companies from developing similar or identical technology to our unpatented technology, it is likely that, over time, one or more other companies may be able to replicate our technology, thereby reducing our technological advantages. If we do not protect our technology or are unable to develop new technology that can be protected by patents or as trade secrets, we may face increased competition from other companies, which may adversely affect our results of operations.
We enjoy license rights and exclusivity of certain patents and intellectual property and cannot adequately estimate the effects of their expiration upon the entrance or advancement of competitors into the AM industrial market.
We have exclusive license and non-exclusive license rights to certain patents that we utilize in the industrial market. Some of these patents expired in November 2012 and others are scheduled to expire over the next two years. We cannot adequately estimate the effect that the expiration of these patents will have upon the entrance or advancement of other AM manufacturers into the industrial market. See “Business — Intellectual Property.”
We may not be able to obtain patent protection or otherwise adequately protect or enforce our intellectual property rights, which could impair our competitive position.
Our success and future revenue growth will depend, in part, on our ability to protect our intellectual property. We rely primarily on patents, trademarks, and trade secrets, as well as non-disclosure agreements and other methods, to protect our proprietary technologies and processes globally. Despite our efforts to protect our proprietary technologies and processes, it is possible that competitors or other unauthorized third parties may obtain, copy, use, or disclose our technologies and processes. We cannot assure you that any of our existing or future patents or other intellectual property rights will not be challenged, invalidated, or circumvented or will otherwise provide us with meaningful protection. We may not be able to obtain foreign patents corresponding to our U.S. or foreign patent applications. Even if foreign patents are granted, effective enforcement in foreign countries may not be available. If our patents and other intellectual property protections do not adequately protect our technology, our competitors may be able to offer products similar to ours. We may not be able to detect the
21
Table of Contents
unauthorized use of our proprietary technology and processes or take appropriate steps to prevent such use. Our competitors may also be able to develop similar technology independently or design around our patents. Any of the foregoing events would lead to increased competition and lower revenue or gross profits, which would adversely affect our results of operations.
We may be subject to alleged infringement claims.
We may be subject to intellectual property infringement claims from individuals, vendors, and other companies who have acquired or developed patents in the field of AM for purposes of developing competing products or for the sole purpose of asserting claims against us. Any claims that our products or processes infringe the intellectual property rights of others, regardless of the merit or resolution of such claims, could cause us to incur significant costs in responding to, defending, and resolving such claims, and may prohibit or otherwise impair our ability to commercialize new or existing products. If we are unable to effectively defend our technologies and processes, our market share, sales and profitability could suffer, which could adversely affect our results of operations.
Certain of our employees and patents are subject to German law.
Many of our employees work in Germany and are subject to German employment law. Ideas, developments, discoveries and inventions made by such employees and consultants are subject to the provisions of the German Act on Employees’ Inventions (Gesetz über Arbeitnehmererfindungen), which regulates the ownership of, and compensation for, inventions made by employees. We face the risk that disputes can occur between us and our employees or ex-employees pertaining to alleged non-adherence to the provisions of this act that may be costly to defend and take up our management’s time and efforts whether we prevail or fail in such dispute. In addition, under the German Act on Employees’ Inventions, certain employees retained rights to patents they invented or co-invented prior to 2009. Although most of these employees have subsequently assigned their interest in these patents to us, there is a risk that the compensation we provided to them may be deemed to be insufficient in the future and we may be required under German law to increase the compensation due to such employee for the use of their patent. In those cases where employees have not assigned their interests to us, we may need to pay compensation for the use of those patents. If we are required to pay additional compensation or face other disputes under the German Act on Employees’ Inventions, our results of operations could be adversely affected.
Risks Related to the Securities Markets, Ownership of Our Common Stock and the Offering
We have broad discretion as to the use of the net proceeds from this offering and may not use them effectively.
We cannot specify with certainty how we will use the net proceeds that we receive from this offering. Our management has broad discretion in the application of the net proceeds, and we may use these proceeds in ways with which you may disagree or for purposes other than those contemplated at the time of the offering. The failure by our management to apply these funds effectively could have a material adverse effect on our business, financial condition and results of operation. Pending their use, we may invest the net proceeds from this offering in a manner that does not produce income or that loses value.
The market price of our common stock may fluctuate significantly.
The market price and liquidity of the market for shares of our common stock may fluctuate and may be significantly affected by numerous factors, some of which are beyond our control and may not be directly related to our operating performance. These factors include:
| • | significant volatility in the market price and trading volume of securities of companies in our sector, which is not necessarily related to the operating performance of these companies; |
| • | the mix of products that we sell, and related services that we provide, during any period; |
| • | delays between our expenditures to develop and market new products and the generation of sales from those products; |
22
Table of Contents
| • | changes in the amount that we spend to develop, acquire or license new products, technologies or businesses; |
| • | changes in our expenditures to promote our products and services; |
| • | changes in the cost of satisfying our warranty obligations and servicing our installed base of systems; |
| • | success or failure of research and development projects of us or our competitors; |
| • | announcements of acquisitions by us or one of our competitors; |
| • | the general tendency towards volatility in the market prices of shares of companies that rely on technology and innovation; |
| • | changes in regulatory policies or tax guidelines; |
| • | changes or perceived changes in earnings or variations in operating results; |
| • | any shortfall in revenue or earnings from levels expected by investors or securities analysts; and |
| • | general economic trends and other external factors. |
If equity research analysts do not publish research or reports about our business, or if they issue unfavorable commentary or downgrade our shares, the price of our shares could decline.
The trading market for our shares relies in part on the research and reports that equity research analysts publish about us and our business. We do not have control over these analysts, and we do not have commitments from them to write research reports about us. The price of our shares could decline if one or more equity research analysts downgrades our shares, issues other unfavorable commentary, or ceases publishing reports about us or our business.
Future sales of our shares could reduce the market price of our shares.
The price of our shares could decline if there are substantial sales of our common stock, particularly by our directors, their affiliates or our executive officers, or when there is a large number of shares of our common stock available for sale. The perception in the public market that our stockholders might sell our shares could also depress the market price of our shares. Our executive officers, directors and selling stockholders are subject to lock-up agreements with the underwriters that restrict their ability to transfer their shares for 90 days after the date of this offering. Consequently, upon expiration of the lock-up agreements, approximately 4,347,327 shares held by our existing officers or directors after accounting for shares sold in this offering (3,948,927 if the over-allotment option is exercised in full) will be eligible for sale in the public market. The market price of our shares may drop significantly when the restrictions on resale by our existing stockholders lapse and these stockholders are able to sell their shares into the market. If this occurs or continues, it could impair our ability to raise additional capital through the sale of securities should we desire to do so.
We are incurring increased costs as a result of operating as a public company, and our management is required to devote substantial time to new compliance initiatives.
As a public company whose shares are listed on the NASDAQ Global Market, we incur significant accounting, legal and other expenses that we did not incur as a private company, and these expenses will increase even more after we are no longer an “emerging growth company” (as described below). We incur significant costs associated with our compliance with the public company reporting requirements of the Securities and Exchange Act of 1934, as amended (the “Exchange Act”), requirements imposed by the Sarbanes-Oxley Act (most notably Section 404), Dodd Frank Wall Street Reform and Protection Act, and other rules adopted, and to be adopted, by the SEC and the NASDAQ Global Market. Compliance with these rules and regulations have increased our legal and financial compliance costs, introduced new costs (including stock exchange listing fees and costs related to investor relations and stockholder reporting), and made certain activities more time-consuming and costly. These increased costs of doing business have increased our consolidated net loss. They also make it more difficult for us to obtain director and officer liability insurance, and we may incur substantial costs to maintain sufficient coverage.
23
Table of Contents
In addition, changing laws, regulations and standards relating to corporate governance and public disclosure are creating uncertainty for public companies generally, increasing legal and financial compliance costs and making some activities more time consuming. These laws, regulations and standards are subject to varying interpretations, in many cases due to their lack of specificity, and, as a result, their application in practice may evolve over time as new guidance is provided by regulatory and governing bodies. This could result in continuing uncertainty regarding compliance matters and higher costs necessitated by ongoing revisions to disclosure and governance practices. We intend to invest resources to comply with evolving laws, regulations and standards, and this investment may result in increased general and administrative expenses and a diversion of management’s time and attention from revenue-generating activities to compliance activities. If our efforts to comply with new laws, regulations and standards differ from the activities intended by regulatory or governing bodies due to ambiguities related to their application and practice, regulatory authorities may initiate legal proceedings against us and our business may be adversely affected. We cannot predict or estimate the amount or timing of additional costs we may incur in the future to respond to these constantly evolving requirements. The impact of these requirements could also make it more difficult for us to attract and retain qualified persons to serve on our Board of Directors, our board committees or as executive officers.
However, for as long as we remain an “emerging growth company” as defined in the JOBS Act, we may take advantage of certain exemptions from various reporting requirements that are applicable to other public companies that are not “emerging growth companies” including, but not limited to, not being required to comply with the auditor attestation requirements of Section 404(b) of the Sarbanes-Oxley Act, less extensive disclosure obligations regarding executive compensation in our periodic reports and proxy statements, exemptions from the requirements to hold a nonbinding advisory vote on executive compensation and stockholder approval of any golden parachute payments not previously approved and an extended transition period for complying with new or revised accounting standards. We may take advantage of these provisions for up to five years or such earlier time that we are no longer an emerging growth company. We would cease to be an emerging growth company if we have more than $1.0 billion in annual revenues, qualify as a “large accelerated filer” under the Securities Exchange Act of 1934, as amended (which requires us to have more than $700 million in market value of our common stock held by non-affiliates), or issue more than $1.0 billion of non-convertible debt over a three-year period. See “Prospectus Summary — Implications of Being an Emerging Growth Company.”
We have never paid cash dividends on our common stock, and we do not anticipate paying any cash dividends in the foreseeable future. Therefore, if our share price does not appreciate, our investors may not gain and could potentially lose on their investment in our shares.
We have never declared or paid cash dividends on our common stock, nor do we anticipate paying any cash dividends on our share capital, after this offering and in the foreseeable future. We currently intend to retain all available funds and any future earnings to fund the development and growth of our business. As a result, capital appreciation, if any, of our shares will be investors’ sole source of gain for the foreseeable future.
As an emerging growth company, we intend to follow certain permitted corporate governance practices instead of the otherwise applicable SEC and NASDAQ requirements, which may result in less protection than is accorded to investors in a non-emerging growth company.
As an emerging growth company, we will be permitted, and intend to follow, certain corporate governance practices instead of those otherwise required by the SEC and under the listing requirements of the NASDAQ Global Market. Following our emerging growth company governance practices as opposed to the requirements that would otherwise apply to a company listed on the NASDAQ Global Market may provide less protection to you than what is accorded to investors under the Listing Rules of the NASDAQ Stock Market applicable to non-emerging growth company issuers.
24
Table of Contents
As an emerging growth company, we will delay adoption of new or revised accounting standards, which may make our stock less attractive and our trading price more volatile.
Pursuant to the JOBS Act, as an emerging growth company, we have elected to take advantage of an extended transition period for any new or revised accounting standards that may be issued by the Financial Accounting Standards Board (FASB) or the SEC, which means that when a standard is issued or revised and it has different application dates for public or private companies, we, as an emerging growth company, will delay adoption of the standard until it applies to private companies. This may make a comparison of our financial statements with any other public company that is either not an emerging growth company or is an emerging growth company that has opted out of using the extended transition period difficult, as different or revised standards may be used. If some investors find our common stock less attractive as a result, there may be a less active trading market for our common stock and our stock price may be more volatile and could decline.
If we fail to maintain an effective system of internal control over financial reporting in the future, we may not be able to accurately report our financial condition, results of operations or cash flows, which may adversely affect investor confidence in us and, as a result, the value of our common stock.
The Sarbanes-Oxley Act requires, among other things, that we maintain effective internal controls for financial reporting and disclosure controls and procedures. The term “disclosure controls and procedures,” as defined in Rules 13a-15(e) and 15d-15(e) under the Exchange Act, means controls and other procedures of a company that are designed to ensure that information required to be disclosed by a company in the reports that it files or submits under the Exchange Act is recorded, processed, summarized and reported, within the time periods specified in the SEC’s rules and forms. Disclosure controls and procedures include, without limitation, controls and procedures designed to ensure that information required to be disclosed by a company in the reports that it files or submits under the Exchange Act is accumulated and communicated to the company’s management, including its principal executive and principal financial officers, as appropriate to allow timely decisions regarding required disclosure. In addition, commencing with our annual report on Form 10-K for the year ending December 31, 2013, we will be required, under Section 404(a) of the Sarbanes-Oxley Act, to furnish a report by management on, among other things, the effectiveness of our internal control over financial reporting. This assessment will need to include disclosure of any material weaknesses identified by our management in our internal control over financial reporting. A material weakness is a control deficiency, or combination of control deficiencies, in internal control over financial reporting that results in more than a reasonable possibility that a material misstatement of annual or interim financial statements will not be prevented or detected on a timely basis.
In connection with the preparation of our consolidated financial statements for the year ended December 31, 2012, we concluded that there are material weaknesses in the design and operating effectiveness of our internal control over financial reporting as defined in SEC Regulation S-X. A description of the identified material weaknesses in internal control over financial reporting are as follows:
The design and operating effectiveness of internal controls related to our financial reporting process were not sufficient to allow for accurate and timely reporting of our consolidated financial results. We did not maintain adequate control with respect to the application of GAAP. This was principally due to a lack of personnel with adequate knowledge and experience in GAAP. As a result, we recorded certain manual, post-close adjustments in order to prepare the consolidated financial statements included in this prospectus.
The design and operating effectiveness of internal controls related to our information technology systems was not sufficient to allow for accurate and timely reporting of our consolidated financial results. Each of our primary locations (United States, Germany and Japan) utilizes separate and distinct information technology platforms to record, process and summarize transactions. As a result, our process to consolidate and report financial information is substantially a manual process and inherently subject to error.
25
Table of Contents
The design and operating effectiveness of internal controls related to our consolidation process and management’s review of our consolidated financial results did not operate at a level of precision sufficient to allow for accurate and timely reporting of our consolidated financial results. Our consolidation process is substantially a manual process and inherently subject to error. Further, because of internal control weaknesses identified with respect to our financial reporting process and information technology systems, management was unable to complete an adequate review of either subsidiary or consolidated financial results at a sufficient level of precision to prevent or detect misstatements. As a result, we recorded certain manual, post-close adjustments in order to prepare the consolidated financial statements included in this prospectus.
With the oversight of senior management and our audit committee, we have begun taking steps and plan to take additional measures to remediate the underlying causes of the identified material weaknesses. Our plan includes (i) enhancing our global accounting and reporting process by designing and strengthening the operating effectiveness of internal controls over financial reporting, (ii) evaluating our information technology systems to further integrate existing systems or invest in improvements to our technology sufficient to generate accurate and timely financial information, and (iii) adding financial personnel with adequate knowledge and experience in GAAP.
In addition to these efforts, we are in the process of documenting and testing our internal control over financial reporting in order to report on the effectiveness of our internal controls as of December 31, 2013. We can provide no assurance at this time that management will be able to report that our internal control over financial reporting is effective as of December 31, 2013. Furthermore, as our business continues to grow internationally, our internal controls will become more complex and will require significantly more resources and attention to ensure that our internal controls remain effective overall. If our management cannot favorably assess the effectiveness of our internal controls over financial reporting, investor confidence in our financial results may weaken, and our share price may suffer.
Notwithstanding the identified material weaknesses, management believes the consolidated financial statements included in this prospectus fairly present in all material respects our financial condition, results of operations and cash flows as of and for the periods presented in accordance with GAAP.
Additionally, Section 404(b) of the Sarbanes-Oxley Act requires an attestation from our independent registered public accounting firm on the effectiveness of our internal control over financial reporting. As an emerging growth company, we will not be required to comply with Section 404(b), until we file our annual report for 2018 with the SEC, provided we maintain our status as an emerging growth company for the full five-year period.
Our compliance with Section 404(b) will require that we incur substantial accounting expense and expend significant management efforts. We currently do not have an internal audit group, and we will need to hire additional accounting and financial staff with appropriate public company experience and technical accounting knowledge, and compile the system and process documentation necessary to perform the evaluation needed to comply with Section 404(b). We may not be able to complete our evaluation, testing and any required remediation in a timely fashion. During the evaluation and testing process, if we identify one or more material weaknesses in our internal control over financial reporting, we will be unable to assert that our internal control over financial reporting is effective. We cannot assure you that there will not be material weaknesses or significant deficiencies in our internal control over financial reporting in the future. Any failure to maintain internal control over financial reporting could severely inhibit our ability to accurately report our financial condition, results of operations or cash flows. If we are unable to conclude that our internal control over financial reporting is effective, or if our independent registered public accounting firm determines we have a material weakness or significant deficiency in our internal control over financial reporting once that firm begins its Section 404(b) attestations, we could lose investor confidence in the accuracy and completeness of our financial reports, the market price of our common stock could decline, and we could be subject to sanctions or investigations by NASDAQ, the SEC or other regulatory authorities. Failure to remedy any material weakness in
26
Table of Contents
our internal control over financial reporting, or to implement or maintain other effective control systems required of public companies, could also restrict our future access to the capital markets.
Provisions in our charter documents or Delaware law may inhibit a takeover, which could adversely affect the value of our common stock.
Our certificate of incorporation and bylaws contain, and Delaware corporate law contains, provisions that could delay or prevent a change of control or changes in our management. These provisions will apply even if some of our stockholders consider the offer to be beneficial or favorable. If a change of control or change in management is delayed or prevented, the market price of our common stock could decline.
Investors in this offering will experience immediate dilution upon the closing of the offering.
If you purchase shares of our common stock in this offering, you will experience immediate dilution of $ per share because the price that you pay will be greater than the pro forma net asset value per share of the common stock you acquire. This dilution is also due to the expenses incurred by us in connection with the consummation of this offering. You will experience additional dilution upon the exercise of options to purchase our common stock or the vesting of other grants of equity awards made by us under the Plan, or any other equity incentive plan that we may adopt in the future, or if we otherwise issue additional shares of our common stock at a price below the offering price. See “Dilution.”
Raising additional capital by issuing securities may cause dilution to our stockholders.
We may need or desire to raise substantial additional capital in the future. Our future capital requirements will depend on many factors, including, among others:
| • | Our degree of success in capturing a larger portion of the industrial products production market; |
| • | The costs of establishing or acquiring sales, marketing, and distribution capabilities for our products; |
| • | The costs of preparing, filing, and prosecuting patent applications, maintaining and enforcing our issued patents, and defending intellectual property-related claims; |
| • | The extent to which we acquire or invest in businesses, products, or technologies and other strategic relationships; and |
| • | The costs of financing unanticipated working capital requirements and responding to competitive pressures. |
If we raise additional funds by issuing equity or convertible debt securities, we will reduce the percentage ownership of our then-existing stockholders, and the holders of those newly-issued equity or convertible debt securities may have rights, preferences, or privileges senior to those possessed by our then-existing stockholders. Additionally, future sales of a substantial number of shares of our common stock or other equity-related securities in the public market could depress the market price of our common stock and impair our ability to raise capital through the sale of additional equity or equity-linked securities. We cannot predict the effect that future sales of our common stock or other equity-related securities would have on the market price of our common stock.
27
Table of Contents
CAUTIONARY STATEMENT CONCERNING FORWARD LOOKING STATEMENTS
This prospectus contains various forward-looking statements within the meaning of Section 27A of the Securities Act of 1933, as amended (the “Securities Act”) and, Section 21E of the Exchange Act, including those that express a belief, expectation, or intention, as well as those that are not statements of historical fact, that are forward looking statements. The forward looking statements may include projections and estimates concerning the timing and success of specific projects and our future production, revenue, income and capital spending. Our forward looking statements are generally accompanied by words such as “may,” “will,” “expect,” “intend,” “estimate,” “project,” “predict,” “believe,” “expect,” “anticipate,” “potential,” “plan,” “goal” or other words that convey the uncertainty of future events or outcomes. The forward looking statements in this prospectus speak only as of the date of this prospectus; we disclaim any obligation to update these statements (unless required by securities laws), and we caution you not to unduly rely on them. We have based these forward looking statements on our current expectations and assumptions about future events. While our management considers these expectations and assumptions to be reasonable, they are inherently subject to significant business, economic, competitive, regulatory and other risks, contingencies and uncertainties, most of which are difficult to predict and many of which are beyond our control. These risks, contingencies and uncertainties include, but are not limited to, the following:
| • | our ability to qualify more materials in which we can print; |
| • | the availability of skilled personnel; |
| • | the impact of increased operating expenses and expenses relating to proposed acquisitions, investments and alliances; |
| • | our strategy, including the expansion and growth of our operations; |
| • | the impact of loss of key management; |
| • | our plans regarding increased international operations in additional international locations; |
| • | sufficiency of funds for required capital expenditures, working capital, and debt service; |
| • | the adequacy of sources of liquidity; |
| • | expectations regarding demand for our industrial products, operating revenues, operating and maintenance expenses, insurance expenses and deductibles, interest expenses, debt levels, and other matters with regard to outlook; |
| • | demand for aerospace, automotive, heavy equipment, energy/oil/gas and other industrial products; |
| • | the scope, nature or impact of acquisitions, alliances and strategic investments and our ability to integrate acquisitions and strategic investments; |
| • | liabilities under laws and regulations protecting the environment; |
| • | the impact of governmental laws and regulations; |
| • | operating hazards, war, terrorism and cancellation or unavailability of insurance coverage; |
| • | the effect of litigation and contingencies; |
| • | the impact of disruption of our manufacturing facilities or PSCs; |
| • | the adequacy of our protection of our intellectual property; and |
| • | material weaknesses in our internal control over financing reporting. |
These and other important factors, including those discussed under “Risk Factors” and “Management’s Discussion and Analysis of Financial Condition and Results of Operations” included elsewhere in this prospectus, may cause our actual results of operations to differ materially from any future results of operations
28
Table of Contents
expressed or implied by the forward looking statements contained in this prospectus. Before making a decision to purchase our common stock, you should carefully consider all of the factors identified in this prospectus that could cause actual results to differ from these forward looking statements.
You should rely only on the information contained or incorporated by reference in this prospectus and in any free writing prospectus that we have authorized for use in connection with this offering. Neither we nor the underwriters nor the selling stockholders have authorized any other person to provide you with additional or different information. If anyone provides you with different or inconsistent information, you should not rely on it. Neither we nor the underwriters nor the selling stockholders are making an offer to sell these securities in any jurisdiction where an offer or sale is not permitted. You should assume that the information in this prospectus is accurate only as of the date on the front cover of this prospectus, regardless of the time of delivery of this prospectus or any sale of our common stock. Our business, financial condition, results of operations and prospects may have changed since that date. However, we will update this prospectus to reflect any material changes to the information contained herein during the period of this offering.
This prospectus contains industry, market and competitive position data that are based on industry publications and studies conducted by third parties, including, but not limited to, the 2013 report of Wohlers Associates, Inc., “Additive Manufacturing and 3D Printing State of the Industry” (the “2013 Wohlers Report”), in which we were an industry participant in 2013. The industry publications and third-party studies generally state that the information that they contain has been obtained from sources believed to be reliable, although they do not guarantee the accuracy or completeness of such information. While we believe that each of these publications and third-party studies is reliable, we have not independently verified the market and industry data obtained from these third-party sources.
TRADEMARKS, SERVICE MARKS AND TRADE NAMES
We have registrations in the United States for X1. We have filed for trademark registrations in the United States and in Canada, Europe, Japan, China, Korea, and Brazil for ExOne and for a stylized form of “X1 ExOne DIGITAL PART MATERIALIZATION.” We have also filed for trademark registrations in Canada and Japan for DIGITAL PART MATERIALIZATION. We have also filed for trademark registrations in the United States for ExCAST, ExMAL, ExTEC, and M-Flex. This prospectus also contains trademarks, service marks and trade names of other companies, which are the property of their respective owners. Solely for convenience, marks and trade names referred to in this prospectus may appear without the ® or TM symbols, but such references are not intended to indicate, in any way, that we will not assert, to the fullest extent under applicable law, our rights or the right of the applicable licensor to these marks and trade names. Third-party marks and trade names used herein are for informational purposes only and in no way constitute or are intended to be a commercial use of such names and marks. The use of such third-party names and marks in no way constitutes or should be construed to be an approval, endorsement or sponsorship of us, or our products or services, by the owners of such third-party names and marks.
29
Table of Contents
We estimate that our net proceeds from the sale of 1,106,000 shares of common stock in this offering will be approximately $ million after deducting underwriting discounts and commissions and estimated offering expenses payable by us. We will not receive any proceeds from the sale of shares by the selling stockholders.
We intend to use the net proceeds from this offering to finance future acquisitions or partnerships and alliances consistent with our business strategy and for working capital and general corporate purposes.
We continually evaluate potential acquisitions of products, technologies or businesses; however, we have no current understandings, agreements or commitments for any material acquisitions, strategic investments and/or alliances. We have not determined the specific amounts we plan to spend on any of the items listed above or the timing of these expenditures. The amounts and timing of our actual use of net proceeds will vary depending on numerous factors, including our identification of specific acquisitions, strategic investments and/or alliances, and our ability to negotiate on terms and conditions that are satisfactory to all parties involved. As a result, our management will have broad discretion in the application of the net proceeds.
In the event that any net proceeds are not immediately applied, we may temporarily hold them as cash, deposit them in banks or invest them in cash equivalents or securities.
PRICE RANGE OF OUR COMMON STOCK
Our common stock has been listed on the NASDAQ Global Market since February 7, 2013 under the symbol “XONE.” Prior to that date, there was no public market for our common stock. Shares sold in our initial public offering were priced at $18.00 per share.
On August 20, 2013, the closing price for our common stock as reported on the NASDAQ Global Market was $69.29 per share. The following table sets forth the ranges of high and low sales prices per share of our common stock as reported on the NASDAQ Global Market for the period indicated. Such quotations represent inter-dealer prices without retail markup, markdown or commission and may not necessarily represent actual transactions.
| Year Ended December 31, 2013 |
High | Low | ||||||
| First quarter |
$ | 34.28 | $ | 23.50 | ||||
| Second quarter |
$ | 64.50 | $ | 29.41 | ||||
Stockholders
As of August 20, 2013, there were 12 stockholders of record, which excludes stockholders whose shares were held in nominee or street name by brokers. The actual number of common stockholders is greater than the number of record holders, and includes stockholders who are beneficial owners and whose shares are held in street name by brokers and other nominees. This number of holders of record also does not include stockholders whose shares may be held in trust by other entities.
We do not anticipate that we will declare or pay regular dividends on our common stock in the foreseeable future, as we generally intend to invest any future earnings in the development and growth of our business. Future dividends, if any, will be at the discretion of our Board of Directors and will depend on many factors, including general economic and business conditions, our strategic plans, our financial results and conditions, legal requirements, any contractual obligations or limitations, and other factors that our Board of Directors deems relevant.
30
Table of Contents
The following table presents our capitalization as of June 30, 2013:
| • | on an actual basis; and |
| • | on a pro forma basis after giving effect to our sale of 1,106,000 shares of common stock in this offering at the assumed offering price of $ per share, which was the last reported sale price of our common stock on the NASDAQ Global Market on , 2013, after deducting underwriting discounts and commissions and estimated offering expenses payable by us. |
You should read this table together with “Selected Consolidated Financial Data,” and our financial statements and related notes and “Management’s Discussion and Analysis of Financial Condition and Results of Operations.”
| June 30, 2013 | ||||||||
| Actual | Pro Forma(1) | |||||||
| (unaudited) | ||||||||
| (dollars in thousands) | ||||||||
| Long-term debt, capital and financing lease obligations (excluding current portion): |
$ | 2,868 | $ | |||||
|
|
|
|
|
|||||
| Stockholders’ equity: |
||||||||
| Common stock, $0.01 par value, 200,000,000 shares authorized, actual; 13,281,608 shares issued and outstanding, actual; 14,387,608 shares issued and outstanding, pro forma |
133 | |||||||
| Additional paid-in capital |
88,026 | |||||||
| Accumulated other comprehensive loss |
(931 | ) | ||||||
| Accumulated deficit |
(3,034 | ) | ||||||
|
|
|
|
|
|||||
| Total stockholders’ equity |
84,194 | |||||||
|
|
|
|
|
|||||
| Total capitalization |
$ | 87,062 | $ | |||||
|
|
|
|
|
|||||
| (1) | Adjusts the pro forma information to give effect to this offering (assuming no exercise of the underwriters’ over-allotment option). Unless otherwise indicated, all information in this prospectus excludes: |
| (i) | 500,000 shares of common stock reserved for issuance under the Plan. The Plan provides for automatic increases in the reserve available annually on January 1 from 2014 through 2023 equal to the lesser of (i) 3.0% of the total outstanding shares of common stock as of December 31 of the immediately preceding year or (ii) a number of shares of common stock determined by our Board of Directors, provided that the maximum number of shares authorized under the Plan will not exceed 1,992,242 shares, subject to certain adjustments. |
| (ii) | Options to certain employees to purchase 175,000 shares of common stock issuable upon exercise of such options as of June 30, 2013, at an exercise price of $18.00 per share, which options vest in equal annual installments over three years from the date of grant. |
| (iii) | 20,000 shares of restricted stock that were unvested as of June 30, 2013. |
31
Table of Contents
Dilution is the amount by which the offering price paid by the purchasers of the common stock to be sold in this offering will exceed the net tangible book value per share of common stock after this offering. If you invest in our common stock, your interest will be diluted to the extent of the difference between the public offering price per share of our common stock and the pro forma net tangible book value per share of our common stock after this offering.
Our pro forma net tangible book value as of June 30, 2013 was $ million, or $ per share of our common stock. We calculate net tangible book value per share by calculating our total tangible assets less liabilities, and dividing it by the number of outstanding shares of our common stock.
After giving effect to the sale of 1,106,000 shares of our common stock in this offering at a public offering price of $ per share, and after deducting estimated underwriting discounts and commissions and estimated offering expenses payable by us, our net tangible book value, which we refer to as our pro forma net tangible book value, as of June 30, 2013 would have been approximately $ million, or $ per share of our common stock.
This amount represents an immediate dilution in our pro forma net tangible book value of $ per share to new investors purchasing shares of our common stock at the public offering price. We calculate dilution per share to new investors by subtracting the pro forma net tangible book value per share from the public offering price paid by the new investor. The following table illustrates the dilution to new investors on a per share basis:
| Public offering price |
$ | |||||||
| Net tangible book value per share as of June 30, 2013 |
$ | |||||||
| Increase per share attributable to new investors |
$ | |||||||
|
|
|
|||||||
| Pro forma net tangible book value per share as of June 30, 2013 after this offering |
$ | |||||||
|
|
|
|||||||
| Dilution per share to new investors |
$ | |||||||
|
|
|
The table below sets forth, as of , 2013, the number of shares of our common stock issued, the total consideration paid and the average price per share paid by our existing stockholders and our new investors in this offering and the issuance of shares of common stock in this offering at the public offering price of $ per share, before deducting underwriting discounts and commissions and our estimated offering expenses.
| Shares Purchased | Total Consideration | Average Price Per Share |
||||||||||||||||||
| Number | Percent | Amount | Percent | |||||||||||||||||
| Existing stockholders |
13,281,608 | 92.3 | % | $ | % | $ | ||||||||||||||
| New investors |
1,106,000 | 7.7 | % | % | $ | |||||||||||||||
|
|
|
|
|
|
|
|
|
|||||||||||||
| Total |
14,387,608 | 100.0 | % | $ | 100.0 | % | $ | |||||||||||||
|
|
|
|
|
|
|
|
|
|
|
|||||||||||
If the underwriters’ over-allotment option to purchase additional shares from the selling stockholders is exercised in full, the net tangible book value as of June 30, 2013 would have been $ million, or $ per share of our common stock, representing dilution of $ per share to new investors. Assuming such exercise, the number of shares held and the percentage of total consideration paid by the existing stockholders after this offering would be reduced to % and %, respectively, and the number of shares held and the percentage of total consideration paid by new investors would increase to % or %, respectively.
32
Table of Contents
Unless otherwise indicated, all information in this prospectus excludes:
(i) 500,000 shares of common stock reserved for issuance under the Plan. The Plan provides for automatic increases in the reserve available annually on January 1 from 2014 through 2023 equal to the lesser of (i) 3.0% of the total outstanding shares of common stock as of December 31 of the immediately preceding year or (ii) a number of shares of common stock determined by our Board of Directors, provided that the maximum number of shares authorized under the Plan will not exceed 1,992,242 shares, subject to certain adjustments.
(ii) Options to certain employees to purchase 175,000 shares of common stock issuable upon exercise of outstanding options as of June 30, 2013, at an exercise price of $18.00 per share, which options vest in equal annual installments over three years from the date of grant.
(iii) 20,000 shares of restricted stock that were unvested as of June 30, 2013.
Except as otherwise indicated, all information in this prospectus assumes no exercise by the underwriters of their option to purchase additional shares of our common stock.
33
Table of Contents
SELECTED CONSOLIDATED FINANCIAL DATA
(dollars in thousands, except per-share amounts)
The following tables set forth certain of our selected consolidated financial data for the periods represented. The financial data as of June 30, 2013, and for the quarter and six months ended June 30, 2013 and 2012 have been derived from our unaudited condensed consolidated financial statements and notes thereto. The financial data as of and for the years ended December 31, 2012, 2011 and 2010 have been derived from our audited consolidated financial statements and notes thereto. We have prepared the unaudited consolidated financial information set forth below on the same basis as our audited consolidated financial statements and have included all adjustments, consisting of only normal recurring adjustments, that we consider necessary for a fair presentation of our financial position and results of operations for such periods. The interim results set forth below are not necessarily indicative of expected results for the year ending December 31, 2013 or for any other future period.
The data presented below should be read in conjunction with, and are qualified in their entirety by reference to “Capitalization,” “Management’s Discussion and Analysis of Financial Condition and Results of Operations” and our consolidated financial statements and the related notes included elsewhere in this prospectus.
| Quarter Ended June 30, |
Six Months Ended June 30, |
Year Ended December 31, |
||||||||||||||||||||||||||
| 2013 | 2012 | 2013 | 2012 | 2012 | 2011 | 2010 | ||||||||||||||||||||||
| (unaudited) |
(unaudited) | |||||||||||||||||||||||||||
| Statement of consolidated operations and comprehensive loss data: |
||||||||||||||||||||||||||||
| Revenue |
$ | 9,230 | $ | 4,676 | $ | 17,164 | $ | 7,398 | $ | 28,657 | $ | 15,290 | $ | 13,440 | ||||||||||||||
| Gross profit |
$ | 4,181 | $ | 1,523 | $ | 7,019 | $ | 2,339 | $ | 12,143 | $ | 3,643 | $ | 3,066 | ||||||||||||||
| Research and development |
$ | 1,276 | $ | 348 | $ | 2,132 | $ | 832 | $ | 1,930 | $ | 1,531 | $ | 1,153 | ||||||||||||||
| Selling, general and administrative* |
$ | 3,908 | $ | 4,262 | $ | 7,476 | $ | 5,948 | $ | 18,285 | $ | 7,286 | $ | 5,978 | ||||||||||||||
| Interest expense |
$ | 50 | $ | 110 | $ | 280 | $ | 308 | $ | 842 | $ | 1,570 | $ | 1,114 | ||||||||||||||
| Net loss attributable to ExOne* |
$ | (1,120 | ) | $ | (3,609 | ) | $ | (3,034 | ) | $ | (5,138 | ) | $ | (10,168 | ) | $ | (8,037 | ) | $ | (5,508 | ) | |||||||
| Net loss attributable to ExOne per common share: |
||||||||||||||||||||||||||||
| Basic |
$ | (0.08 | ) | N/A | ** | $ | (0.27 | ) | N/A | ** | N/A | ** | N/A | ** | N/A | ** | ||||||||||||
| Diluted |
$ | (0.08 | ) | N/A | ** | $ | (0.27 | ) | N/A | ** | N/A | ** | N/A | ** | N/A | ** | ||||||||||||
| * | Selling, general and administrative expense and net loss attributable to ExOne include $200 and $1,785 in equity-based compensation expense for the quarters ended June 30, 2013 and 2012, respectively. Selling, general and administrative expense and net loss attributable to ExOne include $311 and $1,785 in equity-based compensation expense for the six months ended June 30, 2013 and 2012, respectively. Selling, general and administrative expense and net loss attributable to ExOne includes $7,735 in equity-based compensation expense for the year ended December 31, 2012. There was no equity-based compensation expense recorded during 2011 or 2010. |
| ** | Amounts are not comparable as a result of our Reorganization as a corporation on January 1, 2013. |
34
Table of Contents
| June 30, 2013 |
December 31, | |||||||||||||||
| 2012 | 2011 | 2010 | ||||||||||||||
| (unaudited) | ||||||||||||||||
| Consolidated balance sheets data: |
||||||||||||||||
| Working capital (deficit) |
$ | 72,675 | $ | (4,682 | ) | $ | (979 | ) | $ | (13,253 | ) | |||||
| Cash and cash equivalents |
$ | 64,550 | $ | 2,802 | $ | 3,496 | $ | 1,021 | ||||||||
| Property and equipment — net |
$ | 14,309 | $ | 12,467 | $ | 7,919 | $ | 7,990 | ||||||||
| Total assets |
$ | 96,118 | $ | 33,075 | $ | 18,615 | $ | 15,233 | ||||||||
| Line of credit |
$ | — | $ | 528 | $ | — | $ | — | ||||||||
| Demand note payable to member |
$ | — | $ | 8,666 | $ | — | $ | 15,045 | ||||||||
| Long-term debt and lease obligations |
$ | 3,499 | $ | 10,566 | $ | 5,429 | $ | 3,839 | ||||||||
| Redeemable preferred units |
$ | — | $ | — | $ | 18,984 | $ | — | ||||||||
| Preferred units |
$ | — | $ | 18,984 | $ | — | $ | — | ||||||||
| Common units |
$ | — | $ | 10,000 | $ | 10,000 | $ | 10,000 | ||||||||
| Common stock |
$ | 133 | $ | — | $ | — | $ | — | ||||||||
| Additional paid-in capital |
$ | 88,026 | $ | — | $ | — | $ | — | ||||||||
| Total stockholders’ / members’ equity (deficit) |
$ | 84,194 | $ | 41 | $ | (15,599 | ) | $ | (8,277 | ) | ||||||
| Six Months Ended June 30, |
Year Ended December 31, |
|||||||||||||||||||
| 2013 | 2012 | 2012 | 2011 | 2010 | ||||||||||||||||
| (unaudited) | ||||||||||||||||||||
| Statement of consolidated cash flows data: |
||||||||||||||||||||
| Cash used for operating activities |
$ | (7,133 | ) | $ | (7,498 | ) | $ | (9,803 | ) | $ | (2,436 | ) | $ | (5,912 | ) | |||||
| Cash used for investing activities |
$ | (3,875 | ) | $ | (1,518 | ) | $ | (1,724 | ) | $ | (1,080 | ) | $ | (1,795 | ) | |||||
| Cash provided by financing activities |
$ | 72,882 | $ | 6,142 | $ | 11,003 | $ | 5,931 | $ | 7,811 | ||||||||||
| Other data: |
||||||||||||||||||||||||||||
| Quarter Ended June 30, |
Six Months Ended June 30, |
Year Ended December 31, |
||||||||||||||||||||||||||
| 2013 | 2012 | 2013 | 2012 | 2012 | 2011 | 2010 | ||||||||||||||||||||||
| (unaudited) | (unaudited) | (unaudited) | (unaudited) | (unaudited) | ||||||||||||||||||||||||
| Machine units sold: |
||||||||||||||||||||||||||||
| S-15 |
— | — | — | — | 1 | 2 | 2 | |||||||||||||||||||||
| S-Max |
4 | 1 | 6 | 1 | 9 | 1 | 2 | |||||||||||||||||||||
| S-Print |
— | — | 1 | — | 3 | 1 | — | |||||||||||||||||||||
| M-Lab |
— | — | 1 | — | — | — | — | |||||||||||||||||||||
| Orion |
— | — | 1 | — | — | — | — | |||||||||||||||||||||
| Other |
— | — | — | — | — | 1 | 1 | |||||||||||||||||||||
|
|
|
|
|
|
|
|
|
|
|
|
|
|
|
|||||||||||||||
| Total |
4 | 1 | 9 | 1 | 13 | 5 | 5 | |||||||||||||||||||||
|
|
|
|
|
|
|
|
|
|
|
|
|
|
|
|||||||||||||||
| Adjusted EBITDA* |
$ | (279 | ) | $ | (2,666 | ) | $ | (1,182 | ) | $ | (3,636 | ) | $ | (6,389 | ) | $ | (4,004 | ) | $ | (2,993 | ) | |||||||
| * | We define Adjusted EBITDA (earnings before interest, taxes, depreciation and amortization) as net income (loss) attributable to ExOne (as calculated under accounting principles generally accepted in the United States of America (“GAAP”)) plus net income (loss) of noncontrolling interests, provision (benefit) for income taxes, interest expense, depreciation, equity-based compensation associated with our 2013 Equity |
35
Table of Contents
| Incentive Plan and other (income) expense — net. Disclosure in this prospectus of Adjusted EBITDA, which is a non-GAAP financial measure, as defined under the rules of the U.S. Securities and Exchange Commission (“SEC”), is intended as a supplemental measure of our performance that is not required by, or presented in accordance with, GAAP. Adjusted EBITDA should not be considered as an alternative to net income (loss) attributable to ExOne or any other performance measure derived in accordance with GAAP. Our presentation of Adjusted EBITDA should not be construed to imply that our future results will be unaffected by unusual or non-recurring items. |
We believe Adjusted EBITDA is meaningful to our investors to enhance their understanding of our financial performance. Although Adjusted EBITDA is not necessarily a measure of our ability to fund our cash needs, we understand that it is frequently used by securities analysts, investors and other interested parties as a measure of financial performance and to compare our performance with the performance of other companies that report Adjusted EBITDA. Our calculation of Adjusted EBITDA may not be comparable to similarly titled measures reported by other companies.
Reconciliation of Adjusted EBITDA to Net loss attributable to ExOne:
| Quarter Ended June 30, |
Six Months Ended June 30, |
Year Ended December 31, |
||||||||||||||||||||||||||
| 2013 | 2012 | 2013 | 2012 | 2012 | 2011 | 2010 | ||||||||||||||||||||||
| (unaudited) | (unaudited) | (unaudited) | (unaudited) | (unaudited) | (unaudited) | (unaudited) | ||||||||||||||||||||||
| Net loss attributable to ExOne |
$ | (1,120 | ) | $ | (3,609 | ) | $ | (3,034 | ) | $ | (5,138 | ) | $ | (10,168 | ) | $ | (8,037 | ) | $ | (5,508 | ) | |||||||
| Net income attributable to noncontrolling interests |
— | 148 | 138 | 182 | 480 | 420 | 328 | |||||||||||||||||||||
| Interest expense |
50 | 110 | 280 | 308 | 842 | 1,570 | 1,114 | |||||||||||||||||||||
| Provision for income taxes |
72 | 246 | 91 | 234 | 995 | 1,031 | 198 | |||||||||||||||||||||
| Depreciation |
524 | 421 | 1,096 | 805 | 1,683 | 1,170 | 1,072 | |||||||||||||||||||||
| Equity-based compensation* |
200 | — | 311 | — | — | — | — | |||||||||||||||||||||
| Other (income) expense — net |
(5 | ) | 18 | (64 | ) | (27 | ) | (221 | ) | (158 | ) | (197 | ) | |||||||||||||||
|
|
|
|
|
|
|
|
|
|
|
|
|
|
|
|||||||||||||||
| Adjusted EBITDA |
$ | (279 | ) | $ | (2,666 | ) | $ | (1,182 | ) | $ | (3,636 | ) | $ | (6,389 | ) | $ | (4,004 | ) | $ | (2,993 | ) | |||||||
|
|
|
|
|
|
|
|
|
|
|
|
|
|
|
|||||||||||||||
| * | As noted above, amounts reflected for equity-based compensation relate solely to expense incurred in connection with equity-based awards granted under our 2013 Equity Incentive Plan. During both the quarter and six months ended June 30, 2012, we incurred $1,785 of equity-based compensation expense related to the sale of common units by the majority member of the former limited liability company to another existing member of the former limited liability company. During the year ended December 31, 2012, we incurred $7,735 of equity-based compensation expense related to the sale of common units by the majority member of the former limited liability company to other existing members of the former limited liability company. As these transactions are not a part of our 2013 Equity Incentive Plan, we have elected not to consider the related equity-based compensation in measuring Adjusted EBITDA for the respective 2012 periods. There was no equity-based compensation expense recorded by ExOne during 2011 or 2010. |
36
Table of Contents
MANAGEMENT’S DISCUSSION AND ANALYSIS OF FINANCIAL CONDITION AND
RESULTS OF OPERATIONS
(dollars in thousands, except per-share data)
The following discussion and analysis should be read together with the “Selected Consolidated Financial Data” and our consolidated financial statements and related notes thereto included in this prospectus. Certain statements contained in this discussion may constitute forward looking statements within the meaning of Section 27A of the Securities Act of 1933, as amended (the “Securities Act”) and, Section 21E of the Securities Exchange Act of 1934, as amended. These statements involve a number of risks, uncertainties and other factors that could cause actual results to differ materially from those reflected in any forward looking statements, as a result of a variety of risks and uncertainties, including those described under “Cautionary Statements Concerning Forward Looking Statements” and “Risk Factors.”
Overview
Business and Strategy
We are a global provider of three dimensional (“3D”) printing machines and printed products, materials and other services to industrial customers. Our business primarily consists of manufacturing and selling 3D printing machines and printing products to specification for our customers using our in-house 3D printing machines. We offer pre-production collaboration and print products for customers through our six production service centers (“PSCs”), which are located in the United States, Germany and Japan. We build 3D printing machines at our facilities in the United States and Germany. We also supply the associated materials, including consumables and replacement parts, and other services, including training and technical support, necessary for purchasers of our machines to print products. We believe that our ability to print in a variety of industrial materials, as well as our industry-leading printing capacity (as measured by build box size and printhead speed), uniquely position us to serve the needs of industrial customers.
As an additive manufacturer, we are an early entrant into an evolving manufacturing technology and marketplace. Our strategy has been to position our manufacturing assets, both in terms of our ability and capacity, to prepare for an anticipated increase of customer acceptance of this form of manufacturing. We have made financial support of this growth strategy a priority. We have invested in both our research and development and infrastructure, including capital investment in 3D printing machines, and hiring key personnel.
As our infrastructure grows, we intend to shift our strategic focus to opening additional PSCs in order to broaden our potential global customer base and to expand our 3D printing capability in an increasing variety of industrial materials. Our growth strategy focuses on growing our PSCs in order to print more products for our existing customers and gain new customers. By the end of 2015, we plan to expand our PSC network from the current six locations to fifteen locations. Like our current PSCs, we plan to locate the additional PSCs in major industrial centers near existing and potential customers. While we may adjust the final locations based upon market considerations, our 2013 plan includes announcing the opening of an additional location in the United States, in addition to the recent Auburn, Washington PSC announcement. Our current plan also includes opening two or more additional PSC locations in the first half of 2014.
Our growth strategy includes using our printed products as an introduction of our technology to facilitate 3D printing machine sales. An important part of reaching these goals is to increase our capability to print in a growing number of industrial materials and increase the job box sizes and production speeds (volumetric output) available to our potential customers, which will increase the efficiency and usefulness of our technology. In addition, we use our regional PSCs to educate our potential customers and the marketplace about the advantages of 3D printing.
We also believe expanding the location of our PSCs to high-growth economies and geographic regions that are readily accessible by a significant number of potential customers will help us to increase sales. To better
37
Table of Contents
balance our business, we intend to develop our customer base so that revenue is not dependent on any one region (North America, South America and Latin America (collectively the Americas), Europe and Asia). Likewise we intend to balance revenue between our 3D printing machines and 3D printed products, materials and other services.
Our next generation 3D printing machine platforms have achieved the volumetric output rate and quality necessary to serve industrial markets on a production scale. We believe that there is an opportunity to similarly advance the pre-print and post-print processing phases of product materialization to more fully exploit the transformative power of our 3D printing machines and drive growth. These opportunities relate to both direct and indirect part materialization. For direct metal production, we believe that enhancing pre-print processes, notably design optimization tools and suitable print material availability, can greatly accelerate our capture of market share in the near-term. Additionally, enhancements to post-print processing will increase the applications for printed parts. Through ExMAL, we are developing post-print processing technologies to achieve fully dense metal product materialization without the need for infiltration, and we are exploring technology-sharing partnerships to further this initiative. In indirect production utilizing 3D printed molds and cores, advanced performance casting technologies can be leveraged to increase yields and reduce weight of casted products. To address the market opportunity and fill the execution gap, we have developed a suite of processes, many of which are proprietary, for producing high-quality castings through a process that we call ExCAST. ExCAST provides industry guidance and support through all stages of production, from CAD at the design stage, through the 3D materialization of molds and cores, metal casting of the end product and rapid delivery to the end-user.
Finally, we intend to opportunistically identify and, through acquisitions, alliances and/or strategic investment, integrate and advance complementary businesses, technologies and capabilities. Our goal is to expand the functionality of our products, provide access to new customers and markets, and increase our production capacity. We are in active discussions with parties that we believe can contribute to a superior end-to-end manufacturing process.
Operational Performance and Outlook
We believe that interest in 3D printing is increasing by virtue of the general commercialization of 3D printers and recent media attention. We occupy a defined space in the 3D printing market because of the size of our 3D printing machines and their application for industrial products and qualified industrial materials. There are 3D printing companies in various sectors of the market, including art, home-printing, dental, biotech and other areas. While our 3D printing machines may differ from those of many other 3D printing companies in that our machines are designed to print industrial products from qualified industrial materials, we expect a general increase in 3D printing to have a positive effect on the public’s awareness of our industry. We have made investments in technology, material sciences, engineering resources, production capacity, marketing and sales force training and developing a global organization, as discussed above, in an attempt to improve our financial performance.
Our growth prospects for 2013 are dependent upon a number of external and internal factors, which are described in greater detail in “Business — Our Business Strategy.”
Recent Developments
Several important corporate developments have occurred in the six months ended June 30, 2013 that have had a significant effect on the presentation of our consolidated financial results.
ExOne was formed on January 1, 2013, when The Ex One Company, LLC, a Delaware limited liability company, merged with and into a Delaware corporation, which survived and changed its name to The ExOne Company. As a result of our reorganization on January 1, 2013 (the “Reorganization”), The Ex One Company, LLC became ExOne, the common and preferred interest holders of The Ex One Company, LLC became holders of common stock and preferred stock, respectively, of ExOne, and the subsidiaries of The Ex One Company, LLC became the subsidiaries of ExOne.
38
Table of Contents
We have considered the proforma effects of our Reorganization on the provision for income taxes for the periods prior to our Reorganization in our condensed statement of consolidated operations and comprehensive loss and concluded that there would be no difference as compared to the amount reported, principally due to valuation allowances established against net deferred tax assets. In addition, we have omitted basic and diluted earnings per share for periods prior to January 1, 2013, as a result of our Reorganization, as the basis for such calculation is no longer comparable to presentation of information on or after January 1, 2013.
The condensed consolidated financial statements include the accounts of ExOne, our wholly-owned subsidiaries, ExOne Americas LLC (United States), ExOne GmbH (Germany) and Ex One KK (Japan), and through March 27, 2013, two variable interest entities in which we were identified as the primary beneficiary, Lone Star Metal Fabrication, LLC (“Lone Star”) and Troy Metal Fabricating, LLC (“TMF”).
At December 31, 2012 and through March 27, 2013, we leased property and equipment from Lone Star and TMF. We did not have an ownership interest in Lone Star or TMF. We were identified as the primary beneficiary of Lone Star and TMF in accordance with the guidance issued by the FASB on the consolidation of variable interest entities, as we guaranteed certain long-term debt of both Lone Star and TMF and governed these entities through common ownership. This guidance requires certain variable interest entities to be consolidated when an enterprise has the power to direct the activities of the variable interest entity that most significantly impact the variable interest entity’s economic performance and has the obligation to absorb losses or the right to receive benefits of the variable interest entity that could potentially be significant to the variable interest entity. Our condensed consolidated financial statements therefore include the accounts of Lone Star and TMF through March 27, 2013. The assets of Lone Star and TMF could only be used to settle obligations of Lone Star and TMF, and the creditors of Lone Star and TMF did not have recourse to our general credit.
On March 27, 2013, ExOne Americas LLC acquired certain assets, including property and equipment (principally land, buildings and machinery and equipment) held by the two variable interest entities, and assumed all outstanding debt of such variable interest entities. See the note to the consolidated financial statements included in this prospectus for more information. Following this transaction, neither of the entities continued to meet the definition of a variable interest entity with respect to the Company, and as a result, the remaining assets and liabilities of both entities were deconsolidated following the transaction.
On February 6, 2013, we commenced an initial public offering of 6,095,000 shares of our common stock at a price to the public of $18.00 per share, of which 5,483,333 shares were sold by us and 611,667 were sold by a selling stockholder (including consideration of the exercise of the underwriters’ over-allotment option). Following completion of the offering on February 12, 2013, we received net proceeds after expenses of approximately $90,371 (net of underwriting commissions and associated offering costs, including approximately $712 in offering costs deferred by us at December 31, 2012). The proceeds from our initial public offering have been earmarked or spent in order to (1) expand our PSC network to fifteen global locations by the end of 2015 (total amount is estimated to be approximately $20,000 to $25,000), (2) increase capacity and upgrade technology in our production facilities in Germany, including consolidating our operations from five buildings located throughout the district of Augsburg to one purpose-built facility (total amount is estimated to be approximately $20,000), (3) expand our materials development initiatives and achieve our plan of one new industrial material qualified every six months (total amount is estimated to be approximately $2,000 to $3,000), (4) select and deploy an ERP system to promote operational efficiency and financial controls globally, (total amount is estimated to be approximately $3,000) and (5) deploy working capital to support growth (total amount is estimated to be approximately $21,000 to 27,000, with approximately $7,400 deployed through June 30, 2013). We have also used approximately $18,400 of the net proceeds from the initial public offering to repay our indebtedness existing prior to the initial public offering and to acquire certain assets (and assume and repay indebtedness) held by Lone Star and TMF.
References to the majority member in the “Management Discussion and Analysis of Financial Condition and Results of Operations” refer to affiliates of S. Kent Rockwell, our Chairman and Chief Executive Officer, who is the indirect, sole stockholder of RHI and RFP. Each of RHI and RFP provided funding to us prior to 2013.
39
Table of Contents
How We Measure Our Business
We use several financial and operating metrics to measure our business. We use these metrics to assess the progress of our business, make decisions on where to allocate capital, time and technology investments, and assess longer-term performance within our marketplace. The key metrics are as follows:
Revenue. Our revenue consists primarily of sales of our 3D printing machines and micromachinery and 3D printed products, materials and other services.
3D printing machines and micromachinery. 3D printing machine and micromachinery sales are influenced by a number of factors including, among other things, (i) the adoption rate of our 3D printing technology, (ii) end-user product design and manufacturing activity, (iii) the capital expenditure budgets of end-users and potential end-users and (iv) the mix of products sold, all of which may be significantly influenced by macroeconomic factors. Purchases of our 3D printing machines and micromachinery, especially our higher-end, higher-priced systems, typically involve long sales cycles. Our 3D printing machine and micromachinery prices generally include machine installation, training, maintenance and the value of a warranty. Several factors can significantly affect revenue reported for our 3D printing machines and micromachinery for a given period including, among others, (i) the overall low unit volume of 3D printing machine and micromachinery sales, (ii) the long lead times of our customers’ purchasing decisions and (iii) the acceleration or delay of orders and shipments of a small number of machines.
3D printed products, materials and other services. 3D printed products revenue is derived from our network of PSCs located in the United States (4), Germany (1) and Japan (1). The PSCs utilize our 3D printing machine technology to print products. In addition, our PSCs are also full-service operations that provide support and services such as pre-production collaboration prior to printing products for a customer. Revenue of materials depends upon the volume of consumables that we sell. Sales of our consumables are linked to the number of our 3D printing machines that are installed and active worldwide. Sales of consumables are also driven by our customers’ machine usage, which is generally a function of the size of the particular machine and the habits and budget of the particular end-user. Larger machines generally use larger amounts of consumables due to their greater capacity and the higher levels of design and manufacturing activity that are typical of an end-user who utilizes a larger machine.
Cost of Sales and Gross Profit. Our cost of sales consists primarily of labor (including service labor), parts (including consumables and spare parts) and overhead to produce 3D printing machines and 3D printed products, materials and other services. Also included in cost of sales are license fees (based upon a percentage of revenue of qualifying products and processes) for the use of intellectual properties, warranty costs and other overhead associated with our production processes. The production capacity at our PSCs (as well as our 3D printing machine and micromachinery manufacturing facilities) presently exceeds the current customer demand and as such a portion of our fixed overhead associated with these facilities is being recognized as a period expense rather than being capitalized as a product cost. We expect our excess capacity to decrease as sales of 3D printing machines and micromachinery and 3D printed products, materials and other services increase. Our 3D printing machines and micromachinery are manufactured at our facilities in Germany and the United States. The cost to manufacture machines consists of component parts, labor and production overhead. The cost of 3D printed products, materials and other services consist primarily of the material cost of our printed products, labor and overhead (including facilities expense and other conversion costs).
Our gross profit is influenced by a number of factors, the most important of which is the volume and mix of our 3D printing machines and micromachinery, products, materials and other services sold.
As 3D printing machine and micromachinery sales are cyclical, we will seek to achieve an equal balance in revenue from 3D printing machines and micromachinery and 3D printed products, materials and other services in order to maximize gross profit while managing business risk. In addition, we expect to reduce our cost of sales over time by continued research and development activities directed towards achieving increased efficiencies in the production of 3D printing machines and micromachinery. Our PSCs will also seek to achieve lower material cost and improve throughput.
40
Table of Contents
We are continuously analyzing our supply chain to identify opportunities for better management, in partnership with our customers, in order to reduce the overall cost as a percentage of revenue in this area.
Operating Expenses. Our operating expenses consist of research and development expenses and selling, general and administrative expenses.
Research and development expenses. Our research and development expenses consist primarily of salaries and related personnel expenses aimed at developing new machinery and materials. Additional costs include the related software and materials, laboratory supplies, and costs for facilities and equipment. We charge all research and development expenses to operations as they are incurred, with the exception of expenses for specific equipment that we capitalize.
Selling, general and administrative expenses. Our selling, general and administrative expenses consist primarily of employee-related costs (salaries, benefits, equity-based compensation, education and training and travel) of our executive officers, sales and marketing, finance, accounting, information technology and human resources personnel. Other significant general and administrative costs include the facility costs related to our headquarters in North Huntingdon, Pennsylvania (and the other four facilities where administrative personnel are located) and external costs for legal, accounting, consulting and other professional services.
We expect our operating expenses to continue to increase in future periods as we pursue our growth strategies. We expect our operating expenses for the year ending December 31, 2013 to be between approximately $18,000 and $21,000. Based on our current plans, we further expect our operating expenses for the year ending December 31, 2014 to exceed our 2013 operating expenses by 20% to 25%.
Interest Expense. Interest expense consists of the interest cost associated with outstanding long-term debt and financing lease arrangements.
We expect our interest expense to continue to decrease as our outstanding debt is lowered over time. Included in our business strategy is the consideration of early retirement of debt (where practicable).
Provision for Income Taxes. Prior to our Reorganization, we operated as a limited liability company whereby our members were taxed on a proportionate share of our taxable income. As such, no provision has been recorded for U.S. federal or state income taxes. For the quarter and six months ended June 30, 2013 and 2012, and the years ended December 31, 2012, 2011 and 2010 our entire provision for income taxes was attributed to our German operations.
Following our Reorganization, we are taxed as a corporation for U.S. federal, state, local and foreign income tax purposes. Current statutory tax rates in the jurisdictions in which we operate, the United States, Germany and Japan, are approximately 40.0% (including state taxes), 29.5% and 38.0%, respectively.
Results of Operations — Quarter and Six Months Ended June 30, 2013 Compared to Quarter and Six Months Ended June 30, 2012
Net Loss Attributable to ExOne
Net loss attributable to ExOne for the quarter ended June 30, 2013, was $1,120, or $0.08 per basic and diluted share, compared with a net loss attributable to ExOne of $3,609 for the quarter ended June 30, 2012. The decrease in our net loss was principally due to increases in our revenue and gross profit as a result of a significant increase in 3D printing and machine and micromachinery sales for 2013 compared to 2012. Offsetting the impact of the increases in revenue and gross profit was a net increase in our operating expenses from 2013 compared to 2012 attributed to increased research and development spending, mostly associated with (i) our continued efforts in qualifying materials for our 3D printing operations and (ii) investments in enhancing our 3D printing machine and micromachinery technology. Selling, general and administrative expenses were down slightly based on a net decrease in equity-based compensation offset by (i) higher professional service fees and personnel costs in making the transition from a private company to a publicly traded company and (ii) increased selling costs (principally selling commissions for machine sale transactions). Refer to the sections below for further description of these changes.
41
Table of Contents
Net loss attributable to ExOne for the six months ended June 30, 2013, was $3,034, or $0.27 per basic and diluted share, compared with a net loss attributable to ExOne of $5,138 for the six months ended June 30, 2012. The decrease in our net loss was principally due to increases in our revenue and gross profit as a result of a significant increase in 3D printing machine and micromachinery sales for 2013 compared to 2012. Offsetting the impact of the increases in revenue and gross profit was an increase in our operating expenses from 2013 compared to 2012 attributed to increased research and development spending, mostly associated with (i) our continued efforts in qualifying materials for our 3D printing operations and (ii) investments in enhancing our 3D printing machine and micromachinery technology. In addition, we incurred selling, general and administrative expenses which include (i) higher professional service fees and personnel costs in making the transition from a private company to a publicly traded company and (ii) increased selling costs (principally selling commissions for machine sale transactions), both offset by a net decrease in equity-based compensation. Refer to the sections below for further description of these changes.
Revenue
The following table summarizes revenue by product line for each of the quarter and six month periods ended June 30:
| Quarter
Ended June 30, |
Six Months
Ended June 30, |
|||||||||||||||||||||||||||||||
| 2013 | 2012 | 2013 | 2012 | |||||||||||||||||||||||||||||
| 3D printing machines and micromachinery |
$ | 5,798 | 62.8 | % | $ | 1,527 | 32.7 | % | $ | 10,053 | 58.6 | % | $ | 1,527 | 20.6 | % | ||||||||||||||||
| 3D printed products, materials and other services |
3,432 | 37.2 | % | 3,149 | 67.3 | % | 7,111 | 41.4 | % | 5,871 | 79.4 | % | ||||||||||||||||||||
|
|
|
|
|
|
|
|
|
|
|
|
|
|
|
|
|
|||||||||||||||||
| $ | 9,230 | 100.0 | % | $ | 4,676 | 100.0 | % | $ | 17,164 | 100.0 | % | $ | 7,398 | 100.0 | % | |||||||||||||||||
|
|
|
|
|
|
|
|
|
|
|
|
|
|
|
|
|
|||||||||||||||||
Revenue for the quarter ended June 30, 2013, was $9,230 compared with revenue of $4,676 for the quarter ended June 30, 2012, an increase of $4,554, or 97.4%. This increase was principally due to a higher volume of sales of 3D printing machines and micromachinery (four for the quarter ended June 30, 2013 as compared to one for the quarter ended June 30, 2012) as well as 3D printed products, materials and other services based on a continued increase in customer acceptance of our additive manufacturing technologies.
The following table summarizes the significant components of the change in revenue by product line for the quarter ended June 30, 2012 compared to the quarter ended June 30, 2013:
| 3D printing machines and micromachinery |
3D printed products, materials and other services |
Total | ||||||||||
| Quarter Ended June 30, 2012 |
$ | 1,527 | $ | 3,149 | $ | 4,676 | ||||||
| Change in revenue attributed to: |
||||||||||||
| Volume |
4,581 | 345 | 4,926 | |||||||||
| Pricing and sales mix |
(310 | ) | — | (310 | ) | |||||||
| Foreign currency |
— | (62 | ) | (62 | ) | |||||||
|
|
|
|
|
|
|
|||||||
| 4,271 | 283 | 4,554 | ||||||||||
|
|
|
|
|
|
|
|||||||
| Quarter Ended June 30, 2013 |
$ | 5,798 | $ | 3,432 | $ | 9,230 | ||||||
|
|
|
|
|
|
|
|||||||
Revenue for the six months ended June 30, 2013, was $17,164 compared with revenue of $7,398 for the six months ended June 30, 2012, an increase of $9,766, or 132.0%. This increase was principally due to a higher volume of sales of 3D printing machines and micromachinery (nine for the six months ended June 30, 2013 as compared to one for the six months ended June 30, 2012) as well as 3D printed products, materials and other services based on a continued increase in customer acceptance of our additive manufacturing technologies.
42
Table of Contents
The following table summarizes the significant components of the change in revenue by product line for the six months ended June 30, 2012 compared to the six months ended June 30, 2013:
| 3D printing machines and micromachinery |
3D printed products, materials and other services |
Total | ||||||||||
| Six Months Ended June 30, 2012 |
$ | 1,527 | $ | 5,871 | $ | 7,398 | ||||||
| Change in revenue attributed to: |
||||||||||||
| Volume |
12,216 | 1,448 | 13,664 | |||||||||
| Pricing and sales mix |
(3,690 | ) | — | (3,690 | ) | |||||||
| Foreign currency |
— | (208 | ) | (208 | ) | |||||||
|
|
|
|
|
|
|
|||||||
| 8,526 | 1,240 | 9,766 | ||||||||||
|
|
|
|
|
|
|
|||||||
| Six Months Ended June 30, 2013 |
$ | 10,053 | $ | 7,111 | $ | 17,164 | ||||||
|
|
|
|
|
|
|
|||||||
The following table summarizes 3D printing machines and micromachinery sold by type for each of the quarter and six month periods ended June 30 (refer to the “Our Machines and Machine Platforms” section of “Business” for a description of 3D printing machines and micromachinery by type):
| Quarter Ended June 30, |
Six Months Ended June 30, |
|||||||||||||||
| 2013 | 2012 | 2013 | 2012 | |||||||||||||
| Machine units sold: |
||||||||||||||||
| S-Max |
4 | 1 | 6 | 1 | ||||||||||||
| S-Print |
— | — | 1 | — | ||||||||||||
| M-Lab |
— | — | 1 | — | ||||||||||||
| Orion |
— | — | 1 | — | ||||||||||||
|
|
|
|
|
|
|
|
|
|||||||||
| 4 | 1 | 9 | 1 | |||||||||||||
|
|
|
|
|
|
|
|
|
|||||||||
Cost of Sales and Gross Profit
Cost of sales for the quarter ended June 30, 2013 was $5,049 compared with cost of sales of $3,153 for the quarter ended June 30, 2012, an increase of $1,896, or 60.1%. Cost of sales as a percentage of revenue was 54.7% for the quarter ended June 30, 2013 compared with 67.4% for the quarter ended June 30, 2012, a decrease of 12.7%.
Gross profit for the quarter ended June 30, 2013 was $4,181 compared with gross profit of $1,523 for the quarter ended June 30, 2012, an increase of $2,658, or 174.5%. Gross profit percentage was 45.3% for the quarter ended June 30, 2013, compared with 32.6% for the quarter ended June 30, 2012, an increase of 12.7%. This increase was principally due to volume increases in sales of 3D printing machines and an increase in productivity for the quarter ended June 30, 2013, compared with June 30, 2012 (see table above).
Cost of sales for the six months ended June 30, 2013 was $10,145 compared with cost of sales of $5,059 for the six months ended June 30, 2012, an increase of $5,086, or 100.5%. Cost of sales as a percentage of revenue was 59.1% for the six months ended June 30, 2013 compared with 68.4% for the six months ended June 30, 2012, a decrease of 9.3%.
Gross profit for the six months ended June 30, 2013 was $7,019 compared with gross profit of $2,339 for the six months ended June 30, 2012, an increase of $4,680, or 200.1%. Gross profit percentage was 40.9% for the six months ended June 30, 2013, compared with 31.6% for the six months ended June 30, 2012, an increase of 9.3%. This increase was principally due to volume increases in sales of 3D printing machines and an increase in productivity for the six months ended June 30, 2013, compared with June 30, 2012 (see table above).
43
Table of Contents
Operating Expenses
The following table summarizes the significant components of operating expenses for each of the quarter and six month periods ended June 30:
| Quarter Ended June 30, |
Six Months Ended June 30, |
|||||||||||||||
| 2013 | 2012 | 2013 | 2012 | |||||||||||||
| Research and development |
$ | 1,276 | $ | 348 | $ | 2,132 | $ | 832 | ||||||||
| Selling, general and administrative |
3,908 | 4,262 | 7,476 | 5,948 | ||||||||||||
|
|
|
|
|
|
|
|
|
|||||||||
| $ | 5,184 | $ | 4,610 | $ | 9,608 | $ | 6,780 | |||||||||
|
|
|
|
|
|
|
|
|
|||||||||
Operating expenses for the quarter ended June 30, 2013, were $5,184 compared with operating expenses of $4,610 for the quarter ended June 30, 2012, an increase of $574, or 12.5%. Operating expenses as a percentage of revenue were 56.2% for the quarter ended June 30, 2013, compared with 98.6% for the quarter ended June 30, 2012, a decrease of 42.4%.
Research and development expenses for the quarter ended June 30, 2013, were $1,276 compared with research and development expenses of $348 for the quarter ended June 30, 2012, an increase of $928, or 266.7%. This increase was primarily due to (i) increased costs associated with our materials qualification activities, including additional research and development headcount and facilities costs associated with our new materials development laboratory in the United States and (ii) continued investment in enhancing our 3D printing machine and micromachinery technology.
Selling, general and administrative expenses for the quarter ended June 30, 2013, were $3,908 compared with selling, general and administrative expenses of $4,262 for the quarter ended June 30, 2012, a decrease of $354, or 8.3%. This decrease was principally due to the absence of an equity-based compensation expense of $1,785 during the quarter ended June 30, 2012 associated with the sale of common units by the majority member of the former limited liability company to another existing member of the former limited liability company. Offsetting this amount were increases in (i) professional service fees (including legal, audit and other consulting expenses), (ii) personnel costs associated with an increased headcount (including salaries and related benefits) in making the transition from a private company to a publicly traded company and (iii) selling costs (principally selling commissions for machine sale transactions).
Operating expenses for the six months ended June 30, 2013, were $9,608 compared with operating expenses of $6,780 for the six months ended June 30, 2012, an increase of $2,828, or 41.7%. Operating expenses as a percentage of revenue were 56.0% for the six months ended June 30, 2013, compared with 91.6% for the six months ended June 30, 2012, a decrease of 35.6%.
Research and development expenses for the six months ended June 30, 2013, were $2,132 compared with research and development expenses of $832 for the six months ended June 30, 2012, an increase of $1,300 or 156.3%. This increase was primarily due to (i) increased costs associated with our materials qualification activities, including additional research and development headcount and facilities costs associated with our new materials development laboratory in the United States and (ii) continued investment in enhancing our 3D printing machine and micromachinery technology.
Selling, general and administrative expenses for the six months ended June 30, 2013, were $7,476 compared with selling, general and administrative expenses of $5,948 for the six months ended June 30, 2012, an increase of $1,528, or 25.7%. This increase was principally due to (i) higher professional service fees (including legal, audit and other consulting expenses), (ii) increased personnel costs associated with an increased headcount (including salaries and related benefits) in making the transition from a private company to a publicly traded company and (iii) increased selling costs (principally selling commissions for machine sale transactions).
44
Table of Contents
Offsetting these increases were the absence of an equity-based compensation expense of $1,785 during the six months ended June 30, 2012 associated with the sale of common units by the majority member of the former limited liability company to another existing member of the former limited liability company.
Interest Expense
Interest expense for the quarter ended June 30, 2013, was $50 compared with interest expense of $110 for the quarter ended June 30, 2012, a decrease of $60, or 54.5%. This decrease was principally due to a lower average outstanding debt balance for the quarter ended June 30, 2013, as compared to the quarter ended June 30, 2012, mostly due to the absence of advances on the demand note payable to member during the quarter ended June 30, 2013.
Interest expense for the six months ended June 30, 2013, was $280 compared with interest expense of $308 for the six months ended June 30, 2012, a decrease of $28, or 9.1%. This decrease was principally due to a lower average outstanding debt balance for the six months ended June 30, 2013, as compared to the six months ended June 30, 2012, mostly due to decreased average amounts outstanding on the demand note payable to member.
Other (Income) Expense — Net
Other (income) expense — net for the quarter ended June 30, 2013 was ($5) compared with other (income) expense — net of $18 for the quarter ended June 30, 2012. The change of $23 was mostly due to an increase in interest income during the quarter ended June 30, 2013 based on a higher average depository balance of cash on-hand following completion of our initial public offering in February 2013.
Other (income) expense — net for the six months ended June 30, 2013 was ($64) compared with other (income) expense — net of ($27) for the six months ended June 30, 2012. The increase of ($37) was mostly due to an increase in interest income during the first half of 2013 based on a higher average depository balance of cash on-hand following completion of our initial public offering in February 2013.
Provision for Income Taxes
The provision for income taxes for the quarters ended June 30, 2013 and 2012 was $72 and $246, respectively, and related entirely to the taxable income of ExOne GmbH. The effective tax rate for the quarters ended June 30, 2013 and 2012 was 106.9% and107.7%, respectively. For the quarter ended June 30, 2013, the effective tax rate differs from the U.S. federal statutory rate of 34.0% primarily due to net changes in valuation allowances for the period. For the quarter ended June 30, 2012, the effective tax rate differs from the U.S. federal statutory rate of 34.0% primarily due to the effects of (i) limited liability company losses not subject to tax and (ii) net changes in valuation allowances for the period.
The provision for income taxes for the six months ended June 30, 2013 and 2012 was $91 and $234, respectively, and related entirely to the taxable income of ExOne GmbH. The effective tax rate for the six months ended June 30, 2013 and 2012 was 103.2% and 105.0%, respectively. For the six months ended June 30, 2013, the effective tax rate differs from the U.S. federal statutory rate of 34.0% primarily due to net changes in valuation allowances for the period. For the six months ended June 30, 2012, the effective tax rate differs from the U.S. federal statutory rate of 34.0% primarily due to the effects of (i) limited liability company losses not subject to tax and (ii) net changes in valuation allowances for the period.
We have provided a valuation allowance for our net deferred tax assets as a result of our inability to generate consistent net operating profits in jurisdictions in which we operate. As such, any benefit from deferred taxes in either quarterly period has been fully offset by changes in the valuation allowance for net deferred tax assets. We continue to assess our future taxable income by jurisdiction based on (i) our recent historical operating results (ii) the expected timing of reversal of temporary differences (iii) various tax planning strategies that we
45
Table of Contents
may be able to enact in future periods (iv) the impact of potential operating changes on our business and (v) our forecast results from operations in future periods based on available information at the end of each reporting period. To the extent that we are able to reach the conclusion that deferred tax assets are realizable based on any combination of the above factors, a reversal of existing valuation allowances may occur.
Noncontrolling Interests
There was no net income attributable to noncontrolling interests for the quarter ended June 30, 2013 following the acquisition of net assets in the related variable interest entities, completed during the quarter ended March 31, 2013. Net income attributable to noncontrolling interests was $148 for the quarter ended June 30, 2012.
Net income attributable to noncontrolling interests for the six months ended June 30, 2013, was $138 compared with net income attributable to noncontrolling interests of $182 for the six months ended June 30, 2012, a decrease of $44, or 24.2%. This decrease was principally the result of the acquisition of net assets of the variable interest entities referenced above.
Other Financial Information
We define Adjusted EBITDA (earnings before interest, taxes, depreciation and amortization) as net income (loss) attributable to ExOne (as calculated under accounting principles generally accepted in the United States of America (“GAAP”)) plus net income (loss) of noncontrolling interests, provision (benefit) for income taxes, interest expense, depreciation, equity-based compensation associated with our 2013 Equity Incentive Plan and other (income) expense — net. Disclosure in this prospectus of Adjusted EBITDA, which is a non-GAAP financial measure, as defined under the rules of the U.S. Securities and Exchange Commission (“SEC”), is intended as a supplemental measure of our performance that is not required by, or presented in accordance with, GAAP. Adjusted EBITDA should not be considered as an alternative to net income (loss) attributable to ExOne or any other performance measure derived in accordance with GAAP. Our presentation of Adjusted EBITDA should not be construed to imply that our future results will be unaffected by unusual or non-recurring items.
We believe Adjusted EBITDA is meaningful to our investors to enhance their understanding of our financial performance. Although Adjusted EBITDA is not necessarily a measure of our ability to fund our cash needs, we understand that it is frequently used by securities analysts, investors and other interested parties as a measure of financial performance and to compare our performance with the performance of other companies that report Adjusted EBITDA. Our calculation of Adjusted EBITDA may not be comparable to similarly titled measures reported by other companies.
Reconciliation of Adjusted EBITDA to Net Loss Attributable to ExOne
| Quarter Ended June 30, |
Six Months Ended June 30, |
|||||||||||||||
| 2013 | 2012 | 2013 | 2012 | |||||||||||||
| Net loss attributable to ExOne |
$ | (1,120 | ) | $ | (3,609 | ) | $ | (3,034 | ) | $ | (5,138 | ) | ||||
| Net income attributable to noncontrolling interests |
— | 148 | 138 | 182 | ||||||||||||
| Interest expense |
50 | 110 | 280 | 308 | ||||||||||||
| Provision for income taxes |
72 | 246 | 91 | 234 | ||||||||||||
| Depreciation |
524 | 421 | 1,096 | 805 | ||||||||||||
| Equity-based compensation* |
200 | — | 311 | — | ||||||||||||
| Other (income) expense — net |
(5 | ) | 18 | (64 | ) | (27 | ) | |||||||||
|
|
|
|
|
|
|
|
|
|||||||||
| Adjusted EBITDA |
$ | (279 | ) | $ | (2,666 | ) | $ | (1,182 | ) | $ | (3,636 | ) | ||||
|
|
|
|
|
|
|
|
|
|||||||||
46
Table of Contents
| * | As noted above, amounts reflected for equity-based compensation relate solely to expense incurred in connection with equity-based awards granted under our 2013 Equity Incentive Plan. During both the quarter and six months ended June 30, 2012, we incurred $1,785 of equity-based compensation expense related to the sale of common units by the majority member of the former limited liability company to another existing member of the former limited liability company. We have elected not to consider the related equity-based compensation in measuring Adjusted EBITDA for the respective 2012 periods. |
The significant changes in the reconciling items between Adjusted EBITDA and net loss attributable to ExOne for the quarter ended June 30, 2013, compared to the quarter ended June 30, 2012, include (i) a decrease in net income attributable to noncontrolling interests as a result of the acquisition of the related variable interest entities during the quarter ended March 31, 2013, (ii) a decrease in interest expense of $60 associated with a lower average outstanding debt balance for the quarter ended June 30, 2013, (iii) a decrease in the provision for income taxes of $174 associated with changes in the taxable income of ExOne GmbH, (iv) an increase in depreciation expense of $103 attributed to an increase in 3D printing machines in-service in 2013 as compared to 2012 and (v) an increase in equity-based compensation of $200 based on the adoption of the 2013 Equity Incentive Plan and subsequent issuance of incentive stock options and restricted stock during the quarter ended March 31, 2013.
The significant changes in the reconciling items between Adjusted EBITDA and net loss attributable to ExOne for the six months ended June 30, 2013, compared to the six months ended June 30, 2012, include (i) a decrease in the provision for income taxes of $143 associated with changes in the taxable income of ExOne GmbH, (ii) an increase in depreciation expense of $291 attributed to an increase in 3D printing machines in-service in 2013 as compared to 2012 and (iii) an increase in equity-based compensation of $311 based on the adoption of the 2013 Equity Incentive Plan and subsequent issuance of incentive stock options and restricted stock during the quarter ended March 31, 2013.
Impact of Inflation
Our results of operations and financial condition are presented based on historical cost. While it is difficult to accurately measure the impact of inflation due to the imprecise nature of the estimates required, we believe the effects of inflation, if any, on our results of operations and financial condition are not significant.
Results of Operations — Year Ended December 31, 2012 Compared to Year Ended December 31, 2011 and Year Ended December 31, 2011 Compared to Year Ended December 31, 2010
Net Loss Attributable to ExOne
Net loss attributable to ExOne for 2012 was $10,168 compared with a net loss attributable to ExOne of $8,037 in 2011. The increase in our net loss was due to an increase in our operating expenses from 2012 compared to 2011 principally due to a non-recurring equity-based compensation charge and professional service fees incurred in preparation for our initial public offering. Offsetting the impact of the increase in operating expenses, were (i) increases in our revenue and gross profit as a result of a significant increase in 3D printing machine sales for 2012 compared to 2011 and a reduction in license fee expense as a result of the amendment to our agreement with MIT and (ii) a decrease in interest expense as a result of a lower average outstanding debt balance. Refer to the sections below for further description of these changes.
Net loss attributable to ExOne for 2011 was $8,037 compared with a net loss attributable to ExOne of $5,508 in 2010. The increase in our net loss was principally due to increases in operating expenses (mostly personnel costs associated with a higher headcount), an increase in interest expense as a result of a higher average outstanding debt balance and an increase in the provision for income taxes due to higher taxable income for our German operations. These increases were offset by improvements in our gross profit as a result of an increase in the volume of sales of 3D printed products, materials and other services. Refer to the sections below for further description of these changes.
47
Table of Contents
Revenue
The following table summarizes revenue by product line for each of the years ending December 31:
| 2012 | 2011 | 2010 | ||||||||||||||||||||||
| 3D printing machines and micromachinery |
$ | 15,668 | 54.7 | % | $ | 5,406 | 35.4 | % | $ | 5,622 | 41.8 | % | ||||||||||||
| 3D printed products, materials and other services |
12,989 | 45.3 | % | 9,884 | 64.6 | % | 7,818 | 58.2 | % | |||||||||||||||
|
|
|
|
|
|
|
|
|
|
|
|
|
|||||||||||||
| $ | 28,657 | 100.0 | % | $ | 15,290 | 100.0 | % | $ | 13,440 | 100.0 | % | |||||||||||||
|
|
|
|
|
|
|
|
|
|
|
|
|
|||||||||||||
Revenue for 2012 was $28,657 compared with revenue of $15,290 in 2011, an increase of $13,367, or 87.4%. This increase was principally due to a higher volume of sales of 3D printing machines (13 in 2012 as compared to 5 in 2011) as well as 3D printed products, materials and other services.
The following table summarizes the significant components of the change in revenue by product line for 2012 compared to 2011:
| 3D printing machines and micromachinery |
3D printed products, materials and other services |
Total | ||||||||||
| 2011 |
$ | 5,406 | $ | 9,884 | $ | 15,290 | ||||||
| Change in revenue attributed to: |
||||||||||||
| Volume |
10,360 | 3,388 | 13,748 | |||||||||
| Pricing and sales mix |
95 | — | 95 | |||||||||
| Foreign currency |
(193 | ) | (283 | ) | (476 | ) | ||||||
|
|
|
|
|
|
|
|||||||
| 10,262 | 3,105 | 13,367 | ||||||||||
|
|
|
|
|
|
|
|||||||
| 2012 |
$ | 15,668 | $ | 12,989 | $ | 28,657 | ||||||
|
|
|
|
|
|
|
|||||||
Revenue for 2011 was $15,290 compared with revenue of $13,440 in 2010, an increase of $1,850, or 13.8%. This increase was principally due to a higher volume of sales of 3D printed products, materials and other services.
The following table summarizes the significant components of the change in revenue by product line for 2011 compared to 2010:
| 3D printing machines and micromachinery |
3D printed products, materials and other services |
Total | ||||||||||
| 2010 |
$ | 5,622 | $ | 7,818 | $ | 13,440 | ||||||
| Change in revenue attributed to: |
||||||||||||
| Volume |
— | 1,962 | 1,962 | |||||||||
| Pricing and sales mix |
(487 | ) | — | (487 | ) | |||||||
| Foreign currency |
271 | 104 | 375 | |||||||||
|
|
|
|
|
|
|
|||||||
| (216 | ) | 2,066 | 1,850 | |||||||||
|
|
|
|
|
|
|
|||||||
| 2011 |
$ | 5,406 | $ | 9,884 | $ | 15,290 | ||||||
|
|
|
|
|
|
|
|||||||
48
Table of Contents
The following table summarizes 3D printing machines sold by type for each of the years ending December 31 (see “Business — Our Machines and Machine Platforms” for a description of 3D printing machines by type):
| 2012 | 2011 | 2010 | ||||||||||
| Machine units sold: |
||||||||||||
| S-15 |
1 | 2 | 2 | |||||||||
| S-Max |
9 | 1 | 2 | |||||||||
| S-Print |
3 | 1 | — | |||||||||
| Other |
— | 1 | 1 | |||||||||
|
|
|
|
|
|
|
|||||||
| 13 | 5 | 5 | ||||||||||
|
|
|
|
|
|
|
|||||||
Cost of Sales and Gross Profit
Cost of sales for 2012 was $16,514 compared with cost of sales of $11,647 in 2011, an increase of $4,867, or 41.8%. Cost of sales as a percentage of revenue was 57.6% for 2012 compared with 76.2% in 2011, a decrease of 18.6%.
Cost of sales for 2011 was $11,647 compared with cost of sales of $10,374 in 2010, an increase of $1,273, or 12.3%. Cost of sales as a percentage of revenue was 76.2% for 2011 compared with 77.2% in 2010, a decrease of 1.0%.
Gross profit for 2012 was $12,143 compared with gross profit of $3,643 in 2011, an increase of $8,500, or 233.4%. Gross profit percentage was 42.4% for 2012 compared with 23.8% in 2011, an increase of 18.6%. This increase was principally due to the increase in 3D printing machine volume for 2012 compared with 2011 (see table above) and a reduction in our license fees of $625 mostly due to the amendment to our agreement with MIT. See “Business — Intellectual Property — Patents and MIT Licenses.”
Gross profit for 2011 was $3,643 compared with gross profit of $3,066 in 2010, an increase of $577, or 18.8%. Gross profit percentage was 23.8% for 2011 compared with 22.8% in 2010, an increase of 1.0%. This increase was principally due to (i) a favorable mix of sales in our PSCs (lower cost) as well as (ii) increased volume of activity in our PSCs resulting in more efficient use of our fixed overhead.
Operating Expenses
The following table summarizes the significant components of operating expenses for each of the years ending December 31:
| 2012 | 2011 | 2010 | ||||||||||
| Research and development |
$ | 1,930 | $ | 1,531 | $ | 1,153 | ||||||
| Selling, general and administrative |
18,285 | 7,286 | 5,978 | |||||||||
|
|
|
|
|
|
|
|||||||
| $ | 20,215 | $ | 8,817 | $ | 7,131 | |||||||
|
|
|
|
|
|
|
|||||||
Operating expenses for 2012 were $20,215 compared with operating expenses of $8,817 in 2011, an increase of $11,398, or 129.3%. Operating expenses as a percentage of revenue were 70.5% for 2012 compared with 57.7% in 2011, an increase of 12.8%.
Research and development expenses for 2012 were $1,930 compared with research and development expenses of $1,531 in 2011, an increase of $399, or 26.1%. This increase was mostly due to (i) continued investment in our 3D printing machine technology and (ii) increased costs associated with our materials qualification activities.
49
Table of Contents
Selling, general and administrative expenses for 2012 were $18,285 compared with selling, general and administrative expenses of $7,286 in 2011, an increase of $10,999, or 150.1%. This increase was principally due to an equity-based compensation charge of $7,735 associated with the sale of common units of the former limited liability company to certain members of executive management. In addition, we incurred professional service fees (including legal, audit and other consulting expenses) of $2,328 in 2012 as compared to $469 in 2011. This increase is mostly attributable to costs incurred in preparation for our initial public offering, finalized in February 2013.
Operating expenses for 2011 were $8,817 compared with operating expenses of $7,131 in 2010, an increase of $1,686, or 23.6%. Operating expenses as a percentage of revenue were 57.7% for 2011 compared with 53.1% in 2010, an increase of 4.6%.
Research and development expenses for 2011 were $1,531 compared with research and development expenses of $1,153 in 2010, an increase of $378, or 32.8%. This increase was mostly due to continued investment in our 3D printing machine technology.
Selling, general and administrative expenses for 2011 were $7,286 compared with selling, general and administrative expenses of $5,978 in 2010, an increase of $1,308, or 21.9%. This increase was principally due to employee-related costs (salaries, benefits and travel) as a result of an increase in headcount.
Interest Expense
Interest expense for 2012 was $842 compared with interest expense of $1,570 in 2011, a decrease of $728, or 46.4%. This decrease was principally due to a lower average outstanding debt balance in 2012 as compared to 2011, mostly due to the conversion of amounts payable on our demand note payable to member to redeemable preferred units.
Interest expense for 2011 was $1,570 compared with interest expense of $1,114 in 2010, an increase of $456, or 40.9%. This increase was principally due to a higher average outstanding debt balance in 2011 as compared to 2010, mostly due to (i) additional equipment loans added in 2011 and (ii) increased borrowings from our majority member of approximately $3,939. The demand note payable to member accrued interest at 8.0% during both 2011 and 2010.
Other (Income) Expense — Net
Other (income) expense — net for 2012 was ($221) compared with other (income) expense — net of ($158) in 2011, an increase of $63, or 39.9%. Other (income) expense — net for 2011 was ($158) compared with other (income) expense — net of ($197) in 2010, a decrease of $39, or 19.8%. Changes in other (income) expense — net were mostly due to net changes in foreign currency exchange impacts.
Provision for Income Taxes
The provision for income taxes for 2012 was $995 compared with a provision for income taxes of $1,031 in 2011, a decrease of $36, or 3.5%. This decrease was due to a reduction in expense associated with uncertain tax positions in 2012 compared to 2011 for our German operations.
The provision for income taxes for 2011 was $1,031 compared with a provision for income taxes of $198 in 2010, an increase of $833, or 420.7%. This increase was due to an increase in taxable income in 2011 compared to 2010 for our German operations.
50
Table of Contents
Noncontrolling Interests
Net income attributable to noncontrolling interests for 2012 was $480 compared with net income attributable to noncontrolling interests of $420 in 2011, an increase of $60, or 14.3%. This increase was principally due to additional rental income (rental expense for us) associated with 3D printing machines purchased by our variable interest entities, Lone Star and TMF.
Net income attributable to noncontrolling interests for 2011 was $420 compared with net income attributable to noncontrolling interests of $328 in 2010, an increase of $92, or 28.0%. This increase was principally due to an increase in rental income by the noncontrolling interests (rental expense for us) associated with 3D printing machines purchased by our variable interest entities, Lone Star and TMF.
Other Financial Information
We define Adjusted EBITDA (earnings before interest, taxes, depreciation and amortization) as net income (loss) attributable to ExOne (as calculated under GAAP) plus net income (loss) of noncontrolling interests, provision (benefit) for income taxes, interest expense, depreciation, and other (income) expense — net. Disclosure in this prospectus of Adjusted EBITDA, which is a non-GAAP financial measure, as defined under the rules of the SEC, is intended as a supplemental measure of our performance that is not required by, or presented in accordance with, GAAP. Adjusted EBITDA should not be considered as an alternative to net income (loss) attributable to ExOne or any other performance measure derived in accordance with GAAP. Our presentation of Adjusted EBITDA should not be construed to imply that our future results will be unaffected by unusual or non-recurring items.
We believe Adjusted EBITDA is meaningful to our investors to enhance their understanding of our financial performance. Although Adjusted EBITDA is not necessarily a measure of our ability to fund our cash needs, we understand that it is frequently used by securities analysts, investors and other interested parties as a measure of financial performance and to compare our performance with the performance of other companies that report Adjusted EBITDA. Our calculation of Adjusted EBITDA may not be comparable to similarly titled measures reported by other companies.
Reconciliation of Adjusted EBITDA to Net Loss Attributable to ExOne
| 2012 | 2011 | 2010 | ||||||||||
| Net loss attributable to ExOne* |
$ | (10,168 | ) | $ | (8,037 | ) | $ | (5,508 | ) | |||
| Net income attributable to noncontrolling interests |
480 | 420 | 328 | |||||||||
| Interest expense |
842 | 1,570 | 1,114 | |||||||||
| Provision for income taxes |
995 | 1,031 | 198 | |||||||||
| Depreciation |
1,683 | 1,170 | 1,072 | |||||||||
| Other (income) expense — net |
(221 | ) | (158 | ) | (197 | ) | ||||||
|
|
|
|
|
|
|
|||||||
| Adjusted EBITDA |
$ | (6,389 | ) | $ | (4,004 | ) | $ | (2,993 | ) | |||
|
|
|
|
|
|
|
|||||||
| * | For 2012, net loss attributable to ExOne includes approximately $7,735 in equity-based compensation expense. There was no equity-based compensation expense recorded by ExOne during 2011 or 2010. |
The significant changes in the reconciling items between Adjusted EBITDA and net loss attributable to ExOne for 2012 compared to 2011 include (i) a decrease in interest expense of $728 due to a lower average outstanding debt balance in 2012 as compared to 2011, including the conversion of demand note payable to member borrowings at the end of 2011 to redeemable preferred units and (ii) an increase in depreciation expense of $513 attributed to an increase in 3D printing machines in-service in 2012 as compared to 2011.
51
Table of Contents
The significant changes in the reconciling items between Adjusted EBITDA and net loss attributable to ExOne for 2011 compared to 2010 include (i) an increase in interest expense of $456 due to a higher average outstanding debt balance in 2011 as compared to 2010, mostly due to additional equipment loans added in 2011 and increased borrowings from our majority member of approximately $3,939 and (ii) an increase in the provision for income taxes of $833 due to increased taxable income for our German operations.
Impact of Inflation
Our results of operations and financial condition are presented based on historical cost. While it is difficult to accurately measure the impact of inflation due to the imprecise nature of the estimates required, we believe the effects of inflation, if any, on our results of operations and financial condition are not significant.
Liquidity and Capital Resources
We have incurred net losses of $1,120 and $2,896 for the quarter and six months ended June 30, 2013 and $9,688, $7,617 and $5,180 for the years ended December 31, 2012, 2011 and 2010, respectively. Prior to our Reorganization as a corporation on January 1, 2013, we operated as a limited liability company and were substantially supported by the continued financial support provided by our majority member. These conditions raised substantial doubt as to our ability to continue as a going concern. In connection with the completion of our initial public offering in February 2013, we received unrestricted net proceeds after expenses from the sale of our common stock of approximately $90,371. We believe that the unrestricted net proceeds obtained through this transaction have alleviated the substantial doubt and will be sufficient to support our operations through July 1, 2014.
The following table summarizes the significant components of cash flows for the six month periods ended June 30, 2013 and 2012, and years ended December 31, 2012, 2011 and 2010, and our cash and cash equivalents balance at June 30, 2013, and December 31, 2012, 2011, and 2010:
| Six Months Ended June 30, |
Year
Ended December 31, |
|||||||||||||||||||
| 2013 | 2012 | 2012 | 2011 | 2010 | ||||||||||||||||
| Cash used for operating activities |
$ | (7,133 | ) | $ | (7,498 | ) | $ | (9,803 | ) | $ | (2,436 | ) | $ | (5,912 | ) | |||||
| Cash used for investing activities |
(3,875 | ) | (1,518 | ) | (1,724 | ) | (1,080 | ) | (1,795 | ) | ||||||||||
| Cash provided by financing activities |
72,882 | 6,142 | 11,003 | 5,931 | 7,811 | |||||||||||||||
| Effect of exchange rate changes on cash and cash equivalents |
(126 | ) | (28 | ) | (170 | ) | 60 | 273 | ||||||||||||
|
|
|
|
|
|
|
|
|
|
|
|||||||||||
| Net change in cash and cash equivalents |
$ | 61,748 | $ | (2,902 | ) | $ | (694 | ) | $ | 2,475 | $ | 377 | ||||||||
|
|
|
|
|
|
|
|
|
|
|
|||||||||||
| June 30, 2013 |
December 31, | |||||||||||||||||||
| 2012 | 2011 | 2010 | ||||||||||||||||||
| Cash and cash equivalents |
$ | 64,550 | $ | 2,802 | $ | 3,496 | $ | 1,021 | ||||||||||||
|
|
|
|
|
|
|
|
|
|||||||||||||
Operating Activities
Cash used for operating activities for the six months ended June 30, 2013, was $7,133 compared with $7,498 for the six months ended June 30, 2012. The decrease of $365, or 4.9%, was mostly attributed to decreases in net changes in assets and liabilities as a result of (i) increased collections activity on accounts receivable (mostly due to fourth quarter 2012 machine unit sales) and (ii) a reduction in net outflows associated with inventories (as the increase in machine production activity has leveled off from the six months ended June 30, 2012) offset by (i) an increase in outflows associated with prepaid expenses and other current assets (attributed mostly to vendor prepayment activity), (ii) an increase in outflows associated with accounts payable (based on increased purchasing activity and the timing of payment) and (iii) a decrease in deferred revenue and customer prepayments as a result of an increase in product delivery to customers.
52
Table of Contents
Cash used for operating activities for the year ended December 31, 2012 was $9,803 compared with $2,436 for the year ended December 31, 2011. The increase of $7,367, or 302.4%, was attributed to increases in net working capital of $13,544 (mostly increases in accounts receivable and inventories as a result of increased selling and production activity) slightly offset by increases to accounts payable and accrued expenses, also linked to selling and production activity. The increase in net working capital was offset by an increase of cash earnings in 2012 of $6,177 (net loss less non-cash items).
Cash used for operating activities for the year ended December 31, 2011 was $2,436 compared with $5,912 for the year ended December 31, 2010. The decrease of $3,476, or 58.8%, was attributed to sources of cash of (i) an increase in deferred revenue and customer prepayments of $4,377 mostly due to increased prepayments from customers on 3D printing machine sales, (ii) an increase in cash from accounts receivable of $2,902 as a result of collections of outstanding amounts due and (iii) an increase in amounts attributable to accrued expenses and other liabilities of $1,076 mostly due to an increase in accrued income taxes. Offsetting these sources were uses of cash of (i) $2,437 attributed to an increase in the net loss from 2011 compared to 2010, (ii) $1,982 in increases attributable to inventory (mostly due to additional raw material purchases and one 3D printing machine included in finished goods compared to zero in 2010).
Investing Activities
Cash used for investing activities for the six months ended June 30, 2013, was $3,875 compared with $1,518 for the six months ended June 30, 2012. The increase of $2,357, or 155.3%, was primarily attributed to the cash flow effect of deconsolidating certain variable interest entities previously under our control. Remaining cash outflows for both periods related to capital expenditures, principally costs incurred to support the construction of 3D printing machines and micromachinery at our facilities in the United States and Germany.
Beginning in the second half of 2013, we intend to commence an expansion of our facilities in Germany to increase our 3D printing machine manufacturing, PSCs and other administrative facilities located there. Included in our expansion plans are the purchase of land and construction of a new facility comprising approximately 175,000 square feet. Estimated costs of the acquisition of land and construction of the new facility are approximately $20,000 and are expected to be incurred through 2014.
Separately, we also plan to establish two new PSCs in the second half of 2013 (one in Auburn, Washington and a second in a yet to be determined location). We estimate the cost associated with opening such PSCs to range from $2,000 to $4,000 for each location.
Cash used for investing activities for the year ended December 31, 2012 was $1,724 compared with $1,080 for the year ended December 31, 2011 and $1,795 for the year ended December 31, 2010. The use of cash for each of the three years was attributed to capital expenditures, principally to support the construction of 3D printing machines at our facilities in the United States and Germany.
Financing Activities
Cash provided by financing activities for the six months ended June 30, 2013, was $72,882 compared with $6,142 for the six months ended June 30, 2012.
The principal source of cash for the six months ended June 30, 2013, was net proceeds from our initial public offering of $91,083. Offsetting this source of cash were outflows of (i) $528 associated with the repayment of amounts outstanding on a line of credit facility held by our German subsidiary, (ii) $9,885 associated with the repayment of amounts outstanding on the demand note payable to member (which was subsequently retired by us), (iii) $7,332 associated with the repayment of other outstanding debt and principal payments on financing leases, including repayment of all of the debt assumed from our VIEs in connection with the acquisition of net assets on March 27, 2013 and settlement of our financing lease obligation with a related
53
Table of Contents
party for a cash payment of approximately $1,372 during the quarter ended June 30, 2013, and (iv) $456 in preferred stock dividends paid prior to conversion of preferred stock to common stock upon closing of our initial public offering.
The principal sources of cash for the six months ended June 30, 2012, were (i) net borrowings on the demand note payable to member of approximately $5,479 to support operations, (ii) net borrowings on a line of credit facility held by our German subsidiary of approximately $913 to support operations, and (iii) proceeds from financing leases of $985 used to finance 3D printing machine production. Offsetting these sources of cash were long-term debt and financing lease repayments of approximately $1,235.
Cash provided by financing activities for the year ended December 31, 2012 was $11,003 compared with $5,931 for the year ended December 31, 2011 and $7,811 for the year ended December 31, 2010.
The principal sources of cash in 2012 were (i) net borrowings on our line of credit of $528 to support operations, (ii) net borrowings on the demand note payable to member of $8,629 to support operations, and (iii) proceeds from long-term debt and financing leases of $4,707 used to finance 3D printing machine production. Offsetting these sources of cash were long-term debt and financing lease repayments of $2,063.
At December 31, 2012, we identified that we were not in compliance with the annual cash flow-to-debt service ratio covenant associated with our ExOne building note payable to a bank. We requested and were granted a waiver related to compliance with this covenant through December 31, 2013. Related to our 2012 noncompliance, there were no cross default provisions or related impacts on other lending agreements.
The principal sources of cash in 2011 were (i) net borrowings on the demand note payable to member of $3,939 to support operations, (ii) proceeds from long-term debt of $2,398 used to finance 3D printing machine production and (iii) contributions from noncontrolling interests of $402. Offsetting these sources of cash were long-term debt repayments of $808.
The principal source of cash in 2010 was the net borrowings on the demand note payable to member of $12,290 to support operations. Offsetting this source of cash were long-term debt repayments of $4,479.
At December 31, 2011, we identified that we were not in compliance with the annual minimum equity-to-asset ratio covenant associated with our line of credit. The bank did not take action related to this noncompliance. At December 31, 2012, we were in compliance with this covenant. Related to our 2011 noncompliance, there were no cross default provisions or related impacts on other lending agreements.
Contractual Obligations
We are required to make future payments under various contracts, including debt agreements, financing lease agreements and operating lease agreements. At June 30, 2013, a summary of our outstanding contractual obligations is as follows:
| Total | 1 Year | 1-3 Years | 3-5 Years | Thereafter | ||||||||||||||||
| Operating activities: |
||||||||||||||||||||
| Operating leases |
$ | 558 | $ | 395 | $ | 141 | $ | 22 | $ | — | ||||||||||
| License fee obligations |
731 | 531 | 200 | — | — | |||||||||||||||
| Deferred revenue and customer prepayments |
2,170 | 1,980 | 190 | — | — | |||||||||||||||
| Financing activities: |
||||||||||||||||||||
| Long-term debt |
2,270 | 124 | 264 | 282 | 1,600 | |||||||||||||||
| Capital and financing leases |
1,229 | 507 | 636 | 86 | — | |||||||||||||||
| Interest |
850 | 145 | 194 | 155 | 356 | |||||||||||||||
|
|
|
|
|
|
|
|
|
|
|
|||||||||||
| Total |
$ | 7,809 | $ | 3,682 | $ | 1,626 | $ | 545 | $ | 1,956 | ||||||||||
|
|
|
|
|
|
|
|
|
|
|
|||||||||||
54
Table of Contents
Operating Leases
Operating leases consist of various lease agreements of manufacturing facilities, office and warehouse spaces, equipment and vehicles, expiring in various years through 2017.
License Fee Obligations
License fee obligations include amounts contractually due to third parties for use of patented technology, expiring in various years through 2016.
Deferred Revenue and Customer Prepayments
Deferred revenue and customer prepayments require us to deliver 3D printing machines or other products or services to customers over a specified contract period. While these obligations are not expected to result in cash payments, they represent contractual obligations for which we would be obligated if the specified deliveries could not be made. Excluded from these amounts are approximately $4,800 in firm orders received from customers which we expect to deliver in the next twelve months.
Long-Term Debt
As of June 30, 2013, long-term debt consists of the following instruments (i) a line of credit held by our German subsidiary; and (ii) the current and noncurrent portion of notes payable used to finance the acquisition of a building. Maturity of our long-term debt extends to 2027.
Capital and Financing Leases
Capital and financing leases consist of obligations associated with (i) leased assets or (ii) sale-leaseback transactions required to be accounted for as financings. Maturity of our capital and financing leases extends to 2017.
Interest
Interest related to long-term debt and capital and financing leases is based on interest rates in effect at June 30, 2013, and is calculated on instruments with maturities that extend to 2027.
Other
Excluded from contractual obligations are the estimated costs associated with (i) our planned PSC expansion (approximately $20,000 to $25,000), (ii) our planned facility expansion in Gersthofen, Germany (approximately $20,000), (iii) expansion of our material development activities (approximately $2,000 to $3,000) and (iv) our planned selection and deployment of an ERP system (approximately $3,000), as amounts currently estimated do not represent firm purchase commitments.
Off Balance Sheet Arrangements
We are not a party to any off balance sheet arrangements.
Recently Issued and Adopted Accounting Guidance
In February 2013, the FASB issued guidance changing the requirements of companies’ reporting of amounts reclassified out of accumulated other comprehensive income (loss). These changes require an entity to report the effect of significant reclassifications out of accumulated other comprehensive income (loss) on the respective line items in net income (loss) if the amount being reclassified is required to be reclassified in its entirety to net income (loss). For other amounts that are not required to be reclassified in their entirety to net income (loss) in the same reporting period, an entity is required to cross-reference other disclosures that provide additional detail about those amounts. These requirements are to be applied to each component of accumulated other
55
Table of Contents
comprehensive income (loss). This change becomes effective for the Company on January 1, 2014. Other than the additional disclosure requirements, management has determined that the adoption of these changes will not have an impact on our consolidated financial statements.
In July 2013, the FASB issued guidance clarifying the presentation of unrecognized tax benefits when a net operating loss carryforward, a similar tax loss or a tax credit carryforward exists. The amendment requires that unrecognized tax benefits be presented in the consolidated financial statements as a reduction to a deferred tax asset for a net operating loss carryforward, a similar tax loss, or a tax credit carryforward, unless certain exceptions exist. This change becomes effective for the Company on January 1, 2015. The adoption of this guidance is not expected to have a material impact on our consolidated financial statements.
On January 1, 2012, we adopted changes issued by the FASB to conform existing guidance regarding fair value measurement and disclosure between GAAP and International Financial Reporting Standards. These changes both clarify the FASB’s intent about the application of existing fair value measurement and disclosure requirements and amend certain principles or requirements for measuring fair value or for disclosing information about fair value measurements. The clarifying changes relate to the application of the highest and best use and valuation premise concepts, measuring the fair value of an instrument classified in a reporting entity’s equity, and disclosure of quantitative information about unobservable inputs used for Level 3 fair value measurements. The amendments relate to measuring the fair value of financial instruments that are managed within a portfolio; application of premiums and discounts in a fair value measurement; and additional disclosures concerning the valuation processes used and sensitivity of the fair value measurement to changes in unobservable inputs for those items categorized as Level 3, a reporting entity’s use of a nonfinancial asset in a way that differs from the asset’s highest and best use, and the categorization by level in the fair value hierarchy for items required to be measured at fair value for disclosure purposes only. Other than the additional disclosure requirements, the adoption of these changes had no impact on our consolidated financial statements.
On January 1, 2012, we adopted changes issued by the FASB to the presentation of comprehensive income (loss). These changes give an entity the option to present the total of comprehensive income (loss), the components of net income (loss), and the components of other comprehensive income (loss) either in a single continuous statement or in two separate but consecutive statements. The option to present components of other comprehensive income (loss) as part of the statement of changes in members’ equity was eliminated. The items that must be reported in other comprehensive income (loss) or when an item of other comprehensive income (loss) must be reclassified to net income (loss) were not changed. Additionally, no changes were made to the calculation and presentation of earnings per share (unit). We elected to present the single continuous statement option. Other than the change in presentation, the adoption of these changes had no impact on our consolidated financial statements.
Quantitative and Qualitative Disclosures About Market Risk
We are exposed to market risk from fluctuations in foreign currency exchange rates which may adversely affect our results of operations and financial condition. We seek to minimize these risks through regular operating and financing activities and, when we consider it to be appropriate, through the use of derivative financial instruments. We do not purchase, hold or sell derivative financial instruments for trading or speculative purposes.
The local currency is the functional currency for significant operations outside of the United States. The determination of the functional currency of an operation is made based on the appropriate economic and management indicators.
Foreign currency assets and liabilities are translated into their U.S. dollar equivalents based on year end exchange rates, and are included in stockholders’ equity (deficit) as a component of comprehensive income (loss). Revenues and expenses are translated at average exchange rates. Transaction gains and losses that arise
56
Table of Contents
from exchange rate fluctuations are charged to operations as incurred, except for gains and losses associated with intercompany receivables and payables for which settlement is not planned or anticipated in the foreseeable future, which are included in accumulated other comprehensive loss in the consolidated balance sheets.
We transact business globally and are subject to risks associated with fluctuating foreign exchange rates. The geographic areas outside the United States in which we operate are generally not considered to be highly inflationary. Approximately 63.8% and 34.0% of our consolidated revenue was derived from transactions outside the United States for the quarters ended June 30, 2013 and 2012, respectively. Approximately 65.0% and 44.1% of our consolidated revenue was derived from transactions outside the United States for the six months ended June 30, 2013 and 2012, respectively. Approximately 72.8%, 70.0% and 70.7% of our consolidated revenue was derived from transactions outside the United States for the years ended December 31, 2012, 2011 and 2010, respectively.
This revenue is generated primarily from wholly-owned subsidiaries operating in their respective countries and surrounding geographic areas. This revenue is primarily denominated in each subsidiary’s local functional currency, including the Euro and Japanese Yen. A hypothetical change in foreign exchange rates of +/- 10.0% for the quarter and six months ended June 30, 2013, would result in an increase (decrease) in revenue of approximately $600 and $1,100, respectively. A hypothetical change in foreign exchange rates of +/- 10.0% for the year ended December 31, 2012, would result in an increase (decrease) in revenue of approximately $2,100. These subsidiaries incur most of their expenses (other than intercompany expenses) in their local functional currencies.
Critical Accounting Policies and Estimates
The consolidated financial statements of the Company are prepared in conformity with GAAP. The preparation of these consolidated financial statements requires management to make certain judgments, estimates and assumptions regarding uncertainties that affect the reported amounts of assets, liabilities, revenue and expenses and related disclosure of contingent assets and liabilities. Areas that require significant judgments, estimates and assumptions include accounting for inventories (including the allowance for slow moving and obsolete inventory); product warranty reserves; equity-based compensation (including the fair value of common units used to measure equity-based compensation); income taxes (including the valuation allowance on certain deferred tax assets) and future cash flow estimates associated with long-lived assets for purposes of impairment testing. We base our estimates on historical experience and on various other assumptions that are believed to be reasonable, the results of which forms the basis for making judgments about the carrying values of assets and liabilities that are not readily apparent from other sources. Actual results may differ from these estimates.
Revenue Recognition
Revenue from the sale of 3D printing machines and related 3D printed products and materials is recognized upon transfer of title, generally upon shipment. Revenue from the performance of contract services or production services is generally recognized when either the services are performed or the finished product is shipped. Revenue for all deliverables in a sales arrangement is recognized provided that persuasive evidence of a sales arrangement exists, both title and risk of loss have passed to the customer and collection is reasonably assured. Persuasive evidence of a sales arrangement exists upon execution of a written sales agreement or signed purchase order that constitutes a fixed and legally binding commitment between us and our customer. In instances where revenue recognition criteria are not met, amounts are recorded as deferred revenue and customer prepayments in the consolidated balance sheets.
We enter into sales arrangements that may provide for multiple deliverables to a customer. Sales of machines may include consumables, maintenance services, and training and installation. We identify all goods and services that are to be delivered separately under a sales arrangement and allocate revenue to each deliverable based on relative fair values. Fair values are generally established based on the prices charged when
57
Table of Contents
sold separately. In general, revenues are separated between machines, consumables, maintenance services and installation and training services. The allocated revenue for each deliverable is then recognized ratably based on relative fair values of the components of the sale. We also evaluate the impact of undelivered items on the functionality of delivered items for each sales transaction and, where appropriate, defer revenue on delivered items when that functionality has been affected. Functionality is determined to be met if the delivered products or services represent a separate earnings process. Revenue from maintenance services as well as installation is recognized at the time of performance.
We provide customers with a standard warranty on all machines generally over a period of twelve months from the date of installation at the customer’s site. The warranty is not treated as a separate service because the warranty is an integral part of the sale of the machine. After the initial one year warranty period, we offer our customers optional maintenance contracts. Deferred maintenance service revenue is recognized when the maintenance services are performed since we have historical evidence that indicates that the costs of performing the services under the contract are not incurred on a straight-line basis.
We sell equipment with embedded software to our customers. The embedded software is not sold separately and it is not a significant focus of our marketing effort. We do not provide post-contract customer support specific to the software or incur significant costs that are within the scope of FASB guidance on accounting for software to be leased or sold. Additionally, the functionality that the software provides is marketed as part of the overall product. The software embedded in the equipment is incidental to the equipment as a whole such that the FASB guidance referenced above is not applicable. Sales of these products are recognized in accordance with FASB guidance on accounting for multiple-element arrangements.
Shipping and handling costs billed to customers for machine sales and sales of consumables are included in revenue in the consolidated statement of operations and other comprehensive loss. Costs incurred by us associated with shipping and handling is included in cost of sales in the consolidated statement of operations and comprehensive loss.
Our terms of sale generally require payment within 30 to 60 days after shipment of a product, although we also recognize that longer payment periods are customary in some countries where we transact business. To reduce credit risk in connection with machine sales, we may, depending upon the circumstances, require certain amounts be prepaid prior to shipment. In some circumstances, we may require payment in full for our products prior to shipment and may require international customers to furnish letters of credit. These prepayments are reported as deferred revenue and customer prepayments in the consolidated balance sheets. Production and contract services are billed on a time-and-materials basis. Services under maintenance contracts are billed to customers upon performance of services in accordance with the contract.
Cash and Cash Equivalents
We consider all highly liquid instruments with maturities when purchased of three months or less to be cash equivalents. Our policy is to invest cash in excess of short-term operating and debt-service requirements in such cash equivalents. These instruments are stated at cost, which approximates fair value because of the short maturity of the instruments. We maintain cash balances with financial institutions located in the United States, Germany, and Japan. We place our cash with high quality financial institutions and believe our risk of loss is limited; however, at times, account balances may exceed international and federally insured limits. We have not experienced any losses associated with these cash balances.
Accounts Receivable
Accounts receivable are reported at their net realizable value. Our estimate of the allowance for doubtful accounts related to trade receivables is based on our evaluation of customer accounts with past-due outstanding balances or specific accounts for which we have information that the customer may be unable to meet its
58
Table of Contents
financial obligations. Based upon review of these accounts, and management’s analysis and judgment, we record a specific allowance for that customer’s accounts receivable balance to reduce the outstanding receivable balance to the amount expected to be collected. The allowance is re-evaluated and adjusted periodically as additional information is received that impacts the allowance amount reserved. At June 30, 2013, December 31, 2012 and December 31, 2011, the allowance for doubtful accounts was approximately $75, $83 and $43, respectively.
Inventories
We value all of our inventories at the lower of cost, as determined on the first-in, first-out (FIFO) method or market value. Overhead is allocated to work in progress and finished goods based on normal capacity of our production facilities. Fixed overhead associated with production facilities that are being operated below normal capacity are recognized as a period expense rather than being capitalized as a product cost. An allowance for slow-moving and obsolete inventories is provided based on historical experience and current product demand. These provisions reduce the cost basis of the respective inventory and are recorded as a charge to cost of sales. At June 30, 2013, December 31, 2012 and December 31, 2011, the allowance for slow-moving and obsolete inventories was approximately $859, $891 and $1,401, respectively.
Property and Equipment
Property and equipment are recorded at cost and depreciated on a straight-line basis over the estimated useful lives of the related assets, generally three to twenty-five years. Leasehold improvements are amortized on a straight-line basis over the shorter of (i) their estimated useful lives or (ii) the estimated or contractual lives of the related leases. Gains or losses from the sale of assets are recognized upon disposal or retirement of the related assets and are generally recorded in other (income) expense — net on the statement of consolidated operations and comprehensive loss. Repairs and maintenance are charged to expense as incurred.
We evaluate long-lived assets for impairment whenever events or changes in circumstances indicate that the carrying amount of such assets (asset group) may not be recoverable. Recoverability of assets is determined by comparing the estimated undiscounted net cash flows of the operations related to the assets (asset group) to their carrying amount. An impairment loss would be recognized when the carrying amount of the assets (asset group) exceeds the estimated undiscounted net cash flows. The amount of the impairment loss to be recorded is calculated as the excess of carrying value of assets (asset group) over their fair value, with fair value determined using the best information available, which generally is a discounted cash flow model. The determination of what constitutes an asset group, the associated undiscounted net cash flows, and the estimated useful lives of assets require significant judgments and estimates by management. We recorded no impairment losses during the six months ended June 30, 2013 or years ended December 31, 2012, 2011 or 2010.
Product Warranty Reserves
Substantially all of our 3D printing machines are covered by a warranty, generally over a period of twelve months from the date of installation at the customer’s site. A liability is recorded for future warranty costs in the same period in which the related revenue is recognized. The liability is based on anticipated parts and labor costs using historical experience. We periodically assess the adequacy of the product warranty reserves based on changes in these factors and record any necessary adjustments if actual experience indicates that adjustments are necessary. Future claims experience could be materially different from prior results because of the introduction of new, more complex products, a change in our warranty policy in response to industry trends, competition or other external forces, or manufacturing changes that could impact product quality. In the event that we determine that our current or future product repair and replacement costs exceed estimates, an adjustment to these reserves would be charged to cost of sales in the statement of consolidated operations and comprehensive loss in the period such a determination is made. At June 30, 2013, December 31, 2012 and December 31, 2011, product warranty reserves were approximately $616, $554 and $117, respectively, and were included in accrued expenses and other current liabilities in the consolidated balance sheets.
59
Table of Contents
Income Taxes
Prior to our Reorganization as a corporation on January 1, 2013, we were organized as a limited liability company. Under the provisions of the Internal Revenue Code and similar state provisions, we were taxed as a partnership and were not liable for income taxes. Instead, earnings and losses were included in the tax returns of our members. Therefore, the consolidated financial statements do not reflect a provision for U.S. federal or state income taxes.
Our subsidiaries in Germany and Japan are taxed as corporations under the taxing regulations of Germany and Japan, respectively. As a result, the consolidated statement of operations and comprehensive loss includes tax expense related to these foreign jurisdictions.
We recognize the tax benefit from an uncertain tax position only if it is more likely than not that the tax position will be sustained on examination by the taxing authorities based on the technical merits of the position. The tax benefits recognized in the financial statements from such positions are then measured based on the largest amount that has a greater than 50% likelihood of being realized upon settlement. Tax benefits that do not meet the more likely than not criteria are recognized when effectively settled, which generally means that the statute of limitations has expired or that appropriate taxing authority has completed its examination even through the statute of limitations remains open. Interest and penalties related to uncertain tax positions are recognized as part of the provision for income taxes and are accrued beginning in the period that such interest and penalties would be applicable under relevant tax law until such time that the related tax benefits are recognized.
We recognize deferred tax assets and liabilities for the differences between the financial statement carrying amounts and the tax basis of assets and liabilities of our wholly-owned subsidiaries in Germany and Japan using enacted tax rates in effect in the years in which the differences are expected to reverse. Valuation allowances are established when necessary to reduce foreign deferred tax assets to the amount expected to be realized.
Derivative Financial Instruments
We are exposed to market risk from changes in interest rates and foreign currency exchange rates, which may adversely affect our results of operations and financial condition. We seek to minimize these risks through regular operating and financing activities and, when we consider it to be appropriate, through the use of derivative financial instruments.
Prior to March 27, 2013, we held interest rate swaps for the purpose of managing risks related to the variability of future earnings and cash flows caused by changes in interest rates. We had elected not to prepare and maintain the documentation required to qualify for hedge accounting treatment and therefore, all gains and losses (realized or unrealized) related to derivative instruments were recognized as interest expense in the statement of consolidated operations and comprehensive loss. Fair value of the interest rate swaps were reported as accrued expenses and other current liabilities in the consolidated balance sheets. We do not purchase, hold or sell derivative financial instruments for trading or speculative purposes. At June 30, 2013, we held no interest rate swaps.
We held no foreign currency contracts during the six months ended June 30, 2013 or years ended December 31, 2012 or 2011. During 2010, we entered into a foreign currency contract to hedge our exposure arising from the sale of inventory. We recognized a loss of approximately $76 during 2010 in connection with this transaction and the termination of this contract.
60
Table of Contents
Taxes on Revenue Producing Transactions
Taxes assessed by governmental authorities on revenue producing transactions, including sales, excise, value added and use taxes, are recorded on a net basis (excluded from revenue) in the consolidated statement of operations and comprehensive loss.
Research and Development
We are continuously involved in research and development of new methods and technologies relating to our products. All research and development costs are charged to expense as incurred.
Advertising
Advertising costs are charged to expense as incurred and were not significant for the six months ended June 30, 2013 or the years ended December 31, 2012, 2011 or 2010.
Defined Contribution Plan
We sponsor a defined contribution savings plan under section 401(k) of the Internal Revenue Code. Under the plan, participating employees in the United States may elect to defer a portion of their pre-tax earnings, up to the Internal Revenue Service annual contribution limit. We make matching contributions of 50% of the first 8% of employee contributions, subject to certain Internal Revenue Service limitations. Our matching contributions to the plan were not significant for the six months ended June 30, 2013 or the years ended December 31, 2012, 2011 or 2010.
61
Table of Contents
Equity-Based Compensation
We recognize compensation expense for equity-based grants using the straight-line attribution method, in which the expense (net of estimated forfeitures) is recognized ratably over the requisite service period based on the grant date fair value. Fair value of equity-based awards is estimated on the date of grant using the Black-Scholes pricing model. We recognized approximately $311 in equity-based compensation expense for the six months ended June 30, 2013. We recognized approximately $7,735 in equity-based compensation expense for the year ended December 31, 2012. There was no equity-based compensation expense recognized during the years ended December 31, 2011 or 2010.
Supplemental Quarterly Financial Information (Unaudited)
(dollars in thousands, except per-share amounts)
| Quarter Ended | ||||||||
| June 30, 2013 |
March 31, 2013 |
|||||||
| Revenue |
$ | 9,230 | $ | 7,934 | ||||
| Gross profit |
$ | 4,181 | $ | 2,838 | ||||
| Net loss attributable to ExOne* |
$ | (1,120 | ) | $ | (1,914 | ) | ||
| Net loss attributable to ExOne per common share**: |
||||||||
| Basic |
$ | (0.08 | ) | $ | (0.20 | ) | ||
| Diluted |
$ | (0.08 | ) | $ | (0.20 | ) | ||
| Quarter Ended | ||||||||||||||||
| December 31, 2012 |
September 30, 2012 |
June 30, 2012 |
March 31, 2012 |
|||||||||||||
| Revenue |
$ | 12,744 | $ | 8,515 | $ | 4,676 | $ | 2,722 | ||||||||
| Gross profit |
$ | 6,248 | $ | 3,556 | $ | 1,523 | $ | 816 | ||||||||
| Net income (loss) attributable to ExOne* |
$ | 902 | $ | (5,932 | ) | $ | (3,609 | ) | $ | (1,529 | ) | |||||
| Quarter Ended | ||||||||||||||||
| December 31, 2011 |
September 30, 2011 |
June 30, 2011 |
March 31, 2011 |
|||||||||||||
| Revenue |
$ | 2,718 | $ | 6,021 | $ | 2,303 | $ | 4,248 | ||||||||
| Gross profit |
$ | 398 | $ | 2,219 | $ | 18 | $ | 1,008 | ||||||||
| Net loss attributable to ExOne* |
$ | (2,766 | ) | $ | (839 | ) | $ | (2,988 | ) | $ | (1,444 | ) | ||||
| * | Net loss attributable to ExOne includes $200 and $111 in equity-based compensation expense for the quarters ended June 30, 2013 and March 31, 2013, respectively. Net loss attributable to ExOne includes $5,950 and $1,785 in equity-based compensation expense for the quarters ended September 30, 2012 and June 30, 2012, respectively. There was no equity-based compensation expense recorded by ExOne during any other quarter in 2012 or 2011. |
| ** | Per-share amounts are calculated independently for each quarter presented; therefore the sum of the quarterly per-share amounts may not equal the per-share amounts for the year. Per-share or per-unit amounts for 2012 and 2011 are not comparable as a result of our Reorganization as a corporation on January 1, 2013. |
62
Table of Contents
The Company
We are a global provider of 3D printing machines and printed products, materials and other services to industrial customers. Our business primarily consists of manufacturing and selling 3D printing machines and printing products to specification for our customers using our in-house 3D printing machines. We offer pre-production collaboration and print products for customers through our six PSCs, which are located in the United States, Germany and Japan. We build 3D printing machines at our facilities in the United States and Germany. We also supply the associated materials, including consumables and replacement parts, and other services, including training and technical support, necessary for purchasers of our machines to print products. We believe that our ability to print in a variety of industrial materials, as well as our industry-leading printing capacity (as measured by build box size and printhead speed), uniquely position us to serve the needs of industrial customers.
Our 3D printing machines use our binder jetting technology, powdered materials, chemical binding agents and integrated software to print 3D products directly from computer models by repeatedly depositing very thin layers of powdered materials and selectively placing chemical binding agents to form the printed product. One of our key industry advantages is that our machines are able to print products in materials which are desired by industrial customers. Currently, our 3D printing machines are able to manufacture casting molds and cores from specialty silica sand and ceramics, which are the traditional materials for these casting products. Of equal importance, our 3D printing machines are capable of direct product materialization by printing in industrial metals, including stainless steel, bronze, iron, and bonded tungsten. We are in varying stages of qualifying additional industrial materials for printing, such as titanium, tungsten carbide, aluminum, and magnesium, and our current material development plan calls for an additional industrial material to be qualified every six months.
We believe that we are a leader in providing 3D printing machines, 3D printed products and related services to industrial customers in the aerospace, automotive, heavy equipment, energy/oil/gas and other industries. In an effort to further solidify this position, the net proceeds from our initial public offering have been earmarked or spent in order to (1) expand our PSC network to fifteen global locations by the end of 2015, (2) increase capacity and upgrade technology in our production facilities in Germany, including consolidating our operations from five buildings located throughout the district of Augsburg to one purpose-built facility, (3) expand our materials development initiatives and achieve our plan of one new industrial material qualified every six months, (4) select and deploy an Enterprise Resource Planning (“ERP”) system to promote operational efficiency and financial controls globally, (5) payoff existing debt, and (6) deploy working capital to support growth. These uses of proceeds and priorities are consistent with the plan outlined by us during our initial public offering and communicated to our stockholders thereafter.
We believe that we can accelerate our growth through the integration of related technologies and services that expand or complement our current 3D printing capabilities. We are continually evaluating potential acquisitions, alliances, and strategic investments that would enhance our growth profile. These integration opportunities include, but are not limited to, driving customer demand for our technology by improving all phases of the production cycle, including enhancements to pre-print, such as CAD, simulation, and design optimization, as well as post-print processing, including metal finishing technologies and precision casting capabilities.
The Additive Manufacturing Industry and 3D Printing
3D printing is the most common type of an emerging manufacturing technology broadly referred to as additive manufacturing (“AM”). In general, AM is a term used to describe a manufacturing process that produces 3D objects directly from digital or computer models through the repeated deposit of very thin layers of material. 3D printing is the process of joining materials from a digital 3D model, usually layer by layer, to make objects using a printhead, nozzle or other printing technology. The terms “AM” and “3D printing” are increasingly being used interchangeably as the media and marketplace have popularized the term 3D printing rather than AM, the industry term.
63
Table of Contents
AM represents a transformational shift from traditional forms of manufacturing (e.g., machining or tooling) sometimes referred to as subtractive manufacturing. We believe that AM and 3D printing are poised to displace traditional manufacturing methodologies in a growing range of industrial applications. Our 3D printing process differs from other forms of 3D printing processes in that we use a chemical binding agent and focus on industrial products and materials.
The following uses of AM are described by IDA Science and Technology Policy Institute, Additive Manufacturing: Status and Opportunities, March 2012:
| • | Casting Patterns and Tooling. A broad application of AM is creating patterns for casting molds and for tooling. Casting molds are used to make metal parts by pouring molten metal into the casting mold. We print molds directly from CAD data. In contrast, the traditional process requires a wooden pattern to be built to create the mold. |
| • | Direct Part Manufacturing. Direct part manufacturing is the creation of products for an end user. We expect direct part production to be the fastest growing application for AM industrial applications. Direct part manufacturing grew to more than 28% of total AM product and service revenues in 2012, up from approximately 4% in 2003, according to the 2013 Wohlers Report. |
| • | Prototyping. AM is used for the creation of prototypes, 3D models and functional models as part of a product design process whereby a product is printed, evaluated, redesigned and printed again. Many of our competitors print prototypes in resin polymers or other plastics. Our advantage in prototyping over our competitors who use resin polymers is that we are able to make a prototype for our industrial customers in industrial materials so that their function may be more accurately tested. |
Our 3D printing process provides several benefits over traditional design methods and manufacturing processes, the most critical of which are:
| • | Design Freedom. 3D printing allows designers and engineers the freedom to manufacturing a part that very closely matches their optimal design and expands design possibilities. Traditionally, designers of products have had to make design compromises based on the limitations of how products are created through subtractive manufacturing (i.e., the removal of material from a solid object). 3D printing, on the other hand, permits the manufacture of intricate and complex products which would not be possible or economically feasible to design and produce using subtractive manufacturing. |
| • | Reduced Cost of Complexity. 3D printing technology makes complex products in the same way, and at essentially the same cost, as simple ones. The 3D printing process of building parts by layering very small amounts of material can just as easily make a simple solid product as a highly complex and intricate product. Because a complex product can require less material than a simple solid product, the complex product may be even less expensive to make using 3D printing technology than a simple product. In contrast, in subtractive manufacturing, the cost of production generally increases with the complexity of the manufactured product. |
| • | Mass Customization. 3D printing allows products to be customized with little or no incremental cost because their manufacture is directed by CAD designs without the need for substantial retooling between prints. Each product printed using 3D printing can be identical to, or radically different from, other products that are printed concurrently. Subtractive manufacturing, by contrast, does not provide this flexibility. For example, 3D printing permits us to manufacture products that are identical except each part can have a unique quick response code inscribed on the part to support product tracking. |
| • | Co-Located/Just-in-Time Manufacturing. 3D printing facilities are able to be located in close geographic proximity to customers because, unlike traditional manufacturing methods, 3D printing is not labor intensive and has low tooling and set-up costs. When establishing a manufacturing facility for subtractive manufacturing, labor is often the most important cost variable. As a result, manufacturing operations are often located offshore or in geographically remote locations where labor is cheaper. The |
64
Table of Contents
| proximity of 3D printing operations to customers’ facilitates improves integration and collaboration with product engineers and designers and reduces shipping costs. This proximity also provides customers with an important supply chain management tool by supporting just-in-time availability of products without large inventory buildup. |
| • | Reduced Time Between Design and Production. 3D printing reduces the time required between product conception and production. 3D printing designs can be altered quickly, remotely and inexpensively without costly extensive retooling as the design is refined. We believe that increasing the speed at which products can be designed, prototyped and integrated into full-scale production is a priority for our industrial customers. |
ExOne and 3D Printing
We provide 3D printing primarily to industrial customers and end-market users. We believe that we are an early entrant into the AM industrial products market and are one of the few providers of 3D printing solutions to industrial customers, including in the aerospace, automotive, heavy equipment and energy/oil/gas industries.
Our binder jetting 3D printing technology was developed over 15 years ago by researchers at MIT. Our machines build or print products from CAD by depositing successive very thin layers of particles of materials such as silica sand or metal powder in a “build box.” A moveable printhead passes over each layer and deposits a chemical binding agent in the selected areas where the finished product will be materialized. Each layer can be unique.
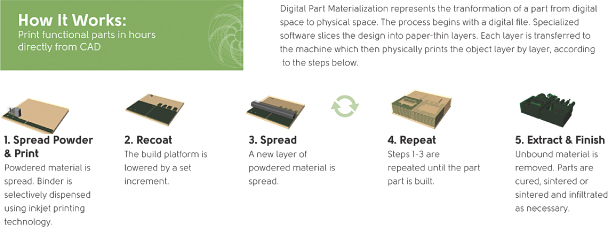
Depending on the industrial material used in printing, printed products may need post-production processing. We generally use silica sand or foundry sand for casting, which requires no additional processing. Products printed in other materials, such as glass or metals, need varying amounts of heat treating or other post-processing.
Pre-Print. We believe that our customers have the opportunity to take greater advantage of the design freedom that our 3D printing technology provides. While we collaborate with our customers to develop and refine CAD designs that meet our customers’ specifications and can be read and processed by our 3D printing machines, we believe that additional pre-print capabilities would empower our customers to fully exploit the design freedom of 3D printing. As a result, we are exploring ways to develop, through a combination of acquisitions, strategic investments, and/or alliances, advanced CAD, simulation, and design optimization tools. With these enhanced pre-print capabilities, our customers will be able to imagine, design, optimize and produce their ideal products, unconstrained by the limitations imposed by traditional manufacturing technologies.
65
Table of Contents
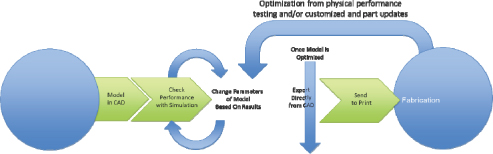
Industrial Materials. As we experience increased demand for our products globally, it is essential that the material supply chain and distribution channels match and be in close proximity to our current and prospective customers. To ensure that such a supply chain exists or quickly develops, we may vertically integrate the supply of our print media. In addition, for the highest quality printed products, the sand grains and metal particles used in the 3D printing process must be uniform in size and meet very specific tolerances. Vertically integrating would have the additional advantage of ensuring that our PSCs and machine customers have certainty of access to the highest quality print media, meeting the exact specifications of our 3D printing machines.
Our Machines. Our 3D printing machines consist of a build box that includes a machine platform and a computer processor controlling the printheads for applying layers of industrial materials and binding agents. We currently build our machines in both Germany and the United States. See “— Our Machines and Machine Platforms.” Our machines are used to produce molds for castings, products for end users and prototypes. In some situations, we can make prototypes in metal rather than resin polymer, or make a part from a mold for the casting of a newly designed part which we then cast at a qualified foundry. As a result, the prototype can be made from the same material as the final production part, which allows more accurate testing of the prototype. We provide a broad spectrum of qualified materials for direct part production and are continuing to qualify additional materials for use in our printing process. See “— Competitive Strengths — Industrial Materials.”
Our machines are primarily used to manufacture industrial products which are ordered in relatively low volumes, are highly complex, and have a high value to the customer. For example, the manufacture of an aircraft requires several complex parts, such as transmission housings (also known as gear-casings), which are needed in relatively low volume and which have a high performance value in the aircraft. There are also a variety of machine parts made in traditional machining processes that can be made more cheaply using those processes. Over time, we may be able to manufacture some of those parts more cost effectively. Our technology is not appropriate for the mass production of simple parts, such as injection molded parts or parts made in metal stamping machines. Traditional manufacturing technology is more economical in making those parts. While we expect over time to be able to increase the kinds of parts that we can make more economically than using subtractive manufacturing, we do not ever expect to use our technology to make simple, low-cost mass produced parts.
The bulk of our machines are used to make complex sand molds, which are used to cast these kinds of parts for several industries, although in some cases we make the end part directly. We intend to expand the direct part production segment of our business as we grow. In addition, as our technologies advance, and our unit cost of production decreases, we believe we can increase the type and number of products that our 3D printing machines can manufacture in a cost-effective manner, expanding our addressable market.
Post-Print Processing. After a part is printed, the bound and unbound powder in the build box requires curing of the chemical binding agent. In the case of molds and cores, curing occurs at room temperature and the printed product is complete after the binder is cured. The mold or core is then poured at a foundry, yielding the finished metal product. We have identified and work with high quality foundries, and we are exploring ways to enhance the quality of precision castings in order to drive additional demand for our molds and cores and the
66
Table of Contents
machine platforms that print them. In conjunction with precision foundry capabilities, we believe that our casting technology offers a number of advantages over traditional casting methods, including increased yield, weight reduction, and improved thermal range.
For other materials, such as stainless steel, bronze, iron, and bonded tungsten, the part needs to be sintered, or sintered and infiltrated. With sintering, the part is placed into a vacuum furnace in an inert atmosphere to sinter the bonded particles and form a strong bonded porous structure. The porous structure can be further infiltrated with another material to fill the voids. After the sintering and infiltration, the part can be polished and finished with a variety of standard industrial methods and coatings. We believe that our direct materialization capabilities enable customers to develop the ideal design for products, free of the design constraints inherent in traditional manufacturing, in the industrial metal of choice and in a more efficient manner than traditional manufacturing methods.
Example of Product Enhancement through Pre-Print Design Optimization
A control arm is typically used in the automotive industry to connect wheels to the structural frame of a vehicle. In traditional manufacturing, control arms are cast with a solid internal structure in aluminum. Weight reduction is generally a design goal to improve a vehicle’s operating performance. We undertook a project to produce a control arm traditionally weighing 5.78 lbs. and then produced the same-sized control arm using both indirect part and direct part materialization using 3D printing. As part of its materialization process, we utilized Finite Element Analysis (“FEA”) Simulation to assess the optimal structures and analyze the achievable benefits using 3D printing.
First, using indirect part materialization and FEA Simulation, we determined that a 3D printed sand core and mold with a cellular structure would improve performance by reducing weight while maintaining the structural support and strength. The 3D printed sand core and mold was cast in aluminum at a foundry utilizing a low-pressure pour as opposed to traditional gravity pour to implement the cellular design. This indirect part materialization design resulted in a weight reduction in the control arm of 0.74 lbs. (5.04 lbs.) over the traditional structure.
Second, by using 3D direct part materialization, we determined that an even more advanced cellular structure, one that is pervaded throughout extended areas of the control arm, could create additional improvements beyond even those obtained in the indirect process. The control arm was 3D printed in stainless steel to evidence the more advanced cellular structure pervaded into additional areas of the control arm. The FEA Simulation evidenced an additional 10% decrease in the control arm weight if the part were printed in aluminum (4.57 lbs.), as compared to the indirect 3D printed process and 26% as compared to traditional manufacturing. We also believe that in applying these optimization techniques, cellular and other advanced structures can be used to enhance strength in design areas of 3D printed products. Our control arm project demonstrates the benefits of pre-print collaboration to determine optimal designs for traditional structures.
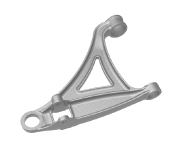
|
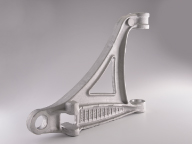
|

| ||
| Traditional control arm cast in |
Indirect Part Materialization— |
Direct Part Materialization—3D |
67
Table of Contents
ExOne Case Studies
The following case studies provide real world illustrations of how our products and services have provided valuable solutions to our customers at significant benefits over traditional subtractive manufacturing.
| • | Printing Sand Molds Employing Patternless 3D Printing Process: We were able to produce lighter and more accurate magnesium castings for Sikorsky utilizing an “as-designed” CAD model in conjunction with digital modeling to assure a sound casting would be produced on the first attempt. Utilizing our pre-print services and 3D printing after the CAD design was completed, we were able to produce a finished casting within two to three weeks. Based on information provided by the customer, we estimate that producing the part would have taken six to eight months using traditional tooling methods. |
68
Table of Contents
| • | Metal Printing for Significant Reduction in Unit Cost and Lead Time: A pump manufacturer needed to manufacture a new impeller design for performance testing, a process whereby a design is created, parts are then made with different configurations of the same part to determine which configuration performs best. We were able to utilize our in-house 3D printing machines at our PSC to produce the impellers in 420 stainless steel from digital renderings provided by our customer. We shipped the impellers within 15 days of our receipt of the purchase order at a cost to the customer of $1,200. Based upon information provided by customers, we estimate that using traditional pattern-based methods of manufacturing to produce the impellers would have cost $5,000 to $15,000 and taken six to twelve weeks. |
Digital Renderings:

|
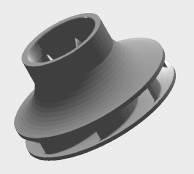
|
Final Product:
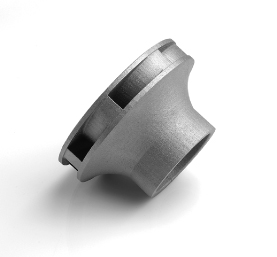
|
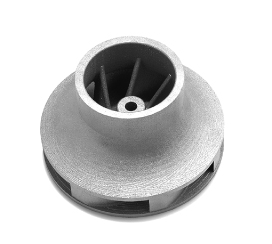
|
69
Table of Contents
| • | Metal Printing at Lower Cost and Greater Wear Resistance: A manufacturer of down hole drilling equipment desired to extend the life of a down-hole application part that is subjected to pressurized abrasive slurry. At a unit-cost of between $75 and $150 (depending upon size), we were able to produce and ship the part in S4 stainless steel/bronze matrix in only 15 to 20 work days. Based on information provided by the customers, we estimate that conventional manufacturing methods would have cost between $400 and $500. In addition, because of our ability to print in stainless steel and bronze, our parts showed greater wear-resistance than parts made with traditional manufacturing methods. |
Final Product:

Greater Wear-Resistance:
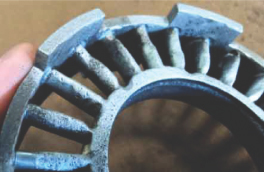
|

| |
| Traditionally manufactured part showed wear after 200-300 hours of use. |
Part created through our metal printing technology showed no measurable wear after 600 hours of use. | |
70
Table of Contents
| • | Metal Printing to Reduce Cost and Provide Consistent Delivery Schedules for Complex Designs: A prosthetic device maker uses our 3D printing to produce intricate terminal ends, a component in prosthetic hands, in a cost-effective manner and on a consistent production schedule. Using additive manufacturing, we are able to produce intricate parts, like the terminal end shown below with stainless steel/bronze matrix parts, in batches of eight to 40 units, at a cost-per-unit of between $25 and $150 (depending upon size) in two to three weeks. Based on information provided by the customer, we estimate that traditional manufacturing methods, such as investment casting or conventional machining, would cost between $250 and $1,500 per unit and require between two and eight weeks for production. |
3D Printed Prosthetic Hand Component

|
CAD Rendering of component |
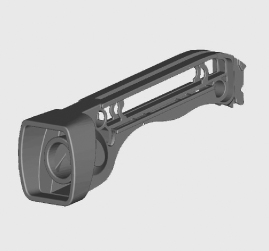
71
Table of Contents
| • | Printing Sand Molds to Achieve Faster Castings at Lower Costs and with Increased Flexibility for Design Changes: We were able to provide a German automaker with a method to quickly and economically produce complex aluminum alloy prototypes utilizing 3D printing of sand molds and cores. Our digital printing process offered significant time and cost advantages over conventional manufacturing methods, and accommodated changes in design rapidly, enabling product design improvements at a reduced cost. We were able to provide sand molds and cores in four hours at a cost per part of approximately $2,000. Based on information provided by the customer, we estimate that traditional methods of sand core forming would be approximately $20,000 to $25,000 per lot. |
CAD Renderings
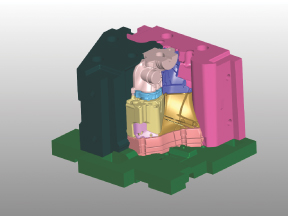
3D Printed Sand Mold
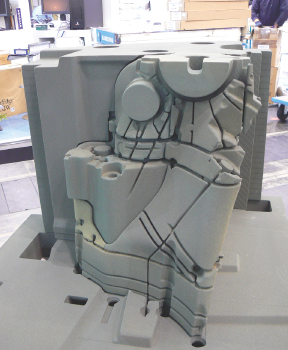
72
Table of Contents
Customers and Sales
Educating Our Customers.
Educating our customers and raising awareness in our target markets about the many uses and benefits of our 3D printing technology is an important part of our sales process. We believe that customers who experience the efficiency gains, decreased lead-time, increased design flexibility, and decreased cost potential of 3D printing, as compared to subtractive manufacturing, are more likely to purchase our machines and be repeat customers of our products. We educate our customers on the design freedom, speed, and other benefits of 3D printing by providing printing and design services and support through our growing number of PSCs. We also seek to expose key potential users to our products through our PSCs, installed machines at customers’ locations, university programs, and sales and marketing efforts. See “— Our Business Strategy.”
Production Service Centers.
We have established a network of six PSCs in North Huntingdon, Pennsylvania; Troy, Michigan; Houston, Texas; Auburn, Washington; Augsburg, Germany; and Kanagawa, Japan. Through our PSCs we provide sales and marketing and delivery of support and printing services to our customers. At our PSCs, our customers see our printing machines in operation and can evaluate their production capabilities before ordering a machine or a printed product. The PSCs are scalable and have a well-defined footprint that can be easily replicated to serve additional regional markets. As described below, placing our PSCs in strategic locations around the world is an important part of our business strategy. See “— Our Business Strategy.”
For all customers, we offer the following support and services through our PSCs:
| • | Pre-production Collaboration. Our pre-print services include data capture using software that enables customers to translate their product vision into a digital design format that can be used as an input to our 3D printing equipment. We help our customers successfully move from the design stage to the production stage, and help customers evaluate the optimal design and industrial materials for their production needs. For example, we worked with a customer to design and manufacture parts that eliminated significant weight from a helicopter, which was possible because of the precision of our AM process. Our machines are also able to deliver a replacement for a product broken by the customer rapidly or often immediately because we will already have the production computer file. Using subtractive manufacturing would take much longer. |
| • | Consumables. We provide customers with the inputs used in our 3D printing machines, including tools, printing media/industrial materials, and bonding agents. |
| • | Training and Technical Support. Our technicians train customers to use our machines through hands-on experience at our PSCs and provide field support to our customers, including design assistance, education on industrial materials, operations and printing training, instruction on cleaning, and maintenance and troubleshooting. |
| • | Replacement Parts and Service. For the first year after purchase of one of our machines, we provide complimentary service and support. Thereafter, we offer a variety of service and support plans. |
Our Competitive Strengths
We believe that our competitive strengths include:
| • | Volumetric Output Rate. We believe that our 3D printing machines provide us the highest rate of volume output per unit of time among competing AM technologies. Because of our early entrance into the industrial market for AM and our investment in our core 3D printing technology, we have been able to improve the printhead speed and build box size of our machines. As a result, we have made strides in improving the output efficiency of our machines, as measured by volume output per unit of time. For |
73
Table of Contents
| example, the machine cost per cubic inch for our mid-size Flex machine is approximately 5% of the comparable machine cost of its predecessor, the R 2, assuming a constant 80% utilization rate over a five-year period. With continued advances in our core 3D printing technologies, we believe that our cost of production will continue to decline, increasing our ability to compete with subtractive manufacturing processes, particularly for complex products, effectively expanding our addressable market. |
| • | Printing Platform Size. The size of the build box area and the platform upon which we construct a product is important to industrial customers, who may want to either make a high number of products per job run or make an industrial product that has large dimensions and is heavy in final form. Our 1,260-liter platform for our S-Max machine is one of the largest commercially available 3D printing build platforms. We believe that our technology and experience give us the potential to develop even larger build platforms to meet the production demands of current and potential industrial customers. In addition, we have created machine platforms in four size ranges in order to cater to the varying demands of our customers. Our two largest platforms, the Max and Print machines, are differentiated from the machines of our competitors in their ability to print in an industrial size and scale. Our M-Lab size platform provides a small build box for lab work and experimentation. |
| • | Industrial Material. Currently, our 3D printing machines are able to manufacture casting molds and cores from specialty silica sand and ceramics, which are the traditional materials for these casting products. Of equal importance, our 3D printing machines are also capable of direct product materialization by printing in industrial metals, including stainless steel, bronze, iron, and bonded tungsten. We are in varying stages of qualifying additional industrial materials for printing, such as titanium, tungsten carbide, aluminum, and magnesium. There is significant demand for products made of these materials. Many AM companies, however, cannot print industrial products in these materials and focus instead on polymer applications. |
| • | Chemical Binding. We use liquid chemical binding agents during the printing process. We believe that our unique chemical binding agent technology can more readily achieve efficiency gains over time than other AM technologies, such as laser-fusing technologies. For instance, in order to increase the print speed of laser-based technologies, another expensive industrial laser must be added to the manufacturing process, raising the unit cost of production. |
| • | International Presence. Since our inception, we have structured our business to cater to major international markets. We have established one or more PSCs in each of North America, Europe, and Asia. Because many of our current or potential customers are global industrial companies, it is important that we have a presence in or near the areas where these companies have manufacturing facilities. |
| • | Co-location of High Value Production. Over the last few years, many U.S. industrial manufacturers have outsourced products supply or otherwise created long, relatively inflexible supply chains for their high-complexity, high-value products. We believe that over the next few years, many of these companies will need to build these products in the United States, near their main manufacturing facilities, in order to be competitive nationally and internationally. We believe we are well positioned to help these manufacturers co-locate the production of products so as to optimize our customers’ supply chains. |
Our Business Strategy
The principal elements of our growth strategy include:
| • | Expand the Network of Production Service Centers. Our PSCs provide a central location for customer collaboration and provide customers with a direct contact point to learn about our 3D printing technology, buy products printed by us, and purchase our machines. By the end of 2015, we plan to expand our PSC network from the current six locations to fifteen locations. Like our current PSCs, we |
74
Table of Contents
| plan to locate the additional PSCs in major industrial centers near existing and potential customers. While we may adjust the final locations based upon market considerations, our 2013 plan includes announcing the opening of an additional location in the United States in addition to the recent Auburn, Washington announcement. Our current plan also includes opening two or more additional locations in the first half of 2014. |
| • | Qualify New Industrial Materials Printable In Our Systems. Currently, our 3D printing machines are capable of printing in silica sand, ceramics, stainless steel, bronze, iron, bonded tungsten, and glass, and we are in varying stages of qualifying additional industrial materials for printing, such as titanium, tungsten carbide, aluminum, and magnesium. By expanding into these other materials, we believe we can expand our market share and better serve our industrial customer base. We established ExMAL, which focuses on materials testing. We believe ExMAL will assist us in increasing the rate at which we are able to qualify new materials. ExMAL is led by our Chief Technology Officer, Rick Lucas, whose background includes experience in materials testing and certification. See “Management — Executive Officers and Directors.” |
| • | Increase the Efficiency of Our Machines to Expand the Addressable Market. We intend to invest in further developing our machine technology so as to increase the volume output per unit of time that our machines can produce. In 2011, we began selling a new second generation mid-sized platform, the S-Print machine. In addition, we are marketing our new M-Flex machine, and we have a signed purchase order to deliver our first unit in the third quarter of 2013. See “— Our Machines and Machine Platforms.” In both cases, the new machines are designed to increase the volume output per unit of time through advances in printhead speed and build box size. Achieving improved production speed and efficiency will expand our potential market for our machines and for products made in our PSCs. |
| • | Focus Upon Customer Training and Education to Promote Awareness. We use our regional PSCs to educate our potential customers. In addition, we have supplied 3D printing equipment to more than 20 universities and research institutions, in hopes of expanding the base of future adopters of our technology. We established ExTEC in our North Huntingdon, Pennsylvania headquarters. At ExTEC, technicians guide our current and prospective customers in the optimal use of 3D printing and customers gain digital access to our 3D printing knowledge database as it continues to evolve. We make ExTEC accessible to universities, individual customers, employees/trainees, designers, engineers, and others interested in 3D printing. We will continue to educate the marketplace about the advantages of 3D printing. |
| • | Achieve Revenue Balance and Geographic Diversification. Over the long-term, our goal is to balance revenue between machine sales and PSC production, service contracts, and consumables. Machine sales tend to be seasonal, less predictable, and generally more heavily impacted by the macroeconomic cycle, as compared to PSC production, service contracts, and consumables. As we sell more machines, the machine sales portion of our business will be supplemented by related sales of service, replacement parts, and consumables. To avoid being overly dependent on economic conditions in one part of the world, we intend to develop our customer base so that our revenues are balanced across the Americas, Europe, and Asia. As overall revenues increase, maintaining this balance will largely be achieved by targeting specific customers and industries for machine sales and by establishing PSCs in each of our key regions. |
| • | Advance Pre-Print Design and Post-Print Processing Capabilities to Accelerate the Growth of Our 3D Printing Technology. Our next generation 3D printing machine platforms have achieved the volumetric output rate and quality necessary to serve industrial markets on a production scale. We believe that there is an opportunity to similarly advance the pre-print and post-print processing phases of product materialization to more fully exploit the transformative power of our 3D printing machines and drive growth. These opportunities relate to both direct and indirect part materialization. For direct metal production, we believe that enhancing pre-print processes, notably design optimization tools and suitable print material availability, can greatly accelerate our capture of market share in the near-term. |
75
Table of Contents
| Additionally, enhancements to post-print processing will increase the applications for printed products. Through ExMAL, we are developing post-print processing technologies to achieve fully dense metal product materialization without the need for infiltration, and we are exploring technology sharing partnerships to further this initiative. In indirect production utilizing 3D printed molds and cores, advanced performance casting technologies can be leveraged to increase yields and reduce weight of casted products. To address the market opportunity and fill the execution gap, we have developed a suite of processes, many of which are proprietary, for producing high-quality castings through a process that we call ExCAST. ExCAST provides industry guidance and support through all stages of production, from CAD at the design stage, through the 3D materialization of molds and cores, metal casting of the end product and rapid delivery to the end-user. |
| • | Pursue Growth Opportunities Through Acquisitions, Alliances, and/or Strategic Investments. We intend to opportunistically identify and, through acquisitions, alliances and/or strategic investment, integrate and advance complementary businesses, technologies and capabilities. Our goal is to expand the functionality of our products, provide access to new customers and markets, and increase our production capacity. We are in active discussions with parties that we believe can contribute to a superior end-to-end manufacturing process. |
Our Machines and Machine Platforms
We produce a variety of machines in order to enable designers and engineers to rapidly, efficiently, and cost-effectively design and produce industrial prototypes and production parts. The models of our machines differ based on the materials in which they print, build box size, and production speeds, but all utilize our advanced technology and designs. The variation in the models of machines that we produce allows for flexibility of use based on the needs of our customers.
We have created machine platforms in four size ranges in order to cater to the job sizes at the machine prices that the market demands. Our two largest platforms, the “Max” size platform and the “Print” size platform, are differentiated from those of our competitors in their ability to print on an industrial size and scale.
We further differentiate our model name by a prefix of either “M” or “S” before the platform name. The S prefix indicates that the machine is largely used for printing molds and cores for castings. The M prefix indicates that the machine is largely used for the direct printing of objects. The largest platform, the Max size, is generally used for castings, and therefore the current model in this platform is the S-Max. The Print size platform is broadly applicable in a variety of industrial uses, and therefore, we have introduced the platform with both M-Print and S-Print machines. We are currently offering the new Flex platform in an M-Flex machine. The Lab size platform is primarily sold and used as the M-Lab machine.
76
Table of Contents
Our machines come in a variety of sizes and are named for the size of print job they are able to produce. In descending order by capacity are our Max, Print, Flex, and Lab machines.
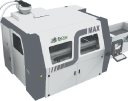
|

|
|

| |||||
| Max Platform |
Print Platform |
Flex Platform |
Lab Platform | |||||
| External Dimensions WxDxH (mm) |
7000 x 3586 x 2860 | 2252 x 2584 x 2114 | 1674 x 1278 x 1552 | 965 x 711 x 1066 | ||||
| *Hours Per Job Box |
24 hr print time (.28mm layers) |
14.5 hrs | 14 - 21 hrs | 12 hrs | ||||
| 13 hr print time (0.5mm layer) |
||||||||
| Print Box Dimensions WxDxH (mm) |
1800 x 1000 x 700 | 780 x 400 x 400 | 400 x 250 x 250 | 40 x 60 x 35 | ||||
| Print Box Size (L) |
1260 | 125 | 25 | 0.084 | ||||
| Z Axis Resolution (mm) |
0.07 mm / 0.09 mm | .15mm | 0.10 mm | 0.10 mm | ||||
| Materials |
Silica Sand | Silica Sand | 420 Stainless Steel | 420 Stainless Steel | ||||
| Cerabeads | Cerabeads | 316 Stainless Steel | 316 Stainless Steel | |||||
| Ceramics | Ceramics | Bronze | Bronze | |||||
| 420 Stainless Steel | Glass | Glass | ||||||
| 316 Stainless Steel | Ceramics | Ceramics | ||||||
| Bronze |
Iron | Iron | ||||||
| Iron
Bonded Tungsten
Glass |
Bonded Tungsten | Bonded Tungsten | ||||||
77
Table of Contents
| Max Platform |
Print Platform |
Flex Platform |
Lab Platform | |||||
| Select Machine or Printed Products Customers
|
Caterpillar
|
Peerless Pump/Grundfos
|
L’Université du Québec |
Rochester Institute of Technology | ||||
| Ford Motor Company | Ecothermics | rp+m | Lafayette University | |||||
| Boeing
|
Ulterra
|
University of Pittsburgh |
University of Pittsburgh | |||||
| Bosch Rexroth |
HansGrohe |
Piedmont University | ||||||
| Magellan Aerospace Corporation | Industrial Machine and Manufacturing | |||||||
| Mitchell Aerospace Inc. | LUK USA |
|||||||
| Bavarian Motor Works (BMW) | Daihatsu |
|||||||
| Tesla Motors, Inc. | ||||||||
| Deere & Company |
||||||||
| ITT Corp. |
||||||||
| KSB Group |
||||||||
| Best Pumpworks |
||||||||
| Ryoyu Systems |
||||||||
| Sikorsky |
||||||||
| UMPO |
||||||||
| MINOU |
||||||||
| * | Hours Per Job Box and Resolution both vary based upon the application. |
S-Max. The S-Max machine, the largest of our machines, has a build box size of 1.8 meters x 1 meter x .7 meters and sells for approximately $1.4 million (based upon average model options and exchange rates). The total time to produce an entire build box on the S-Max is approximately 24 hours. We introduced the S-Max machine in 2010 to provide improved size and speed over the predecessor model, the S-15. Our PSCs each generally have at least one S-Max or S-15 machine installed on-site, which provides our customers with the ability to print casting molds and cores on an industrial scale.
S-Print/M-Print. Our Print machine platform has been completely redesigned and is our current mid-sized machine platform. The S-Print machine provides the same cutting edge technology available in the S-Max platform, with an average price point of approximately $0.8 million (based upon average model options and exchange rates). The S-Print machine is used by customers interested in printing objects made from silica sand and ceramics, with a particular focus on industrial applications for smaller casting cores that are often required for the aerospace industry, especially in hydraulic applications. The build box size permits the use of exotic and expensive print materials, such as ceramics, that are required for high heat/high strength applications. The S-Print machine build box is approximately 125 liters. This same basic platform is used in the M-Print, which is used by customers interested in direct printing of objects made
78
Table of Contents
from metals and glass. The average price point of the M-Print is approximately $0.9 million (based upon average model options and exchange rates). We have begun installing S-Print machines in our PSCs to complement the S-Max machines currently in use.
M-Flex. We are actively marketing our M-Flex machine platform and have a signed purchase order for our first sale, to be delivered to our customer in the third quarter of 2013. We expect the M-Flex to satisfy the demand for a large range of industrial customers that are interested in directly printing metals, ceramic and glass products. The average price point of approximately $0.4 million (based upon average model options and exchange rates) is designed to satisfy demand from industrial production houses. We have developed a collaborative process for assisting the users in production implementation through the ExTEC and ExMAL organizational efforts.
M-Lab. The M-Lab is the smallest of our build platforms. At an average price point of approximately $0.1 million (based upon average model options and exchange rates), it is primarily used as a development platform, as well as a teaching tool in an engineering environment. There are over 20 M-Lab machines installed at universities and research institutions in the United States and Europe.
Binding
We use liquid chemical binding agents during the printing process. We believe that our unique chemical binding agent technology can more readily achieve efficiency gains over time than other AM technologies such as laser-fusing technologies. For instance, in order to increase the print speed of laser-based technologies, another expensive industrial laser must be added to the manufacturing process, raising the unit cost of production.
We also recently announced that we have added phenolic and sodium silicate to our suite of binders for use in our 3D printing process. Phenolic binder, used with ceramic sand in the 3D printing of molds and cores, offers customers three benefits: (i) casting higher heat alloys; (ii) creating a higher strength mold or core; and (iii) improving the quality of the casting due to reduced expansion of the mold or core. These capabilities address challenges faced by the automotive, aviation, hydraulic/heavy equipment and pump industries. We believe that the use of sodium silicate will reduce or eliminate the release of fumes and gas in the casting process, helping to reduce costs associated with air ventilation, and electrical and maintenance equipment, which we believe will appeal to casting houses that are in search of cleaner environmental processes.
Laser Micromachining
In addition to manufacturing our 3D printing machines, we also manufacture the ExMicro Orion (“Orion”) machine, which is used for both conventional and exotic materials. Micromachining is an integrated process that combines the use of a short pulse laser with a patented trepanning (which is a type of laser drilling) head to capture and manipulate a laser beam. By controlling and manipulating the beam, the Orion machine, which we build in the United States, can remove microns of material from precise locations with thousands of pulses per second.
The beam manipulation capability allows us to shape design features like tapers, making the Orion machine an effective tool for production of automotive and aerospace components. The Orion machine sells for approximately $1.0 million, the first of which was sold to a production customer in 2013.
Marketing and Sales
We market our products under the ExOne brand name in our three major geographic regions — the Americas, Europe and Asia. Our sales are made primarily by ten full-time equivalent, in-house sales people. Our sales force is augmented, in certain territories, by representatives with specific industry or territorial expertise.
79
Table of Contents
Even where we are supported by a representative, all of our product and service offerings provided by our PSCs are sold directly to customers by us.
We believe that our direct selling relationship helps to create one of the building blocks for our business — the creation of true collaboration between us and industrial customers who are interested in 3D printing. Increasingly, industrial producers are considering shifting from subtractive manufacturing techniques to 3D printing. Our marketing efforts include educating potential customers about 3D printing technology through collaboration starting with pre-production services and continuing with production and technical support at our PSCs. Currently, our sales people are based in North Huntingdon, Pennsylvania; Troy, Michigan; Houston, Texas; Auburn, Washington; Augsburg, Germany; and Kanagawa, Japan (near Tokyo). In addition, we have recently opened international sales offices in China and Brazil, expanding our machines sales efforts and laying the groundwork for future PSCs in these markets in the process.
Our Customers
Our customers are located primarily in the Americas, Europe, and Asia. We are a party to non-disclosure agreements with many of our customers, and therefore, are often prohibited from disclosing many of our customers’ identities. Our customers include several Fortune 500 companies that are leaders in their respective markets. The primary markets that we currently serve are:
| • | aerospace; |
| • | automotive; |
| • | heavy equipment; and |
| • | energy/oil/gas. |
Sales of 3D printing machines are low volume and generate significant revenue but the same customers do not necessarily buy machines in each period. Timing of customer purchases is dependent upon the customer’s capital budgeting cycle, which may vary from period to period. Sales of 3D printed products, materials and other services tend to be from repeat customers that may utilize the capability of our PSCs for three months or longer. The nature of revenue from 3D printing machines, as described above, does not leave us dependent upon a single or a limited number of customers. Rather, the timing of the sales can have a material effect on period to period financial results. For the six months ended June 30, 2013, we had two customers (UMPO and MINOU) that represented ten percent or more of our revenue. For the years ended December 31, 2012, 2011 and 2010, respectively, we had zero, one (Ryoyu Systems) and three (Intek, I Metal and BMW) customers that represented ten percent or more of our revenue.
Services and Warranty
We have fully trained service technicians to perform machine installations in the Americas, Europe, and Asia. We provide an industry standard one-year warranty on installed machines. Customers can purchase additional service contracts for maintenance and service. Finally, we sell spare parts which we maintain in stock worldwide, to assist in providing service expeditiously to our customers.
Our terms of sale generally require payment within 30 to 60 days after shipment of a product, although we also recognize longer payment periods are customary in some countries where we transact business.
Suppliers
Our largest suppliers, based upon dollar volume of purchases, are Bauer GmbH & Co KG, Bosch Rexroth AG and Batz, Burgel GmbH & Co KG, Fuji Film Dimatix, T&S Materials, RPMC Lasers and Intek Systems.
We buy our industrial materials from several suppliers and, except as set forth below, the loss of any one of which would not materially adversely affect our business. We currently have a single supplier of printheads for
80
Table of Contents
our 3D printing machines. While we believe that our printheads supplier is replaceable, in the event of the loss of that supplier, we could experience delays and interruptions that might adversely affect the financial performance of our business. Additionally, we obtain certain preproduction services through design and data capture providers, and certain post-production services though vendors with whom we have existing and good relationships. The loss of any one of these providers or vendors would not materially adversely affect our business.
Research and Development
We spent approximately $2.1 million and $0.8 million on research and development during the six months ended June 30, 2013 and 2012, respectively. We spent approximately $1.9 million, $1.5 million and $1.2 million on research and development during the years ended December 31, 2012, 2011 and 2010, respectively. We expect to continue to invest significantly in research and development in the future.
A significant portion of our research and development expenditures have been focused upon the:
| • | chemistry of binder formulation; |
| • | mechanics of droplet flight into beds of powder; |
| • | metallurgy of thermally processing metals that are printed through AM; |
| • | mechanics of spreading powders in a job box; |
| • | transfer of digital data through a series of software links, to drive a printhead; and |
| • | synchronization of all of the above to print ever-increasing volumes of material per unit time. |
Intellectual Property
Patents and MIT Licenses. Our technology is covered by a variety of patents or licenses for use of patents. We are the worldwide licensee of certain patents of MIT for certain AM printing processes (the “MIT Patents”), with exclusive rights to practice the patents in certain fields including the application of the printing processes to metals (with sublicensing rights), and non-exclusive rights to practice the patents in certain fields including the application of the printing processes to certain non-metals (without sublicensing rights). Additionally, we hold patents solely or as majority owner as a result of our own technological developments and from the acquisition of Prometal RCT GmbH (subsequently renamed ExOne GmbH). Our patents are issued in the United States and in various foreign jurisdictions, including Japan and Germany. As a result of our commitment to research and development, we also hold process patents and have applied for other patents for equipment, processes, materials and 3D printing applications. The expiration dates of our patents range from 2013 to 2029. We believe that the expiration of patents in the near term will not impact our business.
The MIT Patents under which we are licensed have expiration dates ranging from 2013 to 2021. We believe that the expiration of these licenses will not impact our business, however the expiration may allow our competitors that were previously prevented from doing so to utilize binder jetting 3D printing. However, we have developed know-how and trade secrets relative to our 3D printing technology and believe that our early entrance into the industrial market provides us with a timing and experience advantage. Through our investment in our technology, we have been able to qualify industrial materials for use in our 3D printing machines, and we intend to continue such efforts. In addition, we have taken steps to protect much of our technology as a trade secret. Given the significant steps that we have taken to establish our experience in AM for industrial applications, as well as our ongoing commitment to research and development, we intend to maintain our preeminent position in the AM industry market.
We entered into an Amended and Restated Exclusive Patent License Agreement with MIT in June 2011. The terms of the agreement require that we remit both license fees and royalties to MIT based upon worldwide
81
Table of Contents
revenue of licensed products, processes and consumables. The term of the agreement commenced on January 1, 2011, and remains in force until the expiration or abandonment of all issued patent rights.
On January 22, 2013, we agreed with MIT to an amendment of its exclusive patent license agreement (the Amended MIT Agreement). The Amended MIT Agreement provides for, among other things, (1) a reduction in the term of the agreement between us and MIT from the date of expiration or abandonment of all issued patent rights to December 31, 2016, (2) an increase in the annual license maintenance fees due for the years ended December 31, 2013 through December 31, 2016 from $50,000 annually to $100,000 annually, with amounts related to 2013 through 2016 guaranteed by us, (3) a settlement of all past and future royalties on net sales of licensed products, processes and consumables for a one-time payment of $200,000 (paid in March 2013), and (4) a provision for extension of the term of the arrangement between the parties for an annual license maintenance fee of $100,000 for each subsequent year beyond 2016.
Trademarks. We have registrations in the United States for X1. We have filed for trademark registrations in the United States and in Canada, Europe, Japan, China, Korea, and Brazil for ExOne and for a stylized form of “X1 ExOne DIGITAL PART MATERIALIZATION.” We have also filed for trademark registrations in Canada and Japan for DIGITAL PART MATERIALIZATION. We have also filed for trademark registrations in the United States for ExCAST, ExMAL, ExTEC, and M-Flex.
Trade Secrets. The development of our products, processes and materials has involved a considerable amount of experience, manufacturing and processing know-how and research and development techniques that are not easily duplicated. We protect this knowledge as a trade secret through the confidentiality and nondisclosure agreements which all employees, customers and consultants are required to sign at the time they are employed or engaged by us. Additional information related to the risks associated with our intellectual property rights are described in “Risk Factors.”
Competition
Other companies are active in the market for 3D printed products, materials and other services. These companies use a variety of AM technologies, including:
| • | direct metal deposition; |
| • | direct metal laser sintering; |
| • | electron beam melting; |
| • | fused deposition modeling; |
| • | laser consolidation; |
| • | laser sintering; |
| • | multi-jet modeling; |
| • | polyjet; |
| • | selective laser melting; |
| • | selective laser sintering; and |
| • | stereolithography. |
Some of the companies that have developed and employ one or more AM technologies include: 3D Systems Corporation, Stratasys Inc., EOS Optronics GmbH, EnvisionTEC GmbH, and Solid Model Ltd.
Some of these processes and companies compete with some of the products and services that we provide. Despite the challenging competitive landscape, we believe that we are the only AM printing solutions provider
82
Table of Contents
that focuses primarily on industrial applications on a production scale. Our competitive advantages, including the size of our build platforms, the speed of our printing heads, the variety of materials used by industrial manufacturers in which we can print, the industry qualification of many of the materials we print in, our robust market capabilities, and our suite of machine system families offering scale and flexibility, also serve to differentiate us from the other competitors in the AM market.
We also compete with established subtractive manufacturers in the industrial products market. These companies often provide large-scale, highly capitalized facilities that are designed or built to fill specific production purposes, usually mass production. However, we believe that we are well positioned to expand our share of the industrial products market from these manufacturers as AM gains recognition. As our technologies improve and our unit cost of production decreases, we expect to be able to compete with subtractive manufacturing on a wide range of products, thereby expanding our addressable market.
Seasonality
Purchases of our 3D printing machines often follow a seasonal pattern owing to the capital budgeting cycles of our customers. Generally, machine sales are higher in our third and fourth quarters than in our first and second quarters.
Backlog
At June 30, 2013, our backlog (including confirmed purchase orders, deferred revenue and customer prepayments) was approximately $6.9 million. We expect to fulfill our June 30, 2013 backlog for machines and PSCs during the next twelve months. This is compared to a backlog of $5.1 million at December 31, 2012.
Environmental Matters
Compliance with federal, state and local laws and regulations relating to the discharge of materials into the environment or otherwise relating to the protection of the environment has not had a material impact on capital expenditures, earnings or the competitive position of us and our subsidiaries. We are not the subject of any legal or administrative proceeding relating to the environmental laws of the United States or any country in which we have an office. We have not received any notices of any violations of any such environmental laws.
Employees
As of August 1, 2013, we employed a total of 202 (169 full time) employees. None of these employees is a party to a collective bargaining agreement, and we believe our relations with them are good.
Geographic Information
Our revenues by geographic region (based upon the country where the sale originated) for the six months ended June 30, 2013 were Americas 35.0%, Europe 37.0% and Asia 28.0% as compared to Americas 55.9%, Europe 25.5% and Asia 18.6% for the six months ended June 30, 2012. Our revenues by geographic region for the year ended December 31, 2012 were Americas 27.2%, Europe 48.7% and Asia 24.1%, as compared to Americas 30.0%, Europe 37.1% and Asia 32.9% for the year ended December 31, 2011 and Americas 29.3%, Europe 51.4% and Asia 19.3% for the year ended December 31, 2010.
83
Table of Contents
Properties
We have six locations. Our corporate headquarters are located in North Huntingdon, Pennsylvania. The size of the facilities at these locations is as follows:
| Location |
Owned or Leased | Approximate Square Footage | ||||||
| North Huntingdon, Pennsylvania |
Owned | 42,525 sq. ft. | ||||||
| Troy, Michigan* |
Owned | 19,646 sq. ft. | ||||||
| Houston, Texas* |
Owned | 12,000 sq. ft. | ||||||
| Augsburg, Germany |
Leased | 77,500 sq. ft. | ||||||
| Kanagawa, Japan |
Leased | 11,293 sq. ft. | ||||||
| Auburn, Washington |
Leased | 11,600 sq. ft. | ||||||
| * | As further described in “Certain Relationships and Related Party Transactions,” prior to March 27, 2013, we leased these properties from our variable interest entities. On March 27, 2013, we purchased the Troy, Michigan and Houston, Texas facilities. |
In addition to office space, we maintain manufacturing facilities, primarily for producing our machines, in the above referenced space in Augsburg, Germany and North Huntingdon, Pennsylvania. We maintain PSCs in North Huntingdon, Pennsylvania; Troy, Michigan; Houston, Texas; Auburn, Washington; Augsburg, Germany; and Kanagawa, Japan (near Tokyo).
On August 1, 2013, we entered into an agreement for purchase of land in Gersthofen, Germany, in the district of Augsburg to build a new facility. The facility will comprise approximately 150,700 square feet of production, warehouse, service and research and development space as well as approximately 27,600 square feet for offices. We intend to consolidate our five existing leased facilities in Augsburg, which currently occupy an aggregate of approximately 77,500 square feet, into the new facility, providing expansion capacity to support its global growth strategy. We have selected a turnkey provider of construction services that focuses on Central Europe, Great Britain, Austria and Switzerland, to design and construct the new facility. We estimate that we will complete construction of the new facility in the second half of 2014. We estimate that the acquisition and construction of the new facility will cost approximately $20.0 million, which includes approximately $3.9 million to purchase the land.
Legal Proceedings
ExOne and our subsidiaries are involved in litigation from time to time in the ordinary course of business. We do not believe that the outcome of any pending or threatened litigation involving ExOne or our subsidiaries will have a material adverse effect on our financial position, results of operations or cash flows.
84
Table of Contents
Executive Officers and Directors
The following table and the discussion below provide information about our directors (each of whom were reelected at our Annual Meeting of stockholders held on August 19, 2013) and executive officers as of June 30, 2013:
| Name |
Age | Positions and Offices Held with the Company | ||||
| S. Kent Rockwell |
68 | Chairman of the Board and Chief Executive Officer | ||||
| David Burns |
58 | President, Chief Operating Officer and Director | ||||
| JoEllen Lyons Dillon |
49 | Chief Legal Officer and Corporate Secretary | ||||
| Rainer Hoechsmann |
47 | General Manager of ExOne GmbH | ||||
| John Irvin |
58 | Chief Financial Officer, Treasurer and Director | ||||
| Rick Lucas |
47 | Chief Technology Officer | ||||
| Ken Yokoyama |
36 | General Manager of Ex One KK | ||||
| Raymond J. Kilmer |
48 | Director | ||||
| Victor Sellier |
64 | Director | ||||
| Lloyd A. Semple |
74 | Director* | ||||
| Bonnie K. Wachtel |
57 | Director | ||||
| * | Lead director. |
S. Kent Rockwell — Mr. Rockwell has served as our Chairman and Chief Executive Officer since January 1, 2013, when we were formed as a Delaware corporation. Prior to that date, Mr. Rockwell served as the Managing Member of Ex One Company, LLC, our predecessor, since 2008. Mr. Rockwell has been the Chairman and Chief Executive Officer of Rockwell Venture Capital, Inc., a private venture capital company, since 1983 and of Appalachian Timber Services, a supplier of timber products for railroads, since 1986. Mr. Rockwell served as Vice Chairman of Argon ST, a public company engaged primarily in defense contracting, from 2004 to 2010. Mr. Rockwell served as the Chairman and Chief Executive Officer of Sensytech Inc., which was engaged in the design, development, and manufacture of electronics and technology products for the defense and intelligence markets in the United States, from 1998 to 2004. He was Chairman and Chief Executive Officer of Astrotech International Corp., a public company in the oilfield supply business, from 1989 to 1997. From 1987 to 1989, he was Chairman and Chief Executive Officer of Special Metals Corp., a producer of super alloy and special alloy products. From 1978 to 1982, he was Chairman and Chief Executive Officer of McEvoy Oilfield Equipment, a producer of oilfield equipment. Mr. Rockwell served on the Board of Directors of Rockwell International from 1973 until 1982 and served as President of the Energy Products Group of Rockwell International from 1977 to 1982. Mr. Rockwell brings to our Board of Directors an intimate knowledge of the Company, our business and operations, and the risks, challenges and opportunities we face. In addition, Mr. Rockwell also brings to our Board of Directors nearly forty years of experience with strategic planning, acquisitions and integration, marketing, finance and accounting, operations and risk management, having served in numerous executive and director positions at other public and private companies before joining the Company.
David J. Burns — Mr. Burns has served as our President and Chief Operating Officer since 2005, and began serving as a member of our Board of Directors effective January 1, 2013. He has been a trustee for the Rochester Institute of Technology since 2003 and a board member of The Association for Manufacturing Technology since 2001, serving as its chairman from 2004 to 2005. From 1978 to 2005, he was employed by Gleason Corp., a global manufacturer of products related to gear manufacturing, where he was Chief Executive Officer from 2001 to 2005. Mr. Burns has served on the Executive Advisory Council of The Simon School at the University of Rochester since 2002. Mr. Burns brings to our Board of Directors an in-depth knowledge of the business and operations of the Company, particularly our worldwide operations, for which he has been responsible since 2005, and significant operating and senior management experience in our industry.
85
Table of Contents
JoEllen Lyons Dillon — Ms. Dillon has served as our Chief Legal Officer and Corporate Secretary since March 11, 2013. From May 2012 through February 2013, she was a legal consultant on our initial public offering. She was previously a partner at two national law firms, Reed Smith LLP from 2002 until 2011 and Buchanan Ingersoll & Rooney PC from 1988 until 2002, where she became a partner after starting as an associate with the firm. Ms. Dillon was the former Chair, and currently serves as the Audit Committee Chair of the Allegheny District chapter of the National Multiple Sclerosis Society. She is also a Vice President of the Wine & Spirits Advisory Council to the Pennsylvania Liquor Control Board.
Rainer Hoechsmann — Mr. Hoechsmann has served as General Manager of ExOne GmbH, a subsidiary of ExOne, since 2003 and is responsible for operations in Europe. Mr. Hoechsmann is the inventor and co-inventor of certain AM technology covered by a number of our patents. In 2003 he co-founded Prometal RCT GmbH in Augsburg, which is the predecessor to ExOne GmbH. In 1999, he co-founded Generis GmbH, one of the first companies implementing 3D printing applications, in Augsburg, Germany. Mr. Hoechsmann has received a number of industry awards, including the OCE Printing Award from OCE Printers AG, the Technical University of Munich Award for 3D Printing and McKinsey & Company Start-Up Award. He is a member of the Association of German Engineers.
John Irvin — Mr. Irvin has served as our Chief Financial Officer since October 1, 2012, and began serving as a member of our Board of Directors effective January 1, 2013. From 2008 to 2012, Mr. Irvin served as President of PartnersFinancial, a national insurance brokerage company owned by National Financial Partner Corp. (“NFP”), a publicly-traded diversified financial services firm. From 1993 to 2008, he was Chairman and Chief Executive Officer of Innovative Benefits Consulting, Inc., a life insurance consulting firm and wholly-owned subsidiary of NFP. From 1983 to 1993, Mr. Irvin was a partner of Mid Atlantic Capital Group, a financial services company which he co-founded in 1983 and his highest position was vice chairman. In 1979, Mr. Irvin formed the certified public accounting firm of John Irvin and Company. From 1976 to 1979, he was an accountant for Arthur Andersen LLP. From 2000 to 2004, Mr. Irvin served on the board of directors of Sensytech Inc., which was engaged in the design, development, and manufacture of electronics and technology products for the defense and intelligence markets in the United States, and also served on its audit committee from 2000 to 2002, and as chairman of the audit committee from 2002 to 2004. Upon the merger of Sensytech Inc. into Argon ST, Inc., a public company engaged primarily in defense contracting, he served as director and chairman of the audit committee from 2004 to 2010. Mr. Irvin brings to our Board of Directors significant financial and accounting experience, having served in the financial services industry for a number of years and as an accountant for Arthur Anderson before forming his own certified public accounting firm. He also provides expertise in the areas of financial analysis and reporting, internal auditing and controls and risk management oversight and provides both strategic and operational vision and guidance to the Board of Directors, having served in several executive-level positions before joining the Company, including the fifteen years he served as chairman and chief executive officer of Innovative Benefits Consulting, Inc.
Rick Lucas — Mr. Lucas has served as our Chief Technology Officer since June 2012. He served in various positions from October 2001 to June 2012 at Touchstone Research Laboratory, a broad-based product development research facility that focuses on the development of next-generation materials and products, where he directed operations and research activities and served as Director of Operations from March 2010 to June 2012. From November 1989 to October 2001, Mr. Lucas managed product development for Lake Shore Cryotronics, a privately held developer of cryogenic temperature sensors and other instrumentation. He is currently serving on the governance board of the National Additive Manufacturing Innovation Institute (NAMII), an additive manufacturing center.
Ken Yokoyama — Mr. Yokoyama is the General Manager of Ex One KK, a subsidiary of ExOne since 2008. He is responsible for overall management of the Japan and Asia operations. From 2005 to 2008, he was the Technical Manager of Ex One KK. From 2004 to 2005, he was the Process Engineer for Extrude Hone KK.
Raymond J. Kilmer — Mr. Kilmer began serving on our Board of Directors on February 6, 2013. Mr. Kilmer has been Executive Vice President and Chief Technology Officer of Alcoa Inc., a world-wide
86
Table of Contents
manufacturer and supplier of aluminum products, since 2011. Prior to that he was Vice President-Technology and Engineering of Alcoa Mill Products from 2008 to 2011 and Global Director-Automotive Flat Rolled Products for Alcoa Inc. from 2006 to 2008. Mr. Kilmer’s engineering background and extensive career managing operations at Alcoa, a large, global, high-technology company, complement our high-technology business needs and his experience and expertise in this industry enable him to provide expert advice to us on a range of technical, operational, commercial and strategic matters.
Victor Sellier — Mr. Sellier began serving on our Board of Directors on February 6, 2013. He co-founded Argon Engineering Associates, Inc., the predecessor company to Argon ST, Inc. (“Argon ST”), a public company engaged primarily in defense contracting, in 1997. He served as Argon ST’s Vice President of Business Operations and Secretary from 2004 to 2007, as its Chief Financial Officer and Treasurer from 2005 to 2007, and was Argon ST’s Executive Vice President from 2007 to 2009. He served as a Director of Argon ST, Inc. from 2004 to 2010. From 1995 to 1997, Mr. Sellier served as the Vice President and Assistant General Manager of the Falls Church Division of Raytheon E-Systems, (NYSE). From 1989 to 1995, he served as Vice President and Assistant General Manager of Engineering Research Associates, a wholly-owned subsidiary of E-Systems Corporation, (NYSE). Mr. Sellier served as the Senior Financial and Administrative Manager of Engineering Research Associates, a privately held company, from 1979 to 1989. Mr. Sellier brings to our Board of Directors significant experience in the areas of operational and strategic planning, acquisitions and integration from his nearly fifteen years’ experience at Argon ST, experience which will be instrumental in overseeing our own growth and development. Mr. Sellier also brings significant financial expertise to our Board of Directors (and to our Audit Committee on which he serves) having served as chief financial officer and treasurer of Argon ST and senior financial and administrative manager of Engineering Research Associates.
Lloyd A. Semple — Mr. Semple began serving on our Board of Directors on February 6, 2013. He has been a professor of law at the University of Detroit, Mercy School of Law in Detroit, Michigan since 2004 and was its dean from March 2009 through July 2013. Prior to 2004, he practiced law at Dykema Gossett, a Detroit-based law firm, where he was Chairman and Chief Executive Officer from 1995 to 2002. He has served as outside counsel and director for several business enterprises. He was a director of Argon ST from 2004 to 2010. Mr. Semple brings to our Board of Directors extensive legal and corporate governance expertise and experience from his nearly forty-year career as an attorney in private practice, where he focused primarily on general corporate matters, mergers and acquisitions, and financial markets and services. His extensive service as counsel and director of several businesses benefits our Board of Directors.
Bonnie K. Wachtel — Ms. Wachtel began serving on our Board of Directors on February 6, 2013. She is a principal of Wachtel & Co., Inc., an investment firm in Washington, DC involved with the development of growing companies. Since joining Wachtel & Co., Inc., in 1984, Ms. Wachtel has been a director of more than a dozen public and private corporations. She has been a director of VSE Corporation (NASDAQ: VSEC) a provider of engineering services principally to the federal government, since 1991 and of Information Analysis Inc., a provider of IT technical services, since 1992. She was a director of Integral Systems Inc. (NASDAQ: ISYS) a provider of satellite related software and services, from 2010 to 2011. Ms. Wachtel serves on the Listing Qualifications Panel for NASDAQ. She practiced law at Weil, Gotshal & Manges in New York from 1980 to 1984. Ms. Wachtel brings substantial corporate governance and regulatory compliance expertise to our Board of Directors, having served as a director for more than a dozen public and private corporations, and also from her service on the Listing Qualifications Panel for NASDAQ as well as her years as an attorney in private practice, during which time she focused primarily on business law, corporate finance and securities law. Ms. Wachtel is also a certified financial analyst, and as such will bring significant expertise to our Board of Directors (and our Audit Committee on which she serves) in the areas of financial analysis and reporting, internal auditing and controls and risk management oversight.
87
Table of Contents
Board Structure
Our Board of Directors may establish the authorized number of directors from time to time by resolution as permitted under our bylaws. Currently, the Board of Directors has established that the Board of Directors will have seven members. Our current directors will serve until the 2014 Annual Meeting of Stockholders or until his or her successor has been elected or qualified, or until his or her earlier death, resignation or removal.
Independence of Board of Directors
The Board of Directors is currently composed of seven members, a majority of whom are independent under the applicable rules of NASDAQ. Messrs. Kilmer, Sellier and Semple and Ms. Wachtel each qualify as independent directors in accordance with the published listing requirements of NASDAQ. The NASDAQ independence definition includes a series of objective tests, such as that the director is not, and has not been for at least three years, one of our employees and that neither the director nor any of his or her family members has engaged in various types of business dealings with us. In addition, as further required by the NASDAQ rules, the Board of Directors has made a subjective determination as to each independent director that no relationships exist which, in the opinion of the Board of Directors, would interfere with the exercise of independent judgment in carrying out the responsibilities of a director. In making these determinations, the directors reviewed and discussed information provided by the directors and us with regard to each director’s business and personal activities as they may relate to us and our management.
Board Leadership Structure
Our Bylaws give our Board of Directors the flexibility to determine whether the roles of Chief Executive Officer and Chairman of the Board should be held by the same person or by two separate individuals. We recently became a publicly traded company after completing our initial public offering on February 12, 2013. Mr. Rockwell has been managing us (or our predecessors) since 2008. At this time, the Board of Directors has determined that having Mr. Rockwell serve as both the Chief Executive Officer and the Chairman of the Board is in the best interest of our stockholders. We believe this structure makes the best use of the Chief Executive Officer’s extensive knowledge of us, our strategic initiatives and our industry, and also fosters real-time communication between management and the Board of Directors. The Board of Directors has also elected Mr. Semple to serve as the Lead Director of our independent directors. As the Lead Director, Mr. Semple will assist the Chief Executive Officer in preparing for meetings of the Board of Directors, preside at executive sessions of the independent directors, serve as a liaison between the other independent directors and Mr. Rockwell and be permitted to call meetings of the independent directors in his discretion. Generally, every meeting of the Board of Directors includes a meeting of the independent directors.
Board Committees
Following the completion of our initial public offering in February 2013, the Board of Directors established an Audit Committee, a Compensation Committee and a Nominating and Governance Committee. Below is a description of each committee of the Board of Directors. The Board of Directors has determined that each member of each of the Audit, Compensation and Nominating and Governance Committees meets the applicable rules and regulations regarding “independence” and that each such member is free of any relationship that would interfere with his or her individual exercise of independent judgment with regard to the Company. Each committee of the Board of Directors has a written charter approved by the Board of Directors. Copies of each charter are posted on our website at http://www.exone.com under the Corporate Governance section within the Investor Relations section.
Audit Committee
The Audit Committee of our Board of Directors, which has been established in accordance with Section 3(a)(58)(A) of the Exchange Act, assists the Board of Directors in overseeing: (i) the integrity of our financial statements; (ii) the effectiveness of our internal control over financial reporting; (iii) our compliance with legal and regulatory requirements; (iv) the independence, qualifications and performance of our independent
88
Table of Contents
registered public accounting firm; (v) the Company’s processes and procedures relating to risk assessment and risk management; and (vi) related party transactions.
The current members of the Audit Committee are Messrs. Sellier and Kilmer and Ms. Wachtel, each of whom is independent for Audit Committee purposes under the rules and regulations of the SEC and the listing standards of NASDAQ. Mr. Sellier currently chairs the Audit Committee.
The Board of Directors has determined that Mr. Sellier is an “audit committee financial expert” as defined in Item 407(d)(5)(ii) of Regulation S-K and that he, therefore, also satisfies the “financial sophistication” requirement of the NASDAQ rules. The designation does not impose on Mr. Sellier any duties, obligations or liability that are greater than are generally imposed on him as member of the Audit Committee and the Board of Directors.
Compensation Committee
The Compensation Committee is charged with the following responsibilities, among others: (i) reviewing and approving annually the corporate goals and objectives applicable to the compensation of the Chief Executive Officer, evaluating at least annually the Chief Executive Officer’s performance in light of those goals and objectives, and determining and approving the Chief Executive Officer’s compensation level based on this evaluation; (ii) reviewing and making recommendations regarding the compensation of all other executive officers; (iii) administering and making recommendations to the Board of Directors with respect to our 2013 Equity Incentive Plan and any other compensation plans; (iv) reviewing and approving the executive compensation information included in the Company’s annual report on Form 10-K and proxy statement; (v) reviewing and approving or providing recommendations with respect to any employment agreements or severance arrangements or plans; (vi) reviewing and approving or providing recommendations with respect to all employee benefit plans; and (vii) developing and recommending to the Board for approval officer succession plans and monitoring and updating such plans as needed.
The current members of our Compensation Committee are Messrs. Kilmer and Semple and Ms. Wachtel, each of whom is independent for Compensation Committee purposes under the rules and regulations of the SEC and the listing standards of NASDAQ (including those that will become effective in 2014). Ms. Wachtel currently chairs the Compensation Committee. Each of the members is also a “non-employee director” within the meaning of Rule 16b-3 of the Exchange Act and an “outside director,” as that term is defined under Section 162(m) of the Internal Revenue Code of 1986.
Our Chief Executive Officer will not participate in the determination of his own compensation or the compensation of directors. However, he will make recommendations to the Compensation Committee regarding the amount and form of the compensation of the other executive officers and key employees, and he will participate in the Compensation Committee’s deliberations about the compensation of the other executive officers and key employees. No other executive officers will participate in the determination of the amount or form of the compensation of executive officers or directors.
Neither we nor the Compensation Committee has retained any compensation consultants.
The Compensation Committee shall have the authority to delegate any of its responsibilities, along with the authority to take action in relation to such responsibilities, to one or more subcommittees as the Compensation Committee may deem appropriate in its sole discretion.
Compensation Committee Interlocks and Insider Participation
Our predecessor company was a limited liability company and did not have any directors in 2012. The Compensation Committee was formed, and Messrs. Kilmer and Semple and Ms. Wachtel were each appointed to the Compensation Committee in March 2013. None of our executive officers have served as a member of a
89
Table of Contents
compensation committee (or if no committee performs that function, the Board of Directors) of any other entity that has an executive officer serving as a member of our Board of Directors.
Nominating and Governance Committee
The Nominating and Governance Committee of our Board of Directors is charged with the following responsibilities, among others: (i) identifying and recommending candidates to fill vacancies on the Board of Directors and for election by the stockholders; (ii) recommending committee assignments for directors to the Board of Directors; (iii) monitoring and assessing the performance of the Board of Directors and individual non-employee directors; (iv) reviewing compensation received by directors for service on the Board of Directors and its committees; and (v) developing and recommending to the Board of Directors appropriate corporate governance policies, practices and procedures for us.
The current members of our Nominating and Governance Committee are Messrs. Semple, Kilmer and Sellier, each of whom is independent under the listing standards of NASDAQ. Mr. Semple currently chairs the Nominating and Governance Committee.
The Nominating and Governance Committee believes that members of the Board of Directors should have certain minimum qualifications, including having the highest professional and personal ethics and values, broad experience at the policy-making level in business, government, education, technology or public interest, a commitment to enhancing stockholder value, and sufficient time to carry out their duties and to provide insight and practical wisdom based on experience. The Nominating and Governance Committee also considers such other guidelines and various and relevant career experience, relevant skills, such as an understanding of the telecommunications and high-speed Internet provider industries, financial expertise, diversity and local and community ties. While we do not maintain a formal policy requiring the consideration of diversity in identifying nominees for director, diversity is, as noted above, one of the factors our Nominating and Governance Committee considers in conducting its assessment of director nominees. We view diversity expansively to include those attributes that we believe will contribute to a Board of Directors that, through a variety of backgrounds, viewpoints, professional experiences, skills, educational experiences and other such attributes, is best able to guide the Company and its strategic direction. Candidates for director nominees are reviewed in the context of the current make-up of the Board of Directors. The Nominating and Governance Committee will conduct any appropriate and necessary inquiries into the backgrounds and qualifications of possible candidates after considering the function and needs of the Board of Directors. The Nominating and Governance Committee meets to discuss and consider such candidates’ qualifications and then selects a nominee for recommendation to the Board of Directors.
The Nominating and Governance Committee will consider director candidates recommended by stockholders and evaluate them using the same criteria as candidates identified by the Board of Directors or the Nominating and Governance Committee for consideration. If one of our stockholders wishes to recommend a director candidate for consideration by the Nominating and Governance Committee the stockholder recommendation should be delivered to our Corporate Secretary at our principal executive offices, and should include:
| • | To the extent reasonably available, information relating to such director candidate that would be required to be disclosed in a proxy statement pursuant to Regulation 14A under the Exchange Act, in which such individual is a nominee for election to the Board of Directors; |
| • | The director candidate’s written consent to (A) if selected, be named in our proxy statement and proxy and (B) if elected, serve on the Board of Directors; and |
| • | Any other information that such stockholder believes is relevant in considering the director candidate. |
Code of Ethics and Business Conduct
The Board of Directors has adopted a code of ethics and business conduct. The code of ethics and business conduct applies to all of our employees, officers and directors. The full text of our code of ethics and business
90
Table of Contents
conduct is posted on our website at http://www.exone.com under the Corporate Governance section within the Investor Relations section. The Company will disclose any future amendments to the code of ethics and business conduct that relate to our executive officers on our website, as well as any waivers of the code of ethics and business conduct that relate to our executive officers.
Director Compensation
Prior to our initial public offering in February 2013, our Board of Directors was composed solely of employee directors who did not receive additional compensation for their service as directors. In connection with our initial public offering, our then Board of Directors approved a non-employee director compensation program, which became effective immediately following the closing of our initial public offering on February 12, 2013.
Under this program, our non-employee directors receive the following:
| • | Annual cash retainer: $30,000; |
| • | Annual fee for Chairman of the Audit Committee: $5,000; and |
| • | Annual fee for Chairman of the Compensation Committee: $5,000. |
Non-employee directors are also eligible to receive awards pursuant to the Plan. In connection with their appointment to our Board of Directors on the closing of the initial public offering in February 2013, each non-employee director received 2,500 shares of restricted stock. These shares vest in one-third increments on the first, second and third anniversary of the grant date. Directors who are also our full-time officers or employees will receive no additional compensation for serving as directors.
91
Table of Contents
Executive Compensation
The following table provides information regarding the compensation awarded to or earned during 2010, 2011 and 2012 by our Chief Executive Officer and each of the next three most highly compensated executive officers who were serving as executive officers through December 31, 2012 (collectively, the “named executive officers”).
Summary Compensation Table
| Name and Position |
Year | Salary | Bonus | Stock and Option Awards |
Total Cash Compensation |
All Other Compensation |
Non-Cash Equity Based Compensation |
Total Compensation |
||||||||||||||||||||||||
| S. Kent Rockwell, Chairman & Chief Executive Officer |
2012 | — | — | — | — | — | — | — | ||||||||||||||||||||||||
| 2011 | — | — | — | — | — | — | — | |||||||||||||||||||||||||
| 2010 | — | — | — | — | — | — | — | |||||||||||||||||||||||||
| David J. Burns, President & Chief Operating Officer |
2012 | $ | 272,216 | — | — | $ | 272,216 | $ | 2,117 | (1) | $ | 3,272,500 | (2) | $ | 3,546,833 | (2) | ||||||||||||||||
| 2011 | $ | 268,622 | — | — | $ | 268,622 | $ | 1,405 | (1) | — | $ | 270,027 | ||||||||||||||||||||
| 2010 | $ | 274,344 | — | — | $ | 274,344 | $ | 1,484 | (1) | — | $ | 275,828 | ||||||||||||||||||||
| Doris Pedersen, Chief Financial Officer(3) |
2012 | $ | 266,267 | — | — | $ | 266,267 | $ | 4,665 | (1) | — | $ | 270,932 | |||||||||||||||||||
| 2011 | $ | 122,446 | — | — | $ | 122,446 | $ | 2,507 | (1) | — | $ | 124,953 | ||||||||||||||||||||
| 2010 | $ | 133,716 | — | — | $ | 133,716 | $ | 752 | (1) | — | $ | 134,468 | ||||||||||||||||||||
| John Irvin, Chief Financial Officer(4) |
2012 | $ | 62,033 | — | — | $ | 62,033 | — | $ | 1,785,000 | (2) | 1,847,033 | (2) | |||||||||||||||||||
| 2011 | — | — | — | — | — | — | — | |||||||||||||||||||||||||
| 2010 | — | — | — | — | — | — | — | |||||||||||||||||||||||||
| Rainer Hoechsmann, General Manager of ExOne GmbH(5) |
2012 | $ | 286,396 | $ | 64,476 | — | $ | 350,872 | — | $ | 2,677,500 | (2) | $ | 3,028,372 | (2) | |||||||||||||||||
| 2011 | $ | 243,716 | $ | 62,667 | — | $ | 306,383 | — | — | $ | 306,383 | |||||||||||||||||||||
| 2010 | $ | 232,357 | $ | 2,851 | — | $ | 235,208 | — | — | $ | 235,208 | |||||||||||||||||||||
| (1) | Represents the net value of personal use of company car. |
| (2) | RFP sold: 550,000 common units (which converted into 319,000 shares of common stock upon our Reorganization) to David Burns; 300,000 common units (which converted into 174,000 shares of common stock upon our Reorganization) to John Irvin; and 450,000 common units (which converted into 261,000 shares of common stock upon our Reorganization) to Rainer Hoechsmann. Due to RFP’s controlling interest in us, such sales are deemed to be made by us; therefore, we recognized the excess of the fair market value on June 30, 2012, the measurement date, over the sale price of $1.25 per unit ($2.61 per share) as non-cash compensation expense. The fair value of the common units on the measurement date was $7.20 per unit ($12.41 per share), resulting in total non-cash compensation expense of approximately $7.7 million for accounting purposes. The total compensation listed above includes that non-cash compensation of $3.3 million, $1.8 million and $2.7 million for Messrs. Burns, Irvin and Hoechsmann, respectively. |
| (3) | Ms. Pedersen resigned as Chief Financial Officer effective September 30, 2012, and her employment with us ended on December 31, 2012. |
| (4) | Mr. Irvin became the Chief Financial Officer effective October 1, 2012. |
| (5) | ExOne paid Mr. Hoechsmann in Euros in 2010, 2011 and 2012. The referenced numbers were obtained by applying the average Euro to U.S. foreign currency exchange rate for 2010, 2011 and 2012 of 1.3277, 1.3926 and 1.2859, respectively. |
Narrative Disclosure to Summary Compensation Table
2013 Equity Incentive Plan
On January 24, 2013, our Board of Directors adopted the Plan. On August 19, 2013, our stockholders approved the Plan.
92
Table of Contents
Purpose. The purpose of the Plan is to provide incentives to attract, retain and motivate eligible persons whose present and potential contributions are important to our success and the success of our subsidiaries (including those that exist now and in the future), by offering them an opportunity to participate in our future performance through the grant of equity awards.
Types of Awards. The Plan consists of the following components: stock options, restricted stock, stock bonuses, stock appreciation rights, restricted stock units and performance awards.
| • | Stock Options. The Plan provides for the granting of options, both incentive stock options and non-qualified stock options, to purchase shares of our common stock (provided that incentive stock options that qualify under Section 422 of the Code may only be granted to employees of ours or a subsidiary of ours). An option award may be, but need not be, made subject to the satisfaction of performance factors during any performance period, as determined by the Compensation Committee and set forth in the award agreement evidencing such option award. Options may be vested and exercisable within the time period or upon the satisfaction of the conditions set forth in the award agreement evidencing such option; provided, however, that no option may be exercisable after the expiration of ten (10) years from the date the option is granted; and provided further, that no incentive stock option granted to a person who, at the time the incentive stock option is granted, directly or by attribution owns more than ten percent (10%) of the total combined voting power of all classes of stock of ours or of any subsidiary of ours will be exercisable after the expiration of five (5) years from the date the incentive stock option is granted. The Compensation Committee also may provide for options to become exercisable all at one time or from time to time, periodically or otherwise, in such number of shares or percentage of shares as the committee determines. The exercise price of each stock option will be determined by the Compensation Committee, but must be at least equal to the fair market value of our common stock on the date of grant. The exercise price of any incentive stock option granted to a 10% stockholder must be at least equal to 110% of that value. |
| • | Restricted Stock. A restricted stock award is an offer by us to sell shares of our common stock to an eligible person subject to certain restrictions, as determined by the Compensation Committee and set forth in the award agreement evidencing such award. These restrictions may be based on completion of a specified number of years of service with us or upon satisfaction of performance factors during any performance period, as determined by the Compensation Committee. The price of a restricted stock award will be determined by the Compensation Committee. Except as may be set forth in the participant’s award agreement, the vesting of any restricted stock award will cease on the date the participant no longer provides services to us and unvested shares will be forfeited to or repurchased by us at such time, unless otherwise determined by the Compensation Committee. |
| • | Stock Bonus Awards. Awards of shares of our common stock may be granted to eligible persons for services to be rendered or for past services already rendered to us or any of our subsidiaries. No payment from the recipient will be required for shares awarded pursuant to a stock bonus award. Stock bonus awards may be made subject to restrictions determined by the Compensation Committee, which may be based upon completion of a specified number of years of service with us or upon satisfaction of performance factors during any performance period, as determined by the Compensation Committee and set forth in the award agreement evidencing such award. Stock bonus awards may be settled in cash, whole shares, or a combination thereof, based on the fair market value of the shares earned under a stock bonus award on the date of payment, as determined by the Compensation Committee. Except as may be set forth in the participant’s award agreement, the vesting of any stock bonus award will cease on the date the participant no longer provides services to us and unvested shares will be forfeited to or repurchased by us at such time, unless otherwise determined by the Compensation Committee. |
| • | Stock Appreciation Rights. A stock appreciation right award is an award that may be settled in cash or shares (which may consist of restricted stock), having a value equal to (i) the difference between the fair market value on the date of exercise over the exercise price multiplied by (ii) the number of shares with respect to which the stock appreciation right award is being settled (subject to any maximum number of shares that may be issuable as specified in the award agreement evidencing such award). A |
93
Table of Contents
| stock appreciation right award may be, but need not be, made subject to the satisfaction of performance factors during any performance period, as determined by the Compensation Committee and set forth in the award agreement evidencing such award. Stock appreciation rights may be exercisable within the time period or upon the satisfaction of the conditions set forth in the award agreement evidencing such award; provided, however, that no stock appreciation right may be exercisable after the expiration of ten (10) years from the date the award is granted. The Compensation Committee also may provide for stock appreciation rights to become exercisable all at one time or from time to time, periodically or otherwise, in such number of shares or percentage of shares as the committee determines. Except as may be set forth in the participant’s award agreement, the vesting of any stock appreciation right award will cease on the date the participant no longer provides services to us and unvested shares will be forfeited to or repurchased by us at such time, unless otherwise determined by the Compensation Committee. |
| • | Restricted Stock Units. A restricted stock unit is an award that covers a number of shares of our common stock that may be settled upon vesting in cash or by the issuance of the underlying shares (which may consist of restricted shares). A restricted stock unit award may be, but need not be, made subject to the satisfaction of performance factors during any performance period, as determined by the Compensation Committee and set forth in the award agreement evidencing such award. Except as may be set forth in the participant’s award agreement, the vesting of any restricted stock unit award will cease on the date the participant no longer provides services to us and unvested shares will be forfeited to or repurchased by us at such time, unless otherwise determined by the Compensation Committee. |
| • | Performance Awards. A performance award is an award of a cash bonus or a performance share bonus. The payout of performance awards are subject to the satisfaction of performance factors during a performance period, as determined by the Compensation Committee and set forth in the award agreement evidencing such award. Any performance share award will have an initial value equal to the fair market value of a share of our common stock on the date of grant. After the applicable performance period has ended, the holder of a performance share award will be entitled to receive a payout of the number of performance shares earned by the participant over the performance period, to be determined as a function of the extent to which the corresponding performance factors or other vesting provisions have been achieved. The Compensation Committee, in its sole discretion, may settle the earned performance shares in the form of cash, in shares of our common stock (which have an aggregate fair market value equal to the value of the earned performance shares at the close of the applicable performance period) or in a combination thereof. Earned performance shares may also be settled in restricted stock. Except as may be set forth in the participant’s award agreement, the vesting of any performance award will cease on the date the participant no longer provides services to us and unvested shares will be forfeited to or repurchased by us at such time, unless otherwise determined by the Compensation Committee. |
Share Reserve. We have reserved 500,000 shares of our common stock for issuance under the Plan as of the date of this prospectus. The number of shares reserved for issuance under the Plan may be adjusted pursuant to certain anti-dilution adjustments described below and will increase automatically on the first day of January of each of 2014 through 2023 by a number of shares of common stock equal to the lesser of (i) three percent (3.0%) of the total outstanding shares of our common stock as of the immediately preceding December 31st or (ii) a number of shares determined by the Board of Directors, provided that the maximum number of shares authorized under our Plan will not exceed 1,992,242, which is equal to fifteen percent of the total outstanding shares of our common stock as of the consummation of our initial public offering, subject to any anti-dilution adjustments.
In addition, shares subject to awards, and shares issued under the Plan under any award, will again become available for grant and issuance as subsequent awards under the Plan to the extent such shares:
| • | were subject to options or stock appreciation rights granted under the Plan but which ceased to be subject to the option or stock appreciation rights for any reason other than exercise of the option or stock appreciation right; |
94
Table of Contents
| • | were subject to awards granted under the Plan that were subsequently forfeited or repurchased by the Company at the original issue price; |
| • | were subject to awards granted under the Plan that otherwise terminated without such shares being issued; |
| • | were surrendered pursuant to our exchange program; or |
| • | were used or withheld to pay the exercise price of an award or to satisfy the tax withholding obligations related to an Award. |
Term. The Plan will terminate January 24, 2023, unless it is terminated earlier by our Board of Directors.
Eligibility. Incentive stock options may be granted only to our employees. All other awards may be granted to employees, consultants, directors and non-employee directors of us or any subsidiary of ours; provided such consultants, directors and non-employee directors render bona fide services that are not in connection with the offer and sale of securities in a capital-raising transaction. No person will be eligible to receive more than 100,000 shares in any calendar year under the Plan, except that we may choose to issue a new employee up to 500,000 shares under the Plan in the calendar year in which the employee commences employment.
Administration. The Plan is administered by our Compensation Committee, all of the members of which are independent directors under applicable federal securities laws and “outside directors” as defined under applicable federal tax laws. The Compensation Committee has the authority to construe and interpret the Plan, grant awards and make all other determinations necessary or advisable for the administration of the Plan including, without limitation, the participants to whom such awards will be made, the numbers of shares subject to each such award, the exercise price or purchase price, if any, and the other terms and conditions of such awards. The Compensation Committee may, to the extent permitted by applicable law, delegate to one or more executive officers the authority to grant awards under the Plan, subject to the terms of the Plan and such delegation.
Certain Corporate Transactions. If we experience a merger or consolidation, as described within the Plan’s definition of Corporate Transaction, outstanding awards, including any vesting provisions, may be subject to the terms of the merger or similar agreement, and may be assumed or substituted by the successor company. Outstanding awards that are not assumed or substituted in such a transaction may be exercisable for a period of time and may expire upon the closing of such merger or consolidation. Vesting of awards is accelerated in change of control transactions other than mergers or consolidations, as defined herein. In the event of a Corporate Transaction, the vesting of all awards granted to Non-Employee Directors will accelerate and such awards will become exercisable (as applicable) in full prior to the consummation of such event at such time and on such conditions as the Committee determines.
Amendment and Termination. The Board of Directors may at any time terminate or amend the Plan in any respect or any award agreement issued in connection with the Plan; provided, however, that the Board of Directors may not, without the approval of the stockholders of the Company, amend the Plan in any manner that requires stockholder approval; and provided further, that a participant’s award will be governed by the version of the Plan then in effect at the time such award was granted.
Outstanding Equity Awards at December 31, 2012 and June 30, 2013
There were no outstanding equity awards held by our named executive officers as of December 31, 2012 (our fiscal year end).
The actual amount of other awards to be received by or allocated to participants or groups under the Plan is not determinable in advance because the selection of participants who receive awards under the Plan, and the size and type of awards to such individuals and groups are generally determined by the Committee in its discretion.
95
Table of Contents
The following table shows the awards granted in 2013 to date to all non-executive directors, to all current executive officers as a group and to all non-executive officer employees as a group under the Plan:
| Stock Options | Restricted Stock |
|||||||||||
| Number of Shares (#) |
Exercise Price |
Number of Shares (#) |
||||||||||
| Non-executive directors as a group (4 total) |
— | — | 10,000 | |||||||||
| Executive officers as a group (11 total) |
30,000 | $ | 18.00 | 10,000 | ||||||||
| Non-executive officer employees as a group |
150,000 | $ | 18.00 | — | ||||||||
Employment Agreements
We have entered into employment agreements with: Mr. Rockwell, for an initial term ending on September 1, 2014; Mr. Burns, for an initial term ending on June 1, 2014; and Mr. Irvin, for an initial term ending on October 1, 2014, in all cases unless sooner terminated pursuant to the agreements.
Each agreement will automatically extend for additional one year terms on each subsequent anniversary, unless not later than 90 days immediately preceding any anniversary, we or the executive has given written notice to the other that it does not wish to extend the employment agreements. Under the employment agreements, the executives are entitled to receive an annual base salary and are eligible to participate in an annual bonus plan on terms established from time to time by the Board. During the term of the employment agreements, the executives are also eligible to participate in any long-term incentive plan, and in all employee benefit and fringe benefit plans and arrangements made available to its employees generally or its executives.
The employment agreements provide, among other matters, that if the executive resigns for “good reason” (as defined in the employment agreement) or is terminated without “cause” (as defined in the employment agreement) and in each such case has timely delivered a release of claims, he or she is entitled to receive, among other severance payments and benefits, an amount equal to one times his or her then-current base salary and one times the target annual bonus amount (subject to his or her compliance with the confidentiality, non-competition and non-solicitation restrictions set forth in the employment agreement) and payment of the executive’s COBRA health insurance continuation premium for the COBRA continuation period (generally 18 months) or until such time as the executive is employed, whichever is earlier. The confidentiality provisions survive the termination of his employment with us and the non-competition and non-solicitation provisions survive for a period of two years following the termination of his employment.
We also have an employment agreement with Mr. Hoechsmann, which extends automatically unless terminated with three months’ notice prior to the end of any fiscal quarter. Mr. Hoechsmann is entitled to receive an annual base salary and annual bonus and is eligible to participate in any long-term incentive plan and in all employee benefit and fringe benefit plans and arrangements made available to our employees generally or our executives. The agreement also provides that all inventions or patents developed by Mr. Hoechsmann in connection with his employment are our property and that Mr. Hoechsmann is subject to a non-competition clause throughout his employment and for two years thereafter, subject to payment per year, for the two year non-compete period, of fifty percent of the average remuneration he received for the last three years.
96
Table of Contents
The following table sets forth information as of June 30, 2013, with respect to the ownership of our common stock of: (a) each of our directors; (b) each named executive officer in the summary compensation table located elsewhere in this prospectus; (c) each person who is known by us to the beneficial owner of more than five percent of the outstanding shares of common stock; and (d) all directors and executive officers as a group. To our knowledge, except as indicated in the footnotes to this table or as provided by applicable community property laws, the persons named in the table have sole investment and voting power with respect to the shares of common stock indicated.
| Number of Common Shares |
Percentage Beneficially Owned |
|||||||
| Name and Address(1) |
||||||||
| Directors and Executive Officers |
||||||||
| S. Kent Rockwell(2)(3)(4) |
4,931,027 | 37.1 | % | |||||
| David J. Burns |
319,000 | 2.4 | % | |||||
| John Irvin(5) |
322,000 | 2.4 | % | |||||
| Rainer Hoechsmann |
261,000 | 2.0 | % | |||||
| Raymond J. Kilmer(6) |
— | — | ||||||
| Victor Sellier(6) |
3,000 | * | ||||||
| Lloyd A. Semple(6)(7) |
7,800 | * | ||||||
| Bonnie K. Wachtel(6) |
— | — | ||||||
| All Directors/Executive Officers as group (11 persons)(4)(6)(8)(9) |
5,897,327 | 44.4 | % | |||||
| * | Less than 1% |
| (1) | The address of each of our principal stockholders is 127 Industry Boulevard, North Huntingdon, Pennsylvania 15642. |
| (2) | Amount does not include 580,000 common shares (which is 4.4% of our outstanding shares) owned by the S. Kent Rockwell 1997 Irrevocable Trust. S. Kent Rockwell disclaims beneficial ownership of the shares held by the S. Kent Rockwell 1997 Irrevocable Trust. |
| (3) | S. Kent Rockwell is deemed to have beneficial ownership of the shares so indicated as the beneficiary of the S. Kent Rockwell Revocable Trust, which is the indirect, sole stockholder of RFP, the beneficial owner of 4,176,000 shares of common stock, or of 31.4% our outstanding shares of common stock. |
| (4) | S. Kent Rockwell is deemed to have beneficial ownership of shares beneficially owned by the S. Kent Rockwell Revocable Trust, which is the indirect, sole stockholder of RHI, the beneficial owner of 755,027 common shares, or of 5.7%. On August 20, 2013, RHI gifted 450,000 shares of our common stock to Lafayette Trust. The Lafayette Trust is an irrevocable trust, of which Lafayette College is the sole trustee. The Lafayette Trust has a term of ten years, during which it is required to pay during each taxable year of the Lafayette Trust an amount equal to 5% of the net fair market value of its assets, valued as of the first day of the taxable year, to RHI. The amount of the payment to RHI is prorated on a daily basis for any short taxable year and for the final year of the Lafayette Trust. At the end of the ten year term, any principal and income not distributed to RHI will be paid to Lafayette College. Consistent with Lafayette College’s common practice to sell securities gifted to it, the 450,000 shares are being sold pursuant to this prospectus. The Vice President of Finance and Administration of Lafayette College, among other Lafayette College personnel, is authorized to execute documents associated with the Lafayette Trust and the sale of the shares. Mr. Rockwell disclaims all beneficial ownership of the shares gifted to the Lafayette Trust. |
| (5) | Includes 3,000 shares purchased by Colette Irvin, John Irvin’s spouse. |
| (6) | Number does not include the grant of 2,500 shares (10,000 shares in the aggregate) of restricted stock to each of Messrs. Semple, Sellier and Kilmer and Ms. Wachtel, which vest in equal installments over a three year period, the first of which lapses February 6, 2014. |
97
Table of Contents
| (7) | Includes 300 shares purchased by Cynthia T. Semple, Lloyd Semple’s spouse. |
| (8) | Number does not include 15,000 shares (30,000 shares in the aggregate) of common stock underlying incentive stock options awarded to two executive officers, which vest in equal installments over a three year period, the first of which lapses February 6, 2014. |
| (9) | Number does not include the grant of 10,000 shares of restricted stock to one executive officer, which vests in equal installments over a three year period, the first of which lapses March 11, 2014. |
98
Table of Contents
CERTAIN RELATIONSHIPS AND RELATED PARTY TRANSACTIONS
Approval of Related Party Transactions
Prior to our initial public offering, we were a privately held company with a very small number of equity holders which was primarily funded by companies which are affiliated with Mr. Rockwell (see below). As a result, we never adopted any policy concerning the review, approval or ratification of transactions with related persons. However, following our initial public offering, on March 26, 2013, our Board of Directors adopted a written policy with respect to related person transactions. The following is a brief summary of the newly adopted Policy and Procedures with Respect to Related Person Transactions.
It is the policy of the Company to enter into or ratify related person transactions only when the Board of Directors acting through the Audit Committee has determined that the transaction in question is in the best interests of the Company. Prior to entering into a related person transaction, the related person shall provide notice to the Chief Legal Officer of the facts and circumstances of the transaction. Upon determining that the proposed transaction involves an amount greater than $50,000 and is a related person transaction, the proposed transaction shall be submitted to the Audit Committee for consideration. The Audit Committee shall consider all relevant facts and circumstances and approve only those related person transactions that are in the best interests of the Company and its stockholders.
Rockwell Related Entities
S. Kent Rockwell, our Chairman and Chief Executive Officer, is the trustee and beneficiary of the S. Kent Rockwell Revocable Trust, which is the 100% owner of Rockwell Venture Capital, Inc., which is the 100% owner of each of RHI and RFP. As a result, Mr. Rockwell is deemed to have beneficial ownership of the shares owned by RHI and RFP.
The S. Kent Rockwell 1997 Irrevocable Trust is the owner of 580,000 shares of our common stock. Mr. Rockwell disclaims beneficial ownership of the shares owned by the S. Kent Rockwell 1997 Irrevocable Trust.
Borrowings
As of December 30, 2011, we had borrowed approximately $19.0 million from RHI for working capital. In order to satisfy this debt, we issued 18,983,602 preferred units to RHI on December 30, 2011. In May of 2012, RHI sold 6,000,000 preferred units to third parties. As part of our Reorganization, RHI converted its remaining 12,983,602 preferred units to 12,983,602 shares of our Class A preferred stock and the other holders of preferred units converted 6,000,000 preferred units to 6,000,000 shares of our Class A preferred stock. Immediately prior to completion of our initial public offering, these shares converted into 1,366,695 shares of our common stock.
Also during 2012, we entered into a revolving line of credit with RFP (the “Rockwell Line of Credit”) (also referred to in the accompanying consolidated financial statements as the demand note payable to member), which was unlimited in amount. The line of credit provides for borrowing, repayment and reborrowing from time to time. Borrowings under the Rockwell Line of Credit bear interest at the rate of 8% per annum and are repayable, in whole or part, upon demand of RFP. As of December 31, 2012, we had aggregate borrowings of $8.7 million outstanding under the Rockwell Line of Credit.
Following our initial public offering, we were no longer permitted to request additional amounts pursuant to the Rockwell Line of Credit. We used approximately $9.9 million of the net proceeds from our initial public offering to pay the amount outstanding under the Rockwell Line of Credit.
Share Ownership
As of January 1, 2013, we had 5,800,000 shares of common stock outstanding, 72% of which were owned by RFP and 10% of which were owned by the S. Kent Rockwell 1997 Irrevocable Trust, and 18,983,602 shares
99
Table of Contents
of Class A preferred stock outstanding, 12,983,602 shares of which (or 68%), were owned by RHI. Immediately prior to completion of our initial public offering, Class A preferred stock converted by its own terms into common stock on a 9.5 to 1 basis, resulting in 1,998,275 shares of additional outstanding common stock.
As of June 30, 2013, we had 13,281,608 shares of common stock outstanding (giving effect to the conversion of the Class A preferred stock into shares of common stock (of which 1,366,695 shares were owned by RHI) and the sale of 6,095,000 shares of common stock in the initial public offering). As of June 30, 2013, RHI held 5.7% of our outstanding common stock and RFP held 31.4% of our outstanding common stock. In the aggregate, these entities held 37.1% of our outstanding common stock as of June 30, 2013.
On August 20, 2013, RHI gifted 450,000 shares of our common stock to Lafayette Trust. The Lafayette Trust is an irrevocable trust, of which Lafayette College is the sole trustee. The Lafayette Trust has a term of ten years, during which it is required to pay during each taxable year of the Lafayette Trust an amount equal to 5% of the net fair market value of its assets, valued as of the first day of the taxable year, to RHI. The amount of the payment to RHI is prorated on a daily basis for any short taxable year and for the final year of the Lafayette Trust. At the end of the ten year term, any principal and income not distributed to RHI will be paid to Lafayette College. Consistent with Lafayette College’s common practice to sell securities gifted to it, the 450,000 shares are being sold pursuant to this prospectus. The Vice President of Finance and Administration of Lafayette College, among other Lafayette College personnel, is authorized to execute documents associated with the Lafayette Trust and the sale of the shares. Mr. Rockwell disclaims all beneficial ownership of the shares gifted to the Lafayette Trust.
S. Kent Rockwell disclaims all beneficial ownership of the shares held by the S. Kent Rockwell 1997 Irrevocable Trust which owns 4.4% of our outstanding common stock.
Leased Property
Until March 27, 2013 we leased property and equipment used by our Houston, Texas and Troy, Michigan operations from our two variable interest entities, Lone Star and TMF, respectively, and we guaranteed certain debt of both of them. Lone Star and TMF are owned by the S. Kent Rockwell Revocable Trust, in the case of TMF, and RFP, in the case of Lone Star. For each of the six month periods ended June 30, 2013 and 2012 we paid Lone Star and TMF approximately $0.1 million, respectively, under these leases. For the years ended December 31, 2012, 2011 and 2010, we paid Lone Star $0.1 million, $0.4 million and $0.4 million, and TMF $1.6 million, $1.0 million and $1.0 million, respectively, under these leases.
On March 27, 2013, our wholly-owned subsidiary, ExOne Americas LLC, acquired certain assets, including property and equipment (principally land, buildings and machinery and equipment) held by our two variable interest entities, TMF and Lone Star, and assumed all outstanding debt of such variable interest entities, including certain related interest rate swap agreements. Lone Star is owned by RFP and TMF is owned by the S. Kent Rockwell Revocable Trust. S. Kent Rockwell, our chairman and Chief Executive Officer, is the trustee and beneficiary of the S. Kent Rockwell Revocable Trust, which is the 100% owner of Rockwell Venture Capital, Inc., which is the 100% owner of RFP.
Payment of approximately $1.9 million was made to TMF and approximately $0.2 million was made to Lone Star, including a return of capital to these entities, which are controlled by Mr. Rockwell, of approximately $1.4 million. There was no gain or loss or goodwill generated as a result of this transaction. Simultaneous with the completion of this transaction, we also repaid all of the outstanding debt assumed from the variable interest entities, resulting in a payment of approximately $4.7 million.
Transactions Between ExOne and Entities Controlled by Mr. Rockwell
We provide various services to several related entities under common control by Mr. Rockwell, primarily in the form of accounting, finance, information technology and human resource outsourcing, which are generally reimbursed by the related entities. The cost of these services was approximately $0.1 million for each of the six
100
Table of Contents
month periods ended June 30, 2013 and 2012. The cost of these services was approximately $0.3 million, $0.2 million and $0.1 million for the years ended December 31, 2012, 2011 and 2010, respectively. In addition, we may purchase certain items on behalf of related parties under common control by Mr. Rockwell. Amounts due from these related entities at June 30, 2013, and December 31, 2012 and 2011 were not significant.
We also receive design services and the corporate use of an airplane from related entities under common control by Mr. Rockwell. The cost of these services received was approximately $0.1 million for each of the six month periods ended June 30, 2013 and 2012. The cost of these services received was approximately $0.1 million for the year ended December 31, 2012 and less than $0.1 million for each of the years ended December 31, 2011 and 2010. Amounts due to these related entities at June 30, 2013, and December 31, 2012 and 2011 were not significant.
101
Table of Contents
We will not receive any of the proceeds from the sale of any shares by the selling stockholders. The selling stockholders will pay us their pro rata portion of the estimated expenses for the offering. To the extent the actual expenses of the offering exceed estimated expenses, we will bear the additional expense. The estimated expenses of the offering (including legal fees and expenses, accounting fees and expenses, SEC filing fees and printing fees, but not including the underwriting discount) are $ .
The following table sets forth information as of August 21, 2013 regarding shares beneficially owned by the selling stockholders. To our knowledge and except as specifically noted below, each person named in the table has sole investment and voting power with respect to the shares of common stock indicated beside their name.
| Name and Address of Beneficial |
Shares Beneficially Owned Prior to Offering |
Number of Shares to be Sold in Offering |
Shares Beneficially Owned After Offering |
Maximum Number of Shares to be Sold if Option to Purchase Additional Shares is Exercised in Full(1) |
Shares Beneficially Owned After Offering if Option to Purchase Additional Shares if Exercised in Full |
|||||||||||||||||||||||||||
| Number | Percentage | Number | Percentage | Number | Percentage | |||||||||||||||||||||||||||
| Rockwell Holdings, Inc.(2) |
305,027 | 2.30 | % | 305,027 | — | — | — | — | — | |||||||||||||||||||||||
| Rockwell Forest Products, Inc.(2) |
4,176,000 | 31.44 | % | 794,973 | 3,381,027 | 23.50 | % | 213,400 | 3,167,627 | 22.02 | % | |||||||||||||||||||||
| Rockwell Holdings, Inc. Charitable Remainder Unitrust(3) |
450,000 | 3.39 | % | 450,000 | — | — | — | — | — | |||||||||||||||||||||||
| David Burns(4) |
319,000 | 2.40 | % | — | 319,000 | 2.22 | % | 60,000 | 259,000 | 1.80 | % | |||||||||||||||||||||
| Rainer Hoechsmann(5) |
261,000 | 1.97 | % | — | 261,000 | 1.81 | % | 60,000 | 201,000 | 1.40 | % | |||||||||||||||||||||
| John Irvin(6) |
322,000 | 2.42 | % | — | 322,000 | 2.24 | % | 60,000 | 262,000 | 1.82 | % | |||||||||||||||||||||
| Rick Lucas(7) |
20,000 | * | — | 20,000 | * | 5,000 | 15,000 | * | ||||||||||||||||||||||||
| * | Denotes less than 1%. |
| (1) | If the underwriters fully exercise their over-allotment option, then the selling stockholders will sell the number of shares of common stock indicated. If the underwriters do not exercise their over-allotment option, then the selling stockholders will sell none of these shares. If the underwriters partially exercise their over-allotment option, then the number of shares sold by the selling stockholders will be adjusted to reflect such percentage. |
| (2) | S. Kent Rockwell is deemed to have beneficial ownership of the shares so indicated as the beneficiary of the S. Kent Rockwell Revocable Trust, which is the indirect, sole stockholder of RHI, the beneficial owner of 305,027 shares of our common stock, and RFP, the beneficial owner of 4,176,000 shares of our common stock. See “Principal Stockholders.” |
| (3) | On August 20, 2013, RHI gifted 450,000 shares of our common stock to Lafayette Trust. The Lafayette Trust is an irrevocable trust, of which Lafayette College is the sole trustee. The Lafayette Trust has a term of ten years, during which it is required to pay during each taxable year of the Lafayette Trust an amount equal to 5% of the net fair market value of its assets, valued as of the first day of the taxable year, to RHI. The amount of the payment to RHI is prorated on a daily basis for any short taxable year and for the final year of the Lafayette Trust. At the end of the ten year term, any principal and income not distributed to RHI will be paid to Lafayette College. Consistent with Lafayette College’s common practice to sell securities gifted to it, the 450,000 shares are being sold pursuant to this prospectus. The Vice President of Finance and Administration of Lafayette College, among other Lafayette College personnel, is authorized to execute documents associated with the Lafayette Trust and the sale of the shares. Mr. Rockwell disclaims all beneficial ownership of the shares gifted to the Lafayette Trust. |
102
Table of Contents
| (4) | Mr. Burns has served as our President and Chief Operating Officer since 2005. He also has served as a director since January 1, 2013. |
| (5) | Mr. Hoechsmann has served as General Manager of ExOne GmbH, a subsidiary of ExOne, since 2003 and is responsible for our operations in Europe. |
| (6) | Mr. Irvin has served as our Chief Financial Officer since October 1, 2012, and began serving as a director effective January 1, 2013. |
| (7) | Mr. Lucas has served as our Chief Technology Officer since June 2012. The shares included for Mr. Lucas do not include 15,000 shares of common stock underlying incentive stock options awarded to Mr. Lucas, which vest in equal installments over a three year period, the first of which lapses February 6, 2014. |
Unless otherwise indicated, all information in this prospectus excludes:
| (i) | 500,000 shares of common stock reserved for issuance under the Plan. The Plan provides for automatic increases in the reserve available annually on January 1 from 2014 through 2023 equal to the lesser of (i) 3.0% of the total outstanding shares of common stock as of December 31 of the immediately preceding year or (ii) a number of shares of common stock determined by our Board of Directors, provided that the maximum number of shares authorized under the Plan will not exceed 1,992,242 shares, subject to certain adjustments. |
| (ii) | Options to certain employees to purchase 175,000 shares of common stock issuable upon exercise of such options as of June 30, 2013, at an exercise price of $18.00 per share, which vest in equal annual installments over three years from the date of grant. |
| (iii) | 20,000 shares of restricted stock that were unvested as of June 30, 2013. |
103
Table of Contents
The following describes our common stock, preferred stock, and certain terms of our certificate of incorporation and bylaws. This description is a summary only and is subject to the complete text of our certificate of incorporation and bylaws, which we have filed as exhibits to the registration statement of which this prospectus is a part.
Our authorized capital stock consists of 200,000,000 shares of common stock, par value $0.01 per share, and 50,000,000 shares of preferred stock, par value $0.01 per share. As of August 20, 2013, we had 13,281,608 shares of common outstanding, which were held of record by 12 stockholders and no shares of preferred stock outstanding. In addition, as of August 20, 2013, there were outstanding options to purchase 175,000 shares of common stock and 20,000 shares of unvested restricted stock.
Common Stock
Each share of common stock entitles the holder to one vote on all matters on which holders are permitted to vote, including the election of directors. There are no cumulative voting rights. Accordingly, holders of a majority of shares entitled to vote in an election of directors are able to elect all of the directors standing for election.
Subject to preferences that may be applicable to any outstanding preferred stock, the holders of the common stock share equally on a per share basis any dividends when, as and if declared by the Board of Directors out of funds legally available for that purpose. If we are liquidated, dissolved or wound up, the holders of our common stock will be entitled to a ratable share of any distribution to stockholders, after satisfaction of all of our liabilities and of the prior rights of any outstanding class of our preferred stock. Our common stock does not carry any preemptive or other subscription rights to purchase shares of our stock and are not convertible, redeemable or assessable.
Preferred Stock
Our Board of Directors has the authority, without stockholder approval, to issue shares of preferred stock from time to time in one or more series and to fix the number of shares and terms of each such series. The Board of Directors may determine the designation and other terms of each series, including, among others:
| • | dividend rates; |
| • | whether dividends will be cumulative or non-cumulative; |
| • | redemption rights; |
| • | liquidation rights; |
| • | sinking fund provisions; |
| • | conversion or exchange rights; and |
| • | voting rights. |
The issuance of preferred stock, while providing us with flexibility in connection with possible acquisitions and other corporate purposes, could reduce the relative voting power of holders of our common stock. It could also affect the likelihood that holders of our common stock will receive dividend payments and payments upon liquidation.
The issuance of shares of capital stock, or the issuance of rights to purchase shares of capital stock, could be used to discourage an attempt to obtain control of our Company. For example, if, in the exercise of its fiduciary
104
Table of Contents
obligations, our Board of Directors determined that a takeover proposal was not in the best interest of our stockholders, the Board of Directors could authorize the issuance of preferred stock or common stock without stockholder approval. The shares could be issued in one or more transactions that might prevent or make the completion of the change of control transaction more difficult or costly by:
| • | diluting the voting or other rights of the proposed acquiror or insurgent stockholder group; |
| • | creating a substantial voting bloc in institutional or other hands that might undertake to support the position of the incumbent Board of Directors; or |
| • | effecting an acquisition that might complicate or preclude the takeover. |
In this regard, our certificate of incorporation grants our Board of Directors broad power to establish the rights and preferences of the authorized and unissued preferred stock. Our Board of Directors could establish one or more series of preferred stock that entitle holders to:
| • | vote separately as a class on any proposed merger or consolidation; |
| • | cast a proportionately larger vote together with our common stock on any transaction or for all purposes; |
| • | elect directors having terms of office or voting rights greater than those of other directors; |
| • | convert preferred stock into a greater number of shares of our common stock or other securities; |
| • | demand redemption at a specified price under prescribed circumstances related to a change of control of us; or |
| • | exercise other rights designed to impede a takeover. |
Alternatively, a change of control transaction deemed by the Board of Directors to be in the best interest of our stockholders could be facilitated by issuing a series of preferred stock having sufficient voting rights to provide a required percentage vote of the stockholders.
105
Table of Contents
CERTIFICATE OF INCORPORATION AND BYLAWS
Election and Removal of Directors
Our certificate of incorporation provides that our board of directors will consist of between one and sixteen directors, excluding any directors elected by holders of preferred stock, voting separately as a class, pursuant to provisions applicable in the case of arrearages in the payment of dividends or other defaults contained in the certificate of incorporation or resolution by the Board of Directors providing for the establishment of any series of preferred stock. The number of directors shall be fixed, from time to time, by a majority of directors then in office. The exact number of directors is currently seven.
No director may be removed except for cause, and directors may be removed for cause by an affirmative vote of shares representing a majority of the shares then entitled to vote at an election of directors. Any vacancy occurring on the Board of Directors and any newly created directorship may be filled only by a majority of the remaining directors in office.
No Cumulative Voting
The holders of our common stock are not entitled to cumulate their votes for the election of one or more directors or for any other purpose.
Special Stockholder Meetings
Our certificate of incorporation and our bylaws provide that special meetings of our stockholders may be called only by the chairman of our Board of Directors or a majority of the directors. Our certificate of incorporation and our bylaws specifically deny the power of any other person to call a special meeting; provided, however, that special meetings of the stockholders shall be called by the Board of Directors upon written request to our Secretary by one or more stockholders holding shares representing in the aggregate not less than 20% of the total number of votes entitled to be cast on the matter or matters to be brought before the proposed special meeting.
Stockholder Action by Written Consent
Our certificate of incorporation provides that holders of our common stock are not able to act by written consent without a meeting, unless such consent is unanimous.
Amendment of Certificate of Incorporation
The provisions of our certificate of incorporation described above under “Election and Removal of Directors,” “Stockholder Meetings,” and “Stockholder Action by Written Consent” may be amended only by the affirmative vote of holders of at least 75% of the voting power of our outstanding shares of voting stock, voting together as a single class. The affirmative vote of holders of at least a majority of the voting power of our outstanding shares of stock will generally be required to amend other provisions of our certificate of incorporation.
Amendment of Bylaws
Our bylaws may generally be altered, amended or repealed, and new bylaws may be adopted, with:
| • | the affirmative vote of a majority of directors present at any regular or special meeting of the board of directors called for that purpose; provided that any proposed alteration, amendment or repeal of, or adoption of any bylaw inconsistent with, specified provisions of the bylaws, including those related to special and annual meetings of stockholders, voting and vacancies of directors, requires the affirmative vote of at least 75% of all directors in office at a meeting called for that purpose; or |
106
Table of Contents
| • | the affirmative vote of holders of 75% of the voting power of our outstanding shares of voting stock, voting together as a single class. |
Other Limitations on Stockholder Actions
Our bylaws also impose some procedural requirements on stockholders who wish to:
| • | make nominations in the election of directors; |
| • | propose that a director be removed; or |
| • | propose any other business to be brought before an annual or special meeting of stockholders. |
Under these procedural requirements, in order to bring a proposal before a meeting of stockholders, a stockholder must deliver timely notice of a proposal pertaining to a proper subject for presentation at the meeting to our corporate secretary along with the following:
| • | a description of the business or nomination to be brought before the meeting and the reasons for conducting such business at the meeting; |
| • | the name and address of the stockholder, as they appear on the Company’s books, and of such beneficial owner, if any; |
| • | any material interest in the proposal, direct or indirect, of the stockholder, or the beneficial owner, if any, on whose behalf the proposal is being made; |
| • | the class and number of shares of our capital stock owned beneficially and of record by the stockholder, and the beneficial owner, if any, and evidence of such ownership (along with a representation that such person will provide within 5 business days after the record date for such meeting ownership information as of the record date for such meeting); |
| • | if applicable, a description of all arrangements and understandings regarding the nomination or business proposal between or among such stockholder and such beneficial owner, if any, and any others in effect at the time of the notice (with a representation that such person will notify the Company of the same in writing within 5 business days after the record date for such meeting); |
| • | if applicable, a description of all agreements, arrangements or understandings (including any derivative or short positions, profit interests, options, hedging transactions and borrowed or loaned shares (regardless of whether settled in shares or cash) or other similar arrangements) that have been entered into as of the date of the stockholders’ notice by, or on behalf of, such stockholder and such beneficial owner, if any, the effect or intent of which is to mitigate loss, manage risk or benefit from changes in the share price of any class of the Company’s stock, or increase or decrease the voting power of the stockholder or beneficial owner, if any, with respect to stock of the Company (with a representation that the stockholder will notify the Company of the same in writing within 5 business days after the record date for such meeting); |
| • | if applicable, a description of all agreements, arrangements or understandings related to acquiring, holding, voting or disposing of any shares of the Company, including the number of shares that are the subject to such agreement, arrangement or understanding (with a representation that the stockholder will notify the Company of the same in writing within 5 business days after the record date for such meeting); |
| • | a representation as to whether the stockholder or the beneficial owner, if any, will engage in a solicitation with respect to such nomination or business proposal and, if so, the name of each participant in such solicitation and whether such person or group intends to deliver a proxy statement and/or form of proxy to stockholders; and |
107
Table of Contents
| • | as to the stockholder giving the notice and the beneficial owner, if any, on whose behalf the proposal is made, such stockholder’s and beneficial owner’s consent to the public disclosure of information provided by the stockholder providing such notice. |
To be timely, a stockholder must generally deliver notice:
| • | in connection with an annual meeting of stockholders, not less than 120 nor more than 180 days prior to the date on which the annual meeting of stockholders was held in the immediately preceding year, but in the event that the date of the annual meeting is more than 30 days before or more than 60 days after the anniversary date of the preceding annual meeting of stockholders, a stockholder notice will be timely if received by us not later than the close of business on the later of (1) the 120th day prior to the annual meeting and (2) the 10th day following the day on which we first publicly announce the date of the annual meeting; or |
| • | in connection with the election of a director at a special meeting of stockholders, not less than 40 nor more than 60 days prior to the date of the special meeting, but in the event that less than 55 days’ notice or prior public disclosure of the date of the special meeting of the stockholders is given or made to the stockholders, a stockholder notice will be timely if received by us not later than the close of business on the 10th day following the day on which a notice of the date of the special meeting was mailed to the stockholders or the public disclosure of that date was made. |
In order to submit a nomination for our board of directors, a stockholder must also submit any information with respect to the nominee that we would be required to include in a proxy statement, along with the information that is required to be provided by the stockholder giving the notice and the beneficial owner, if any, on whose behalf the nomination is made (as described above). If a stockholder fails to follow the required procedures, the stockholder’s proposal or nominee will be ineligible and will not be voted on by our stockholders.
Limitation of Liability of Directors and Officers
Our certificate of incorporation provides that no director will be personally liable to us or our stockholders for monetary damages for breach of fiduciary duty as a director of the Company, except as required by applicable law, as in effect from time to time. Currently, Delaware law requires that liability be imposed for the following:
| • | any breach of the director’s duty of loyalty to our Company or our stockholders; |
| • | any act or omission not in good faith or which involved intentional misconduct or a knowing violation of law; |
| • | unlawful payments of dividends or unlawful stock repurchases or redemptions as provided in Section 174 of the Delaware General Corporation Law; and |
| • | any transaction from which the director derived an improper personal benefit. |
As a result, neither we nor our stockholders will have the right, through stockholders’ derivative suits on our behalf, to recover monetary damages against a director for breach of fiduciary duty as a director, including breaches resulting from grossly negligent behavior, except in the situations described above.
Our bylaws provide that, to the fullest extent permitted by law, we will indemnify any of our officers or directors against all damages, claims and liabilities arising out of the fact that the person is or was our director or officer, or served any other enterprise at our request as a director, officer, employee, agent or fiduciary. We will reimburse the expenses, including attorneys’ fees, reasonably incurred by any person entitled to be indemnified by this provision when we receive an undertaking by or on behalf of such person to repay such amounts if it is ultimately determined that the person is not entitled to be indemnified by us. Amending this provision will not reduce our indemnification obligations relating to actions taken before an amendment.
108
Table of Contents
Exclusive Forum
Our bylaws provide that a state court in the State of Delaware (or, if no state court located in Delaware has jurisdiction, the federal district court for the District of Delaware) shall be the exclusive forum for (i) any derivative action or proceeding brought on behalf of the Company, (ii) any action asserting a claim of breach of a fiduciary duty owed by any director or officer or other employee of the Company to the Company or the Company’s stockholders, (iii) any action asserting a claim against the Company or any director or officer or other employee of the Company arising pursuant to any provision of the Delaware General Corporation Law or the Company’s certificate of incorporation or bylaws (as either may be amended from time to time), or (iv) any action asserting a claim against the Company or any director or officer or other employee of the Company governed by the internal affairs doctrine.
Anti-Takeover Effects of Some Provisions
Some of the provisions of our certificate of incorporation and bylaws outline above could make the following more difficult:
| • | acquisition of control of us by means of a proxy contest or otherwise, or |
| • | removal of our incumbent officers and directors. |
These provisions, as well as our ability to issue preferred stock, are designed to discourage coercive takeover practices and inadequate takeover bids. These provisions are also designed to encourage persons seeking to acquire control of us to first negotiate with our board of directors. We believe that the benefits of increased protection give us the potential ability to negotiate with the proponent of an unfriendly or unsolicited proposal to acquire or restructure us, and that the benefits of this increased protection outweigh the disadvantages of discouraging those proposals, because negotiation of those proposals could result in an improvement of their terms.
Delaware Business Combination Statute
We are governed by the provisions of Section 203 of the Delaware General Corporation Law, which regulates corporate acquisitions. Section 203 prevents an “interested stockholder,” which is defined generally as a person owning 15% or more of a corporation’s outstanding voting stock, or any affiliate or associate of such person, from engaging in a broad range of “business combinations” with the corporation for three years after becoming an interested stockholder unless:
| • | the Board of Directors of the corporation had previously approved either the business combination or the transaction that resulted in the stockholder’s becoming an interested stockholder; |
| • | upon completion of the transaction that resulted in the stockholder’s becoming an interested stockholder, such person owned at least 85% of the voting stock of the corporation outstanding at the time the transaction commenced, excluding stock owned by directors who are also officers of the corporation and stock owned by employee stock plans in which employee participants do not have the right to determine confidentially whether shares held subject to the plan will be tendered in a tender or exchange offer; or |
| • | following the transaction in which the person became an interested stockholder, the business combination is approved by the Board of Directors of the corporation and holders of at least two-thirds of the outstanding voting stock not owned by the interested stockholder. |
Under Section 203, the restrictions described above also do not apply to specific business combinations proposed by an interested stockholder following the announcement or notification of designated extraordinary transactions involving the corporation and a person who had not been an interested stockholder during the previous three years or who became an interested stockholder with the approval of a majority of the corporation’s
109
Table of Contents
directors, if such extraordinary transaction is approved or not opposed by a majority of the directors who were directors prior to any person becoming an interested stockholder during the previous three years or were recommended for election or elected to succeed such directors by a majority of such directors.
Section 203 may make it more difficult for a person who would be an interested stockholder to effect various business combinations with a corporation for a three-year period. Section 203 also may have the effect of preventing changes in our management and could make it more difficult to accomplish transactions which our stockholders may otherwise deem to be in their best interests.
Listing of Common Stock
Our common stock is listed on the NASDAQ Global Market under the symbol “XONE.”
Transfer Agent and Registrar
The transfer agent and registrar for our common stock is American Stock Transfer and Trust Company, LLC.
SHARES ELIGIBLE FOR FUTURE SALE
Immediately following the completion of this offering we will have 14,387,608 shares of common stock outstanding. Of these shares of common stock, the 6,095,000 shares sold in our initial public offering and the 2,656,000 shares of common stock being sold in this offering plus any shares sold upon exercise of the underwriters’ option to purchase additional shares will be freely tradable without restriction under the Securities Act, except for any such shares held or acquired by an “affiliate” of ours, as that term is defined in Rule 144 promulgated under the Securities Act, which shares will be subject to the volume limitations and other restrictions of Rule 144, as described below. The remaining shares of outstanding common stock are “restricted securities,” as that phrase is defined in Rule 144, and may be resold only after registration under the Securities Act or pursuant to an exemption from such registration, including, among others, the exemptions provided by Rules 144 and 701 under the Securities Act, which rules are summarized below. These remaining shares of common stock will be available for sale in the public market after the expiration of the lock-up agreements described below.
Rule 144
In general, a person who has beneficially owned restricted shares of our common stock for at least six months would be entitled to sell their securities provided that (a) we have been a public reporting company under Section 13 or 15(d) of the Exchange Act for at least 90 days before the sale and (b) such person is not, and has not been deemed to have been one of our affiliates at the time of, or at any time during the 90 days preceding, a sale.
Persons who have beneficially owned restricted shares of our common stock for at least six months would be entitled to sell within any three-month period a number of shares of common stock that does not exceed the greater of:
| • | 1.0% of the then outstanding shares of our common stock; or |
| • | the average weekly trading volume during the four calendar weeks preceding the date on which notice of the sale is filed on Form 144; |
provided, in each case, that we are subject to the Exchange Act reporting requirements for at least 90 days before such sale. Such sales by affiliates under Rule 144 are also subject to restrictions relating to the manner of sale, notice requirements and the availability of current public information about us.
110
Table of Contents
Rule 701
Rule 701 of the Securities Act, as currently in effect, permits each of our employees, officers, directors, and consultants, to the extent such persons are not “affiliates” as that term is defined in Rule 144, who purchased or received our shares pursuant to a written compensatory plan or contract, to resell such shares 90 days after the effective date of this prospectus in reliance upon Rule 144, but without compliance with the specific requirements regarding the availability of public information or holding periods thereunder. Rule 701 provides that affiliates who purchased or received shares pursuant to a written compensatory plan or contract are eligible to resell their Rule 701 shares under Rule 144 without complying with the holding period requirement of Rule 144.
Lock-Up Agreements
We and each of our executive officers and directors, the selling stockholders and certain of our significant stockholders have agreed to a “lock-up” from August 30, 2013 and continuing for 90 days from the date of this prospectus relating to shares of our common stock that they beneficially own, including the issuance of common stock upon the exercise of currently outstanding options and options that may be issued. See “Underwriting — Lock-Up Agreements.”
111
Table of Contents
We and the selling stockholders have entered into an underwriting agreement with FBR Capital Markets & Co., as representative of the underwriters named below, with respect to the shares subject to this offering. Subject to the terms and conditions in the underwriting agreement, we have agreed to sell to the underwriters, and each underwriter has agreed to purchase from us on a firm commitment basis, the respective number of shares of our common stock set forth opposite its name in the table below:
| Underwriters |
Number of Shares | |
| FBR Capital Markets & Co. |
||
|
| ||
| Total |
||
|
|
The underwriting agreement provides that the obligation of the underwriters to purchase all of the shares being offered to the public is subject to approval of legal matters by counsel and the satisfaction of other conditions. These conditions include, among others, the continued accuracy of representations and warranties made by us or the underwriting agreement, delivery of legal opinions and the absence of any material changes in our assets, business or prospects after the date of this prospectus. The underwriters are obligated to purchase all of our shares in this offering, other than those covered by the over-allotment option described below, if they purchase any of our shares.
The representatives of the underwriters have advised us that the underwriters propose to offer the common stock directly to the public at the public offering prices listed on the cover page of this prospectus and to selected dealers, who may include the underwriters, at the public offering price less a selling concession not in excess of $ per share for the common stock. After the completion of the offering, the underwriters may change the offering price and other selling terms.
Pursuant to the underwriting agreement, we and the selling stockholders have agreed to indemnify the underwriters against certain liabilities, including liabilities under the Securities Act, or to contribute to payments which the underwriters or other indemnified parties may be required to make in respect of any such liabilities.
Commissions and Expenses
The following table provides information regarding the amount of the underwriting discounts and commissions to be paid to the underwriters by us and the selling stockholders. These amounts are shown assuming both no exercise and full exercise of the underwriters’ option to purchase additional shares to cover over-allotments, if any.
| Total | ||||||||||||
| Per Share | Without Over-Allotment |
With Over-Allotment |
||||||||||
| Underwriting discount paid by us and the selling stockholders |
$ | $ | $ | |||||||||
| Proceeds, before expenses, to us |
$ | $ | $ | |||||||||
| Proceeds, before expenses, to the selling stockholders |
$ | $ | $ | |||||||||
The expenses of the offering (including legal fees and expenses, accounting fees and expenses, SEC filing fees and printing fees, but not including the underwriting discount) are estimated at $ and are payable by us. The selling stockholders will each pay us their pro rata portion of the estimated expenses for the offering. To the extent the actual expenses of the offering exceed estimated expenses, we will bear the additional expense.
112
Table of Contents
Over-Allotment Option
Some of the selling stockholders have granted the underwriters an over-allotment option. This option, which is exercisable for up to 30 days after the date of this prospectus, permits the underwriters to purchase a maximum of 398,400 additional shares from the selling stockholders, to cover over-allotments, if any. If the underwriters exercise all or part of this option, each underwriter will be obligated to purchase its proportionate number of shares covered by the option at the public offering price that appears on the cover page of this prospectus, less the underwriting discount of %.
Lock-Up Agreements
Our executive officers and directors, the selling stockholders and [certain of our significant stockholders] have agreed to a “lock-up” from August 30, 2013 and continuing for 90 days from the date of this prospectus relating to shares of our common stock that they beneficially own, including the issuance of common stock upon the exercise of currently outstanding options and options which may be issued. This means that, from August 30, 2013 and continuing for a period extending for 90 days following the date of this prospectus, such persons may not offer, sell, pledge or otherwise dispose of these securities without the prior written consent of the representatives, subject to certain exceptions.
In addition, the underwriting agreement provides that we will not, for a period of 90 days following the date of this prospectus, offer, sell or distribute any of our securities, without the prior written consent of the underwriters.
NASDAQ Global Market Listing
Our common stock is listed on the NASDAQ Global Market under the symbol “XONE.”
Stabilization
Until the distribution of the securities offered by this prospectus is completed, rules of the SEC may limit the ability of the underwriters to bid for and to purchase our common stock. As an exception to these rules, the underwriters may engage in transactions effected in accordance with Regulation M under the Exchange Act that are intended to stabilize, maintain or otherwise affect the price of our common stock. The underwriters may engage in over-allotment sales, syndicate covering transactions, stabilizing transactions and penalty bids in accordance with Regulation M.
| • | Stabilizing transactions permit bids or purchases for the purpose of pegging, fixing or maintaining the price of the common stock, so long as stabilizing bids do not exceed a specified maximum. |
| • | Over-allotment involves sales by the underwriters of securities in excess of the number of securities the underwriters are obligated to purchase, which creates a short position. The short position may be either a covered short position or a naked short position. In a covered short position, the number of shares of common stock over-allotted by the underwriters is not greater than the number of shares of common stock that they may purchase in the over-allotment option. In a naked short position, the number of shares of common stock involved is greater than the number of shares in the over-allotment option. The underwriters may close out any covered short position by either exercising their over-allotment option or purchasing shares of our common stock in the open market. |
| • | Covering transactions involve the purchase of securities in the open market after the distribution has been completed in order to cover short positions. In determining the source of securities to close out the short position, the underwriters will consider, among other things, the price of securities available for purchase in the open market as compared to the price at which they may purchase securities through the over-allotment option. If the underwriters sell more shares of common stock than could be covered by the over-allotment option, creating a naked short position, the position can only be closed out by buying securities in the open market. A naked short position is more likely to be created if the |
113
Table of Contents
| underwriters are concerned that there could be downward pressure on the price of the securities in the open market after pricing that could adversely affect investors who purchase in this offering. |
| • | Penalty bids permit the underwriters to reclaim a selling concession from a selected dealer when the securities originally sold by the selected dealer are purchased in a stabilizing or syndicate covering transaction. |
These stabilizing transactions, covering transactions and penalty bids may have the effect of raising or maintaining the market price of our securities or preventing or retarding a decline in the market price of our common stock. As a result, the price of our securities may be higher than the price that might otherwise exist in the open market.
Neither we nor the underwriters make any representation or prediction as to the effect that the transactions described above may have on the prices of our securities. These transactions may occur on any trading market. If any of these transactions are commenced, they may be discontinued without notice at any time.
This prospectus may be made available in electronic format on Internet sites or through other online services maintained by the underwriters or their affiliates. In those cases, prospective investors may view offering terms online and may be allowed to place orders online. Other than this prospectus in electronic format, any information on the underwriters’ or their affiliates’ websites and any information contained in any other website maintained by the underwriters or any affiliate of the underwriters is not part of this prospectus or the registration statement of which this prospectus forms a part, has not been approved and/or endorsed by us or the underwriters and should not be relied upon by investors.
Notice to Prospective Investors in the EEA
In relation to each Member State of the European Economic Area (EEA) which has implemented the Prospectus Directive (each, a “Relevant Member State”) an offer to the public of any shares which are the subject of the offering contemplated by this prospectus may not be made in that Relevant Member State, except that an offer to the public in that Relevant Member State of any shares may be made at any time under the following exemptions under the Prospectus Directive, if they have been implemented in that Relevant Member State:
| (a) | to legal entities which are authorized or regulated to operate in the financial markets or, if not so authorized or regulated, whose corporate purpose is solely to invest in securities; |
| (b) | to any legal entity which has two or more of (1) an average of at least 250 employees during the last financial year; (2) a total balance sheet of more than €43,000,000 and (3) an annual net turnover of more than €50,000,000, as shown in its last annual or consolidated accounts; |
| (c) | by the underwriters to fewer than 100 natural or legal persons (other than “qualified investors” as defined in the Prospectus Directive) subject to obtaining the prior consent of the representatives for any such offer; or |
| (d) | in any other circumstances falling within Article 3(2) of the Prospectus Directive; |
provided that no such offer of shares shall result in a requirement for the publication by us or any representative of a prospectus pursuant to Article 3 of the Prospectus Directive.
Any person making or intending to make any offer of shares within the EEA should only do so in circumstances in which no obligation arises for us or any of the underwriters to produce a prospectus for such offer. Neither we nor the underwriters have authorized, nor do they authorize, the making of any offer of shares through any financial intermediary, other than offers made by the underwriters which constitute the final offering of shares contemplated in this prospectus.
For the purposes of this provision, and your representation below, the expression an “offer to the public” in relation to any shares in any Relevant Member State means the communication in any form and by any means of
114
Table of Contents
sufficient information on the terms of the offer and any shares to be offered so as to enable an investor to decide to purchase any shares, as the same may be varied in that Relevant Member State by any measure implementing the Prospectus Directive in that Relevant Member State and the expression “Prospectus Directive” means Directive 2003/71/EC and includes any relevant implementing measure in each Relevant Member State.
Each person in a Relevant Member State who receives any communication in respect of, or who acquires any shares under, the offer of shares contemplated by this prospectus will be deemed to have represented, warranted and agreed to and with us and each underwriter that:
| (A) | it is a “qualified investor” within the meaning of the law in that Relevant Member State implementing Article 2(1)(e) of the Prospectus Directive; and |
| (B) | in the case of any shares acquired by it as a financial intermediary, as that term is used in Article 3(2) of the Prospectus Directive, (i) the shares acquired by it in the offering have not been acquired on behalf of, nor have they been acquired with a view to their offer or resale to, persons in any Relevant Member State other than “qualified investors” (as defined in the Prospectus Directive), or in circumstances in which the prior consent of the representatives has been given to the offer or resale; or (ii) where shares have been acquired by it on behalf of persons in any Relevant Member State other than qualified investors, the offer of those shares to it is not treated under the Prospectus Directive as having been made to such persons. |
In addition, in the United Kingdom, this document is being distributed only to, and is directed only at, and any offer subsequently made may only be directed at persons who are “qualified investors” (as defined in the Prospectus Directive) (i) who have professional experience in matters relating to investments falling within Article 19 (5) of the Financial Services and Markets Act 2000 (Financial Promotion) Order 2005, as amended (the “Order”) and/or (ii) who are high net worth companies (or persons to whom it may otherwise be lawfully communicated) falling within Article 49(2)(a) to (d) of the Order (all such persons together being referred to as “relevant persons”). This document must not be acted on or relied on in the United Kingdom by persons who are not relevant persons. In the United Kingdom, any investment or investment activity to which this document relates is only available to, and will be engaged in with, relevant persons.
Notice to Prospective Investors in the United Kingdom
This prospectus is only being distributed to and is only directed at persons in the United Kingdom that are qualified investors within the meaning of Article 2(1)(e) of the Prospectus Directive that are also (i) investment professionals falling within Article 19(5) of the Financial Services and Markets Act 2000 (Financial Promotion) Order 2005, or the Order, and/or (ii) high net worth entities, and other persons to whom it may lawfully be communicated, falling with Article 49(2)(a) to (d) of the Order (all such persons together being referred to as “relevant persons”).
This prospectus and its contents are confidential and should not be distributed, published or reproduced (in whole or in part) or disclosed by recipients to any other persons in the United Kingdom. Any person in the United Kingdom who is not a relevant person should not act or rely on this document or any of its contents.
Each underwriter has represented, warranted and agreed that:
(A) it has only communicated or caused to be communicated and will only communicate or cause to be communicated an invitation or inducement to engage in investment activity (within the meaning of Section 21 of the Financial Services and Markets Act 2000, as amended, or the FSMA) received by it in connection with the issue or sale of the Shares in circumstances in which Section 21(1) of the FSMA does not apply to us; and
(B) it has complied and will comply with all applicable provisions of the FSMA with respect to anything done by it in relation to the shares of our common stock in, from or otherwise involving the United Kingdom.
115
Table of Contents
Notice to Prospective Investors in Germany
Any offer or solicitation of securities within Germany must be in full compliance with the German Securities Prospectus Act (Wertpapierprospektgesetz — WpPG). The offer and solicitation of securities to the public in Germany requires the publication of a prospectus that has to be filed with and approved by the German Federal Financial Services Supervisory Authority (Bundesanstalt für Finanzdienstleistungsaufsicht — BaFin). This prospectus has not been and will not be submitted for filing and approval to the BaFin and, consequently, will not be published. Therefore, this prospectus does not constitute a public offer under the German Securities Prospectus Act (Wertpapierprospektgesetz). This prospectus and any other document relating to our common stock, as well as any information contained therein, must therefore not be supplied to the public in Germany or used in connection with any offer for subscription of our common stock to the public in Germany, any public marketing of our common stock or any public solicitation for offers to subscribe for or otherwise acquire our common stock. This prospectus and other offering materials relating to the offer of our common stock are strictly confidential and may not be distributed to any person or entity other than the designated recipients hereof.
Notice to Prospective Investors in Switzerland
This document, as well as any other material relating to the shares which are the subject of the offering contemplated by this prospectus, do not constitute an issue prospectus pursuant to Article 652a and/or 1156 of the Swiss Code of Obligations. The shares will not be listed on the SIX Swiss Exchange and, therefore, the documents relating to the shares, including, but not limited to, this document, do not claim to comply with the disclosure standards of the listing rules of SIX Swiss Exchange and corresponding prospectus schemes annexed to the listing rules of the SIX Swiss Exchange. The shares are being offered in Switzerland by way of a private placement, i.e., to a small number of selected investors only, without any public offer and only to investors who do not purchase the shares with the intention to distribute them to the public. The investors will be individually approached by the issuer from time to time. This document, as well as any other material relating to the shares, is personal and confidential and do not constitute an offer to any other person. This document may only be used by those investors to whom it has been handed out in connection with the offering described herein and may neither directly nor indirectly be distributed or made available to other persons without express consent of the issuer. It may not be used in connection with any other offer and shall in particular not be copied and/or distributed to the public in (or from) Switzerland.
116
Table of Contents
U.S. FEDERAL INCOME TAX CONSIDERATIONS FOR NON-U.S. HOLDERS
The following is a summary of material U.S. federal income tax consequences of the purchase, ownership and disposition of our common stock to a non-U.S. holder that purchases shares of our common stock in this offering. For purposes of this summary, a “non-U.S. holder” means a beneficial owner of our common stock that is, for U.S. federal income tax purposes:
| • | a nonresident alien individual; |
| • | a foreign corporation (or entity treated as a foreign corporation for U.S. federal income tax purposes); or |
| • | a foreign estate or foreign trust. |
In the case of a holder that is classified as a partnership for U.S. federal income tax purposes, the tax treatment of a partner in such partnership generally will depend upon the status of the partner and the activities of the partner and the partnership. If you are a partner in a partnership holding our common stock, then you should consult your own tax advisor.
This summary is based upon the provisions of the U.S. Internal Revenue Code of 1986, as amended, which we refer to as the Code, the Treasury regulations promulgated thereunder and administrative and judicial interpretations thereof, all as of the date hereof. Those authorities may be changed, perhaps retroactively, so as to result in U.S. federal income tax consequences different from those summarized below. We cannot assure you that a change in law, possibly with retroactive application, will not alter significantly the tax considerations that we describe in this summary. We have not sought and do not plan to seek any ruling from the U.S. Internal Revenue Service, which we refer to as the IRS, with respect to statements made and the conclusions reached in the following summary, and there can be no assurance that the IRS or a court will agree with our statements and conclusions.
This summary does not address all aspects of U.S. federal income taxes that may be relevant to non-U.S. holders in light of their personal circumstances, and does not deal with federal taxes other than the U.S. federal income tax including U.S. federal gift and estate taxes, except as to the limited extent set forth below, or with non-U.S., state or local tax considerations. Special rules, not discussed here, may apply to certain non-U.S. holders, including:
| • | U.S. expatriates; |
| • | former citizens or long-term residents of the United States; |
| • | controlled foreign corporations; |
| • | passive foreign investment companies; and |
| • | investors in pass-through entities that are subject to special treatment under the Code. |
Such non-U.S. holders should consult their own tax advisors to determine the U.S. federal, state, local and other tax consequences that may be relevant to them.
This summary applies only to a non-U.S. holder that holds our common stock as a capital asset (within the meaning of Section 1221 of the Code).
If you are considering the purchase of our common stock, you should consult your own tax advisor concerning the particular U.S. federal income tax consequences to you of the purchase, ownership and disposition of our common stock, as well as the consequences to you arising under U.S. tax laws other than the federal income tax law or under the laws of any other taxing jurisdiction.
117
Table of Contents
Dividends
As described in “Dividend Policy” above, we do not currently anticipate paying dividends. In the event that we do make a distribution of cash or property (other than certain stock distributions) with respect to our common stock (or certain redemptions that are treated as distributions with respect to common stock), any such distributions will be treated as a dividend for U.S. federal income tax purposes to the extent paid from our current or accumulated earnings and profits (as determined under U.S. federal income tax principles). Dividends paid to you generally will be subject to withholding of U.S. federal income tax at a 30% rate or such lower rate as may be specified by an applicable income tax treaty.
However, dividends that are effectively connected with the conduct of a trade or business by you within the United States and, where a tax treaty applies, are generally attributable to a United States permanent establishment, are not subject to the withholding tax, but instead are subject to United States federal income tax on a net income basis at applicable graduated individual or corporate ordinary income tax rates. Certain certification and disclosure requirements, including delivery to the withholding agent of a properly executed IRS Form W-8ECI (or other applicable form), must be satisfied for effectively connected income to be exempt from withholding. Any such dividends received by a foreign corporation that are effectively connected with its conduct of a trade or business within the United States may be subject to an additional “branch profits tax” at a 30% rate or such lower rate as may be specified by an applicable income tax treaty.
If the amount of a distribution paid on our common stock exceeds our current and accumulated earnings and profits, such excess will be allocated ratably among each share of common stock with respect to which the distribution is paid and treated first as a tax-free return of capital to the extent of your adjusted tax basis in each such share, and thereafter as capital gain from a sale or other disposition of such share of common stock that is taxed to you as described below in “ — Gain on Disposition of Common Stock.” Your adjusted tax basis is generally the purchase price of such shares, reduced by the amount of any such tax-free returns of capital.
If you wish to claim the benefit of an applicable treaty rate to avoid or reduce withholding of U.S. federal income tax for dividends, then you must (a) provide the withholding agent with a properly completed IRS Form W-8BEN (or other applicable form) and certify under penalties of perjury that you are not a U.S. person and are eligible for treaty benefits, or (b) if our common stock is held through certain foreign intermediaries, satisfy the relevant certification requirements of applicable U.S. Treasury regulations. Special certification and other requirements apply to certain non-U.S. holders that act as intermediaries (including partnerships).
If you are eligible for a reduced rate of U.S. federal income tax pursuant to an income tax treaty, then you may obtain a refund or credit of any excess amounts withheld by filing timely an appropriate claim with the IRS.
Gain on Disposition of Common Stock
You generally will not be subject to U.S. federal income tax with respect to gain realized on the sale or other taxable disposition of our common stock, unless:
| • | the gain is effectively connected with a trade or business you conduct in the United States, and, in cases in which certain tax treaties apply, is attributable to a United States permanent establishment; |
| • | you are an individual and you are present in the United States for 183 days or more in the taxable year of the sale or other taxable disposition, and certain other conditions are met; or |
| • | we are or have been during a specified testing period a “U.S. real property holding corporation” for U.S. federal income tax purposes, and certain other conditions are met. |
If you are an individual described in the first bullet point above, you will be subject to tax on the net gain derived from the sale under regular graduated United States federal income tax rates or such lower rate as specified by an applicable income tax treaty. If you are an individual described in the second bullet point above,
118
Table of Contents
you will be subject to a flat 30% tax on the gain derived from the sale, which may be offset by United States source capital losses (even though the individual is not considered a resident of the United States). If you are a foreign corporation described in the first bullet point above, you will be subject to tax on your gain under regular graduated United States federal income tax rates and, in addition, may be subject to the branch profits tax equal to 30% of your effectively connected earnings and profits or at such lower rate as may be specified by an applicable income tax treaty.
Generally, we will be a “United States real property holding corporation” if the fair market value of our U.S. real property interests equals or exceeds 50% of the sum of the fair market values of our worldwide real property interests and other assets used or held for use in a trade or business, all as determined under applicable U.S. Treasury regulations. We believe that we have not been and are not a “U.S. real property holding corporation” for U.S. federal income tax purposes. Although we do not anticipate it based on our current business plans and operations, we may become a “U.S. real property holding corporation” in the future. If we have been or were to become a “U.S. real property holding corporation,” you might be subject to U.S. federal income tax (but not the branch profits tax) with respect to gain realized on the disposition of our common stock. However, such gain would not be subject to U.S. federal income or withholding tax if (1) our common stock is regularly traded on an established securities market and (2) in disposing of our common stock you did not own, actually or constructively, at any time during the five-year period preceding the disposition, more than 5% of the value of our common stock.
The estates of nonresident alien individuals generally are subject to U.S. federal estate tax on property with a U.S. situs. Because we are a U.S. corporation, our common stock will be U.S. situs property and therefore will be included in the taxable estate of a nonresident alien decedent, unless an applicable estate tax treaty between the United States and the decedent’s country of residence provides otherwise.
Information Reporting and Backup Withholding Tax
We must report annually to the IRS and to you the amount of dividends paid to you and the amount of tax, if any, withheld with respect to such dividends. The IRS may make this information available to the tax authorities in the country in which you are resident.
In addition, you may be subject to information reporting requirements and backup withholding tax (currently at a rate of 28%) with respect to dividends paid on, and the proceeds of disposition of, shares of our common stock, unless, generally, you certify under penalties of perjury (usually on IRS Form W-8BEN) that you are not a U.S. person or you otherwise establish an exemption. Additional rules relating to information reporting requirements and backup withholding tax with respect to payments of the proceeds from the disposition of shares of our common stock are as follows:
| • | If the proceeds are paid to or through the U.S. office of a broker, the proceeds generally will be subject to backup withholding tax and information reporting, unless you certify under penalties of perjury (usually on IRS Form W-8BEN) that you are not a U.S. person or you otherwise establish an exemption. |
| • | If the proceeds are paid to or through a non-U.S. office of a broker that is not a U.S. person and is not a foreign person with certain specified U.S. connections, or a U.S.-related person, information reporting and backup withholding tax generally will not apply. |
| • | If the proceeds are paid to or through a non-U.S. office of a broker that is a U.S. person or a U.S.-related person, the proceeds generally will be subject to information reporting (but not to backup withholding tax), unless you certify under penalties of perjury (usually on IRS Form W-8BEN) that you are not a U.S. person. |
Any amounts withheld under the backup withholding tax rules may be allowed as a refund or a credit against your U.S. federal income tax liability, provided the required information is timely furnished by you to the IRS.
119
Table of Contents
Foreign Accounts
Recent legislation and administrative guidance generally imposes withholding taxes on certain types of payments made to “foreign financial institutions” and certain other non-U.S. entities. The legislation imposes a 30% withholding tax on dividends on, or gross proceeds from the sale or other disposition of, our common stock paid to a foreign financial institution unless the foreign financial institution enters into an agreement with the U.S. Treasury to, among other things, undertake to identify accounts held by certain U.S. persons (including certain equity and debt holders of such institutions) or U.S.-owned foreign entities, annually report certain information about such accounts, and withhold 30% on payments to account holders whose actions prevent it from complying with these reporting and other requirements. In addition, the legislation imposes a 30% withholding tax on the same types of payments to a foreign non-financial entity unless the entity certifies that it does not have any substantial U.S. owners (which generally includes any U.S. person who directly or indirectly own more than 10% of the entity) or furnishes identifying information regarding each substantial U.S. owner. These withholding requirements are expected to be phased in for dividend payments made on or after July 1, 2014 and for payments of gross proceeds from sales or other dispositions of U.S. common stock made on or after December 31, 2016. Under certain circumstances, a non-U.S. holder of our common stock might be eligible for refunds or credits of such taxes, and a non-U.S. holder might be required to file a United States federal income tax return to claim such refunds or credits. Prospective purchasers of our common stock should consult their tax advisors regarding this legislation.
THE SUMMARY OF MATERIAL U.S. FEDERAL INCOME TAX CONSEQUENCES ABOVE IS INCLUDED FOR GENERAL INFORMATION PURPOSES ONLY. PROSPECTIVE PURCHASERS OF OUR COMMON STOCK ARE URGED TO CONSULT THEIR OWN TAX ADVISORS TO DETERMINE THE U.S. FEDERAL, STATE, LOCAL AND NON-U.S. TAX CONSIDERATIONS OF PURCHASING, OWNING AND DISPOSING OF OUR COMMON STOCK.
Certain legal matters in connection with this offering will be passed upon for us by Buchanan Ingersoll & Rooney PC, Pittsburgh, Pennsylvania. Nelson Mullins Riley & Scarborough LLP, Washington, D.C., will pass upon certain legal matters for the underwriters.
The consolidated balance sheets as of December 31, 2012 and 2011, and the consolidated statements of operations and comprehensive loss, changes in members’ deficit, and cash flows for each of the three years in the period ended December 31, 2012 have been included herein in reliance on the reports of ParenteBeard LLC, independent registered public accountants, given on the authority of that firm as experts in auditing and accounting.
WHERE YOU CAN FIND MORE INFORMATION
We are subject to the information and reporting requirements of the Securities Exchange Act of 1934, as amended, and file annual, quarterly and current reports, proxy statements and other information with the SEC. You may read and copy these reports, proxy statements and other information at the public reference facilities of the Securities and Exchange Commission, or SEC, at 100 F Street, N.E., Room 1580, Washington, D.C. 20549. You can request copies of these documents by writing to the SEC and paying a fee for the copying cost. Please call the SEC at 1-800-SEC-0330 for more information about the operation of the public reference facilities. SEC filings are also available at the SEC’s website at http://www.sec.gov.
120
Table of Contents
We have filed with the SEC a registration statement, of which this prospectus is a part, covering the securities offered hereby. As allowed by SEC rules, this prospectus does not include all of the information contained in the registration statement and the included exhibits and schedules. You are referred to the registration statement, the included exhibits and schedules for further information. This prospectus is qualified in its entirety by such other information.
We also maintain a website at www.exone.com, through which you can access our filings with the SEC. The information set forth on or accessible from our website is not part of this prospectus. We have included our website address in this prospectus solely as an inactive textual reference.
121
Table of Contents
The ExOne Company and Subsidiaries (formerly The Ex One Company, LLC and Subsidiaries)
Index to Financial Information
F-1
Table of Contents
The ExOne Company and Subsidiaries (formerly The Ex One Company, LLC and Subsidiaries)
Report of Independent Registered Public Accounting Firm
Board of Directors and Stockholders
The ExOne Company (formerly The Ex One Company, LLC and Subsidiaries)
We have audited the accompanying consolidated balance sheets of The Ex One Company, LLC and Subsidiaries (the “Company”) as of December 31, 2012 and 2011, and the related consolidated statements of operations and comprehensive loss, members’ equity (deficit), and cash flows for the each of the years in the three-year period ended December 31, 2012. These consolidated financial statements are the responsibility of the entity’s management. Our responsibility is to express an opinion on these consolidated financial statements based on our audits.
We conducted our audits in accordance with the standards of the Public Company Accounting Oversight Board (United States). Those standards require that we plan and perform the audit to obtain reasonable assurance about whether the consolidated financial statements are free of material misstatement. An audit includes examining, on a test basis, evidence supporting the amounts and disclosures in the consolidated financial statements. An audit also includes assessing the accounting principles used and significant estimates made by management, as well as evaluating the overall financial statement presentation. We believe that our audits provide a reasonable basis for our opinion.
In our opinion, the consolidated financial statements referred to above present fairly, in all material respects, the financial position of The Ex One Company, LLC and Subsidiaries as of December 31, 2012 and 2011, and the results of their operations and their cash flows for each of the years in the three-year period ended December 31, 2012, in conformity with accounting principles generally accepted in the United States of America.
As disclosed in Note 1 to the consolidated financial statements, the Company reorganized as The ExOne Company on January 1, 2013 and completed an initial public offering of the Company’s common stock on February 12, 2013.
/s/ ParenteBeard LLC
Pittsburgh, Pennsylvania
March 29, 2013
F-2
Table of Contents
The ExOne Company and Subsidiaries (formerly The Ex One Company, LLC and Subsidiaries)
Statement of Consolidated Operations and Comprehensive Loss
(in thousands, except per-unit amounts)
| For the years ended December 31, |
2012 | 2011 | 2010 | |||||||||
| Revenue |
$ | 28,657 | $ | 15,290 | $ | 13,440 | ||||||
| Cost of sales |
16,514 | 11,647 | 10,374 | |||||||||
|
|
|
|
|
|
|
|||||||
| Gross profit |
12,143 | 3,643 | 3,066 | |||||||||
| Operating expenses |
||||||||||||
| Research and development |
1,930 | 1,531 | 1,153 | |||||||||
| Selling, general and administrative (Note 12) |
18,285 | 7,286 | 5,978 | |||||||||
|
|
|
|
|
|
|
|||||||
| 20,215 | 8,817 | 7,131 | ||||||||||
|
|
|
|
|
|
|
|||||||
| Loss from operations |
(8,072 | ) | (5,174 | ) | (4,065 | ) | ||||||
| Other (income) expense |
||||||||||||
| Interest expense |
842 | 1,570 | 1,114 | |||||||||
| Other (income) expense — net |
(221 | ) | (158 | ) | (197 | ) | ||||||
|
|
|
|
|
|
|
|||||||
| 621 | 1,412 | 917 | ||||||||||
|
|
|
|
|
|
|
|||||||
| Loss before income taxes |
(8,693 | ) | (6,586 | ) | (4,982 | ) | ||||||
| Provision for income taxes (Note 15) |
995 | 1,031 | 198 | |||||||||
|
|
|
|
|
|
|
|||||||
| Net loss |
(9,688 | ) | (7,617 | ) | (5,180 | ) | ||||||
| Less: Net income attributable to noncontrolling interests |
480 | 420 | 328 | |||||||||
|
|
|
|
|
|
|
|||||||
| Net loss attributable to ExOne |
$ | (10,168 | ) | $ | (8,037 | ) | $ | (5,508 | ) | |||
|
|
|
|
|
|
|
|||||||
| Net loss attributable to ExOne per common unit (Note 2): |
||||||||||||
| Basic |
$ | (1.16 | ) | $ | (0.80 | ) | $ | (0.55 | ) | |||
| Diluted |
$ | (1.16 | ) | $ | (0.80 | ) | $ | (0.55 | ) | |||
| Comprehensive loss: |
||||||||||||
| Net loss attributable to ExOne |
$ | (10,168 | ) | $ | (8,037 | ) | $ | (5,508 | ) | |||
| Other comprehensive income (loss): |
||||||||||||
| Foreign currency translation adjustments |
46 | (107 | ) | (144 | ) | |||||||
|
|
|
|
|
|
|
|||||||
| Comprehensive loss |
(10,122 | ) | (8,144 | ) | (5,652 | ) | ||||||
| Less: Comprehensive loss attributable to noncontrolling interests |
— | — | — | |||||||||
|
|
|
|
|
|
|
|||||||
| Comprehensive loss attributable to ExOne |
$ | (10,122 | ) | $ | (8,144 | ) | $ | (5,652 | ) | |||
|
|
|
|
|
|
|
|||||||
The accompanying notes are an integral part of these consolidated financial statements.
F-3
Table of Contents
The ExOne Company and Subsidiaries (formerly The Ex One Company, LLC and Subsidiaries)
(in thousands, except per-unit and unit amounts)
| December 31, |
2012 | 2011 | ||||||
| Assets |
||||||||
| Current assets: |
||||||||
| Cash and cash equivalents |
$ | 2,802 | $ | 3,496 | ||||
| Accounts receivable — net |
8,413 | 1,335 | ||||||
| Inventories — net (Note 3) |
7,485 | 4,431 | ||||||
| Prepaid expenses and other current assets (Note 4) |
1,543 | 854 | ||||||
|
|
|
|
|
|||||
| Total current assets |
20,243 | 10,116 | ||||||
| Property and equipment — net (Note 5) |
12,467 | 7,919 | ||||||
| (Including amounts attributable to consolidated variable interest entities of $5,567 and $5,798 at December 31, 2012 and 2011, respectively) |
||||||||
| Deferred income taxes (Note 15) |
178 | 374 | ||||||
| Other noncurrent assets (Note 4) |
187 | 206 | ||||||
|
|
|
|
|
|||||
| Total assets |
$ | 33,075 | $ | 18,615 | ||||
|
|
|
|
|
|||||
| Liabilities |
||||||||
| Current liabilities: |
||||||||
| Line of credit (Note 7) |
$ | 528 | $ | — | ||||
| Demand note payable to member (Note 8) |
8,666 | — | ||||||
| Current portion of long-term debt (Note 9) |
2,028 | 1,294 | ||||||
| (Including amounts attributable to consolidated variable interest entities of $1,913 and $1,294 at December 31, 2012 and 2011, respectively) |
||||||||
| Current portion of financing leases (Note 10) |
920 | — | ||||||
| Accounts payable |
2,451 | 864 | ||||||
| Accrued expenses and other current liabilities (Note 6) |
4,436 | 3,625 | ||||||
| Preferred unit dividends payable |
1,437 | — | ||||||
| Deferred income taxes (Note 15) |
178 | 374 | ||||||
| Deferred revenue and customer prepayments |
4,281 | 4,938 | ||||||
|
|
|
|
|
|||||
| Total current liabilities |
24,925 | 11,095 | ||||||
| Long-term debt — net of current portion (Note 9) |
5,669 | 4,135 | ||||||
| (Including amounts attributable to consolidated variable interest entities of $3,150 and $4,135 at December 31, 2012 and 2011, respectively) |
||||||||
| Financing leases — net of current portion (Note 10) |
1,949 | — | ||||||
| Redeemable preferred units (Note 11) |
— | 18,984 | ||||||
| Other noncurrent liabilities (Note 6) |
491 | — | ||||||
|
|
|
|
|
|||||
| Total liabilities |
33,034 | 34,214 | ||||||
| Commitments and contingencies (Note 14) |
||||||||
| Members’ equity (deficit) |
||||||||
| ExOne members’ deficit: |
||||||||
| Preferred units, $1.00 par value, 18,983,602 issued and outstanding (Note 11) |
18,984 | — | ||||||
| Common units, $1.00 par value, 10,000,000 issued and outstanding (Note 11) |
10,000 | 10,000 | ||||||
| Members’ deficit |
(31,355 | ) | (27,485 | ) | ||||
| Accumulated other comprehensive loss |
(174 | ) | (220 | ) | ||||
|
|
|
|
|
|||||
| Total ExOne members’ deficit |
(2,545 | ) | (17,705 | ) | ||||
| Noncontrolling interests |
2,586 | 2,106 | ||||||
|
|
|
|
|
|||||
| Total members’ equity (deficit) |
41 | (15,599 | ) | |||||
|
|
|
|
|
|||||
| Total liabilities and members’ equity (deficit) |
$ | 33,075 | $ | 18,615 | ||||
|
|
|
|
|
|||||
The accompanying notes are an integral part of these consolidated financial statements.
F-4
Table of Contents
The ExOne Company and Subsidiaries (formerly The Ex One Company, LLC and Subsidiaries)
Statement of Consolidated Cash Flows
(in thousands)
| For the years ended December 31, |
2012 | 2011 | 2010 | |||||||||
| Operating activities |
||||||||||||
| Net loss |
$ | (9,688 | ) | $ | (7,617 | ) | $ | (5,180 | ) | |||
| Adjustments to reconcile net loss to cash used for operations: |
||||||||||||
| Depreciation (Note 5) |
1,683 | 1,170 | 1,072 | |||||||||
| Equity-based compensation (Note 12) |
7,735 | — | — | |||||||||
| Changes in assets and liabilities, excluding effects of foreign currency translation adjustments: |
||||||||||||
| (Increase) decrease in accounts receivable |
(7,077 | ) | 1,240 | (1,662 | ) | |||||||
| (Increase) decrease in inventories |
(4,825 | ) | (1,368 | ) | 614 | |||||||
| (Increase) decrease in prepaid expenses and other assets |
(330 | ) | (438 | ) | 293 | |||||||
| Increase (decrease) in accounts payable |
1,575 | (213 | ) | (386 | ) | |||||||
| Increase (decrease) in accrued expenses and other liabilities |
1,528 | 951 | (125 | ) | ||||||||
| Increase (decrease) in deferred revenue and customer prepayments |
(404 | ) | 3,839 | (538 | ) | |||||||
|
|
|
|
|
|
|
|||||||
| Cash used for operating activities |
(9,803 | ) | (2,436 | ) | (5,912 | ) | ||||||
| Investing activities |
||||||||||||
| Capital expenditures |
(1,724 | ) | (1,080 | ) | (1,795 | ) | ||||||
|
|
|
|
|
|
|
|||||||
| Cash used for investing activities |
(1,724 | ) | (1,080 | ) | (1,795 | ) | ||||||
| Financing activities |
||||||||||||
| Net change in line of credit borrowings (Note 7) |
528 | — | — | |||||||||
| Net change in demand note payable to member (Note 8) |
8,629 | 3,939 | 12,290 | |||||||||
| Proceeds from long-term debt (Note 9) |
1,194 | 2,398 | — | |||||||||
| Proceeds from financing leases (Note 10) |
3,513 | — | — | |||||||||
| Payments on long-term debt (Note 9) |
(1,626 | ) | (808 | ) | (4,479 | ) | ||||||
| Payments on financing leases (Note 10) |
(437 | ) | — | — | ||||||||
| Deferred offering costs (Note 4) |
(720 | ) | — | — | ||||||||
| Deferred financing costs |
(78 | ) | — | — | ||||||||
| Contribution from noncontrolling interests |
— | 402 | — | |||||||||
|
|
|
|
|
|
|
|||||||
| Cash provided by financing activities |
11,003 | 5,931 | 7,811 | |||||||||
| Effect of exchange rate changes on cash and cash equivalents |
(170 | ) | 60 | 273 | ||||||||
|
|
|
|
|
|
|
|||||||
| Net change in cash and cash equivalents |
(694 | ) | 2,475 | 377 | ||||||||
| Cash and cash equivalents at beginning of year |
3,496 | 1,021 | 644 | |||||||||
|
|
|
|
|
|
|
|||||||
| Cash and cash equivalents at end of year |
$ | 2,802 | $ | 3,496 | $ | 1,021 | ||||||
|
|
|
|
|
|
|
|||||||
| Supplemental disclosure of cash flow information |
||||||||||||
| Cash paid for interest |
$ | 407 | $ | 174 | $ | 244 | ||||||
|
|
|
|
|
|
|
|||||||
| Cash paid for income taxes |
$ | 1,354 | $ | — | $ | — | ||||||
|
|
|
|
|
|
|
|||||||
| Supplemental disclosure of noncash investing and financing activities |
||||||||||||
| Property and equipment acquired through financing arrangements |
$ | 2,700 | $ | — | $ | — | ||||||
|
|
|
|
|
|
|
|||||||
| Transfer of inventories to property and equipment for internal use |
$ | 2,001 | $ | — | $ | — | ||||||
|
|
|
|
|
|
|
|||||||
| Transfer of property and equipment to inventories for sale |
$ | (202 | ) | $ | — | $ | — | |||||
|
|
|
|
|
|
|
|||||||
| Reclassification of redeemable preferred units to preferred units (Note 11) |
$ | 18,984 | $ | — | $ | — | ||||||
|
|
|
|
|
|
|
|||||||
| Conversion of demand note payable to member to redeemable preferred units (Note 11) |
$ | — | $ | 18,984 | $ | — | ||||||
|
|
|
|
|
|
|
|||||||
| Preferred unit dividends declared but unpaid |
$ | 1,437 | $ | — | $ | — | ||||||
|
|
|
|
|
|
|
|||||||
The accompanying notes are an integral part of these consolidated financial statements.
F-5
Table of Contents
The ExOne Company and Subsidiaries (formerly The Ex One Company, LLC and Subsidiaries)
Statement of Changes in Consolidated Members’ Equity (Deficit)
(in thousands)
| ExOne unitholders | ||||||||||||||||||||||||
| Preferred units |
Common units |
Members’ deficit |
Accumulated other comprehensive income (loss) |
Noncontrolling interests |
Total members’ equity (deficit) |
|||||||||||||||||||
| Balance at December 31, 2009 |
$ | — | $ | 10,000 | $ | (13,940 | ) | $ | 31 | $ | 956 | $ | (2,953 | ) | ||||||||||
| Net (loss) income |
— | — | (5,508 | ) | — | 328 | (5,180 | ) | ||||||||||||||||
| Other comprehensive loss |
— | — | — | (144 | ) | — | (144 | ) | ||||||||||||||||
|
|
|
|
|
|
|
|
|
|
|
|
|
|||||||||||||
| Balance at December 31, 2010 |
— | 10,000 | (19,448 | ) | (113 | ) | 1,284 | (8,277 | ) | |||||||||||||||
| Net (loss) income |
— | — | (8,037 | ) | — | 420 | (7,617 | ) | ||||||||||||||||
| Other comprehensive loss |
— | — | — | (107 | ) | — | (107 | ) | ||||||||||||||||
| Contribution from noncontrolling interests |
— | — | — | — | 402 | 402 | ||||||||||||||||||
|
|
|
|
|
|
|
|
|
|
|
|
|
|||||||||||||
| Balance at December 31, 2011 |
— | 10,000 | (27,485 | ) | (220 | ) | 2,106 | (15,599 | ) | |||||||||||||||
| Net (loss) income |
— | — | (10,168 | ) | — | 480 | (9,688 | ) | ||||||||||||||||
| Other comprehensive income |
— | — | — | 46 | — | 46 | ||||||||||||||||||
| Equity-based compensation (Note 12) |
— | — | 7,735 | — | — | 7,735 | ||||||||||||||||||
| Preferred unit reclassification (Note 11) |
18,984 | — | — | — | — | 18,984 | ||||||||||||||||||
| Preferred unit dividends |
— | — | (1,437 | ) | — | — | (1,437 | ) | ||||||||||||||||
|
|
|
|
|
|
|
|
|
|
|
|
|
|||||||||||||
| Balance at December 31, 2012 |
$ | 18,984 | $ | 10,000 | $ | (31,355 | ) | $ (174) | $ | 2,586 | $ | 41 | ||||||||||||
|
|
|
|
|
|
|
|
|
|
|
|
|
|||||||||||||
The accompanying notes are an integral part of these consolidated financial statements.
F-6
Table of Contents
The ExOne Company and Subsidiaries (formerly The Ex One Company, LLC and Subsidiaries)
Notes to the Consolidated Financial Statements
(dollars in thousands, except per-unit, unit and share amounts)
Note 1. Summary of Significant Accounting Policies
Basis of Presentation and Principles of Consolidation
The ExOne Company and Subsidiaries (ExOne), formerly The Ex One Company, LLC, is a corporation organized under the laws of the state of Delaware. Refer to Note 19 for description of the reorganization of The Ex One Company, LLC to The ExOne Company effective January 1, 2013. The consolidated financial statements include the accounts of ExOne, its wholly-owned subsidiaries, ExOne Americas LLC (United States), ExOne GmbH (Germany) and Ex One KK (Japan), and two variable interest entities in which ExOne is the primary beneficiary, Lone Star Metal Fabrication, LLC (Lone Star) and Troy Metal Fabricating, LLC (TMF). Collectively, the consolidated group is referred to as “the Company.”
At December 31, 2012 and 2011, ExOne leased property and equipment from Lone Star and TMF. ExOne does not have an ownership interest in Lone Star or TMF. ExOne is the primary beneficiary of Lone Star and TMF in accordance with the guidance issued by the Financial Accounting Standards Board (FASB) on the consolidation of variable interest entities (VIEs), as ExOne guarantees certain long-term debt of both Lone Star and TMF and governs these entities through common ownership. This guidance requires certain VIEs to be consolidated when an enterprise has the power to direct the activities of the VIE that most significantly impact VIE economic performance and who has the obligation to absorb losses or the right to receive benefits of the VIE that could potentially be significant to the VIE. The consolidated financial statements therefore include the accounts of Lone Star and TMF. The assets of Lone Star and TMF can only be used to settle obligations of Lone Star and TMF, and the creditors of Lone Star and TMF do not have recourse to the general credit of ExOne.
The consolidated financial statements of the Company are prepared in conformity with accounting principles generally accepted in the United States of America (GAAP). All material intercompany transactions and balances have been eliminated in consolidation. Certain amounts in previously issued consolidated financial statements have been reclassified to conform to the 2012 presentation.
Going Concern
The Company has incurred net losses of approximately $9,688, $7,617 and $5,180 for 2012, 2011 and 2010, respectively. Prior to reorganization (Note 19) the Company operated as a limited liability company and was substantially supported by the continued financial support provided by its majority member. These conditions raise substantial doubt as to the Company’s ability to continue as a going concern. On February 12, 2013, in connection with the completion of its initial public offering (IPO) (Note 19) the Company received unrestricted net proceeds from the sale of its common stock of approximately $91,996. Management believes that the unrestricted net proceeds obtained through this transaction will be sufficient to support the Company’s operations through at least January 1, 2014 (the measurement period for such determination), and no longer believes substantial doubt as to the Company’s ability to continue as a going concern to exist.
Use of Estimates
The preparation of these consolidated financial statements requires the Company to make certain judgments, estimates and assumptions regarding uncertainties that affect the reported amounts of assets, liabilities, revenue and expenses and related disclosure of contingent assets and liabilities. Areas that require significant judgments, estimates and assumptions include accounting for inventories (including the allowance for slow moving and obsolete inventory); product warranty reserves; equity-based compensation (including the fair value of the Company’s common units used to measure equity-based compensation); income taxes (including the valuation allowance on certain deferred tax assets) and future cash flow estimates associated with long-lived assets for
F-7
Table of Contents
purposes of impairment testing. The Company bases its estimates on historical experience and on various other assumptions that are believed to be reasonable, the results of which forms the basis for making judgments about the carrying values of assets and liabilities that are not readily apparent from other sources. Actual results may differ from these estimates.
Foreign Currency
The local currency is the functional currency for significant operations outside of the United States. The determination of the functional currency of an operation is made based upon the appropriate economic and management indicators.
Foreign currency assets and liabilities are translated into their U.S. dollar equivalents based upon year end exchange rates, and are included in members’ equity (deficit) as a component of comprehensive loss. Revenues and expenses are translated at average exchange rates. Transaction gains and losses that arise from exchange rate fluctuations are charged to operations as incurred, except for gains and losses associated with intercompany receivables and payables for which settlement is not planned or anticipated in the foreseeable future, which are included in other comprehensive income (loss) in the consolidated statement of operations and comprehensive loss.
The Company transacts business globally and is subject to risks associated with fluctuating foreign exchange rates. Approximately 72.8%, 70.0% and 70.7% of the consolidated revenue of the Company was derived from transactions outside the United States for 2012, 2011 and 2010, respectively. This revenue is generated primarily from wholly-owned subsidiaries operating in their respective countries and surrounding geographic areas. This revenue is primarily denominated in each subsidiary’s local functional currency, including the Euro and Japanese Yen.
Revenue Recognition
Revenue from the sale of 3D printing machines and related 3D printed parts and materials is recognized upon transfer of title, generally upon shipment. Revenue from the performance of contract services or production services is generally recognized when either the services are performed or the finished product is shipped. Revenue for all deliverables in a sales arrangement is recognized provided that persuasive evidence of a sales arrangement exists, both title and risk of loss have passed to the customer and collection is reasonably assured. Persuasive evidence of a sales arrangement exists upon execution of a written sales agreement or signed purchase order that constitutes a fixed and legally binding commitment between the Company and its customer. In instances where revenue recognition criteria are not met, amounts are recorded as deferred revenue and customer prepayments in the consolidated balance sheets.
The Company enters into sales arrangements that may provide for multiple deliverables to a customer. Sales of machines may include consumables, maintenance services, and training and installation. The Company identifies all goods and services that are to be delivered separately under a sales arrangement and allocates revenue to each deliverable based on relative fair values. Fair values are generally established based on the prices charged when sold separately by the Company. In general, revenues are separated between machines, consumables, maintenance services and installation and training services. The allocated revenue for each deliverable is then recognized ratably based on relative fair values of the components of the sale. The Company also evaluates the impact of undelivered items on the functionality of delivered items for each sales transaction and, where appropriate, defers revenue on delivered items when that functionality has been affected. Functionality is determined to be met if the delivered products or services represent a separate earnings process. Revenue from maintenance services as well as installation is recognized at the time of performance.
The Company provides customers with a standard warranty on all machines generally over a period of twelve months from the date of installation at the customer’s site. The warranty is not treated as a separate
F-8
Table of Contents
service because the warranty is an integral part of the sale of the machine. After the initial one year warranty period, the Company offers its customers optional maintenance contracts. Deferred maintenance service revenue is recognized when the maintenance services are performed since the Company has historical evidence that indicates that the costs of performing the services under the contract are not incurred on a straight-line basis.
The Company sells equipment with embedded software to its customers. The embedded software is not sold separately and it is not a significant focus of the Company’s marketing effort. The Company does not provide post-contract customer support specific to the software or incur significant costs that are within the scope of FASB guidance on accounting for software to be leased or sold. Additionally, the functionality that the software provides is marketed as part of the overall product. The software embedded in the equipment is incidental to the equipment as a whole such that the FASB guidance referenced above is not applicable. Sales of these products are recognized in accordance with FASB guidance on accounting for multiple-element arrangements.
Shipping and handling costs billed to customers for machine sales and sales of consumables are included in revenue in the consolidated statement of operations and other comprehensive loss. Costs incurred by the Company associated with shipping and handling are included in cost of sales in the consolidated statement of operations and comprehensive loss.
The Company’s terms of sale generally require payment within 30 to 60 days after shipment of a product, although the Company also recognizes that longer payment periods are customary in some countries where it transacts business. To reduce credit risk in connection with machine sales, the Company may, depending upon the circumstances, require certain amounts be prepaid prior to shipment. In some circumstances, the Company may require payment in full for its products prior to shipment and may require international customers to furnish letters of credit. These prepayments are reported as deferred revenue and customer prepayments in the consolidated balance sheets. Production and contract services are billed on a time-and-materials basis. Services under maintenance contracts are billed to customers upon performance of services in accordance with the contract.
Cash and Cash Equivalents
The Company considers all highly liquid instruments with maturities when purchased of three months or less to be cash equivalents. The Company’s policy is to invest cash in excess of short-term operating and debt-service requirements in such cash equivalents. These instruments are stated at cost, which approximates fair value because of the short maturity of the instruments. The Company maintains cash balances with financial institutions located in the United States, Germany, and Japan. The Company places its cash with high quality financial institutions and believes its risk of loss is limited; however, at times, account balances may exceed international and federally insured limits. The Company has not experienced any losses associated with these cash balances.
Accounts Receivable
Accounts receivable are reported at their net realizable value. The Company’s estimate of the allowance for doubtful accounts related to trade receivables is based on the Company’s evaluation of customer accounts with past-due outstanding balances or specific accounts for which it has information that the customer may be unable to meet its financial obligations. Based upon review of these accounts, and management’s analysis and judgment, the Company records a specific allowance for that customer’s accounts receivable balance to reduce the outstanding receivable balance to the amount expected to be collected. The allowance is re-evaluated and adjusted periodically as additional information is received that impacts the allowance amount reserved. At December 31, 2012 and 2011, the allowance for doubtful accounts was approximately $83 and $43, respectively.
F-9
Table of Contents
Inventories
The Company values all of its inventories at the lower of cost, as determined on the first-in, first-out (FIFO) method or market value. Overhead is allocated to work in progress and finished goods based upon normal capacity of the Company’s production facilities. Fixed overhead associated with production facilities that are being operated below normal capacity are recognized as a period expense rather than being capitalized as a product cost. An allowance for slow-moving and obsolete inventories is provided based on historical experience and current product demand. These provisions reduce the cost basis of the respective inventory and are recorded as a charge to cost of sales. At December 31, 2012 and 2011, the allowance for slow-moving and obsolete inventories was approximately $891 and $1,401, respectively.
Property and Equipment
Property and equipment are recorded at cost and depreciated on a straight-line basis over the estimated useful lives of the related assets, generally three to twenty-five years. Leasehold improvements are amortized on a straight-line basis over the shorter of (i) their estimated useful lives or (ii) the estimated or contractual lives of the related leases. Gains or losses from the sale of assets are recognized upon disposal or retirement of the related assets and are generally recorded in other (income) expense — net on the statement of consolidated operations and comprehensive loss. Repairs and maintenance are charged to expense as incurred.
The Company evaluates long-lived assets for impairment whenever events or changes in circumstances indicate that the carrying amount of such assets (asset group) may not be recoverable. Recoverability of assets is determined by comparing the estimated undiscounted net cash flows of the operations related to the assets (asset group) to their carrying amount. An impairment loss would be recognized when the carrying amount of the assets (asset group) exceeds the estimated undiscounted net cash flows. The amount of the impairment loss to be recorded is calculated as the excess of carrying value of assets (asset group) over their fair value, with fair value determined using the best information available, which generally is a discounted cash flow model. The determination of what constitutes an asset group, the associated undiscounted net cash flows, and the estimated useful lives of assets require significant judgments and estimates by management. No impairment loss was recorded by the Company during 2012, 2011 or 2010.
Product Warranty Reserves
Substantially all of the Company’s 3D printing machines are covered by a warranty, generally over a period of twelve months from the date of installation at the customer’s site. A liability is recorded for future warranty costs in the same period in which the related revenue is recognized. The liability is based upon anticipated parts and labor costs using historical experience. The Company periodically assesses the adequacy of the product warranty reserves based on changes in these factors and records any necessary adjustments if actual experience indicates that adjustments are necessary. Future claims experience could be materially different from prior results because of the introduction of new, more complex products, a change in the Company’s warranty policy in response to industry trends, competition or other external forces, or manufacturing changes that could impact product quality. In the event that the Company determines that its current or future product repair and replacement costs exceed estimates, an adjustment to these reserves would be charged to cost of sales in the statement of consolidated operations and comprehensive loss in the period such a determination is made. At December 31, 2012 and 2011, product warranty reserves were approximately $554 and $117, respectively, and were included in accrued expenses and other current liabilities in the consolidated balance sheets.
Income Taxes
Prior to reorganization (Note 19), the Company was organized as a limited liability company. Under the provisions of the Internal Revenue Code and similar state provisions, the Company was taxed as a partnership and was not liable for income taxes. Instead, earnings and losses were included in the tax returns of its members. Therefore, the consolidated financial statements do not reflect a provision for U.S. federal or state income taxes.
F-10
Table of Contents
The Company’s subsidiaries in Germany and Japan are taxed as corporations under the taxing regulations of Germany and Japan, respectively. As a result, the consolidated statement of operations and comprehensive loss includes tax expense related to these foreign jurisdictions. Any undistributed earnings are intended to be permanently reinvested in the respective subsidiaries.
The Company recognizes the tax benefit from an uncertain tax position only if it is more likely than not that the tax position will be sustained on examination by the taxing authorities based upon the technical merits of the position. The tax benefits recognized in the financial statements from such positions are then measured based upon the largest amount that has a greater than 50% likelihood of being realized upon settlement. Tax benefits that do not meet the more likely than not criteria are recognized when effectively settled, which generally means that the statute of limitations has expired or that appropriate taxing authority has completed its examination even through the statute of limitations remains open. Interest and penalties related to uncertain tax positions are recognized as part of the provision for income taxes and are accrued beginning in the period that such interest and penalties would be applicable under relevant tax law until such time that the related tax benefits are recognized.
The Company recognizes deferred tax assets and liabilities for the differences between the financial statement carrying amounts and the tax basis of assets and liabilities of the Company’s wholly-owned subsidiaries in Germany and Japan using enacted tax rates in effect in the years in which the differences are expected to reverse. Valuation allowances are established when necessary to reduce foreign deferred tax assets to the amount expected to be realized (Note 15).
Derivative Financial Instruments
The Company is exposed to market risk from changes in interest rates and foreign currency exchange rates, which may adversely affect its results of operations and financial condition. The Company seeks to minimize these risks through regular operating and financing activities and, when the Company considers it to be appropriate, through the use of derivative financial instruments.
The Company holds interest rate swaps for the purpose of managing risks related to the variability of future earnings and cash flows caused by changes in interest rates. The Company has elected not to prepare and maintain the documentation required to qualify for hedge accounting treatment and therefore, all gains and losses (realized or unrealized) related to derivative instruments are recognized as interest expense in the statement of consolidated operations and comprehensive loss. Fair value of the interest rate swaps are reported as accrued expenses and other current liabilities in the consolidated balance sheets. The Company does not purchase, hold or sell derivative financial instruments for trading or speculative purposes.
The Company is exposed to credit risk if the counterparties to such transactions are unable to perform their obligations. However, the Company seeks to minimize such risk by entering into transactions with counterparties that are believed to be creditworthy financial institutions.
The Company held no foreign currency contracts in 2012 or 2011. During 2010, the Company entered into a foreign currency contract to hedge its exposure arising from the sale of inventory. The Company recognized a loss of approximately $76 during 2010 in connection with this transaction and the termination of this contract.
Taxes on Revenue Producing Transactions
Taxes assessed by governmental authorities on revenue producing transactions, including sales, excise, value added and use taxes, are recorded on a net basis (excluded from revenue) in the consolidated statement of operations and comprehensive loss.
F-11
Table of Contents
Research and Development
The Company is continuously involved in research and development of new methods and technologies relating to its products. All research and development costs are charged to expense as incurred.
Advertising
Advertising costs are charged to expense as incurred, and were not significant for 2012, 2011 or 2010.
Defined Contribution Plan
The Company sponsors a defined contribution savings plan under section 401(k) of the Internal Revenue Code. Under the plan, participating employees in the United States may elect to defer a portion of their pre-tax earnings, up to the Internal Revenue Service’s annual contribution limit. The Company makes matching contributions of 50% of the first 8% of employee contributions, subject to certain Internal Revenue Service limitations. The Company’s matching contributions to the plan were approximately $90, $87 and $57 in 2012, 2011 and 2010, respectively.
Equity-Based Compensation
The Company recognizes compensation expense for equity-based grants using the straight-line attribution method, in which the expense (net of estimated forfeitures) is recognized ratably over the requisite service period based on the grant date fair value. Fair value of equity-based awards is estimated on the date of grant using the Black-Scholes pricing model. The Company recognized approximately $7,735 in equity-based compensation during 2012 (Note 12). There was no equity-based compensation expense recognized during 2011 or 2010.
Recently Adopted Accounting Guidance
On January 1, 2012, ExOne adopted changes issued by the FASB to conform existing guidance regarding fair value measurement and disclosure between GAAP and International Financial Reporting Standards. These changes both clarify the FASB’s intent about the application of existing fair value measurement and disclosure requirements and amend certain principles or requirements for measuring fair value or for disclosing information about fair value measurements. The clarifying changes relate to the application of the highest and best use and valuation premise concepts, measuring the fair value of an instrument classified in a reporting entity’s equity, and disclosure of quantitative information about unobservable inputs used for Level 3 fair value measurements. The amendments relate to measuring the fair value of financial instruments that are managed within a portfolio; application of premiums and discounts in a fair value measurement; and additional disclosures concerning the valuation processes used and sensitivity of the fair value measurement to changes in unobservable inputs for those items categorized as Level 3, a reporting entity’s use of a nonfinancial asset in a way that differs from the asset’s highest and best use, and the categorization by level in the fair value hierarchy for items required to be measured at fair value for disclosure purposes only. Other than the additional disclosure requirements (see Note 16), the adoption of these changes had no impact on the consolidated financial statements.
On January 1, 2012, ExOne adopted changes issued by the FASB to the presentation of comprehensive income (loss). These changes give an entity the option to present the total of comprehensive income (loss), the components of net income (loss), and the components of other comprehensive income (loss) either in a single continuous statement or in two separate but consecutive statements. The option to present components of other comprehensive income (loss) as part of the statement of changes in members’ equity was eliminated. The items that must be reported in other comprehensive income (loss) or when an item of other comprehensive income (loss) must be reclassified to net income (loss) were not changed. Additionally, no changes were made to the calculation and presentation of earnings per share (unit). The Company elected to present the single continuous statement option. Other than the change in presentation, the adoption of these changes had no impact on the consolidated financial statements.
F-12
Table of Contents
Note 2. Computation of Net Loss Attributable to ExOne Per Common Unit
The Company presents basic and diluted loss per common unit amounts. Basic loss per unit is calculated by dividing net loss available to ExOne common unitholders by the weighted average number of common units outstanding during the applicable period. Diluted loss per unit is calculated by dividing net loss available to ExOne common unitholders by the weighted average number of common and common equivalent units outstanding during the applicable period.
As the Company has incurred a net loss in 2012, 2011 and 2010, the conversion of the preferred units, as described in Note 11, has an anti-dilutive effect and is therefore excluded from the calculation below.
| 2012 | 2011 | 2010 | ||||||||||
| Net loss attributable to ExOne |
$ | (10,168 | ) | $ | (8,037 | ) | $ | (5,508 | ) | |||
| Less: Preferred unit dividends declared |
(1,437 | ) | — | — | ||||||||
|
|
|
|
|
|
|
|||||||
| Net loss available to ExOne common unitholders |
$ | (11,605 | ) | $ | (8,037 | ) | $ | (5,508 | ) | |||
|
|
|
|
|
|
|
|||||||
| Weighted average shares outstanding (basic and diluted) |
10,000,000 | 10,000,000 | 10,000,000 | |||||||||
| Net loss attributable to ExOne per common unit: |
||||||||||||
| Basic |
$ | (1.16 | ) | $ | (0.80 | ) | $ | (0.55 | ) | |||
| Diluted |
$ | (1.16 | ) | $ | (0.80 | ) | $ | (0.55 | ) | |||
Note 3. Inventories
Inventories consist of the following at December 31:
| 2012 | 2011 | |||||||
| Raw materials and components |
$ | 4,892 | $ | 2,137 | ||||
| Work in process |
2,098 | 1,694 | ||||||
| Finished goods |
495 | 600 | ||||||
|
|
|
|
|
|||||
| $ | 7,485 | $ | 4,431 | |||||
|
|
|
|
|
|||||
At December 31, 2012 and 2011, the allowance for slow-moving and obsolete inventories was approximately $891 and $1,401, respectively, and has been reflected as a reduction to inventories.
Note 4. Prepaid Expenses and Other Current Assets
Prepaid expenses and other current assets consist of the following at December 31:
| 2012 | 2011 | |||||||
| Deferred offering costs |
$ | 712 | $ | — | ||||
| Value-added taxes (VAT) receivable |
— | 140 | ||||||
| Amounts due from related parties |
38 | 396 | ||||||
| Vendor deposits |
559 | — | ||||||
| Other |
234 | 318 | ||||||
|
|
|
|
|
|||||
| $ | 1,543 | $ | 854 | |||||
|
|
|
|
|
|||||
F-13
Table of Contents
Note 5. Property and Equipment
Property and equipment consist of the following at December 31:
| 2012 | 2011 | Useful Life (in years) |
||||||||||
| Land |
$ | 778 | $ | 178 | — | |||||||
| Buildings and related improvements |
4,941 | 2,215 | 25 | |||||||||
| Machinery and equipment |
9,674 | 8,087 | 3-7 | |||||||||
| Computer equipment and software |
971 | 724 | 3-5 | |||||||||
| Other |
479 | 319 | 3-7 | |||||||||
|
|
|
|
|
|||||||||
| 16,843 | 11,523 | |||||||||||
| Less: Accumulated depreciation |
(5,118 | ) | (3,714 | ) | ||||||||
|
|
|
|
|
|||||||||
| 11,725 | 7,809 | |||||||||||
| Construction-in-progress |
742 | 110 | ||||||||||
|
|
|
|
|
|||||||||
| Property and equipment — net |
$ | 12,467 | $ | 7,919 | ||||||||
|
|
|
|
|
|||||||||
At December 31, 2012 and 2011, property and equipment — net, includes $5,567 and $5,798 in assets held by variable interest entities (Note 1).
Machinery and equipment includes leased assets of approximately $1,160 at December 31, 2012. There were no leased assets included in property and equipment—net at December 31, 2011.
Depreciation expense was approximately $1,683, $1,170 and $1,072 in 2012, 2011 and 2010, respectively.
On March 27, 2013, in connection with the acquisition of certain net assets of the Lone Star and TMF variable interest entities (Note 19), the Company acquired all of the property and equipment associated with the variable interest entities (see description above).
Note 6. Accrued Expenses and Other Current Liabilities
Accrued expenses and other current liabilities consist of the following at December 31:
| 2012 | 2011 | |||||||
| Accrued license fees |
$ | 748 | $ | 1,183 | ||||
| Accrued payroll and related costs |
1,367 | 705 | ||||||
| Accrued income taxes |
457 | 956 | ||||||
| Value-added taxes (VAT) and other taxes payable |
414 | 124 | ||||||
| Product warranty reserves |
554 | 117 | ||||||
| Liability for uncertain tax positions |
416 | 264 | ||||||
| Other |
480 | 276 | ||||||
|
|
|
|
|
|||||
| $ | 4,436 | $ | 3,625 | |||||
|
|
|
|
|
|||||
Note 7. Line of Credit
The Company has a line of credit and security agreement with a German bank collateralized by certain assets of the Company and guaranteed by the majority member of the Company for approximately $2,000 (€1,500). Of this amount, approximately $1,100 (€800) is available for short-term borrowings or cash advances (overdrafts). Both short-term borrowings and overdrafts are subject to variable interest rates as determined by the bank. At December 31, 2012, interest rates were 1.82% for short-term borrowings and 6.20% for overdrafts.
F-14
Table of Contents
There is no commitment fee associated with this agreement. At December 31, 2012, the Company had outstanding short-term borrowings of $528 (€400). At December 31, 2011, there were no short-term borrowings outstanding. At December 31, 2012 and 2011, there were no outstanding overdraft amounts.
The line of credit agreement is subject to an annual minimum equity-to-asset ratio covenant. At December 31, 2012, the Company was in compliance with this covenant. At December 31, 2011, the Company was not in compliance with this covenant. The bank did not take action related to this noncompliance. Related to the 2011 noncompliance, there were no cross default provisions or related impacts on other lending agreements.
Amounts in excess of the amounts available for short-term borrowings and overdrafts are available for additional bank transactions requiring security (i.e. bank guarantees, leasing, letters of credit, etc.). Amounts covered under the security agreement accrue interest at 1.75%. There is no charge for unused amounts under the security agreement. At December 31, 2012 and 2011, the Company had $757 (€573) and $231 (€178), respectively, in transactions guaranteed by the security agreement.
Note 8. Demand Note Payable to Member
During 2012, the Company received cash advances to support current operations from an entity controlled by the Company’s majority member. These advances accrued interest at 8.0% annually and were payable on demand. The Company formalized these cash advances in the form of a line of credit with the entity during 2012. At December 31, 2012, the line of credit balance outstanding on these advances, including accrued interest, was approximately $8,666. On February 14, 2013, amounts payable on the line of credit, including accrued interest, were paid in-full and the line of credit agreement was retired. Refer to Note 19.
During 2011, the Company received cash advances to support current operations from an entity controlled by the Company’s majority member. These advances accrued interest at 8.0% annually and were payable on demand. At December 30, 2011, the outstanding balance on these advances, including accrued interest, was approximately $18,984. On December 30, 2011, the Company entered into a debt conversion agreement with the Company’s majority member which effectively converted the $18,984 to redeemable preferred units in the Company. Refer to Note 11.
F-15
Table of Contents
Note 9. Long-Term Debt
Long-term debt consists of the following at December 31:
| 2012 | 2011 | |||||||
| ExOne |
||||||||
| Building note payable to a bank, with monthly payments including interest at 4.3% through May 2017 and subsequently, the monthly average yield on U.S. Treasury Securities plus 3.25% for the remainder of the term through May 2027. |
$ | 2,334 | $ | — | ||||
| Building note payable to an unrelated entity, with monthly payments including interest at 6.0% through June 2014. |
300 | — | ||||||
| Lone Star Metal Fabrication, LLC |
||||||||
| Building note payable to a bank, with monthly payments including interest at 7.0% through July 2014. |
727 | 765 | ||||||
| Equipment note payable to a bank, with monthly payments including interest at 7.0% through July 2014. |
— | 420 | ||||||
| Troy Metal Fabricating, LLC |
||||||||
| Equipment note payable to a bank, with monthly payments including interest at one-month BBA LIBOR plus 3.0% (3.21% at December 31, 2012) through December 2017. |
1,193 | — | ||||||
| Equipment note payable to a bank, with monthly payments including interest at 4.83% through December 2016. |
1,056 | 1,291 | ||||||
| Equipment line of credit to a bank, converted to term debt in January 2012; monthly payments including interest at one-month BBA LIBOR plus 2.75% (2.96% at December 31, 2012) through December 2016. |
886 | 1,108 | ||||||
| Building note payable to a bank, with monthly payments including interest at one-month BBA LIBOR plus 2.45% (2.66% at December 31, 2012) through April 2013. Interest is fixed at 6.80% under an interest rate swap (see below). |
760 | 781 | ||||||
| Equipment note payable to a bank, with monthly payments including interest at one-month BBA LIBOR plus 2.75% (2.96% at December 31, 2012) through January 2014. Interest is fixed at 6.68% under an interest rate swap (see below). |
228 | 433 | ||||||
| Equipment note payable to a bank, with monthly payments including interest at one-month BBA LIBOR plus 2.75% (2.96% at December 31, 2012) through April 2013. |
213 | 631 | ||||||
|
|
|
|
|
|||||
| 7,697 | 5,429 | |||||||
| Less: Current portion of long-term debt |
2,028 | 1,294 | ||||||
|
|
|
|
|
|||||
| $ | 5,669 | $ | 4,135 | |||||
|
|
|
|
|
|||||
All long-term debt of Lone Star and TMF is guaranteed by the Company and either the majority member of the Company or related parties under control of the majority member of the Company, and is collateralized by the related buildings and equipment.
In December 2012, Lone Star repaid its equipment note payable in-full. There were no prepayment penalties or gains or losses associated with this early retirement of debt.
In December 2012, TMF entered into an equipment note payable to a bank for approximately $1,200, with monthly payments including interest at one-month BBA LIBOR plus 3.0% (3.21% at December 31, 2012) through December 2017.
At December 31, 2012, the Company identified that it was not in compliance with the annual cash flow-to-debt service ratio covenant associated with the ExOne building note payable to a bank. The Company requested and was granted a waiver related to compliance with this covenant through December 31, 2013. Related to the 2012 noncompliance, there were no cross default provisions or related impacts on other lending agreements.
F-16
Table of Contents
Future maturities of long-term debt at December 31, 2012, are approximately as follows:
| 2013 |
$ | 2,028 | ||
| 2014 |
1,829 | |||
| 2015 |
853 | |||
| 2016 |
878 | |||
| 2017 |
402 | |||
| Thereafter |
1,707 | |||
|
|
|
|||
| $ | 7,697 | |||
|
|
|
On February 14, 2013, the Company repaid the ExOne building note payable to an unrelated entity (Note 19). There were no prepayment penalties or gains or losses associated with this early retirement of debt.
On March 27, 2013, in connection with the acquisition of certain net assets of the Lone Star and TMF variable interest entities (Note 19), the Company assumed and repaid all amounts outstanding on Lone Star and TMF debt, including accrued interest, and settled amounts related to certain interest rate swap agreements held by TMF (see description below). There were no prepayment penalties or gains or losses associated with this early retirement of debt or the related interest rate swap agreements.
In June 2008, the Company, through TMF, entered into certain interest rate swap agreements with a bank. The Company utilizes the interest rate swaps for the purpose of managing risks related to the variability of future earnings and cash flows caused by changes in interest rates. Under the terms of the agreements, the Company agrees to pay interest at the fixed rates and the Company receives variable interest from the counterparty.
The significant terms of interest rate swap agreements at December 31, 2012 and 2011, are as follows:
| 2012 | ||||||||
| TMF building note payable |
TMF equipment note payable |
|||||||
| Notional amount |
$ | 760 | $ | 228 | ||||
| Fixed rate |
6.80 | % | 6.68 | % | ||||
| Floating rate |
2.66 | % | 2.66 | % | ||||
| Maturity date |
April 2, 2013 | April 2, 2013 | ||||||
| 2011 | ||||||||
| TMF building note payable |
TMF equipment note payable |
|||||||
| Notional amount |
$ | 781 | $ | 433 | ||||
| Fixed rate |
6.80 | % | 6.68 | % | ||||
| Floating rate |
2.73 | % | 2.73 | % | ||||
| Maturity date |
April 2, 2013 | April 2, 2013 | ||||||
At December 31, 2012 and 2011, the fair value of the interest rate swaps was a liability of approximately $13 and $60, respectively. These obligations are included in accrued expenses and other current liabilities in the consolidated balance sheets. Gains (losses) on interest rate swap contracts are recorded as a component of interest expense in the statement of consolidated operations and comprehensive loss.
F-17
Table of Contents
Note 10. Financing Leases
In March 2012, the Company entered into a sale-leaseback transaction with a bank for a 3D printing machine. Due to continuing involvement outside of the normal leaseback by the Company, this transaction has been accounted for as a financing lease. Under the terms of the agreement, the Company received proceeds of approximately $985 (€739) with repayment of the lease occurring over a three-year period beginning in April 2012. The present value of the future minimum lease payments, including an interest rate of 6.0%, was approximately $553 (€418) at December 31, 2012.
In July 2012, the Company entered into a sale-leaseback transaction with a related party for a 3D printing machine. Based on the economic substance of the transaction between the parties, this transaction was accounted for as a financing lease. Under the terms of the agreement, the Company received proceeds of approximately $1,553 with repayment of the lease occurring over a five-year period beginning in August 2012. The present value of the future minimum lease payments, including an interest rate of 6.0%, was approximately $1,463 at December 31, 2012.
In November 2012, the Company entered into a sale-leaseback transaction with a bank for a 3D printing machine. Due to continuing involvement outside of the normal leaseback by the Company, this transaction has been accounted for as a financing lease. Under the terms of the agreement, the Company received proceeds of approximately $974 (€737) with repayment of the lease occurring over a three-year period beginning in January 2013. The present value of the future minimum lease payments, including an interest rate of 6.0%, was approximately $853 (€646) at December 31, 2012.
Future maturities of financing leases at December 31, 2012, are approximately as follows:
| 2013 |
$ | 920 | ||
| 2014 |
773 | |||
| 2015 |
606 | |||
| 2016 |
335 | |||
| 2017 |
235 | |||
| Thereafter |
— | |||
|
|
|
|||
| $ | 2,869 | |||
|
|
|
Note 11. Common and Preferred Units
Common units
At December 31, 2012 and 2011, the Company had 10,000,000 common units issued and outstanding.
Net income (loss) is allocated to each common unitholder in proportion to the units held by each common unitholder relative to the total units outstanding. The common unitholders share the Company’s positive cash flow, to the extent available, which is distributed annually and allocated among the common unitholders in proportion to the units held by each common unitholder relative to the total units outstanding. Common unitholders are entitled to one vote per unit on all matters.
On January 1, 2013, in connection with the reorganization of the Company (Note 19), 10,000,000 common units in the former limited liability company were exchanged for 5,800,000 shares of common stock.
Preferred units
On December 30, 2011, the Company entered into a debt conversion agreement with the Company’s majority member to convert $18,984 of unpaid principal and interest on the Company’s demand note payable to member (Note 8) into redeemable preferred units of the Company in full satisfaction of the indebtedness. Accordingly, 18,983,602 redeemable preferred units were issued at a conversion price of $1.00 per share.
F-18
Table of Contents
The preferred units were non-voting limited liability company membership interests, and permitted the majority member (unitholder) to receive cumulative dividends at the annual rate of 8.0% per unit prior to, and in preference to, any declaration or payment of any dividend on the Company’s common units. Dividends on the preferred units accumulated and were payable irrespective of whether the Company had earnings, whether there were funds legally available for the payment of such dividends, and whether dividends were declared.
The Company had the option to redeem all or any number of the preferred units at any time upon written notice and payment to the unitholder of $1.00 plus all accrued but unpaid dividends for each unit being redeemed. The unitholder had the option to convert all or any number of preferred units to common units at the conversion rate of 9.5 preferred units for 1.0 common unit. Preferred units were designed to automatically convert to 1,998,275 common units upon the closing of any initial public offering in which the gross proceeds of the offering exceed $50,000 provided that the unitholder elected to retain such units. The Company analyzed the conversion feature under the applicable FASB guidance for accounting for derivatives and concluded that the conversion feature did not require separate accounting under such FASB guidance.
Because the unitholder was also the majority member and principal owner of the Company at December 31, 2011, he had the ability to redeem the preferred units at his option, thus giving the units characteristics of a liability rather than equity. Accordingly, the Company’s preferred units were classified as a liability in the Company’s consolidated balance sheets at December 31, 2011. At December 31, 2011, the unitholder had committed to not exercise his redemption rights through January 1, 2013.
In February 2012, the redemption feature on the preferred units was removed by an amendment to the preferred unit agreement. As a result, the preferred units were reclassified at fair value ($18,984) from a liability to equity in the consolidated balance sheets at December 31, 2012.
In May 2012, the unitholder sold 6,000,000 preferred units to two separate unrelated parties for $1.00 per unit.
On January 1, 2013, in connection with the reorganization of the Company (Note 19), preferred units in the former limited liability company were exchanged for 18,983,602 shares of preferred stock. Immediately prior to the IPO of the Company (Note 19), shares of preferred stock were automatically converted into shares of common stock at a 9.5 to 1.0 basis (1,998,275 shares). Following the conversion, there are no issued or outstanding shares of preferred stock in the Company.
Note 12. Equity-Based Compensation
In May 2012, the Company’s majority member completed the sale of 300,000 common units to an existing member of the Company for $1.25 per unit. In July and August of 2012, the Company’s majority member completed the sale of additional common units to two employees under the terms described above. The fair value of these common units on the measurement date was $7.20 per common unit. The Company recognized compensation expense of approximately $7,735 during 2012 in connection with the sale of these common units.
Determining the fair value of the common units required complex and subjective judgments. The Company used the sale of a similar security in an arms-length transaction with unrelated parties to estimate the value of the enterprise at the measurement date, which included assigning a value to the similar security’s rights, preferences and privileges, relative to the common units. The enterprise value was then allocated to the Company’s outstanding equity securities using a Black-Scholes option pricing model. The option pricing model involves making estimates such as: the anticipated timing of a potential liquidity event (less than one year), volatility of our equity securities (65.0%), and risk-free interest rate (0.16%). Changes in these assumptions could materially impact the value assigned to the common units.
F-19
Table of Contents
Note 13. License Agreements
The Company has license agreements with certain organizations which require license fee payments to be made on a periodic basis, including royalties on net sales of licensed products, processes and consumables. License fee expenses amounted to approximately $57, $682 and $357 for 2012, 2011 and 2010, respectively, and are included in cost of sales in the consolidated statement of operations and comprehensive loss. At December 31, 2012, accrued license fees were approximately $1,015 and are recorded in accrued expenses and other current liabilities ($748) and other noncurrent liabilities ($267) in the consolidated balance sheets. At December 31, 2011, accrued license fees were approximately $1,183 and are recorded in accrued expenses and other current liabilities in the consolidated balance sheets.
Included in the license agreements is an exclusive patent license agreement with the Massachusetts Institute of Technology (the MIT Agreement). Patents covered under the MIT Agreement have expiration dates ranging from 2013 to 2021. Terms of the MIT Agreement remain in force until the expiration or abandonment of all issued patent rights.
Terms of the MIT Agreement require that the Company remit payment to MIT for (1) minimum license maintenance fees, (2) royalties, ranging from 2.5% to 5.0%, on net sales of licensed products, processes and consumables and (3) reimbursement of certain qualifying patent expenses incurred by MIT.
On January 22, 2013, the Company and MIT agreed to an amendment of their exclusive patent license agreement (the Amended MIT Agreement). The Amended MIT Agreement provides for, among other things, (1) a reduction in the term of the agreement between the Company and MIT from the date of expiration or abandonment of all issued patent rights to December 31, 2016, (2) an increase in the minimum license maintenance fees due for the years ended December 31, 2013 through December 31, 2016 from $50 annually to $100 annually, with amounts related to 2013 through 2016 guaranteed by ExOne in the event of termination of the agreement, (3) a settlement of all past and future royalties on net sales of licensed products, processes and consumables for a one-time payment of $200, payable in 2013 by the Company, and (4) a provision for extension of the term of the arrangement between the parties for an annual license maintenance fee of $100 for each subsequent year beyond 2016.
As a result of the Amended MIT Agreement, the Company recorded a reduction to its accrued license fees at December 31, 2012, of approximately $1,500 with a corresponding reduction to cost of sales. License fee expenses, including minimum license maintenance fees and royalties, associated with the MIT Agreement and related Amended MIT Agreement for 2012, 2011 and 2010 were ($159), a reduction to cost of sales, $595 and $275, respectively. Reimbursement of qualifying patent expense incurred by MIT were $50, $11 and $18 for 2012, 2011 and 2010, respectively and are recorded in selling, general and administrative expenses in the consolidated statement of operations and comprehensive loss.
Note 14. Operating Lease Commitments
The Company leases various manufacturing facilities, office and warehouse spaces, equipment and vehicles under operating lease arrangements, expiring in various years through 2017.
Future minimum lease payments of operating lease arrangements at December 31, 2012, are approximately as follows:
| 2013 |
$ | 739 | ||
| 2014 |
62 | |||
| 2015 |
47 | |||
| 2016 |
24 | |||
| 2017 |
9 | |||
| Thereafter |
— | |||
|
|
|
|||
| $ | 881 | |||
|
|
|
F-20
Table of Contents
Rent expense under operating lease arrangements was approximately $984, $1,057 and $847 for 2012, 2011 and 2010, respectively.
Note 15. Income Taxes
Prior to reorganization (Note 19) the Company was a limited liability company whereby its members were taxed on a proportionate share of the Company’s taxable income. As such, no provision has been recorded for U.S. federal or state income taxes. The Company reported taxable income from ExOne GmbH of approximately $2,803, $2,473 and $648 in 2012, 2011 and 2010, respectively. Ex One KK reported taxable income of approximately $878, $396 and $0 in 2012, 2011 and 2010, respectively. Taxable income of Ex One KK for both 2012 and 2011 was fully offset by net operating loss carryforwards.
The provision for income taxes was $995, $1,031 and $198 in 2012, 2011 and 2010, respectively and related entirely to the taxable income of ExOne GmbH. The benefit from deferred taxes for 2012, 2011 and 2010 was fully offset by changes in the valuation allowance for deferred tax assets.
A reconciliation of the provision for income taxes at the U.S. statutory rate of 35.0% to the effective rate of the Company for the years ended December 31 is as follows:
| 2012 | 2011 | 2010 | ||||||||||
| U.S. statutory rate (35.0%) |
$ | (3,043 | ) | $ | (2,305 | ) | $ | (1,744 | ) | |||
| Limited liability company losses not subject to tax |
4,018 | 1,818 | 2,110 | |||||||||
| Taxes on foreign operations |
(164 | ) | (71 | ) | (95 | ) | ||||||
| Increase in uncertain tax positions |
146 | 249 | 15 | |||||||||
| Net change in valuation allowances |
8 | 1,290 | (140 | ) | ||||||||
| Permanent differences and other |
30 | 50 | 52 | |||||||||
|
|
|
|
|
|
|
|||||||
| Provision for income taxes |
$ | 995 | $ | 1,031 | $ | 198 | ||||||
|
|
|
|
|
|
|
|||||||
| Effective tax rate |
111.5 | % | 115.7 | % | 104.0 | % | ||||||
|
|
|
|
|
|
|
|||||||
The components of net deferred income tax assets and net deferred income tax liabilities at December 31 were as follows:
| 2012 | 2011 | |||||||
| Current deferred tax assets (liabilities): |
||||||||
| Accounts receivable |
$ | — | $ | 515 | ||||
| Inventories |
(434 | ) | (638 | ) | ||||
| Accrued expenses and other current liabilities |
143 | (117 | ) | |||||
| Deferred revenue and customer prepayments |
1,912 | 1,917 | ||||||
| Other |
250 | (67 | ) | |||||
| Valuation allowance |
(2,049 | ) | (1,984 | ) | ||||
|
|
|
|
|
|||||
| Current deferred tax assets (liabilities) |
(178 | ) | (374 | ) | ||||
|
|
|
|
|
|||||
| Noncurrent deferred tax assets (liabilities): |
||||||||
| Net operating loss carryforwards |
431 | 868 | ||||||
| Property and equipment |
599 | 922 | ||||||
| Other |
567 | 236 | ||||||
| Valuation allowance |
(1,419 | ) | (1,652 | ) | ||||
|
|
|
|
|
|||||
| Noncurrent deferred tax assets (liabilities) |
178 | 374 | ||||||
|
|
|
|
|
|||||
| Net deferred tax assets (liabilities) |
— | — | ||||||
|
|
|
|
|
|||||
F-21
Table of Contents
The Company has provided a valuation allowance for its net deferred tax assets because the Company has not demonstrated a consistent history of generating net operating profits in the jurisdictions in which it operates. At December 31, 2012, the Company had approximately $1,076 in foreign net operating loss carryforwards to offset future taxable income of Ex One KK, which expire from 2013 through 2019.
The following table summarizes changes to the Company’s valuation allowances at December 31:
| 2012 | 2011 | |||||||
| Beginning balance |
$ | 3,636 | $ | 2,266 | ||||
| Increase to allowance |
8 | 1,290 | ||||||
| Foreign currency |
(176 | ) | 80 | |||||
|
|
|
|
|
|||||
| Ending balance |
3,468 | 3,636 | ||||||
|
|
|
|
|
|||||
The Company files income tax returns in both Germany and Japan. In Germany, the Company’s 2010 through 2012 tax years remain subject to examination. In Japan, the Company’s 2005 through 2012 tax years remain subject to examination.
The Company has a liability for uncertain tax positions related to certain capitalized expenses and related party transactions. At December 31, 2012 and 2011, the liability for uncertain tax positions was approximately $416 and $264, respectively, and is included in accrued expenses and other current liabilities in the consolidated balance sheets. At December 31, 2012 and 2011, the liability for uncertain tax positions for Ex One KK was $94 and $377, respectively.
A reconciliation of the beginning and ending amount of unrecognized tax benefits at December 31 was as follows.
| 2012 | 2011 | 2010 | ||||||||||
| Beginning balance |
$ | 264 | $ | 15 | $ | — | ||||||
| Increases related to current year tax positions |
146 | 249 | 15 | |||||||||
| Foreign currency |
6 | — | — | |||||||||
|
|
|
|
|
|
|
|||||||
| Ending balance |
$ | 416 | $ | 264 | $ | 15 | ||||||
|
|
|
|
|
|
|
|||||||
The Company includes interest and penalties related to income taxes as a component of the provision for income taxes in the consolidated statement of operations and comprehensive loss.
Note 16. Fair Value Measurements
Fair value is defined as the price that would be received to sell an asset or paid to transfer a liability in an orderly transaction between market participants at the measurement date. When determining the fair value measurements for assets and liabilities which are required to be recorded at fair value, the Company considers the principal or most advantageous market in which the Company would transact and the market-based risk measurements or assumptions that market participants would use in pricing the asset or liability, such as inherent risk, transfer restrictions and credit risk.
F-22
Table of Contents
The Company applies the following fair value hierarchy, which prioritizes the inputs used to measure fair value into three levels and bases the categorization within the hierarchy upon the lowest level of input that is available and significant to the fair value measurement:
| Level 1 | Observable inputs such as quoted prices in active markets for identical investments that the Company has the ability to access. | |
| Level 2 | Inputs include: | |
| Quoted prices for similar assets or liabilities in active markets; | ||
| Quoted prices for identical or similar assets or liabilities in inactive markets; | ||
| Inputs, other than quoted prices in active markets, that are observable either directly or indirectly; | ||
| Inputs that are derived principally from, or corroborated by, observable market data by correlation or other means. | ||
| Level 3 | Inputs that are generally unobservable and typically reflect management’s estimates of assumptions that market participants would use in pricing the asset or liability. | |
The Company is required to disclose its estimate of the fair value of material financial instruments, including those recorded as assets or liabilities in its consolidated financial statements, in accordance with GAAP.
The following table sets forth the fair value of the Company’s liabilities measured on a recurring basis by level:
| December 31, |
Level | 2012 | 2011 | |||||||||
| Accrued expenses and other current liabilities: |
||||||||||||
| Interest rate swap liability |
2 | $ | 13 | $ | 60 | |||||||
| Redeemable preferred units |
3 | — | $ | 18,984 | ||||||||
The fair value of the interest rate swap liability is determined by using a discounted cash flow model using observable inputs from the related forward interest rate yield curves with the differential between the forward rate and the stated interest rate of the instrument discounted back from the settlement date of the contracts to December 31, 2012 and 2011, respectively. As this model utilizes observable inputs and does not require significant management judgment it has been determined to be a Level 2 financial instrument in the fair value hierarchy.
The fair value of the Company’s redeemable preferred units is estimated based on unobservable inputs, including the present value of the Company’s demand note payable to member immediately prior to conversion, as further described in Note 11. As this estimate utilizes unobservable inputs and requires significant management judgment it has been determined to be a Level 3 financial instrument in the fair value hierarchy.
F-23
Table of Contents
The following table sets forth a summary of changes in the fair value of the Company’s Level 3 financial instruments:
| 2012 | 2011 | |||||||
| Beginning balance |
$ | 18,984 | $ | — | ||||
| Realized gains (losses) |
— | — | ||||||
| Unrealized gains (losses) |
— | — | ||||||
| Purchases |
— | — | ||||||
| Sales |
— | — | ||||||
| Issuances |
— | 18,984 | ||||||
| Settlements |
(18,984 | ) | — | |||||
| Transfers into Level 3 |
— | — | ||||||
| Transfers out of Level 3 |
— | — | ||||||
|
|
|
|
|
|||||
| Ending balance |
$ | — | $ | 18,984 | ||||
|
|
|
|
|
|||||
The carrying values and fair values of other ExOne financial instruments were as follows:
| 2012 | 2011 | |||||||||||||||
| December 31, |
Carrying Value |
Fair Value |
Carrying Value |
Fair Value |
||||||||||||
| Cash and cash equivalents |
$ | 2,802 | $ | 2,802 | $ | 3,496 | $ | 3,496 | ||||||||
| Line of credit |
$ | 528 | $ | 528 | $ | — | $ | — | ||||||||
| Demand note payable to member |
$ | 8,666 | $ | 8,666 | $ | — | $ | — | ||||||||
| Current portion of long-term debt |
$ | 2,028 | $ | 2,028 | $ | 1,294 | $ | 1,294 | ||||||||
| Current portion of financing leases |
$ | 920 | $ | 920 | $ | — | $ | — | ||||||||
| Long-term debt — net of current portion |
$ | 5,669 | $ | 7,880 | $ | 4,135 | $ | 6,377 | ||||||||
| Financing leases — net of current portion |
$ | 1,949 | $ | 1,949 | $ | — | $ | — | ||||||||
The carrying amounts of cash and cash equivalents, line of credit, demand note payable to member, current portion of long-term debt and current portion of financing leases approximate fair value due to their short-term maturities. Cash and cash equivalents were classified in Level 1; Line of credit, demand note payable to member, current portion of long-term debt, current portion of financing leases, long-term debt — net of current portion and financing leases — net of current portion were classified in Level 2.
Note 17. Segment, Product and Geographic Information
The Company manages its business globally in a singular operating segment in which it develops, manufactures and markets 3D printing machines, printed parts, materials and other (including production and contract services for customers). Geographically, the Company conducts its business through wholly-owned subsidiaries in the United States, Germany and Japan.
Revenue by product for the year ended December 31 was as follows:
| 2012 | 2011 | 2010 | ||||||||||
| 3D printing machines |
$ | 15,668 | $ | 5,406 | $ | 5,622 | ||||||
| 3D printed parts, materials and other services |
12,989 | 9,884 | 7,818 | |||||||||
|
|
|
|
|
|
|
|||||||
| $ | 28,657 | $ | 15,290 | $ | 13,440 | |||||||
|
|
|
|
|
|
|
|||||||
During 2012, 2011 and 2010, the Company conducted a significant portion of its business with a limited number of customers. The Company had one customer in 2011 (Ryoyu Systems) and three customers in 2010 (Intek, I Metal and BMW) which individually represented 10% or greater of total revenue for those respective
F-24
Table of Contents
years. There were no customers in 2012 which individually represented 10% or greater of total revenue. In 2012, 2011 and 2010, the Company’s five most significant customers represented approximately 31.7%, 40.9% and 48.7% of total revenue, respectively. At December 31, 2012, accounts receivable from these customers were approximately $1,671. At December 31, 2011, accounts receivable from these customers were not significant.
Geographic information for revenue for the year ended December 31 was as follows (based on the country where the sale originated):
| 2012 | 2011 | 2010 | ||||||||||
| United States |
$ | 7,802 | $ | 4,587 | $ | 3,936 | ||||||
| Germany |
13,956 | 5,678 | 6,909 | |||||||||
| Japan |
6,899 | 5,025 | 2,595 | |||||||||
|
|
|
|
|
|
|
|||||||
| $ | 28,657 | $ | 15,290 | $ | 13,440 | |||||||
|
|
|
|
|
|
|
|||||||
Geographic information for long-lived assets at December 31 was as follows (based on the physical location of assets):
| 2012 | 2011 | |||||||
| United States |
$ | 9,592 | $ | 5,672 | ||||
| Germany |
2,550 | 1,230 | ||||||
| Japan |
325 | 1,017 | ||||||
|
|
|
|
|
|||||
| $ | 12,467 | $ | 7,919 | |||||
|
|
|
|
|
|||||
Note 18. Related Party Transactions
The Company provides various services to several related entities under common control by the majority member, primarily in the form of accounting, finance, information technology and human resource outsourcing. The cost of these services is generally reimbursed by these related entities and was approximately $281, $210 and $90 in 2012, 2011 and 2010, respectively. In addition, the Company may purchase certain items on behalf of related parties under common control by the majority member. Amounts due from these related entities, included in prepaid expenses and other current assets in the consolidated balance sheets, were $38 at December 31, 2012, and $396 at December 31, 2011.
The Company receives design services and the corporate use of an airplane from related entities under common control by the majority member. The cost of these services received was approximately $149, $23 and $35 in 2012, 2011 and 2010, respectively. Amounts due to these related entities, included in accounts payable and accrued expenses and other current liabilities in the consolidated balance sheets, were $47 at December 31, 2012, and $17 at December 31, 2011.
Note 19. Subsequent Events
The Company has evaluated all activity of ExOne and concluded that no subsequent events have occurred that would require recognition in the consolidated financial statements or disclosure in the notes to the consolidated financial statements, except as described below.
Reorganization
On January 1, 2013, The Ex One Company, LLC, a Delaware limited liability company, merged with and into a Delaware corporation, which survived and changed its name to The ExOne Company. As a result of the reorganization, The Ex One Company, LLC became the Company, a Delaware corporation, the common and
F-25
Table of Contents
preferred interest holders of The Ex One Company, LLC became holders of common stock and preferred stock, respectively, of the Company and the subsidiaries of The Ex One Company, LLC became the subsidiaries of the Company. The preferred stock of the Company was converted into common stock on a 9.5 to 1 basis (1,998,275 shares of common stock) immediately prior to February 6, 2013, the effective date of the IPO.
Prior to giving effect to the reorganization transaction, no provision for income taxes had been recorded for The Ex One Company, LLC as its individual members were taxed based on their proportionate share of taxable income. Upon conversion, The ExOne Company will be taxed as a corporation for U.S. federal, state, local and foreign income tax purposes. On January 1, 2013, the Company recorded a net deferred tax asset of approximately $213 based on the difference between the book and tax basis of assets and liabilities as of that date. Due to a history of operating losses at the subsidiary level, a valuation allowance of 100% of the net deferred tax asset was established.
Settlement of Preferred Unit Dividends
On January 23, 2013, the Company settled an accrued dividend with certain preferred unitholders of the former limited liability company in the amount of approximately $1,437. Of this amount, approximately $304 was settled in cash with the remaining $1,133 converted by the principal preferred unitholder (also the majority member of the former limited liability company) to additional amounts due under the demand note payable to member. The demand note payable to member was fully repaid on February 14, 2013 (see “Long-Term Debt Repayments” below).
2013 Equity Incentive Plan
On January 24, 2013, the Board of Directors of the Company adopted the 2013 Equity Incentive Plan (the Plan). In connection with the adoption of the Plan, 500,000 shares of common stock were reserved for issuance pursuant to the Plan, with automatic increases in such reserve available each year annually on January 1 from 2014 through 2023 equal to the lesser of (i) 3.0% of the total outstanding shares of common stock as of December 31 of the immediately preceding year or (ii) a number of shares of common stock determined by the Board of Directors, provided that the maximum number of shares authorized under the Plan will not exceed 1,992,242 shares, subject to certain adjustments. On January 24, 2013, the Board of Directors authorized awards of 180,000 incentive stock options (ISOs) under the Plan to certain employees contemporaneously with the IPO at an exercise price determined by the IPO offering price, which was $18.00 per share. These awards vest on a cumulative annual basis over a three year period and the ISOs fully expire on February 6, 2023.
Initial Public Offering of The ExOne Company
On February 6, 2013, the Company’s registration statement on Form S-1 (File No 333-185933) was declared effective for the Company’s IPO, pursuant to which the Company registered the offering and sale of 6,095,000 shares of common stock at a public offering price of $18.00 per share for an aggregate offering price of $109,710.
As a result of the offering, the Company received net proceeds of approximately $91,996, after deducting underwriting discounts and commissions. Following the receipt of net proceeds, the Company paid offering expenses of approximately $1,600.
Long-Term Debt Repayments
On February 14, 2013, the Company repaid outstanding amounts due on the demand note payable to member (Note 8) of approximately $9,800 (including accrued interest). Following this repayment, the demand note payable to member was retired. Separately, on February 14, 2013, the Company repaid $300 to retire its building note payable with an unrelated party (Note 9). There were no prepayment penalties or gains or losses associated with this early retirement of debt.
F-26
Table of Contents
TMF and Lone Star Asset Acquisition
On March 27, 2013, a wholly-owned subsidiary of the Company, ExOne Americas LLC, a Delaware limited liability company, acquired certain assets, including property and equipment (principally land, buildings and machinery and equipment) held by two variable interest entities of the Company, TMF and Lone Star, and assumed all outstanding debt of such variable interest entities, including certain related interest rate swap agreements.
Payment of approximately $1,900 was made to TMF and approximately $200 was made to Lone Star, including a return of capital to the majority member of the former limited liability company of approximately $1,400. There was no gain or loss or goodwill generated as a result of this transaction. Simultaneous with the completion of this transaction, the Company also repaid all of the outstanding debt and settled the related interest rate swap agreements assumed from the variable interest entities, resulting in a payment of approximately $4,700.
F-27
Table of Contents
The ExOne Company and Subsidiaries (formerly The Ex One Company, LLC and Subsidiaries)
Condensed Statement of Consolidated Operations and Comprehensive Loss (Unaudited)
(in thousands, except per-share amounts)
| Quarter Ended June 30, |
Six Months Ended June 30, |
|||||||||||||||
| 2013 | 2012 | 2013 | 2012 | |||||||||||||
| Revenue |
$ | 9,230 | $ | 4,676 | $ | 17,164 | $ | 7,398 | ||||||||
| Cost of sales |
5,049 | 3,153 | 10,145 | 5,059 | ||||||||||||
|
|
|
|
|
|
|
|
|
|||||||||
| Gross profit |
4,181 | 1,523 | 7,019 | 2,339 | ||||||||||||
| Operating expenses |
||||||||||||||||
| Research and development |
1,276 | 348 | 2,132 | 832 | ||||||||||||
| Selling, general and administrative |
3,908 | 4,262 | 7,476 | 5,948 | ||||||||||||
|
|
|
|
|
|
|
|
|
|||||||||
| 5,184 | 4,610 | 9,608 | 6,780 | |||||||||||||
|
|
|
|
|
|
|
|
|
|||||||||
| Loss from operations |
(1,003 | ) | (3,087 | ) | (2,589 | ) | (4,441 | ) | ||||||||
| Other (income) expense |
||||||||||||||||
| Interest expense |
50 | 110 | 280 | 308 | ||||||||||||
| Other (income) expense - net |
(5 | ) | 18 | (64 | ) | (27 | ) | |||||||||
|
|
|
|
|
|
|
|
|
|||||||||
| 45 | 128 | 216 | 281 | |||||||||||||
|
|
|
|
|
|
|
|
|
|||||||||
| Loss before income taxes |
(1,048 | ) | (3,215 | ) | (2,805 | ) | (4,722 | ) | ||||||||
| Provision for income taxes* |
72 | 246 | 91 | 234 | ||||||||||||
|
|
|
|
|
|
|
|
|
|||||||||
| Net loss |
(1,120 | ) | (3,461 | ) | (2,896 | ) | (4,956 | ) | ||||||||
| Less: Net income attributable to noncontrolling interests |
— | 148 | 138 | 182 | ||||||||||||
|
|
|
|
|
|
|
|
|
|||||||||
| Net loss attributable to ExOne |
$ | (1,120 | ) | $ | (3,609 | ) | $ | (3,034 | ) | $ | (5,138 | ) | ||||
|
|
|
|
|
|
|
|
|
|||||||||
| Net loss attributable to ExOne per common share: |
||||||||||||||||
| Basic |
$ | (0.08 | ) | N/A | * | $ | (0.27 | ) | N/A | * | ||||||
| Diluted |
(0.08 | ) | N/A | * | (0.27 | ) | N/A | * | ||||||||
| Comprehensive loss: |
||||||||||||||||
| Net loss attributable to ExOne |
$ | (1,120 | ) | $ | (3,609 | ) | $ | (3,034 | ) | $ | (5,138 | ) | ||||
| Other comprehensive loss: |
||||||||||||||||
| Foreign currency translation adjustments |
(616 | ) | (257 | ) | (757 | ) | (317 | ) | ||||||||
|
|
|
|
|
|
|
|
|
|||||||||
| Comprehensive loss |
(1,736 | ) | (3,866 | ) | (3,791 | ) | (5,455 | ) | ||||||||
| Less: Comprehensive loss attributable to noncontrolling interests |
— | — | — | — | ||||||||||||
|
|
|
|
|
|
|
|
|
|||||||||
| Comprehensive loss attributable to ExOne |
$ | (1,736 | ) | $ | (3,866 | ) | $ | (3,791 | ) | $ | (5,455 | ) | ||||
|
|
|
|
|
|
|
|
|
|||||||||
| * | Information not comparable for the quarter and six months ended June 30, 2012 as a result of the Reorganization of the Company as a corporation on January 1, 2013 (Note 1). |
The accompanying notes are an integral part of these unaudited condensed consolidated financial statements.
F-28
Table of Contents
The ExOne Company and Subsidiaries (formerly The Ex One Company, LLC and Subsidiaries)
Condensed Consolidated Balance Sheets (Unaudited)
(in thousands, except share and unit amounts)
| June 30, 2013 |
December 31, 2012 |
|||||||
| Assets |
||||||||
| Current assets: |
||||||||
| Cash and cash equivalents |
$ | 64,550 | $ | 2,802 | ||||
| Accounts receivable - net of allowance of $75 (2013) and $83 (2012) |
5,672 | 8,413 | ||||||
| Inventories - net |
8,765 | 7,485 | ||||||
| Prepaid expenses and other current assets |
2,346 | 1,543 | ||||||
|
|
|
|
|
|||||
| Total current assets |
81,333 | 20,243 | ||||||
| Property and equipment - net |
14,309 | 12,467 | ||||||
| (Including amounts attributable to consolidated variable interest entities of $5,567 at December 31, 2012) |
||||||||
| Deferred income taxes |
— | 178 | ||||||
| Other noncurrent assets |
476 | 187 | ||||||
|
|
|
|
|
|||||
| Total assets |
$ | 96,118 | $ | 33,075 | ||||
|
|
|
|
|
|||||
| Liabilities |
||||||||
| Current liabilities: |
||||||||
| Line of credit |
$ | — | $ | 528 | ||||
| Demand note payable to member |
— | 8,666 | ||||||
| Current portion of long-term debt |
124 | 2,028 | ||||||
| (Including amounts attributable to consolidated variable interest entities of $1,913 at December 31, 2012) |
||||||||
| Current portion of capital and financing leases |
507 | 920 | ||||||
| Accounts payable |
1,387 | 2,451 | ||||||
| Accrued expenses and other current liabilities |
4,660 | 4,436 | ||||||
| Preferred unit dividends payable |
— | 1,437 | ||||||
| Deferred income taxes |
— | 178 | ||||||
| Deferred revenue and customer prepayments |
1,980 | 4,281 | ||||||
|
|
|
|
|
|||||
| Total current liabilities |
8,658 | 24,925 | ||||||
| Long-term debt - net of current portion |
2,146 | 5,669 | ||||||
| (Including amounts attributable to consolidated variable interest entities of $3,150 at December 31, 2012) |
||||||||
| Capital and financing leases - net of current portion |
722 | 1,949 | ||||||
| Other noncurrent liabilities |
398 | 491 | ||||||
|
|
|
|
|
|||||
| Total liabilities |
11,924 | 33,034 | ||||||
| Commitments and contingencies |
||||||||
| Stockholders’ / Members’ Equity (Deficit) |
||||||||
| ExOne stockholders’ / members’ deficit: |
||||||||
| Common stock, $0.01 par value, 200,000,000 shares authorized, 13,281,608 shares issued and outstanding |
133 | — | ||||||
| Additional paid-in capital |
88,026 | — | ||||||
| Accumulated deficit |
(3,034 | ) | — | |||||
| Preferred units, $1.00 par value, 18,983,602 units issued and outstanding |
— | 18,984 | ||||||
| Common units, $1.00 par value, 10,000,000 units issued and outstanding |
— | 10,000 | ||||||
| Members’ deficit |
— | (31,355 | ) | |||||
| Accumulated other comprehensive loss |
(931 | ) | (174 | ) | ||||
|
|
|
|
|
|||||
| Total ExOne stockholders’ / members’ equity (deficit) |
84,194 | (2,545 | ) | |||||
| Noncontrolling interests |
— | 2,586 | ||||||
|
|
|
|
|
|||||
| Total stockholders’ / members’ equity |
84,194 | 41 | ||||||
|
|
|
|
|
|||||
| Total liabilities and stockholders’ / members’ equity |
$ | 96,118 | $ | 33,075 | ||||
|
|
|
|
|
|||||
The accompanying notes are an integral part of these unaudited condensed consolidated financial statements.
F-29
Table of Contents
The ExOne Company and Subsidiaries (formerly The Ex One Company, LLC and Subsidiaries)
Condensed Statement of Consolidated Cash Flows (Unaudited)
(in thousands)
| Six Months Ended June 30, |
||||||||
| 2013 | 2012 | |||||||
| Operating activities |
||||||||
| Net loss |
$ | (2,896 | ) | $ | (4,956 | ) | ||
| Adjustments to reconcile net loss to cash used for operations: |
||||||||
| Depreciation |
1,096 | 805 | ||||||
| Equity-based compensation |
311 | 1,785 | ||||||
| Changes in assets and liabilities, excluding effects of foreign currency translation adjustments: |
||||||||
| (Increase) decrease in accounts receivable |
2,589 | (2,082 | ) | |||||
| (Increase) decrease in inventories |
(2,542 | ) | (3,989 | ) | ||||
| (Increase) decrease in prepaid expenses and other assets |
(1,804 | ) | (673 | ) | ||||
| Increase (decrease) in accounts payable |
(1,461 | ) | 841 | |||||
| Increase (decrease) in accrued expenses and other liabilities |
217 | (226 | ) | |||||
| Increase (decrease) in deferred revenue and customer prepayments |
(2,643 | ) | 997 | |||||
|
|
|
|
|
|||||
| Cash used for operating activities |
(7,133 | ) | (7,498 | ) | ||||
| Investing activities |
||||||||
| Capital expenditures |
(1,548 | ) | (1,518 | ) | ||||
| Deconsolidation of noncontrolling interests in variable interest entities |
(2,327 | ) | — | |||||
|
|
|
|
|
|||||
| Cash used for investing activities |
(3,875 | ) | (1,518 | ) | ||||
| Financing activities |
||||||||
| Net proceeds from issuance of common stock |
91,083 | — | ||||||
| Net change in line of credit borrowings |
(528 | ) | 913 | |||||
| Net change in demand note payable to member |
(9,885 | ) | 5,479 | |||||
| Proceeds from financing leases |
— | 985 | ||||||
| Payments on long-term debt |
(5,427 | ) | (996 | ) | ||||
| Payments on capital and financing leases |
(1,905 | ) | (239 | ) | ||||
| Payment of preferred stock dividends |
(456 | ) | — | |||||
|
|
|
|
|
|||||
| Cash provided by financing activities |
72,882 | 6,142 | ||||||
| Effect of exchange rate changes on cash and cash equivalents |
(126 | ) | (28 | ) | ||||
|
|
|
|
|
|||||
| Net change in cash and cash equivalents |
61,748 | (2,902 | ) | |||||
| Cash and cash equivalents at beginning of period |
2,802 | 3,496 | ||||||
|
|
|
|
|
|||||
| Cash and cash equivalents at end of period |
$ | 64,550 | $ | 594 | ||||
|
|
|
|
|
|||||
| Supplemental disclosure of noncash investing and financing activities |
||||||||
| Property and equipment acquired through financing arrangements |
$ | 282 | $ | 3,170 | ||||
|
|
|
|
|
|||||
| Transfer of inventories to property and equipment for internal use |
$ | 1,523 | $ | 893 | ||||
|
|
|
|
|
|||||
| Transfer of property and equipment to inventories for sale |
$ | 261 | $ | 336 | ||||
|
|
|
|
|
|||||
| Reorganization of The Ex One Company, LLC with and into The ExOne Company |
$ | 2,371 | $ | — | ||||
|
|
|
|
|
|||||
| Conversion of preferred stock dividends payable and accrued interest to principal amounts due under the demand note payable to member |
$ | 1,219 | $ | 176 | ||||
|
|
|
|
|
|||||
| Deconsolidation of noncontrolling interests in variable interest entities |
$ | 397 | $ | — | ||||
|
|
|
|
|
|||||
| Reclassification of redeemable preferred units to preferred units |
$ | — | $ | 18,984 | ||||
|
|
|
|
|
|||||
| Preferred unit dividends declared but unpaid |
$ | — | $ | 632 | ||||
|
|
|
|
|
|||||
The accompanying notes are an integral part of these unaudited condensed consolidated financial statements.
F-30
Table of Contents
The ExOne Company and Subsidiaries (formerly The Ex One Company, LLC and Subsidiaries)
Condensed Statement of Changes in Consolidated Stockholders’ / Members’ Equity (Deficit) (Unaudited)
(in thousands)
| ExOne unitholders / stockholders | ||||||||||||||||||||||||||||||||||||||||
| Preferred units |
Common units |
Members’ deficit |
Preferred stock |
Common stock |
Additional paid-in capital |
Accumulated deficit |
Accumulated other comprehensive loss |
Noncontrolling interests |
Total stockholders / members’ equity (deficit) |
|||||||||||||||||||||||||||||||
| Balance at December 31, 2011 |
$ | — | $ | 10,000 | $ | (27,485 | ) | $ | — | $ | — | $ | — | $ | — | $ | (220 | ) | $ | 2,106 | $ | (15,599 | ) | |||||||||||||||||
| Preferred unit reclassification |
18,984 | — | — | — | — | — | — | — | — | 18,984 | ||||||||||||||||||||||||||||||
| Preferred unit dividends |
— | — | (632 | ) | — | — | — | — | — | — | (632 | ) | ||||||||||||||||||||||||||||
| Equity-based compensation |
— | — | 1,785 | — | — | — | — | — | — | 1,785 | ||||||||||||||||||||||||||||||
| Net loss |
— | — | (5,138 | ) | — | — | — | — | — | 182 | (4,956 | ) | ||||||||||||||||||||||||||||
| Other comprehensive loss |
— | — | — | — | — | — | — | (317 | ) | — | (317 | ) | ||||||||||||||||||||||||||||
|
|
|
|
|
|
|
|
|
|
|
|
|
|
|
|
|
|
|
|
|
|||||||||||||||||||||
| Balance at June 30, 2012 |
$ | 18,984 | $ | 10,000 | $ | (31,470 | ) | $ | — | $ | — | $ | — | $ | — | $ | (537 | ) | $ | 2,288 | $ | (735 | ) | |||||||||||||||||
|
|
|
|
|
|
|
|
|
|
|
|
|
|
|
|
|
|
|
|
|
|||||||||||||||||||||
| Balance at December 31, 2012 |
$ | 18,984 | $ | 10,000 | $ | (31,355 | ) | $ | — | $ | — | $ | — | $ | — | $ | (174 | ) | $ | 2,586 | $ | 41 | ||||||||||||||||||
| Reorganization of The Ex One Company, LLC with and into The ExOne Company |
(18,984 | ) | (10,000 | ) | 31,355 | 190 | 58 | (2,619 | ) | — | — | — | — | |||||||||||||||||||||||||||
|
|
|
|
|
|
|
|
|
|
|
|
|
|
|
|
|
|
|
|
|
|||||||||||||||||||||
| Balance at January 1, 2013 |
— | — | — | 190 | 58 | (2,619 | ) | — | (174 | ) | 2,586 | 41 | ||||||||||||||||||||||||||||
| Preferred stock dividends |
— | — | — | — | — | (152 | ) | — | — | — | (152 | ) | ||||||||||||||||||||||||||||
| Conversion of preferred stock to common stock |
— | — | — | (190 | ) | 20 | 170 | — | — | — | — | |||||||||||||||||||||||||||||
| Issuance of common stock in The ExOne Company, net of issuance costs |
— | — | — | — | 55 | 90,316 | — | — | — | 90,371 | ||||||||||||||||||||||||||||||
| Equity-based compensation |
— | — | — | — | — | 311 | — | — | — | 311 | ||||||||||||||||||||||||||||||
| Net loss |
— | — | — | — | — | — | (3,034 | ) | — | 138 | (2,896 | ) | ||||||||||||||||||||||||||||
| Other comprehensive loss |
— | — | — | — | — | — | — | (757 | ) | — | (757 | ) | ||||||||||||||||||||||||||||
| Deconsolidation of noncontrolling interests in variable interest entities |
— | — | — | — | — | — | — | — | (2,724 | ) | (2,724 | ) | ||||||||||||||||||||||||||||
|
|
|
|
|
|
|
|
|
|
|
|
|
|
|
|
|
|
|
|
|
|||||||||||||||||||||
| Balance at June 30, 2013 |
$ | — | $ | — | $ | — | $ | — | $ | 133 | $ | 88,026 | $ | (3,034 | ) | $ | (931 | ) | $ | — | $ | 84,194 | ||||||||||||||||||
|
|
|
|
|
|
|
|
|
|
|
|
|
|
|
|
|
|
|
|
|
|||||||||||||||||||||
The accompanying notes are an integral part of these unaudited condensed consolidated financial statements.
F-31
Table of Contents
The ExOne Company and Subsidiaries (formerly The Ex One Company, LLC and Subsidiaries)
Notes to the Condensed Consolidated Financial Statements (Unaudited)
(dollars in thousands, except per-share, share and unit amounts)
| Note 1. | Basis of Presentation, Principles of Consolidation and Going Concern |
The ExOne Company (“ExOne”) is a corporation organized under the laws of the state of Delaware. ExOne was formed on January 1, 2013, when The Ex One Company, LLC, a Delaware limited liability company, merged with and into a Delaware corporation, which survived and changed its name to The ExOne Company (the “Reorganization”). As a result of the Reorganization, The Ex One Company, LLC became ExOne, the common and preferred interest holders of The Ex One Company, LLC became holders of common stock and preferred stock, respectively, of ExOne, and the subsidiaries of The Ex One Company, LLC became the subsidiaries of ExOne.
The Company has considered the proforma effects of its Reorganization on the provision for income taxes for both the quarter and six months ended June 30, 2012, in its condensed statement of consolidated operations and comprehensive loss and concluded that there would be no difference as compared to the amount reported, principally due to valuation allowances established against net deferred tax assets (Note 13). In addition, the Company has omitted basic and diluted earnings per share for both the quarter and six months ended June 30, 2012, as a result of the Reorganization, as the basis for such calculation is no longer comparable to current period presentation.
The condensed consolidated financial statements include the accounts of ExOne, its wholly-owned subsidiaries, ExOne Americas LLC (United States), ExOne GmbH (Germany) and Ex One KK (Japan), and through March 27, 2013 (see further description below) two variable interest entities (“VIEs”) in which ExOne was identified as the primary beneficiary, Lone Star Metal Fabrication, LLC (“Lone Star”) and Troy Metal Fabricating, LLC (“TMF”). Collectively, the consolidated group is referred to as the “Company.”
At December 31, 2012 and through March 27, 2013, ExOne leased property and equipment from Lone Star and TMF. ExOne did not have an ownership interest in Lone Star or TMF. ExOne was identified as the primary beneficiary of Lone Star and TMF in accordance with the guidance issued by the Financial Accounting Standards Board (“FASB”) on the consolidation of VIEs, as ExOne guaranteed certain long-term debt of both Lone Star and TMF and governed these entities through common ownership. This guidance requires certain VIEs to be consolidated when an enterprise has the power to direct the activities of the VIE that most significantly impact VIE economic performance and who has the obligation to absorb losses or the right to receive benefits of the VIE that could potentially be significant to the VIE. The condensed consolidated financial statements therefore include the accounts of Lone Star and TMF through March 27, 2013. The assets of Lone Star and TMF could only be used to settle obligations of Lone Star and TMF, and the creditors of Lone Star and TMF did not have recourse to the general credit of ExOne.
On March 27, 2013, ExOne Americas LLC acquired certain assets, including property and equipment (principally land, buildings and machinery and equipment) held by the two VIEs, and assumed all outstanding debt of such VIEs (Note 4). Following this transaction, neither of the entities continued to meet the definition of a VIE with respect to ExOne, and as a result, the remaining assets and liabilities of both entities were deconsolidated following the transaction.
On February 6, 2013, the Company commenced an initial public offering of 6,095,000 shares of its common stock at a price to the public of $18.00 per share, of which 5,483,333 shares were sold by the Company and 611,667 were sold by a selling stockholder (including consideration of the exercise of the underwriters’ over-allotment option). Following completion of the offering on February 12, 2013, the Company received net proceeds of approximately $90,371 (net of underwriting commissions and associated offering costs, including approximately $712 in offering costs deferred by the Company at December 31, 2012).
F-32
Table of Contents
The condensed consolidated financial statements of the Company are unaudited. The condensed consolidated financial statements include all adjustments, consisting of normal recurring adjustments, considered necessary by management to fairly state the results of operations, financial position and cash flows of the Company. All material intercompany transactions and balances have been eliminated in consolidation. The results reported in these condensed consolidated financial statements are not necessarily indicative of the results that may be expected for the entire year. The December 31, 2012 condensed consolidated balance sheet data was derived from the audited financial statements but does not include all disclosures required by accounting principles generally accepted in the United States of America (“GAAP”). This Quarterly Report on Form 10-Q should be read in connection with the Company’s Annual Report on Form 10-K for the year ended December 31, 2012.
The Company has incurred net losses of approximately $9,688, $7,617 and $5,180 for the years ended December 31, 2012, 2011 and 2010, respectively. As shown in the accompanying condensed consolidated financial statements, the Company incurred a net loss of approximately $1,120 and $2,896 for the quarter and six months ended June 30, 2013. Prior to Reorganization the Company operated as a limited liability company and was substantially supported by the continued financial support provided by its majority member. These conditions raised substantial doubt as to the Company’s ability to continue as a going concern. As noted above, in connection with the completion of its initial public offering in February 2013, the Company received unrestricted net proceeds from the sale of its common stock of approximately $90,371. Management believes that the unrestricted net proceeds obtained through this transaction have alleviated the substantial doubt and will be sufficient to support the Company’s operations through July 1, 2014.
| Note 2. | Recently Issued Accounting Guidance |
In February 2013, the FASB issued guidance changing the requirements of companies reporting of amounts reclassified out of accumulated other comprehensive income (loss). These changes require an entity to report the effect of significant reclassifications out of accumulated other comprehensive income (loss) on the respective line items in net income (loss) if the amount being reclassified is required to be reclassified in its entirety to net income (loss). For other amounts that are not required to be reclassified in their entirety to net income (loss) in the same reporting period, an entity is required to cross-reference other disclosures that provide additional detail about those amounts. These requirements are to be applied to each component of accumulated other comprehensive income (loss). This change becomes effective for the Company on January 1, 2014. Other than the additional disclosure requirements, management has determined that the adoption of these changes will not have an impact on the consolidated financial statements of the Company.
In July 2013, the FASB issued guidance clarifying the presentation of unrecognized tax benefits when a net operating loss carryforward, a similar tax loss or a tax credit carryforward exists. The amendment requires that unrecognized tax benefits be presented in the consolidated financial statements as a reduction to a deferred tax asset for a net operating loss carryforward, a similar tax loss, or a tax credit carryforward, unless certain exceptions exist. This change becomes effective for the Company on January 1, 2015. The adoption of this guidance is not expected to have a material impact on the consolidated financial statements of the Company.
| Note 3. | Computation of Net Loss Attributable to ExOne Per Common Share |
The Company presents basic and diluted loss per common share amounts. Basic loss per share is calculated by dividing net loss available to ExOne common shareholders by the weighted average number of common shares outstanding during the applicable period. Diluted loss per share is calculated by dividing net loss available to ExOne common shareholders by the weighted average number of common shares and common equivalent shares outstanding during the applicable period.
The weighted average shares outstanding for both the quarter and six months ended June 30, 2013, include (i) the exchange of common units in the former limited liability company for common shares in the Company on a 0.58:1.00 basis in connection with the Reorganization of the Company on January 1, 2013, (ii) the issuance of
F-33
Table of Contents
5,483,333 common shares in connection with the commencement of the initial public offering of the Company on February 6, 2013, and (iii) the conversion of preferred shares to common shares in the Company on a 9.5:1.0 basis in connection with the closing of the initial public offering of the Company on February 12, 2013.
As ExOne incurred a net loss during both the quarter and six months ended June 30, 2013, basic average shares outstanding and diluted average shares outstanding were the same because the effect of potential shares of common stock, including incentive stock options and restricted stock issued (Note 11), was anti-dilutive.
The information used to compute basic and diluted net loss attributable to ExOne per common share was as follows:
| Quarter Ended June 30, 2013 |
Six Months Ended June 30, 2013 |
|||||||
| Net loss attributable to ExOne |
$ | (1,120 | ) | $ | (3,034 | ) | ||
| Less: Preferred stock dividends declared |
— | (152 | ) | |||||
|
|
|
|
|
|||||
| Net loss available to ExOne common shareholders |
$ | (1,120 | ) | $ | (3,186 | ) | ||
|
|
|
|
|
|||||
| Weighted average shares outstanding (basic and diluted) |
13,281,608 | 11,697,018 | ||||||
| Net loss attributable to ExOne per common share: |
||||||||
| Basic |
$ | (0.08 | ) | $ | (0.27 | ) | ||
| Diluted |
(0.08 | ) | (0.27 | ) | ||||
The Company has omitted basic and diluted earnings per share for the quarter and six months ended June 30, 2012, as a result of the Reorganization (Note 1), as the basis for such calculation is no longer comparable to current period presentation.
| Note 4. | Acquisition of Net Assets of Variable Interest Entities |
On March 27, 2013, ExOne Americas LLC acquired certain assets, including property and equipment (principally land, buildings and machinery and equipment) held by two VIEs of the Company, TMF and Lone Star, and assumed all outstanding debt of such VIEs.
Payments of approximately $1,900 and $200 were made to TMF and Lone Star, respectively, including a return of capital to the entities of approximately $1,400. As the parties subject to this transaction were determined to be under common control, property and equipment acquired in the transaction were recorded at their net carrying value on the date of acquisition (approximately $5,400) similar to a pooling-of-interests. As the VIEs were consolidated by the Company in previous periods, no material differences exist due to the change in reporting entity, and as such, no restatement of prior period financial statements on a combined basis is considered necessary. There was no gain or loss or goodwill generated as a result of this transaction, as the total purchase price was equal to the net book value of assets at the VIE level (previously consolidated by the Company). Simultaneous with the completion of this transaction, the Company also repaid all of the outstanding debt assumed from the VIEs, resulting in a payment of approximately $4,700. Subsequent to this transaction, neither TMF or Lone Star continued to meet the definition of a VIE with respect to ExOne, and as a result, the remaining assets and liabilities of both entities were deconsolidated following the transaction, resulting in a reduction to equity (through noncontrolling interest) of approximately $2,700.
F-34
Table of Contents
| Note 5. | Inventories |
| June 30, 2013 |
December 31, 2012 |
|||||||
| Raw materials and components |
$ | 3,906 | $ | 4,892 | ||||
| Work in process |
3,536 | 2,098 | ||||||
| Finished goods |
1,323 | 495 | ||||||
|
|
|
|
|
|||||
| $ | 8,765 | $ | 7,485 | |||||
|
|
|
|
|
|||||
At June 30, 2013 and December 31, 2012, the allowance for slow-moving and obsolete inventories was approximately $859 and $891, respectively, and has been reflected as a reduction to inventories (raw materials and components).
| Note 6. | Line of Credit |
The Company has a line of credit and security agreement with a German bank collateralized by certain assets of the Company for approximately $1,700 (€1,300). In addition to the collateralization of assets against this facility, the line of credit and security agreement was also previously guaranteed by the Chairman and Chief Executive Officer (“CEO”) of the Company. On July 19, 2013, the bank removed this guarantee from the arrangement. There were no changes to available borrowing capacity or interest rates as a result of the removal of the guarantee.
Of the total amount available under this facility, approximately $650 (€500) is available for short-term borrowings or cash advances (overdrafts). Both short-term borrowings and overdrafts are subject to variable interest rates as determined by the bank. At June 30, 2013, interest rates were 2.51% for short-term borrowings and 6.20% for overdrafts. There is no commitment fee associated with this agreement. At June 30, 2013, the Company had no outstanding short-term borrowings. At December 31, 2012, the Company had outstanding short-term borrowings of $528 (€400). At June 30, 2013 and December 31, 2012, there were no outstanding overdraft amounts.
Amounts in excess of the amounts available for short-term borrowings and overdrafts are available for additional bank transactions requiring security (i.e. bank guarantees, leasing, letters of credit, etc.). Amounts covered under the security agreement accrue interest at 1.75%. There is no charge for unused amounts under the security agreement. At June 30, 2013 and December 31, 2012, the Company had transactions guaranteed by the security agreement of $343 (€264) and $757 (€573), respectively.
| Note 7. | Demand Note Payable to Member |
The Company has received cash advances to support its operations from an entity controlled by the majority member of the former limited liability company (also the Chairman and CEO of the Company). These cash advances accrued interest at 8.0% annually and were payable on demand. The Company formalized these cash advances in the form of a line of credit with the entity in 2012.
At December 31, 2012, the line of credit balance outstanding on these advances, including accrued interest, was approximately $8,666. In January and February 2013, approximately $1,219 in additional amounts (including accrued interest) were added to the outstanding line of credit, including the conversion of preferred stock dividends payable of approximately $1,133 by the principal preferred stock holder (also the majority member of the former limited liability company and Chairman and CEO of the Company) to amounts payable under the line of credit. On February 14, 2013, the Company repaid all outstanding amounts on the line of credit (approximately $9,885) and retired the arrangement.
F-35
Table of Contents
| Note 8. | Long-Term Debt |
Long-term debt consists of the following:
| June 30, 2013 |
December 31, 2012 |
|||||||
| ExOne |
||||||||
| Building note payable to a bank, with monthly payments of $18 including interest at 4.00% through May 2017 and subsequently, the monthly average yield on U.S. Treasury Securities plus 3.25% for the remainder of the term through May 2027. |
$ | 2,270 | $ | 2,334 | ||||
| Building note payable to an unrelated entity, with monthly payments including interest at 6.00% through June 2014. |
— | 300 | ||||||
| Lone Star Metal Fabrication, LLC |
||||||||
| Building note payable to a bank, with monthly payments including interest at 7.00% through July 2014. |
— | 727 | ||||||
| Troy Metal Fabricating, LLC |
||||||||
| Equipment note payable to a bank, with monthly payments including interest at one-month BBA LIBOR plus 3.00% (3.21% at December 31, 2012) through December 2017. |
— | 1,193 | ||||||
| Equipment note payable to a bank, with monthly payments including interest at 4.83% through December 2016. |
— | 1,056 | ||||||
| Equipment line of credit to a bank, converted to term debt in January 2012; monthly payments including interest at one-month BBA LIBOR plus 2.75% (2.96% at December 31, 2012) through December 2016. |
— | 886 | ||||||
| Building note payable to a bank, with monthly payments including interest at one-month BBA LIBOR plus 2.45% (2.66% at December 31, 2012) through April 2013. Interest is fixed at 6.80% under a related interest rate swap agreement. |
— | 760 | ||||||
| Equipment note payable to a bank, with monthly payments including interest at one-month BBA LIBOR plus 2.75% (2.96% at December 31, 2012) through January 2014. Interest is fixed at 6.68% under a related interest rate swap agreement. |
— | 228 | ||||||
| Equipment note payable to a bank, with monthly payments including interest at one-month BBA LIBOR plus 2.75% (2.96% at December 31, 2012) through April 2013. |
— | 213 | ||||||
|
|
|
|
|
|||||
| 2,270 | 7,697 | |||||||
| Less: Current portion of long-term debt |
124 | 2,028 | ||||||
|
|
|
|
|
|||||
| $ | 2,146 | $ | 5,669 | |||||
|
|
|
|
|
|||||
F-36
Table of Contents
On February 14, 2013, the Company repaid $300 to retire its building note payable to an unrelated entity. There were no prepayment penalties or gains or losses associated with this early retirement of debt.
On March 27, 2013, in connection with the acquisition of certain net assets of the Lone Star and TMF VIEs (Note 4), the Company assumed and repaid all amounts outstanding on Lone Star and TMF debt (approximately $4,700). There were no prepayment penalties or gains or losses associated with this early retirement of debt.
Prior to deconsolidation, the Company, through its VIEs, entered into certain interest rate swap agreements with a bank. The Company utilized the interest rate swaps for the purpose of managing risks related to the variability of future earnings and cash flows caused by changes in interest rates. Under the terms of the agreements, the Company agreed to pay interest at fixed rates and receive variable interest from the counterparty.
At December 31, 2012, the fair value of the interest rate swaps was a liability of approximately $13. These obligations are included in accrued expenses and other current liabilities in the condensed consolidated balance sheets. Gains (losses) on interest rate swap contracts are recorded as a component of interest expense in the condensed statement of consolidated operations and comprehensive loss.
| Note 9. | Capital and Financing Leases |
In January 2013, the Company entered into an equipment leasing arrangement with a bank. Terms of the agreement include monthly payments of $5 over a five-year period beginning in January 2013 and a bargain purchase option at the end of the lease term. As a result, this agreement was determined to be a capital lease. The present value of future minimum lease payments, including an interest rate of 4.4%, was approximately $252 at June 30, 2013.
In November 2012, the Company entered into a sale-leaseback transaction with a bank for a 3D printing machine. Due to continuing involvement outside of the normal leaseback by the Company, this transaction has been accounted for as a financing lease. Under the terms of the agreement, the Company received proceeds of approximately $974 (€737) with repayment of the lease occurring over a three-year period beginning in January 2013. The present value of the future minimum lease payments, including an interest rate of 6.0%, was approximately $548 (€421) and $853 (€646) at June 30, 2013 and December 31, 2012, respectively.
In July 2012, the Company entered into a sale-leaseback transaction with a related party for a 3D printing machine. Based on the economic substance of the transaction between the parties, this transaction was accounted for as a financing lease. Under the terms of the agreement, the Company received proceeds of approximately $1,553 with repayment of the lease occurring over a five-year period beginning in August 2012. On April 4, 2013, the Company settled this financing lease obligation for a cash payment of approximately $1,372 (including accrued interest). There were no prepayment penalties or gains or losses associated with this settlement.
In March 2012, the Company entered into a sale-leaseback transaction with a bank for a 3D printing machine. Due to continuing involvement outside of the normal leaseback by the Company, this transaction has been accounted for as a financing lease. Under the terms of the agreement, the Company received proceeds of approximately $985 (€739) with repayment of the lease occurring over a three-year period beginning in April 2012. The present value of the future minimum lease payments, including an interest rate of 6.0%, was approximately $429 (€330) and $553 (€418) at June 30, 2013 and December 31, 2012, respectively.
| Note 10. | Common Units, Preferred Units, Preferred Stock and Common Stock |
Common Units
At December 31, 2012, the Company had 10,000,000 common units issued and outstanding.
Net income (loss) was allocated to each common unitholder in proportion to the units held by each common unitholder relative to the total units outstanding. The common unitholders shared the Company’s positive cash
F-37
Table of Contents
flow, to the extent available, which was distributed annually and allocated among the common unitholders in proportion to the units held by each common unitholder relative to the total units outstanding. Common unitholders were entitled to one vote per unit on all matters.
On January 1, 2013, in connection with the Reorganization of the Company (Note 1), common units in the former limited liability company were exchanged for 5,800,000 shares of common stock.
Preferred Units and Preferred Stock
On December 30, 2011, the Company entered into a debt conversion agreement with the majority member of the former limited liability company to convert $18,984 of unpaid principal and interest on a demand note payable to member into redeemable preferred units of the Company in full satisfaction of the indebtedness. Accordingly, 18,983,602 in redeemable preferred units were issued at a conversion price of $1.00 per share.
The preferred units were non-voting limited liability company membership interests, and permitted the majority member (unitholder) to receive cumulative dividends at the annual rate of 8.0% per unit prior to, and in preference to, any declaration or payment of any dividend on the Company’s common units. Dividends on the preferred units accumulated and were payable irrespective of whether the Company had earnings, whether there were funds legally available for the payment of such dividends, and whether dividends were declared.
The Company had the option to redeem all or any number of the preferred units at any time upon written notice and payment to the unitholder of $1.00 plus all accrued but unpaid dividends for each unit being redeemed. The unitholder had the option to convert all or any number of preferred units to common units at the conversion rate of 9.5 preferred units for 1.0 common unit. Preferred units were designed to automatically convert to 1,998,275 common units upon the closing of any initial public offering in which the gross proceeds of the offering exceeded $50,000 provided that the unitholder elected to retain such units. The Company analyzed the conversion feature under the applicable FASB guidance for accounting for derivatives and concluded that the conversion feature did not require separate accounting under such FASB guidance.
Because the unitholder was also the majority member of the Company at December 31, 2011, he had the ability to redeem the preferred units at his option, thus giving the units characteristics of a liability rather than equity. Accordingly, the Company’s preferred units were classified as a liability in the Company’s consolidated balance sheet at December 31, 2011. At December 31, 2011, the unitholder had committed to not exercise his redemption rights through January 1, 2013.
In February 2012, the redemption feature on the preferred units was removed by an amendment to the preferred unit agreement. As a result, the preferred units were reclassified at fair value ($18,984) from a liability to equity in the condensed consolidated balance sheets.
In May 2012, the unitholder sold 6,000,000 preferred units to two separate unrelated parties for $1.00 per unit.
On January 1, 2013, in connection with the Reorganization of the Company (Note 1), all of the preferred units in the former limited liability company were exchanged for 18,983,602 shares of preferred stock.
On February 12, 2013, immediately prior to the closing of the initial public offering of the Company (Note 1), shares of preferred stock were converted into shares of common stock at a 9.5 to 1.0 basis (1,998,275 shares). Following the conversion, there are no issued or outstanding shares of preferred stock in the Company. Following the closing of the initial public offering of the Company on February 12, 2013, there are 50,000,000 shares of preferred stock authorized at a par value of $0.01 per share.
F-38
Table of Contents
Common Stock
Following the closing of the initial public offering of the Company on February 12, 2013, there are 200,000,000 shares of common stock authorized at a par value of $0.01 per share and 13,281,608 shares issued and outstanding.
The following table summarizes common stock activity:
| Common Stock (number of shares) |
||||
| Balance at December 31, 2012 |
— | |||
| Conversion of common units of The Ex One Company, LLC to common stock of The ExOne Company |
5,800,000 | |||
| Conversion of preferred stock to common stock immediately prior to closing of the initial public offering of The ExOne Company |
1,998,275 | |||
| Initial public offering of The ExOne Company |
5,483,333 | |||
|
|
|
|||
| Balance at June 30, 2013 |
13,281,608 | |||
|
|
|
|||
| Note 11. | Equity-Based Compensation |
2013 Equity Incentive Plan
On January 24, 2013, the Board of Directors of the Company adopted the 2013 Equity Incentive Plan (the “Plan”). In connection with the adoption of the Plan, 500,000 shares of common stock were reserved for issuance pursuant to the Plan, with automatic increases in such reserve available each year annually on January 1 from 2014 through 2023 equal to the lesser of (i) 3.0% of the total outstanding shares of common stock as of December 31 of the immediately preceding year or (ii) a number of shares of common stock determined by the Board of Directors, provided that the maximum number of shares authorized under the Plan will not exceed 1,992,242 shares, subject to certain adjustments.
On January 24, 2013, the Board of Directors authorized awards of 180,000 incentive stock options (“ISOs”) under the Plan to certain employees, which grants were effective contemporaneously with the initial public offering of the Company at an exercise price determined by the initial offering price ($18.00 per share). These awards vest in one-third increments on the first, second and third anniversaries of the grant date, respectively, and expire on February 6, 2023.
On January 24, 2013, the Board of Directors authorized awards of 10,000 shares of restricted stock under the Plan to certain members of the Board of Directors, which grants were effective contemporaneously with the initial public offering of the Company. These awards vest in one-third increments on the first, second and third anniversaries of the grant date, respectively.
On March 11, 2013, the Board of Directors authorized an award of 10,000 shares of restricted stock under the Plan to an executive of the Company. This award vests vest in one-third increments on the first, second and third anniversaries of the grant date, respectively.
F-39
Table of Contents
The following table summarizes the total equity-based compensation expense recognized for all ISOs and restricted stock awards:
| Quarter Ended June 30, 2013 |
Six Months Ended June 30, 2013 |
|||||||
| Equity-based compensation expense recognized: |
||||||||
| ISOs |
$ | 161 | $ | 257 | ||||
| Restricted stock |
39 | 54 | ||||||
|
|
|
|
|
|||||
| Total equity-based compensation expense before income taxes |
$ | 200 | $ | 311 | ||||
| Benefit for income taxes* |
— | — | ||||||
|
|
|
|
|
|||||
| Total equity-based compensation expense net of income taxes |
$ | 200 | $ | 311 | ||||
|
|
|
|
|
|||||
| * | The benefit for income taxes from equity-based compensation has been determined to be $0 based on a full valuation allowance against net deferred tax assets for both the quarter and six months ended June 30, 2013. In the absence of a full valuation allowance, the tax benefit derived from equity-based compensation would be approximately $34 and $51 for the quarter and six months ended June 30, 2013, respectively. |
At June 30, 2013, total future compensation expense related to unvested awards yet to be recognized by the Company was approximately $1,672 for ISOs and $412 for restricted stock awards. Total future compensation expense related to unvested awards yet to be recognized by the Company is expected to be recognized over a weighted-average remaining vesting period of approximately 2.7 years.
The fair value of ISOs was estimated on the date of grant using the Black-Scholes option pricing model with the following assumptions:
| Weighted average fair value per ISO |
$ | 11.03 | ||
| Volatility |
68.70 | % | ||
| Average risk-free interest rate |
1.07 | % | ||
| Dividend yield |
0.00 | % | ||
| Expected term (years) |
6.0 |
Expected volatility has been estimated based on historical volatilities of certain peer group companies over the expected term of the awards, due to the fact that prior to issuance, the Company was a nonpublic entity. The average risk-free rate is based on a weighted average yield curve of risk-free interest rates consistent with the expected term of the awards. Expected dividend yield is based on historical dividend data as well as future expectations. Expected term has been calculated using the simplified method as the Company does not have sufficient historical exercise experience upon which to base an estimate.
The activity for ISOs for the six months ended June 30, 2013, was as follows:
| Number of ISOs |
Weighted Average Exercise Price |
Weighted Average Grant Date Fair Value |
||||||||||
| Outstanding at January 1, 2013 |
— | $ | — | $ | — | |||||||
| ISOs granted |
180,000 | $ | 18.00 | $ | 11.03 | |||||||
| ISOs forfeited |
(5,000 | ) | $ | 18.00 | $ | 11.03 | ||||||
|
|
|
|
|
|
|
|||||||
| Outstanding at June 30, 2013 |
175,000 | $ | 18.00 | $ | 11.03 | |||||||
|
|
|
|
|
|
|
|||||||
| ISOs exercisable |
— | $ | — | $ | — | |||||||
| ISOs expected to vest |
175,000 | $ | 18.00 | $ | 11.03 | |||||||
F-40
Table of Contents
At June 30, 2013, the aggregate intrinsic value of both unvested ISOs and ISOs expected to vest was approximately $7,651. The weighted average remaining contractual term of ISOs expected to vest at June 30, 2013, was approximately 9.6 years.
The activity for restricted stock awards for the six months ended June 30, 2013, was as follows:
| Shares of Restricted Stock |
Weighted Average Grant Date Fair Value |
|||||||
| Outstanding at January 1, 2013 |
— | $ | — | |||||
| Restricted shares granted |
20,000 | $ | 23.26 | |||||
| Restricted shares forfeited |
— | $ | — | |||||
|
|
|
|
|
|||||
| Outstanding at June 30, 2013 |
20,000 | $ | 23.26 | |||||
|
|
|
|
|
|||||
| Restricted shares vested |
— | $ | — | |||||
| Restricted shares expected to vest |
20,000 | $ | 23.26 | |||||
Other
In May 2012, the Company’s majority member completed the sale of 300,000 common units of the former limited liability company to another existing member of the former limited liability Company for $1.25 per unit. The fair value of these common units on the measurement date was $7.20 per common unit. The Company recognized compensation expense of approximately $1,785 during the quarter ended June 30, 2012, in connection with the sale of these common units which has been recorded in selling, general and administrative expenses in the condensed statement of consolidated operations and comprehensive loss.
Determining the fair value of the common units required complex and subjective judgments. The Company used the sale of a similar security in an arms-length transaction with unrelated parties to estimate the value of the enterprise at the measurement date, which included assigning a value to the similar security’s rights, preferences and privileges, relative to the common units. The enterprise value was then allocated to the Company’s outstanding equity securities using a Black-Scholes option pricing model. The option pricing required certain estimates to be made, including: (i) the anticipated timing of a potential liquidity event (less than one year), (ii) volatility (65.0%) estimated based on historical volatilities of peer group companies, and (iii) a risk-free interest rate (0.2%).
| Note 12. | License Agreements |
The Company has license agreements with certain organizations which require license fee payments to be made on a periodic basis, including royalties on net sales of licensed products, processes and consumables. License fee expenses amounted to approximately $53 and $83 for the quarter and six months ended June 30, 2013, respectively. License fee expenses amounted to approximately $269 and $386 for the quarter and six months ended June 30, 2012, respectively. License fee expenses are included in cost of sales in the condensed consolidated statement of operations and comprehensive loss. At June 30, 2013, accrued license fees were approximately $706 and are recorded in accrued expenses and other current liabilities ($528) and other noncurrent liabilities ($178) in the condensed consolidated balance sheets. At December 31, 2012, accrued license fees were approximately $1,015 and are recorded in accrued expenses and other current liabilities ($748) and other noncurrent liabilities ($267) in the condensed consolidated balance sheets.
Included in the license agreements is an exclusive patent license agreement with the Massachusetts Institute of Technology (the “MIT Agreement”). Patents covered under the MIT Agreement have expiration dates ranging from 2013 to 2021.
F-41
Table of Contents
On January 22, 2013, the Company and MIT agreed to an amendment of their exclusive patent license agreement (the “Amended MIT Agreement”). The Amended MIT Agreement provides for, among other things, (1) a reduction in the term of the agreement between the Company and MIT from the date of expiration or abandonment of all issued patent rights to December 31, 2016, (2) an increase in the annual license maintenance fees due for the years ended December 31, 2013 through December 31, 2016 from $50 annually to $100 annually, with amounts related to 2013 through 2016 guaranteed by the Company, (3) a settlement of all past and future royalties on net sales of licensed products, processes and consumables for a one-time payment of $200 (paid in March 2013), and (4) a provision for extension of the term of the arrangement between the parties for an annual license maintenance fee of $100 for each subsequent year beyond 2016. As a result of the Amended MIT Agreement, the Company recorded a reduction to its accrued license fees at December 31, 2012, of approximately $1,500, with a corresponding reduction to cost of sales.
There were no license fee expenses associated with the Amended MIT Agreement for either the quarter or six months ended June 30, 2013. License fee expenses, including minimum license maintenance fees and royalties, associated with the MIT Agreement for the quarter and six months ended June 30, 2012 were $273 and $382, respectively. Reimbursement of qualifying patent expenses incurred by MIT were approximately $0 and $3 for the quarter and six months ended June 30, 2013, respectively. Reimbursement of qualifying patent expenses incurred by MIT were approximately $5 and $22 for the quarter and six months ended June 30, 2012, respectively. Reimbursement of qualifying patent expenses incurred by MIT are recorded in selling, general and administrative expenses in the condensed statement of consolidated operations and comprehensive loss.
| Note 13. | Income Taxes |
Prior to Reorganization (Note 1) the Company was a limited liability company whereby its members were taxed on a proportionate share of the Company’s taxable income. Following the merger of The Ex One Company, LLC with and into The ExOne Company, The ExOne Company became a corporation, taxable for federal, state, local and foreign income tax purposes. On January 1, 2013, the Company recorded a net deferred tax asset of approximately $410 based on the difference between the book and tax basis of assets and liabilities as of that date. Due to a history of operating losses by the limited liability company, a valuation allowance of 100% of the initial net deferred tax asset was established.
The provision for income taxes was $72 and $91 for the quarter and six months ended June 30, 2013, respectively. The provision for income taxes was $246 and $234 for the quarter and six months ended June 30, 2012, respectively. The provision for income taxes for all periods presented related entirely to the taxable income of ExOne GmbH. The Company has completed a discrete period computation of its provision for income taxes for each of the periods presented. Discrete period computation is as a result of (i) jurisdictions with losses before income taxes for which no tax benefit can be recognized and (ii) an inability to generate reliable estimates for results in certain jurisdictions as a result of inconsistencies in generating net operating profits (losses) in those jurisdictions.
The effective tax rate was 106.9% and 103.2% for the quarter and six months ended June 30, 2013, respectively. The effective tax rate was 107.7% and 105.0% for the quarter and six months ended June 30, 2012, respectively. For the quarter and six months ended June 30, 2013, the effective tax rate differs from the U.S. federal statutory rate of 34.0% primarily due to net changes in valuation allowances for the period. For the quarter and six months ended June 30, 2012, the effective tax rate differs from the U.S. federal statutory rate of 34.0% primarily due to the effects of (i) limited liability company losses not subject to tax and (ii) net changes in valuation allowances for the period.
F-42
Table of Contents
The components of net deferred income tax assets and net deferred income tax liabilities were as follows:
| June 30, 2013 |
January 1, 2013 (Reorganization) |
December 31, 2012 |
||||||||||
| Current deferred tax assets (liabilities): |
||||||||||||
| Accounts receivable |
$ | 27 | $ | 31 | $ | — | ||||||
| Inventories |
376 | (40 | ) | (434 | ) | |||||||
| Accrued expenses and other current liabilities |
599 | 562 | 143 | |||||||||
| Deferred revenue and customer prepayments |
32 | 1,851 | 1,912 | |||||||||
| Other |
48 | 10 | 250 | |||||||||
| Valuation allowance |
(1,082 | ) | (2,429 | ) | (2,049 | ) | ||||||
|
|
|
|
|
|
|
|||||||
| Current deferred tax assets (liabilities) |
— | (15 | ) | (178 | ) | |||||||
| Noncurrent deferred tax assets (liabilities): |
||||||||||||
| Net operating loss carryforwards |
1,595 | 431 | 431 | |||||||||
| Tax credit carryforwards |
436 | — | — | |||||||||
| Property and equipment |
962 | 691 | 599 | |||||||||
| Other |
25 | 342 | 567 | |||||||||
| Valuation allowance |
(3,018 | ) | (1,449 | ) | (1,419 | ) | ||||||
|
|
|
|
|
|
|
|||||||
| Noncurrent deferred tax assets (liabilities) |
— | 15 | 178 | |||||||||
|
|
|
|
|
|
|
|||||||
| Net deferred tax assets (liabilities) |
$ | — | $ | — | $ | — | ||||||
|
|
|
|
|
|
|
|||||||
The Company has provided a valuation allowance for its net deferred tax assets as a result of the Company not generating consistent net operating profits in jurisdictions with which it operates. As such, any benefit from deferred taxes in any of the periods presented has been fully offset by changes in the valuation allowance for net deferred tax assets. The Company continues to assess its future taxable income by jurisdiction based on (i) recent historical operating results (ii) the expected timing of reversal of temporary differences (iii) various tax planning strategies that the Company may be able to enact in future periods (iv) the impact of potential operating changes on the business and (v) forecast results from operations in future periods based on available information at the end of each reporting period. To the extent that the Company is able to reach the conclusion that deferred tax assets are realizable based on any combination of the above factors, a reversal of existing valuation allowances may occur.
At June 30, 2013, the Company had approximately $620 in net operating loss carryforwards which expire from 2013 through 2019, to offset the future taxable income of its Japanese subsidiary. At June 30, 2013, the Company had approximately $975 in net operating loss carryforwards which expire in 2033, and $436 in tax credit carryforwards which expire in 2023, to offset the future taxable income of its United States subsidiary.
The Company has a liability for uncertain tax positions related to certain capitalized expenses and related party transactions. At June 30, 2013 and December 31, 2012, the liability for uncertain tax positions was approximately $548 and $416, respectively, and is included in accrued expenses and other current liabilities in the condensed consolidated balance sheets. At June 30, 2013, there was no liability for uncertain tax positions related to the Company’s Japanese subsidiary. At December 31, 2012, the liability for uncertain tax positions related to the Company’s Japanese subsidiary was $94 and was fully offset against net operating loss carryforwards of this subsidiary.
F-43
Table of Contents
The Company includes interest and penalties related to income taxes as a component of the provision for income taxes in the condensed statement of consolidated operations and comprehensive loss.
| Note 14. | Fair Value Measurements |
Fair value is defined as the price that would be received to sell an asset or paid to transfer a liability in an orderly transaction between market participants at the measurement date. When determining the fair value measurements for assets and liabilities which are required to be recorded at fair value, the Company considers the principal or most advantageous market in which the Company would transact and the market-based risk measurements or assumptions that market participants would use in pricing the asset or liability, such as inherent risk, transfer restrictions and credit risk.
The Company applies the following fair value hierarchy, which prioritizes the inputs used to measure fair value into three levels and bases the categorization within the hierarchy upon the lowest level of input that is available and significant to the fair value measurement:
| Level 1 | Observable inputs such as quoted prices in active markets for identical investments that the Company has the ability to access. | |
| Level 2 | Inputs include: | |
| Quoted prices for similar assets or liabilities in active markets; | ||
| Quoted prices for identical or similar assets or liabilities in inactive markets; | ||
| Inputs, other than quoted prices in active markets, that are observable either directly or indirectly; | ||
| Inputs that are derived principally from, or corroborated by, observable market data by correlation or other means. | ||
| Level 3 | Inputs that are generally unobservable and typically reflect management’s estimates of assumptions that market participants would use in pricing the asset or liability. | |
The Company is required to disclose its estimate of the fair value of material financial instruments, including those recorded as assets or liabilities in its consolidated financial statements, in accordance with GAAP.
The following table sets forth the fair value of the Company’s liabilities measured on a recurring basis by level:
| Level | June 30, 2013 |
December 31, 2012 |
||||||||||
| Accrued expenses and other current liabilities: |
||||||||||||
| Interest rate swap liability |
2 | $ | — | $ | 13 | |||||||
The fair value of the interest rate swap liability is determined by using a discounted cash flow model using observable inputs from the related forward interest rate yield curves with the differential between the forward rate and the stated interest rate of the instrument discounted back from the settlement date of the contracts to the respective balance sheet date. As this model utilizes observable inputs and does not require significant management judgment it has been determined to be a Level 2 financial instrument in the fair value hierarchy.
Prior to redemption during the quarter ended March 31, 2012, the fair value of the Company’s redeemable preferred units was estimated based on unobservable inputs, including the present value of the Company’s demand note payable to member immediately prior to conversion (Note 10). As this estimate utilized unobservable inputs and required significant management judgment it was determined to be a Level 3 financial instrument in the fair value hierarchy.
F-44
Table of Contents
The following table sets forth a summary of changes in the fair value of the Company’s Level 3 financial instruments:
| Quarter Ended June 30, |
Six Months Ended June 30, |
|||||||||||||||
| 2013 | 2012 | 2013 | 2012 | |||||||||||||
| Beginning balance |
$ | — | $ | — | $ | — | $ | 18,984 | ||||||||
| Realized gains (losses) |
— | — | — | — | ||||||||||||
| Unrealized gains (losses) |
— | — | — | — | ||||||||||||
| Purchases |
— | — | — | — | ||||||||||||
| Sales |
— | — | — | — | ||||||||||||
| Issuances |
— | — | — | — | ||||||||||||
| Settlements |
— | — | — | (18,984 | ) | |||||||||||
| Transfers into Level 3 |
— | — | — | — | ||||||||||||
| Transfers out of Level 3 |
— | — | — | — | ||||||||||||
|
|
|
|
|
|
|
|
|
|||||||||
| Ending balance |
$ | — | $ | — | $ | — | $ | — | ||||||||
|
|
|
|
|
|
|
|
|
|||||||||
The carrying values and fair values of other financial instruments of the Company were as follows:
| June 30, 2013 | December 31, 2012 | |||||||||||||||
| Carrying Value |
Fair Value |
Carrying Value |
Fair Value |
|||||||||||||
| Cash and cash equivalents |
$ | 64,550 | $ | 64,550 | $ | 2,802 | $ | 2,802 | ||||||||
| Line of credit |
— | — | 528 | 528 | ||||||||||||
| Demand note payable to member |
— | — | 8,666 | 8,666 | ||||||||||||
| Current portion of long-term debt |
124 | 124 | 2,028 | 2,028 | ||||||||||||
| Current portion of capital and financing leases |
507 | 507 | 920 | 920 | ||||||||||||
| Long-term debt - net of current portion |
2,146 | 1,854 | 5,669 | 7,880 | ||||||||||||
| Capital and financing leases - net of current portion |
722 | 722 | 1,949 | 1,949 | ||||||||||||
The carrying amounts of cash and cash equivalents, line of credit, demand note payable to member, current portion of long-term debt and current portion of financing leases approximate fair value due to their short-term maturities. Cash and cash equivalents are classified in Level 1; Line of credit, demand note payable to member, current portion of long-term debt, current portion of capital and financing leases, long-term debt – net of current portion and capital and financing leases – net of current portion are classified in Level 2.
| Note 15. | Customer Concentrations |
During the quarters and six months ended June 30, 2013 and June 30, 2012, the Company conducted a significant portion of its business with a limited number of customers. For the quarter and six months ended June 30, 2013, the Company’s five most significant customers represented approximately 68.4% and 45.7% of total revenue, respectively. For the quarter and six months ended June 30, 2012, the Company’s five most significant customers represented approximately 50.5% and 37.6% of total revenue, respectively. At June 30, 2013 and December 31, 2012, accounts receivable from the Company’s five most significant customers were approximately $3,528 and $1,671, respectively.
| Note 16. | Related Party Transactions |
The Company provides various services to several related entities under common control by the Chairman and CEO of the Company, primarily in the form of accounting, finance, information technology and human resource outsourcing, which are generally reimbursed by the related entities. The cost of these services was approximately $40 and $88 for the quarter and six months ended June 30, 2013, respectively. The cost of these services was
F-45
Table of Contents
approximately $30 and $78 for the quarter and six months ended June 30, 2012, respectively. In addition, the Company may purchase certain items on behalf of related parties under common control by the Chairman and CEO of the Company. Amounts due from these related entities at June 30, 2013 and December 31, 2012, were not significant.
The Company receives design services and the corporate use of an airplane from related entities under common control by the Chairman and CEO of the Company. The cost of these services received was approximately $56 and $97 for the quarter and six months ended June 30, 2013, respectively. The cost of these services received was approximately $40 and $59 for the quarter and six months ended June 30, 2012, respectively. Amounts due to these related entities at June 30, 2013 and December 31, 2012, were not significant.
| Note 17. | Subsequent Events |
The Company has evaluated all of its activities and concluded that no subsequent events have occurred that would require recognition in the condensed consolidated financial statements or disclosure in the notes to the condensed consolidated financial statements, except as described below.
On August 1, 2013, ExOne Holding Deutschland GmbH (“ExOne Holding”), a newly-formed, wholly-owned subsidiary of the Company, entered into an agreement (the “Agreement”) with the Municipality of Gersthofen, Germany (the “Municipality”) to purchase certain real property (the “Property”), from the Municipality for an aggregate amount of approximately $3,900 (€3,000). The Agreement contains terms and conditions that are customary for German land purchase agreements of this nature. Additionally, on August 1, 2013, ExOne Holding and the Municipality entered into an agreement pursuant to which the Municipality granted ExOne Holding an option to purchase adjacent parcels of land consisting of 14,319 square meters on the same terms and conditions as those set forth in the Agreement (the “Option”). The Option expires on December 31, 2016.
The Company intends to construct a new facility on the land, which will comprise approximately 150,700 square feet of production, warehouse, service and research and development space as well as approximately 27,600 square feet for offices. On August 14, 2013, ExOne Holding entered into a construction contract with a turnkey provider of construction services for the design and construction of the facility. The total cost for the land and the construction of the facility (including design services) is estimated at approximately $20,000 (€15,400).
F-46
Table of Contents
2,656,000 Shares
The ExOne Company
Common Stock
PROSPECTUS
, 2013
FBR
Table of Contents
PART II
INFORMATION NOT REQUIRED IN PROSPECTUS
Item 13. Other Expenses of Issuance and Distribution.
The following table sets forth the expenses, other than underwriting discounts and commissions, payable in connection with the sale of common stock being registered. All the amounts shown are estimates except for the SEC registration fee.
| SEC registration fee |
$ | 27,093 | ||
| Legal fees and expenses |
* | |||
| Printing expenses |
* | |||
| Accounting fees and expenses |
* | |||
| NASDAQ listing fees |
* | |||
| Miscellaneous |
* | |||
|
|
|
|||
| Total |
$ | * | ||
|
|
|
| * | To be filed by amendment. |
| Item 14. | Indemnification of Officers and Directors. |
Delaware law permits a corporation to adopt a provision in its certificate of incorporation eliminating or limiting the personal liability of a director, but not an officer in his or her capacity as such, to the corporation or its stockholders for monetary damages for breach of fiduciary duty as a director, except that such provision shall not eliminate or limit the liability of a director for (1) any breach of the director’s duty of loyalty to the corporation or its stockholders, (2) acts or omissions not in good faith or which involve intentional misconduct or a knowing violation of law, (3) liability under section 174 of the Delaware General Corporation Law (the “DGCL”) for unlawful payment of dividends or stock purchases or redemptions or (4) any transaction from which the director derived an improper personal benefit. Our certificate of incorporation provides that, to the fullest extent permitted by Delaware law, none of our directors will be liable to us or our stockholders for monetary damages for breach of fiduciary duty as a director.
Under Delaware law, a corporation may indemnify any person who was or is a party or is threatened to be made a party to any type of proceeding, other than an action by or in the right of the corporation, because he or she is or was a director, officer, employee or agent of the corporation, or is or was serving at the request of the corporation as a director, officer, employee or agent of another corporation or other entity, against expenses, including attorneys’ fees, judgments, fines and amounts paid in settlement actually and reasonably incurred in connection with such proceeding if: (1) he or she acted in good faith and in a manner he or she reasonably believed to be in or not opposed to the best interests of the corporation; and (2) with respect to any criminal proceeding, he or she had no reasonable cause to believe that his or her conduct was unlawful. A corporation may indemnify any person who was or is a party or is threatened to be made a party to any threatened, pending or completed action or suit brought by or in the right of the corporation by reason of the fact that he or she is or was a director, officer, employee or agent of the corporation, or is or was serving at the request of the corporation as a director, officer, employee or agent of another corporation or other entity, against expenses, including attorneys’ fees, actually and reasonably incurred in connection with such action or suit if he or she acted in good faith and in a manner he or she reasonably believed to be in or not opposed to the best interests of the corporation, except that no indemnification will be made if the person is found liable to the corporation unless, in such a case, a court determines the person is nonetheless entitled to indemnification for such expenses. A
II-1
Table of Contents
corporation must also indemnify a present or former director or officer has been successful on the merits or otherwise in defense of any proceeding, or in defense of any claim, issue or matter therein, against expenses, including attorneys’ fees, actually and reasonably incurred by him or her. Expenses, including attorneys’ fees, incurred by a director or officer, or any employees or agents as deemed appropriate by the board of directors, in defending civil or criminal proceedings may be paid by the corporation in advance of the final disposition of such proceedings upon receipt of an undertaking by or on behalf of such director, officer, employee or agent to repay such amount if it shall ultimately be determined that he or she is not entitled to be indemnified by the corporation.
Under the DGCL, the termination of any proceeding by judgment, order, settlement, conviction, or upon a plea of nolo contendere or its equivalent, shall not, of itself, create a presumption that a person did not act in good faith and in a manner which he or she reasonably believed to be in or not opposed to the best interests of the corporation, and, with respect to any criminal proceeding, had reasonable cause to believe that his or her conduct was unlawful.
The indemnification and advancement of expenses shall, unless otherwise provided when authorized or ratified, continue as to a person who has ceased to be a director, officer, employee or agent and shall inure to the benefit of such person’s heirs, executors and administrators. Any indemnification permitted by Delaware law shall be made by the corporation only as authorized in the specific case upon a determination that indemnification of the present or former director, officer, employee or agent is proper in the circumstances because the person has met the applicable standards of conduct provided by Delaware law. Such determination shall be made with respect to the person who is a director or officer at the time of such determination (i) by a majority vote of the directors who are not parties to such proceeding, even though less than a quorum, (ii) by a committee of such directors designated by majority vote of such directors, even though less than a quorum, (iii) if there are no such directors, or if such directors so direct, by independent legal counsel in a written opinion, or (iv) by the stockholders.
The Delaware law regarding indemnification and the advancement of expenses is not exclusive of any other rights a person may be entitled to under any bylaw, agreement, vote of stockholders or disinterested directors or otherwise.
Our bylaws provide that any of our directors or officers, or any person serving at our request as a director, officer, trustee, employee or agent of another corporation or of a partnership, joint venture, trust or other enterprise, including service with respect to employee benefit plans maintained or sponsored by us, shall be indemnified and held harmless by us as of right to the full extent permitted by the Delaware General Corporation Law against all expense, liability and loss (including attorneys’ fees, judgments, fines, ERISA excise taxes or penalties and amounts paid or to be paid in settlement) reasonably incurred by such person by reason of such person’s having served in such capacity. Our bylaws also provide that any such indemnification shall continue as to a person who has ceased to be a director, officer, trustee, employee or agent and shall inure to the benefit of such person’s heirs, executors and administrators; provided, however, that such proceeding must have been authorized by the Board of Directors (except with respect to a proceeding brought by such person against us to recover a claim for indemnification). This right to indemnification includes the right to be paid the expenses incurred in defending any such proceeding in advance of its final disposition. In addition, our certificate of incorporation and bylaws specifically provide that none of our directors shall be personally liable to us or any of our stockholders for monetary damages for breach of fiduciary duty as a director of ours, except as otherwise required by the Delaware General Corporation Law.
We have also entered into indemnification agreements with our directors and executive officers, pursuant to which we have agreed to indemnify them to the fullest extent permitted under Delaware law against all expenses and, in the case of proceedings other than those brought by or in the right of us, judgments, fines, penalties and amounts actually and reasonably paid in settlement by such persons or on their behalf in connection with proceedings in which they are involved. Under these agreements, we will also indemnify our directors and
II-2
Table of Contents
executive officers to the fullest extent permitted by law against all expenses actually and reasonably incurred by or on such persons’ behalf in connection with any such proceeding or defense, in whole or in part, to which they are a party or participant and in which they are successful. In addition, and subject to certain limitations, each Indemnification Agreement provides for the advancement of expenses incurred by or on behalf of the directors and executive officers in connection with any proceeding not initiated by them, and the reimbursement to us of the amounts advanced to the extent that it is ultimately determined that the director or executive officer is not entitled to be indemnified by us. Additionally, the Indemnification Agreements provide for the provision of directors’ and officers’ liability insurance policies. The provisions of the Indemnification Agreement applies with respect to all periods of such director’s and executive officer’s service and shall continue so long as they are subject to a possible claim, even though the director or executive officer may have ceased to be a director or executive officer of ours.
We maintain policies of directors’ and officers’ liability insurance which insures its directors against the cost of defense, settlement or payment of a judgment under certain circumstances.
| Item 15. | Recent Sales of Unregistered Securities |
On December 30, 2011, the Company issued 18,983,602 preferred units to Rockwell Holdings Inc. (“RHI”) in a private offering exempt from the registration requirements of the Securities Act pursuant to an exemption from registration provided under Section 4(2) of the Securities Act. In consideration for the issuance of the preferred units, RHI retired approximately $19.0 million in debt owed by the Company to it.
On January 1, 2013, the Company merged its predecessor company, The Ex One Company, LLC, a Delaware limited liability company (the “LLC”), with and into a Delaware corporation (the “Corporation”), which changed its name to The ExOne Company (the “Reorganization”). At the time the Reorganization became effective, by operation of the Delaware corporation law and in accordance with the Agreement and Plan of Merger by and between the LLC and the Corporation, each common unit of LLC membership interest was converted into 0.58 shares of the Company’s Common Stock for a total of 5,800,000 shares of Common Stock and each preferred unit of LLC membership interest was converted into 1 share of our Class A Preferred Stock or a total of 18,984,000 shares of Class A Preferred Stock. There were no underwriters. The persons who acquired shares of our Common Stock and our Class A Preferred Stock were those persons who were the owners of the equivalent class of LLC membership interests in the Company’s predecessor company prior to the Reorganization. The shares of Common Stock and Class A Preferred Stock were not sold for cash, and the Company received no consideration in the transaction.
The conversion of securities in the Reorganization was exempt from registration under Section 4(2) of the Securities Act as a private placement. The Staff has previously recognized that registration is not required where securities are issued in a transaction that is merely a change of form of the issuer and not a change in the substance of it, as where an entity is a party to a merger to change its domicile. In the Reorganization, the LLC merely converted itself into a corporation with the same persons being the stockholders of the Corporation as were the members of the LLC and each having the same proportionate equity interest in the Corporation as it had in the LLC, with no change in the kind or amount of assets owned by the surviving entity, the Corporation. In essence, the securities issued in the merger transaction are exempt from registration because the transaction did not involve a sale.
On February 6, 2013, the Company issued 2,500 shares of its common stock to each of Ms. Wachtel and Messrs. Semple, Sellier and Kilmer in connection with their appointment to its Board of Directors and their future service to the Company. These shares were issued pursuant to the exemption from registration provided by Section 4(2) of the Securities Act, and are subject to certain restrictions until certain vesting requirements are met. These shares vest, and the restrictions on transfer lapse, in one-third increments on the first, second and third anniversaries of the grant date, respectively. The issuance of these shares was exempt from registration under Section 4(2) of the Securities Act as a private placement.
II-3
Table of Contents
| Item 16. | Exhibits and Financial Statement Schedules |
(A) Exhibits:
| Exhibit Number |
Description |
Method of Filing | ||
| 1.1 |
Form of Underwriting Agreement. | To be filed by amendment. | ||
| 2.1 |
Asset Purchase Agreement dated March 27, 2013 between the Company and Troy Metal Fabricating, LLC. | Incorporated by reference to Exhibit 2.1 to Form 8-K filed on March 29, 2013. | ||
| 2.2 |
Asset Purchase Agreement dated March 27, 2013 between the Company and Lone Star Metal Fabrication, LLC. | Incorporated by reference to Exhibit 2.2 to Form 8-K filed on March 29, 2013. | ||
| 3.1 |
Certificate of Incorporation. | Incorporated by reference to Exhibit 3.1 to Form S-1 Registration Statement (#333-185933) filed on January 8, 2013 | ||
| 3.2 |
Amended and Restated Bylaws. | Incorporated by reference to Exhibit 3.1 to Form 8-K (#001-35806) filed on March 29, 2013 | ||
| 3.3 |
Amendment to Amended and Restated Bylaws. | Incorporated by reference to Exhibit 3.1 to Form 8-K (#001-35806) filed on August 20, 2013 | ||
| 4.1 |
Form of stock certificate. | Incorporated by reference to Exhibit 4.1 to Amendment No. 2 to Form S-1 Registration Statement (#333-185933) filed on January 28, 2013 | ||
| 5.1 |
Opinion of Buchanan Ingersoll & Rooney PC. | To be filed by amendment. | ||
| 10.01.01 |
Amended and Restated Exclusive Patent License Agreement dated January 1, 2011, by and between Massachusetts Institute of Technology and The Ex One Company, LLC | Incorporated by reference to Exhibit 10.01.01 to Amendment No. 1 to Form S-1 Registration Statement (#333-185933) filed on January 24, 2013 | ||
| 10.01.02 |
First Amendment to the Amended and Restated Exclusive Patent License Agreement, dated as of January 1, 2013, by and between Massachusetts Institute of Technology and The Ex One Company, LLC | Incorporated by reference to Exhibit 10.01.02 to Amendment No. 1 to Form S-1 Registration Statement (#333-185933) filed on January 24, 2013 | ||
| 10.2 |
Employment Agreement, dated June 1, 2012, by and between the Company and S. Kent Rockwell. | Incorporated by reference to Exhibit 10.2 to Form S-1 Registration Statement (#333-185933) filed on January 8, 2013 | ||
| 10.3 |
Employment Agreement, dated June 1, 2012, by and between the Company and David Burns. | Incorporated by reference to Exhibit 10.3 to Form S-1 Registration Statement (#333-185933) filed on January 8, 2013 | ||
| 10.4 |
Employment Agreement, dated August 1, 2012, by and between the Company and John Irvin. | Incorporated by reference to Exhibit 10.4 to Form S-1 Registration Statement (#333-185933) filed on January 8, 2013 | ||
| 10.5 |
Employment Agreement, dated August 21, 2003, by and between Prometal RCT and Rainer Hoechsmann (translated from German). | Incorporated by reference to Exhibit 10.5 to Form S-1 Registration Statement (#333-185933) filed on January 8, 2013 | ||
| 10.6 |
Letter amending Employment Agreement, dated March 9, 2012, from the Company to Rainer Hoechsmann (translated from German) | Incorporated by reference to Exhibit 10.6 to Form S-1 Registration Statement (#333-185933) filed on January 8, 2013 | ||
II-4
Table of Contents
| Exhibit Number |
Description |
Method of Filing | ||
| 10.07.01 |
2013 Equity Incentive Plan. | Incorporated by reference to Exhibit 10.07.01 to Amendment No. 1 to Form S-1 Registration Statement (#333-185933) filed on January 24, 2013 | ||
| 10.07.02 |
Form of Award Agreements under 2013 Equity Incentive Plan. | Incorporated by reference to Exhibit 10.07.02 to Amendment No. 1 to Form S-1 Registration Statement (#333-185933) filed on January 24, 2013 | ||
| 10.8 |
Lone Star Metal Fabrication, LLC Equipment Lease. | Incorporated by reference to Exhibit 10.8 to Form S-1 Registration Statement (#333-185933) filed on January 8, 2013 | ||
| 10.9 |
Lone Star Metal Fabrication, LLC Building Lease. | Incorporated by reference to Exhibit 10.9 to Form S-1 Registration Statement (#333-185933) filed on January 8, 2013 | ||
| 10.10.01 |
Troy Metal Fabricating, LLC Equipment Lease October 1, 2011. | Incorporated by reference to Exhibit 10.10.01 to Form S-1 Registration Statement (#333-185933) filed on January 8, 2013 | ||
| 10.10.02 |
Troy Metal Fabricating, LLC Equipment Lease December 31, 2012. | Incorporated by reference to Exhibit 10.10.02 to Form S-1 Registration Statement (#333-185933) filed on January 8, 2013 | ||
| 10.10.03 |
Troy Metal Fabricating, LLC Equipment Lease May 31, 2008. | Incorporated by reference to Exhibit 10.10.03 to Form S-1 Registration Statement (#333-185933) filed on January 8, 2013 | ||
| 10.10.04 |
Troy Metal Fabricating, LLC Equipment Lease February 01, 2009 | Incorporated by reference to Exhibit 10.10.04 to Form S-1 Registration Statement (#333-185933) filed on January 8, 2013 | ||
| 10.10.05 |
Troy Metal Fabrication, LLC Equipment Lease May 31, 2008. | Incorporated by reference to Exhibit 10.10.05 to Form S-1 Registration Statement (#333-185933) filed on January 8, 2013 | ||
| 10.10.06 |
Troy Metal Fabricating, LLC Building Lease March 31, 2008. | Incorporated by reference to Exhibit 10.10.06 to Form S-1 Registration Statement (#333-185933) filed on January 8, 2013 | ||
| 10.12 |
Kontokorrentkredit Overdraft Agreement, dated July 29, 2011, Between ExOne Gmbh and Stadtsparkasse Augsburg. (translated from German). | Incorporated by reference to Exhibit 10.12 to Form S-1 Registration Statement (#333-185933) filed on January 8, 2013 | ||
| 10.13 |
Aval Kredit-Rahmanvertrag, Linton Bank Guarantees, dated July 29, 2011, Between ExOne Gmbh and Stadtsparkasse Augsburg. (translated from German). | Incorporated by reference to Exhibit 10.13 to Form S-1 Registration Statement (#333-185933) filed on January 8, 2013 | ||
| 10.14 |
Abtretung von Außenständer, Assignment of Receivables, dated July 29, 2011, Between ExOne Gmbh and Stadtsparkasse Augsburg. (translated from German). | Incorporated by reference to Exhibit 10.14 to Form S-1 Registration Statement (#333-185933) filed on January 8, 2013 | ||
| 10.15 |
Revolving Demand Note, dated January 1, 2012 by and between the Company and Rockwell Forest Products, Inc. | Incorporated by reference to Exhibit 10.15 to Form S-1 Registration Statement (#333-185933) filed on January 8, 2013. | ||
II-5
Table of Contents
| Exhibit Number |
Description |
Method of Filing | ||
| 10.16 |
Leasing Contract, Agreement Concerning Use of Machine, Sale and Leaseback Agreement, dated November 21, 2012, between ExOne GmbH and Deutsche für Sparkassen und Mittelstand GmbH (translated from German). | Incorporated by reference to Exhibit 10.16 to Amendment No. 1 to Form S-1 Registration Statement (#333-185933) filed on January 24, 2013. | ||
| 10.17 |
Employment Agreement, dated March 7, 2013, by and between the Company and JoEllen Lyons Dillon. | Incorporated by reference to Exhibit 10.17 to Form 10-K (#001-35806) filed on March 29, 2013. | ||
| 10.18 |
Form of Indemnification Agreement for Officers and Directors. | Incorporated by reference to Exhibit 3.1 to Form 8-K filed on March 29, 2013. | ||
| 10.19 |
Form of Restricted Stock Award Agreement. | Incorporated by reference to Exhibit 99.2 to the Registration Statement on Form S-8 (No. 333-187053) filed on March 5, 2013. | ||
| 21.1 |
Subsidiaries of the Registrant. | Filed herewith. | ||
| 23.1 |
Consent of ParenteBeard LLC. | Filed herewith. | ||
| 23.2 |
Consent of Buchanan Ingersoll & Rooney PC (included in Exhibit 5.1). | To be filed by amendment. | ||
| 24.1 |
Powers of Attorney (included on signature pages of this registration statement). | Filed herewith. | ||
(B) Financial Statement Schedules:
Financial statement schedules are omitted because they are not required or the required information is shown in our consolidated financial statements or the notes thereto.
| Item 17. | Undertakings |
(a) Insofar as indemnification for liabilities arising under the Securities Act may be permitted to directors, officers and controlling persons of the registrant pursuant to the foregoing provisions, or otherwise, the registrant has been advised that in the opinion of the Securities and Exchange Commission, such indemnification is against public policy as expressed in the Securities Act and is, therefore, unenforceable. In the event that a claim for indemnification against such liabilities (other than the payment by the registrant of expenses incurred or paid by a director, officer or controlling person of the registrant in the successful defense of any action, suit or proceeding) is asserted by such director, officer or controlling person in connection with the securities being registered, the registrant will, unless in the opinion of its counsel the matter has been settled by controlling precedent, submit to a court of appropriate jurisdiction the question whether such indemnification by it is against public policy as expressed in the Securities Act and will be governed by the final adjudication of such issue.
(b) The undersigned registrant hereby undertakes that:
(1) For purposes of determining any liability under the Securities Act, the information omitted from the form of prospectus filed as part of this Registration Statement in reliance upon Rule 430A and contained in a form of prospectus filed by the registrant pursuant to Rule 424(b)(1) or (4) or 497(h) under the Securities Act shall be deemed to be part of this Registration Statement as of the time it was declared effective.
(2) For purposes of determining any liability under the Securities Act, each post-effective amendment that contains a form of prospectus shall be deemed to be a new registration statement relating to the securities offered therein, and the offering of such securities at that time shall be deemed to be the initial bona fide offering thereof.
II-6
Table of Contents
SIGNATURES
Pursuant to the requirements of the Securities Act of 1933, the Registrant has duly caused this registration statement to be signed on its behalf by the undersigned, thereunto duly authorized, in the City of Pittsburgh, Commonwealth of Pennsylvania, on August 21, 2013.
| The ExOne Company | ||
| By: | /s/ S. Kent Rockwell | |
| S. Kent Rockwell | ||
| Chairman and Chief Executive Officer | ||
POWER OF ATTORNEY
KNOW ALL PERSONS BY THESE PRESENTS, that each person whose signature appears below constitutes and appoints S. Kent Rockwell, David Burns, John Irvin and JoEllen Lyons Dillon, and each of them, as his true and lawful attorneys-in-fact and agents, with full power of substitution and resubstitution, for the undersigned and in his name place and stead, in any and all capacities, to sign any or all amendments (including post-effective amendments) to this registration statement, any registration statement for the same offering filed pursuant to Rule 462(b) under the Securities Act of 1933 and any and all amendments (including post-effective amendments) thereto, and to file the same, with all exhibits thereto, and all documents in connection therewith, with the Securities and Exchange Commission, granting unto said attorneys-in-fact and agents, full power and authority to do and perform each and every act and thing requisite and necessary to be done in connection therewith, as fully to all intents and purposes as he might or could do in person, hereby ratifying and confirming all that said attorneys-in-fact and agents, or any of them or their or his substitute or substitutes, may lawfully do or cause to be done by virtue hereof.
Pursuant to the requirements of the Securities Act of 1933, this registration statement has been signed by the following persons in the capacities indicated on August 21, 2013.
| Signature |
Title | |
| /s/ S. Kent Rockwell | Chairman and Chief Executive Officer | |
| S. Kent Rockwell | (Principal Executive Officer) | |
| /s/ John Irvin | Chief Financial Officer (Principal Financial | |
| John Irvin | and Accounting Officer) And Director | |
| /s/ David J. Burns | President and Chief Operating Officer | |
| David J. Burns | And Director | |
| /s/ Raymond J. Kilmer Raymond J. Kilmer |
Director | |
| /s/ Victor Sellier Victor Sellier |
Director | |
| /s/ Lloyd A. Semple Lloyd A. Semple |
Director | |
| /s/ Bonnie K. Wachtel Bonnie K. Wachtel |
Director | |
II-7