Attached files
| file | filename |
|---|---|
| 8-K - 8-K - UMB FINANCIAL CORP | d585125d8k.htm |
 Second Quarter 2013
UMB Financial
Exhibit 99.1 |
 This
document may contain forward-looking statements of expected future developments. We wish to
ensure such statements are accompanied by meaningful cautionary statements pursuant
to the safe harbor established by the Private Securities Litigation Reform
Act of 1995. Such forward-looking statements may refer to projections of
future financial performance and financial items, plans and objectives of
future operations, and other matters. The forward-looking statements reflect
management’s expectations and are based on currently available data; however,
actual future results are subject to future events and uncertainties, which
could materially affect actual performance and cause
future
results
to
differ
materially
from
those
referred
to
in
the
forward-looking
statements.
Such
future
events
and
uncertainties
include,
but
are
not
limited
to,
changes
in:
loan
demand,
the
ability
of
customers to repay loans, consumer saving habits, employee costs, pricing,
interest rates, competition, legal or regulatory requirements or
restrictions, U.S. or international economic or political conditions
such
as
inflation
or
fluctuation
in
interest
rates
or
in
the
values
of
securities
traded
in
the
equity markets. Any forward-looking statements should be read in conjunction
with information about risks and uncertainties set forth in the
company’s Securities and Exchange Commission reports, including its
annual report, Form 10-K for the year ended December 31, 2012 and the 8-K filing which
includes the press release for the quarter ended June 30, 2013. Forward-looking
statements speak only as of the date they are made, and the Company does not
intend to review or revise any particular forward-looking
statement
in
light
of
events
that
occur
thereafter
or
to
reflect
the
occurrence
of
unanticipated events.
Safe Harbor Statement
2 |
 A Different
Kind of Bank The company
The business model
The performance |
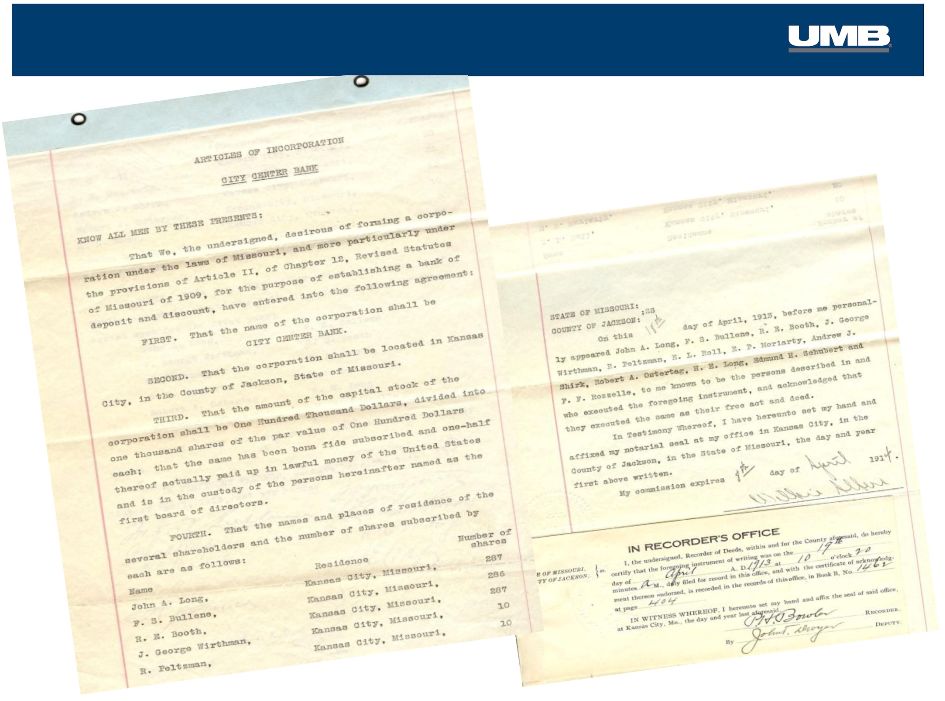 UMB
is
Born
as
City
Center
Bank
-
1913
4 |
 A
Leader
in
Serving
our
Customers
“Beginning today, motorists can do business with the
City Bank, Eighteenth Street & Grand Avenue, from the
alley between Grand & McGee streets. They can drive
to the new “cage”
and make deposits without leaving
the
car.”
The
City
Bank
is
the
first
bank
in
Kansas
City
to
utilize such a plan to overcome traffic conditions
inconvenient for patrons.”
The Kansas City Star
January 29, 1931
1931 –
KC’s First “Drive Through Bank”
5 |
 Self-Reliance and Stability
1934 –
Emerging from the Great Depression
6
No need for
government
assistance –
then
or now.
“If we were to liquidate this bank today, we
could pay our depositors one hundred cents
on the dollar and collect our entire Surplus
and
Capital
Account
of
$700,000
and
a
large
part of the Undivided Profits Account.”
-
R. Crosby Kemper, Sr. in a letter to the
Missouri Banking Commissioner, Oct. 1933 |
 “Our company has remained
true to its values and the
results are evident in our
shareholder returns.”
Mariner Kemper
Chairman & Chief Executive Officer |
 Total Returns Reflect Long-Term Performance
Total Shareholder Return
June1993 –
June 2013
8
416.8%
$100
302.4%
UMBF
S&P 500
SNL U.S. Bank
506.6% |
 UMB At A
Glance Assets under management
Banking presence
Branches/ATMs
Acquisitions last 10 years
Market cap
Dividend payout ratio*
$35.6B
$35.6B
8 states
8 states
115/320+
115/320+
23
23
>$2.4B
>$2.4B
31.8%
31.8%
Total assets
$15.3B
$15.3B
Revenue from fee businesses
58.0%
58.0%
*Average over past 4 quarters
As of June 30, 2013
9 |
 We Have
Repositioned UMB… National
Regional
Low
High
Geographic
focus
Diversity of revenue streams
More than a typical bank
More stable earnings
Faster growth
10 |
 …Resulting in a Growing National Presence
Fund Services
Prairie Capital
Healthcare
Services
–
National
Sales
Scout
Investment
Advisors
–
National
Sales
Corporate Trust
UMB Bank presence
Loan Production Office
11 |
 …
With Diverse Revenue Streams
0%
50%
100%
FY'04
FY'05
FY'06
FY'07
FY'08
FY'09
FY'10
FY'11
FY'12
2Q12
2Q13
Net Interest Income
Noninterest Income
High level of fee income reduces reliance on margin
12 |
 Today: UMB is More
than a Regional Bank… …We are a diversified
financial services company 13
DIVERSIFIED FINANCIAL SERVICES
Healthcare
Services
Corporate
Trust
UMB Fund
Services
Scout
Investments
•JD Clark
Prairie
Capital
•Reams
Trust
Services
TRADITIONAL BANKING
Card
Services
Treasury
Management
Diversified
financial
Products / services
Banking
National
Regional
Geographic
focus
UMB
Insurance |
 A
Financial Services Company The company
The business model
The performance |
 +
+
+
High Quality Credit
Diverse Revenue Streams
Low-cost Funding
Strong
Balance Sheet
Our Time-Tested Business Model |
 Our Credit
Quality Outpaces the Industry Peer Average as of 1Q13; Source: SNL
Financial Midwest Bank Peers as defined by Raymond James & Associates in
their April 11, 2011 report. 2Q 2013
NPLs =
0.40%
Shaded area is high/low range of the peer group
Non-Performing Loans
% of average loans
16
Peer Average
UMBF
7.0
6.0
5.0
4.0
3.0
2.0
1.0
0.0
1Q09
2Q09
3Q09
4Q09
1Q10
2Q10
3Q10
4Q10
1Q11
2Q11
3Q11
4Q11
1Q12
2Q12
3Q12
4Q12
1Q13
Peer
Average
2.85% |
 Today: More
Fee Revenue than Our Peers % of Total Revenue from Fees
2Q13
•
More stable earnings
•
Greater growth opportunities
Industry Median as of 1Q13; Source: SNL Financial
17
3X
vs. Industry
18.5%
58.0%
Industry
Median |
 Successful Record Growing Fee Businesses
Noninterest
Income
($000’s)
*Includes Scout Investments and UMB Bank wealth management
Asset Management
Businesses
(Total Company Assets Under Management*)
18
$62.4
$113.6
2Q13
2Q05
$8.2B
$35.6B
2Q13
2005 |
 At June 30
40.0%
vs.
Industry Median* of
18.6%
non-interest bearing
deposits
Low Cost Funding Sources
>2X
vs. Industry
Average Non-Interest Bearing
Deposits as % of Total Deposits
*Industry Median as of 1Q13; Source: SNL Financial
19
0.0%
5.0%
10.0%
15.0%
20.0%
25.0%
30.0%
35.0%
40.0%
45.0%
2004
2005
2006
2007
2008
2009
2010
2011
2012
2Q'13
UMBF
Industry Median |
 Balance
Sheet
–
Strong
with
Growth
Potential
Tier 1 Capital Ratio
2Q 2013
Without Federal bailout funds
Highly Liquid –
Low Average Loan to Deposit Ratio
2Q 2013
Industry Median as of 1Q13; Source: SNL Financial
20
13.94%
10.72%
Industry
Median
76.2%
54.0%
Industry
Median |
 Commercial Real Estate
Commercial & Industrial
Consumer Real Estate
Credit Card
Home Equity
Consumer
Commercial
Real Estate
Commercial &
Industrial
Changing Loan Mix
Consumer
Quality Loan Composition
2Q 2013
Year-End 2006
Commercial &
Industrial
Commercial
Real Estate
21
21.0%
5.2%
4.6%
20.0%
44.1%
5.1%
54.7%
24.8%
3.9%
6.7%
1.0%
9.0% |
 A Financial
Services Company The company
The business model
The performance |
 23
Consistent Performance –
Despite Headwinds
6.2%
11.7%
7.0%
5.0%
Revenue growth
Average Asset Growth
Average Equity Growth
EPS growth
5 year CAGR
(2Q’08--2Q’13)
26.5%
Total Assets Under Management
(diluted) |
 -16.7%
-14.8%
-4.2%
-3.6%
-3.6%
-3.2%
0.0%
0.01%
1.1%
2.0%
3.4%
4.99%
7.3%
8.2%
5-Year
Diluted
Earnings
Per
Share
2Q’08
–
2Q’13
CAGR
UMBF vs. Traditional Peers
*Bank industry defined as all publicly traded banks per SNL Financial;
EPS Growth vs. the Industry & Peers
CYN
Bank Industry Median *
ONB
BOH
BXS
FMER
CFR
TRMK
CBSH
HBHC
COBZ
TCB
FMBI
*All publicly traded banks with 2Q’13 reported EPS per SNL Financial
24 |
 2
nd
Quarter
2013
Highlights |
 Changing
Earning Asset Mix 2Q’08
Net Loans –
54.9%
Total
Securities
–
41.3%
26
48.5%
44.6%
41.9%
43.0%
44.9%
45.1%
49.4%
50.2%
53.2%
51.7%
0.0%
20.0%
40.0%
60.0%
80.0%
100.0%
2Q'09
2Q'10
2Q'11
2Q'12
2Q'13
Net loans
Total securities
Fed funds & resell agreements
Interest Bearing Due From Banks |
 Average Balance:
$7.2 billion
Average Yield:
1.95%
Investment Mix
Mortgage-Backed Securities
Municipals
CDs & Corporates
Agencies
Treasuries
Trading Securities
Investment Portfolio Statistics
27
Roll off
Purchased
($ millions)
Yield
($ millions)
Yield
2Q12
$396
2.52%
$636
1.69%
1Q13
$413
1.98%
$769
1.31%
2Q13
$340
2.13%
$815
1.41%
Scheduled
Cash
Flow
3Q13
$269
1.81%
Next 12 months
$1,230
1.88%
Duration/Life
(in months)
at 06/30/13
at 03/31/13
Avg. Life Total
48.67
42.79
Avg. Life Core
48.98
43.67
Avg. Life Noncore
32.48
5.29
Duration Total
46.80
39.75
Duration Core
47.11
40.54
Securities Gains
($ millions)
2Q12
3,222
$
3Q12
259
$
4Q12
210
$
1Q13
5,893
$
2Q13
1,519
$
1.4%
14.6%
45.1%
31.1%
7.0%
0.7% |
 Liabilities
Deposit Growth & % of Free Funds
($ billions)
2Q’13
Cost of Funds 0.18%
Including DDA 0.11%
28
38.5%
40.8%
41.7%
34.0%
$0.0
$2.0
$4.0
$6.0
$8.0
$10.0
$12.0
Interest Bearing
Non-Interest Bearing
$11.7
$10.3
$9.9
$8.4 |
 Capital
Total Shareholder Equity
29
Shareholder Equity ($billions)
TCE Ratio
Q2'10
Q3'10
Q4'10
Q1'11
Q2'11
Q3'11
Q4'11
Q1'12
Q2'12
Q3'12
Q4'12
Q1'13
Q2'13
4.0%
6.0%
8.0%
10.0%
8.13%
7.71%
6.26%
5.97%
6.66%
7.36%
6.76%
6.90%
7.48%
7.78%
7.49%
6.55%
6.37%
$1.07
$1.09
$1.06
$1.08
$1.13
$1.17
$1.19
$1.21
$1.25
$1.29
$1.28
$1.29
$1.23 |
 Net
Interest Income 2Q’13 net interest income increased 2.4% vs. 2Q’12;
driven by earning asset growth and improved deposit pricing
30
$77.7
$78.4
$78.8
$78.4
$79.9
$79.1
$79.5
$79.1
$80.4
$80.4
$80.2
$79.5
$82.3
3.13%
3.09%
3.15%
2.90%
2.98%
2.98%
2.91%
2.75%
2.82%
2.80%
2.64%
2.51%
2.56%
$65.0
$67.0
$69.0
$71.0
$73.0
$75.0
$77.0
$79.0
$81.0
$83.0
$85.0
2Q'10
3Q'10
4Q'10
1Q'11
2Q'11
3Q'11
4Q'11
1Q'12
2Q'12
3Q'12
4Q'12
1Q'13
2Q'13
Net Interest Income
NIM% |
 Noninterest
Income Highlights 5 Year
CAGR
2Q’08–
2Q’13
13.9%
Trust & Securities Process Revenue
Trust & Securities Processing Composition
:
Bankcard Fees
Deposit Service Charges
Insurance Fees & Commissions
Trading & Investment Banking
Trust & Securities Processing
Gains on Sale of Securities
Brokerage Fees
Other
$63.5 million in 2Q13
Primary components:
•$29.2M -
Institutional Investment Management
•$19.3M –
Asset Servicing
•$15.0M –
Personal & Institutional Asset Mgmt in
the Bank segment
31
55.9%
4.8%
18.4%
1.1%
2.5%
14.1%
1.3%
1.9%
$33.1
$28.6
$38.6
$53.6
$55.8
$63.5 |
 Noninterest
Expense 32
Noninterest expense increased 3.9% to $150.3 million vs. 2Q’12
•
Increase primarily driven by higher salary and benefits expense of $5.6
million and increased processing fees of $1.7 million related to
fees
paid to third-party distributors of the Scout Funds.
0%
10%
20%
30%
40%
50%
60%
70%
80%
90%
100%
$40
$60
$80
$100
$120
$140
$160
$180
Salary/Benefit Expense
Noninterest Income
Total Noninterest Expense
Coverage Ratio*
Salary
CAGR
8.7%
NI
Income
CAGR
7.6%
NI
Expense
CAGR
7.2%
Managed FTE Costs; Growing Noninterest Income |
 Business Segment Updates |
 Institutional
Investment Management $22.4
$22.6
$23.5
$25.7
$26.3
2Q'12
3Q'12
4Q'12
1Q'13
2Q'13
Total Scout Assets Under Management
($ billions)
* Industry data source: Strategic Insight
AUM increased 17.5% year-
over-year to $26.3 billion
Net inflows of $902 million for
Q2’13; year-to-date flows of
$2.5 billion
Q2’13 industry stats: Equity
funds realized $68.8B in net
inflows; Taxable bond funds
realized $3.0B in net inflows
2
nd
Quarter
2013
Highlights
Institutional Investment Management Operating Results
3 mos Ended
March 31,
Year-Over-Year
Linked-Quarter
2013
2012
2013
Net Interest income
(10)
-
-
-
-
Noninterest income
29,160
23,625
28,553
23.43%
2.13%
Noninterest expense
18,932
16,486
18,958
14.84%
-0.14%
NI before taxes
10,218
7,139
9,595
43.13%
6.49%
Income tax expense
2,691
2,197
2,635
22.49%
2.13%
Net income
7,527
4,942
6,960
52.31%
8.15%
pre-tax profit margin
35.1%
30.2%
33.6%
Ended June 30,
% Change
3 mos Ended
34 |
 $51.6
$119.8
$1,435.7
$171.8
$703.5
$606.4
$585.7
($84.0)
($622.9)
$204.1
$134.4
$729.9
$354.0
$2.4
$48.7
($250.4)
-$1,000
-$500
$0
$500
$1,000
$1,500
$2,000
$2,500
3Q'12
4Q'12
1Q'13
2Q'13
Equity Flows
Equity Market Impact
Fixed Income Flows
Fixed Income Market Impact
AUM Drivers
($millions)
$2,204.5
$932.7
$486.2
Total Change
($millions)
$25,746.8
$23,542.3
$22,609.6
Total AUM
($millions)
$567.3
$26,314.1
Institutional Investment Management
35 |
 Total AUM
$19.9B
$19.7B
$23.5B
$25.7B
$26.3B
Institutional Investment Management
36
$8.1
$8.2
$10.4
$11.0
$11.1
$0.2
$0.6
$0.9
$1.0
$1.3
$0.8
$0.6
$0.6
$0.8
$2.3
$2.3
$10.2
$10.3
$11.4
$11.4
$11.6
2010
2011
2012
1Q13
2Q13
Equity Mutual Funds
Fixed Income Mutual Funds
Money Market
Equity Institutional & Other
Fixed Income Institutional & Other |
 AUM
by
Strategy
–
As
of
2Q’13
Acquired Reams Asset
Management in
December 2010
37
Equity Strategies
International
Mid Cap
International ADR
Emerging Markets
Global
Small Cap
Other:
Equity
Fixed Income
49.0%
51.0%
Fixed Income Strategies
Core Plus
Core
Low Duration
Long Duration
Intermediate
Unconstrained
Global Aggregate
70.4%
24.7%
2.7%
1.9%
0.2%
29.4%
9.7%
23.3%
16.1%
2.1%
19.2%
0.2% |
 Fixed Income Rotation
Change in Fixed Income
Strategies
Core Plus
Core
Low Duration
Long Duration
Intermediate
Unconstrained
Global Aggregate
2Q’13
2Q’12
38
47.3%
14.7%
21.3%
12.4%
2.1%
2.0%
0.1%
29.4%
9.7%
23.3%
16.1%
2.1%
19.2%
0.2% |
 Asset
Servicing 39
$162.4
$179.3
$206.4
$156.0
$165.4
$168.0
2009
2010
2011
2012
1Q13
2Q13
Asset Servicing Operating Results
3 mos Ended
March 31,
Year-Over-Year
Linked-Quarter
2013
2012
2013
Net interest income
587
463
675
26.78%
-13.04%
Noninterest income
19,275
18,779
20,278
2.64%
-4.95%
Noninterest expense
17,054
17,296
19,932
-1.40%
-14.44%
NI before taxes
2,808
1,946
1,021
44.30%
175.02%
Income tax expense
967
838
578
15.39%
67.30%
Net income
1,841
1,108
443
66.16%
315.58%
pre-tax profit margin
14.1%
10.1%
4.9%
% Change
Ended June 30,
3 mos Ended
2
nd
Quarter
2013
Highlights
Assets Under Administration
Total AUA increased by 14% to
$168 billion
Multiple-Series Trust surpasses
$5 billion; doubled assets in < 1
year |
 Asset Servicing Fund Accounting & Administration
Alternative Asset Servicing
Custody
Transfer Agency
Business Metrics
40
$30.5
$35.9
$40.2
$39.8
$41.7
$44.1
$48.4
$52.1
2010
2011
1Q'12
2Q'12
3Q'12
4Q'12
1Q'13
2Q'13
Assets Under Administration
# of Funds Serviced
179
181
116
160
170
170
170
182
$21.3
$24.7
$25.2
$25.8
$26.1
$26.3
$27.9
$28.3
2010
2011
1Q'12
2Q'12
3Q'12
4Q'12
1Q'13
2Q'13
Assets Under Administration
# of Funds Serviced
406
467
487
504
520
532
543
549
$101.4
$115.6
$129.0
$48.5
$50.9
$54.9
$58.5
$56.2
2010
2011
1Q'12
2Q'12
3Q'12
4Q'12
1Q'13
2Q'13
Assets Under Administration
# of Custody Accounts
470
499
511
418
423
443
432
400
554.9
802.4
884.1
882.1
946.8
1,058.7
1,213.8
2010
2011
1Q'12
2Q'12
3Q'12
4Q'12
1Q'13
2Q'13
# of Shareholders
# of Funds Serviced
227
256
244
272
255
270
275
284
944.8 |
 Payment
Solutions Total
Card
Purchase
Volume
&
Interchange
Revenue
Durbin
effective
Payment Solutions Operating Results
3 mos Ended
March 31,
Year-Over-Year
Linked-Quarter
2013
2012
2013
Net interest income
11,192
10,556
11,548
6.03%
-3.08%
Provision for loan losses
3,318
2,278
1,743
45.65%
90.36%
Noninterest income
18,649
18,106
19,437
3.00%
-4.05%
Noninterest expense
21,986
16,620
20,051
32.29%
9.65%
NI before taxes
4,537
9,764
9,191
-53.53%
-50.64%
Income tax expense
1,350
2,791
2,786
-51.63%
-51.54%
Net income
3,187
6,973
6,405
-54.30%
-50.24%
pre-tax profit margin
15.2%
34.1%
29.7%
% Change
Ended June 30,
3 mos Ended
Purchase
Volume
2Q ‘09–’13
18.1%
Inter-
change
2Q ‘09–’13
12.6%
CAGR
Total debit and credit card
purchase volume +16.5% to
$1.72 billion
Interchange revenue +10% to
$17.1 million
2
nd
Quarter 2013 Highlights
41
$0.88
$0.85
$0.85
$1.04
$1.10
$1.06
$1.08
$1.31
$1.36
$1.29
$1.26
$1.58
$1.48
$1.37
$1.38
$1.79
$1.72
$10.7
$13.7
$15.8
$15.6
$17.1
Purchase Volume ($ billions)
Interchange ($ millions) |
 Payment
Solutions Health Savings Accounts & Balances
* Deposits and investment assets
Healthcare card purchase volume
+39.6% to $748.6 million
Interchange contribution +43% to
$2.7 million
2
Quarter 2013 Highlights
Healthcare Services
Card Utilization
42
Commitments
Outstandings
Utilization
2009
2010
2011
2012
2Q '13
$296.7
$405.8
$422.4
$429.4
$410.2
18.5%
22.9%
17.0%
16.4%
15.6%
$1,602.5
$1,774.7
$2,484.1
$2,613.1
$2,629.0
HSA Balances*
# of accts
2009
2010
2011
2012
1Q13
2Q13
1.3
1.8
2.5
3.1
3.1
3.2
$190.7
$279.9
$323.3
$433.4
$607.6
$596.2
1.0
2.0
3.0
4.0
5.0
nd |
 Bank
Assets Under Management
($ billions)
Bank Operating Results
3 mos Ended
March 31,
Year-Over-Year
Linked-Quarter
2013
2012
2013
Net interest income
70,558
69,354
67,260
1.74%
4.90%
Provision for loan losses
1,682
2,222
257
-24.30%
554.47%
Noninterest income
46,501
49,716
52,748
-6.47%
-11.84%
Noninterest expense
92,339
94,284
91,437
-2.06%
0.99%
NI before taxes
23,038
22,564
28,314
2.10%
-18.63%
Income tax expense
5,664
6,422
7,181
-11.80%
-21.13%
Net income
17,374
16,142
21,133
7.63%
-17.79%
pre-tax profit margin
19.7%
19.0%
23.6%
3 mos Ended
% Change
Ended June 30,
HELOC Lending
Individual & institutional wealth management assets in Bank segment
Small Business Banking loans
increased 25% year-over-year to
$158.5 million
Private Banking exceeded $280 million
in average loan balances, an increase
of 40.9% over Q2 2012
UMB ranked #1 in C&I and CRE loan
growth for 1Q13 vs. 4Q12 compared to
our “Regional Competitor Banks”
(Source: SNL Financial)
2
Quarter 2013 Highlights
43
nd
Commitments
Balances
Utilization
2008
2009
2010
2011
2012
2Q13
$365
$430
$465
$524
$548
$551
49.3%
49.2%
49.4%
49.0%
47.1%
46.1%
$741
$873
$941
$1,070
$1,163
$1,196
2008
2009
2010
2011
2012
2Q13
$4.4
$4.5
$8.0
$8.3
$9.6
$9.2 |
 $3.03
$3.46
$3.46
$3.75
$4.20
$5.00
2Q'08
2Q'09
2Q'10
2Q'11
2Q'12
2Q'13
Bank
High Growth Regions
2Q’13 vs. 2Q’12
•
Arizona
+67%
•
Nebraska
+37%
48.5%
48.2%
47.3%
46.1%
43.9%
42.8%
0%
50%
100%
2Q'08
2Q'09
2Q'10
2Q'11
2Q'12
2Q'13
KC
CO
STL
Greater MO
KS
OK
AZ
NE
Commercial Loan Concentration By Region
•
St. Louis
+26%
•
Oklahoma +20%
Commercial Loan Growth
(C&I and CRE Loans)
44
5 yr
CAGR
2Q ‘08–’13
10.6% |
 Bank
Total Deposits
5 yr
CAGR
2Q ‘08–’13
16.5%
Deposits By Region
45
31.3%
32.3%
33.5%
33.7%
40.0%
40.0%
$6.3
$7.6
$8.3
$9.5
$10.3
$11.6
2Q'08
2Q'09
2Q'10
2Q'11
2Q'12
2Q'13
Interest Bearing
Non-Interest Bearing
52.4%
54.3%
55.3%
58.8%
60.2%
63.6%
0%
50%
100%
2Q'08
2Q'09
2Q'10
2Q'11
2Q'12
2Q'13
KC
STL
CO
Gtr MO
KS
OK
AZ
NE |
 Strengths We
are Leveraging Growing fee
businesses
Infrastructure
Success building a diversified
financial services company
Building scale through
strategic acquisitions
Existing technology, operations,
products, distribution
46
Diversified
revenue |
 Building a company
for the next 100 years.
UMB Financial
Second Quarter 2013 |