Attached files
| file | filename |
|---|---|
| 8-K - FORM 8-K - TTM TECHNOLOGIES INC | d584440d8k.htm |
Exhibit 99.1
| TTM Technologies Investor Presentation August 2013 |
| 2 Safe Harbor This presentation contains forward-looking statements that relate to future events or performance. These statements reflect the Company's current expectations, and the Company does not undertake to update or revise these forward-looking statements, even if experience or future changes make it clear that any projected results expressed or implied in this or other company statements will not be realized. Furthermore, readers are cautioned that these statements involve risks and uncertainties, many of which are beyond the company's control, which could cause actual results to differ materially from the forward-looking statements. These risks and uncertainties include, but are not limited to, the company's dependence upon the electronics industry, contemplated significant capital expenditures and related financing requirements, the Company's dependence upon a small number of customers, the unpredictability of and potential fluctuation in future revenues and operating results and other "Risk Factors" set forth in the Company's most recent SEC filings. The company also will present non-GAAP financial information in this presentation. For a reconciliation of TTM's non-GAAP financial information to the equivalent measures under GAAP, please refer to the company's press release, which was filed with the SEC and which is posted on TTM's website. |
| TTM Differentiated Leadership Position A leading global PCB manufacturer - $1.3 billion in revenue* Broad product offering with a focus on advanced technology Leader in Aerospace and Defense, networking and telecom, and advanced mobile devices Diversified end markets with broad customer base Strong operating cash flow generation * Based on 2012 sales 3 |
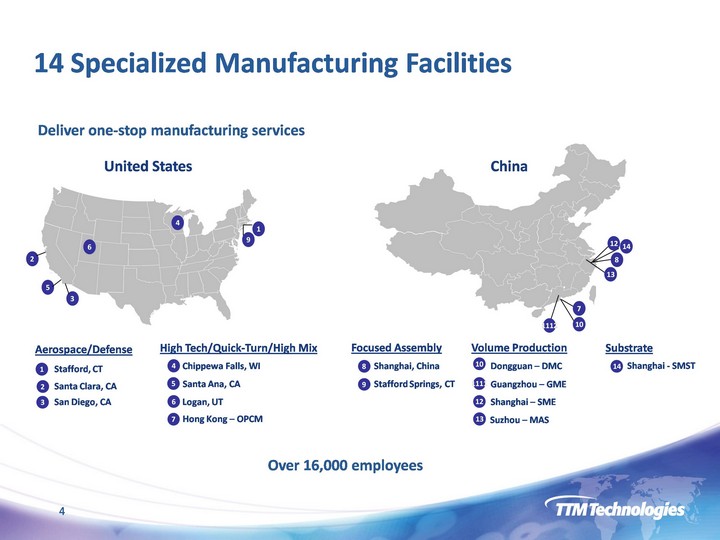
| 14 Specialized Manufacturing Facilities Deliver one-stop manufacturing services Focused Assembly 8 Shanghai, China 1 Stafford, CT 3 San Diego, CA Aerospace/Defense 5 High Tech/Quick-Turn/High Mix 4 Chippewa Falls, WI 2 Santa Clara, CA Santa Ana, CA 6 Logan, UT 9 Stafford Springs, CT China Volume Production 10 Dongguan - DMC 1111 Guangzhou - GME 12 Shanghai - SME 13 Suzhou - MAS Substrate 14 Shanghai - SMST 7 Hong Kong - OPCM 1 9 2 5 3 4 6 United States 7 10 1112 12 14 8 13 Over 16,000 employees 4 |
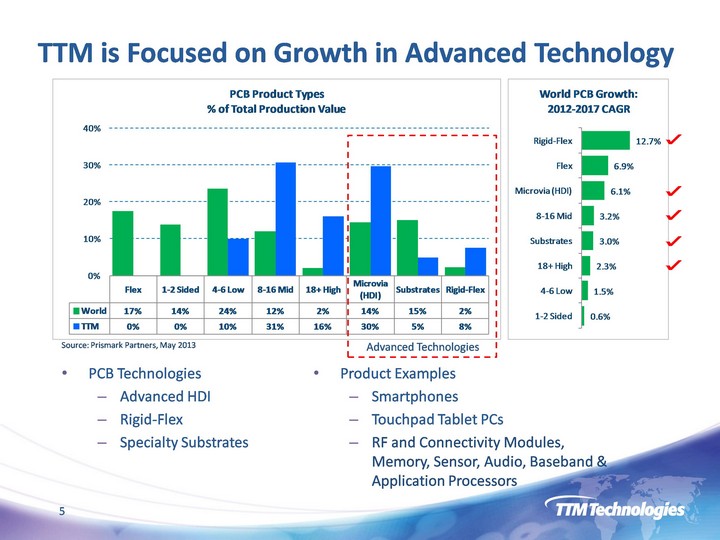
| TTM is Focused on Growth in Advanced Technology Source: Prismark Partners, May 2013 Advanced Technologies 5 PCB Technologies Advanced HDI Rigid-Flex Specialty Substrates Product Examples Smartphones Touchpad Tablet PCs RF and Connectivity Modules, Memory, Sensor, Audio, Baseband & Application Processors |
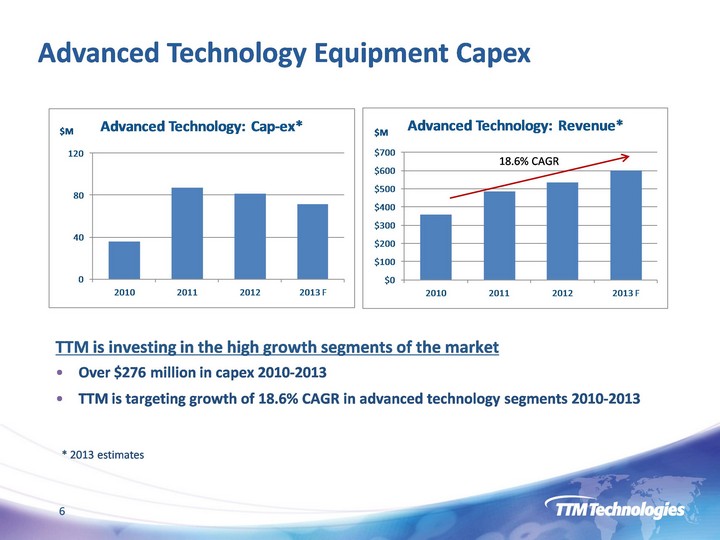
| Advanced Technology Equipment Capex 6 * 2013 estimates 18.6% CAGR Over $276 million in capex 2010-2013 TTM is targeting growth of 18.6% CAGR in advanced technology segments 2010-2013 TTM is investing in the high growth segments of the market |
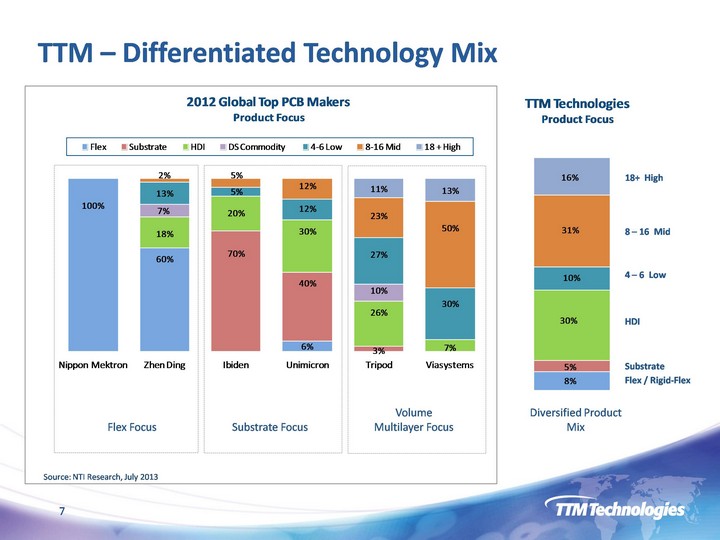
| TTM - Differentiated Technology Mix 18+ High 4 - 6 Low HDI Substrate Flex / Rigid-Flex 8 - 16 Mid Flex Focus Substrate Focus Volume Multilayer Focus Diversified Product Mix Source: NTI Research, July 2013 7 |
| 8 TTM End Markets |
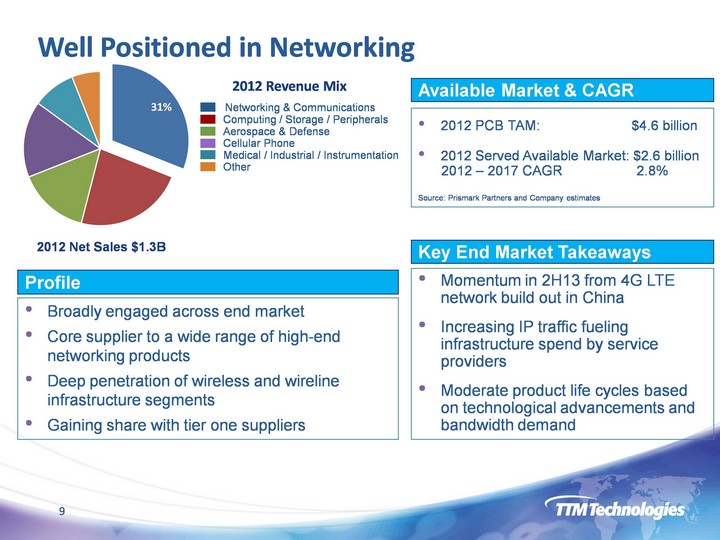
| Well Positioned in Networking (CHART) Profile Key End Market Takeaways Broadly engaged across end market Core supplier to a wide range of high-end networking products Deep penetration of wireless and wireline infrastructure segments Gaining share with tier one suppliers Momentum in 2H13 from 4G LTE network build out in China Increasing IP traffic fueling infrastructure spend by service providers Moderate product life cycles based on technological advancements and bandwidth demand 2012 Net Sales $1.3B Available Market & CAGR Networking & Communications Computing / Storage / Peripherals Aerospace & Defense Cellular Phone Medical / Industrial / Instrumentation Other 9 2012 Revenue Mix 2012 PCB TAM: $4.6 billion 2012 Served Available Market: $2.6 billion 2012 - 2017 CAGR 2.8% Source: Prismark Partners and Company estimates |
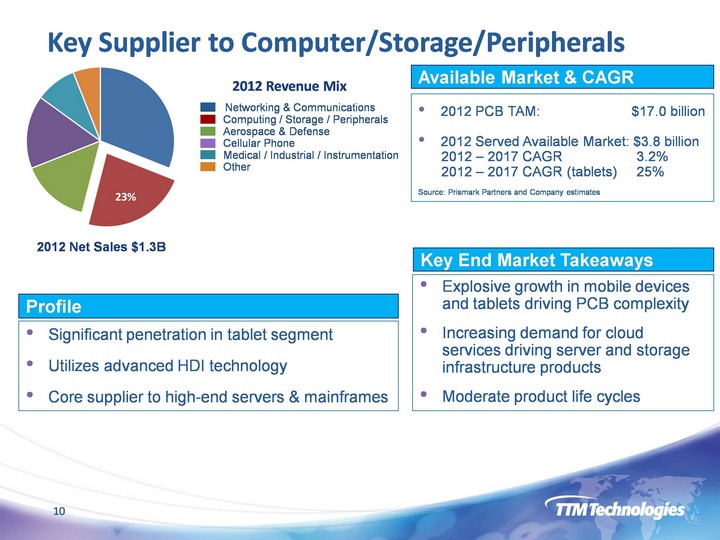
| Key Supplier to Computer/Storage/Peripherals Key End Market Takeaways Significant penetration in tablet segment Utilizes advanced HDI technology Core supplier to high-end servers & mainframes Explosive growth in mobile devices and tablets driving PCB complexity Increasing demand for cloud services driving server and storage infrastructure products Moderate product life cycles (CHART) 2012 Revenue Mix Networking & Communications Computing / Storage / Peripherals Aerospace & Defense Cellular Phone Medical / Industrial / Instrumentation Other Profile Available Market & CAGR 2012 PCB TAM: $17.0 billion 2012 Served Available Market: $3.8 billion 2012 - 2017 CAGR 3.2% 2012 - 2017 CAGR (tablets) 25% Source: Prismark Partners and Company estimates 10 2012 Net Sales $1.3B |
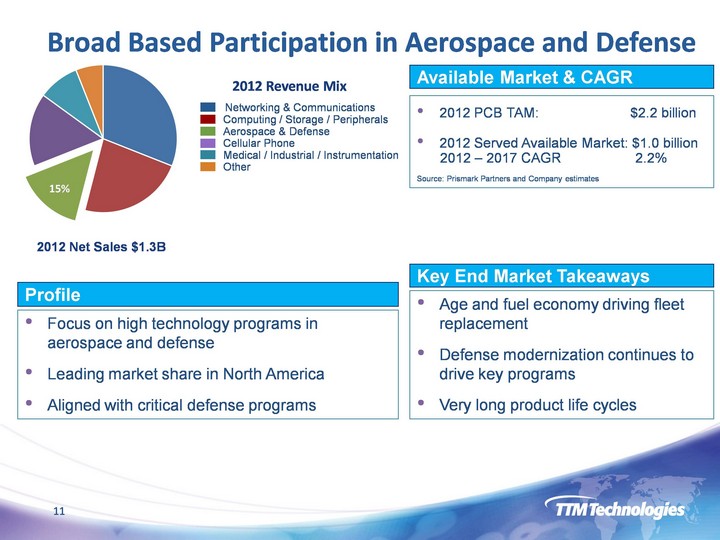
| Broad Based Participation in Aerospace and Defense Focus on high technology programs in aerospace and defense Leading market share in North America Aligned with critical defense programs Age and fuel economy driving fleet replacement Defense modernization continues to drive key programs Very long product life cycles (CHART) 2012 Revenue Mix Profile Key End Market Takeaways Available Market & CAGR 2012 PCB TAM: $2.2 billion 2012 Served Available Market: $1.0 billion 2012 - 2017 CAGR 2.2% Source: Prismark Partners and Company estimates Networking & Communications Computing / Storage / Peripherals Aerospace & Defense Cellular Phone Medical / Industrial / Instrumentation Other 11 2012 Net Sales $1.3B |
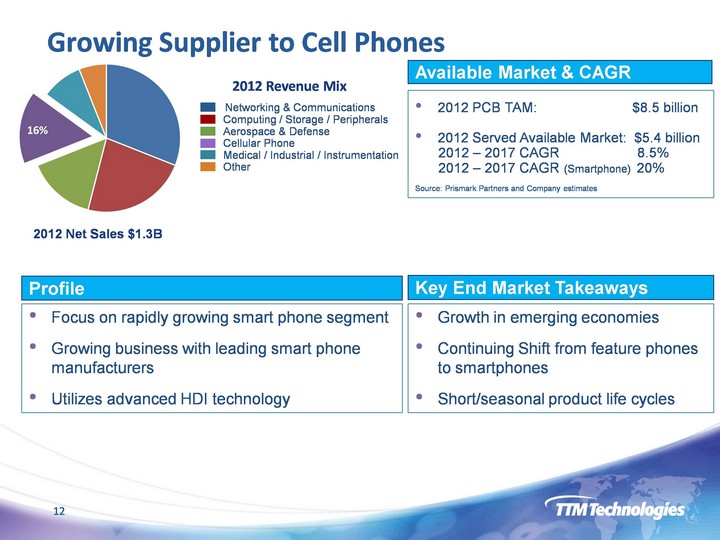
| Growing Supplier to Cell Phones Focus on rapidly growing smart phone segment Growing business with leading smart phone manufacturers Utilizes advanced HDI technology Growth in emerging economies Continuing Shift from feature phones to smartphones Short/seasonal product life cycles (CHART) 2012 Net Sales $1.3B 2012 Revenue Mix Profile Key End Market Takeaways 2012 PCB TAM: $8.5 billion 2012 Served Available Market: $5.4 billion 2012 - 2017 CAGR 8.5% 2012 - 2017 CAGR (Smartphone) 20% Source: Prismark Partners and Company estimates Networking & Communications Computing / Storage / Peripherals Aerospace & Defense Cellular Phone Medical / Industrial / Instrumentation Other 12 Available Market & CAGR |
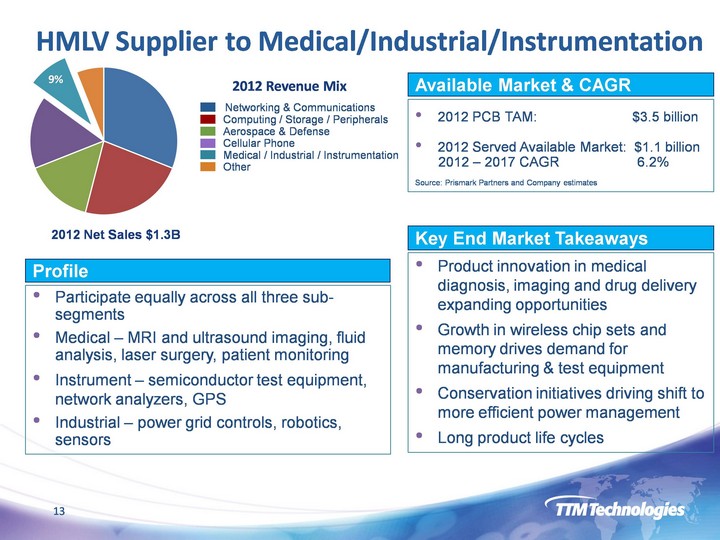
| HMLV Supplier to Medical/Industrial/Instrumentation Participate equally across all three sub- segments Medical - MRI and ultrasound imaging, fluid analysis, laser surgery, patient monitoring Instrument - semiconductor test equipment, network analyzers, GPS Industrial - power grid controls, robotics, sensors Product innovation in medical diagnosis, imaging and drug delivery expanding opportunities Growth in wireless chip sets and memory drives demand for manufacturing & test equipment Conservation initiatives driving shift to more efficient power management Long product life cycles 2012 Net Sales $1.3B 2012 Revenue Mix Available Market & CAGR 2012 PCB TAM: $3.5 billion 2012 Served Available Market: $1.1 billion 2012 - 2017 CAGR 6.2% Source: Prismark Partners and Company estimates (CHART) Networking & Communications Computing / Storage / Peripherals Aerospace & Defense Cellular Phone Medical / Industrial / Instrumentation Other 13 Key End Market Takeaways Profile |
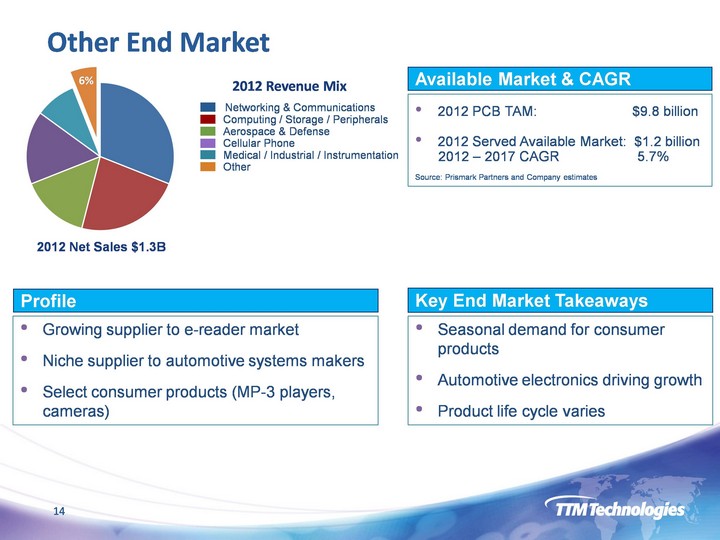
| (CHART) 2012 Revenue Mix Growing supplier to e-reader market Niche supplier to automotive systems makers Select consumer products (MP-3 players, cameras) Profile Seasonal demand for consumer products Automotive electronics driving growth Product life cycle varies 2012 PCB TAM: $9.8 billion 2012 Served Available Market: $1.2 billion 2012 - 2017 CAGR 5.7% Source: Prismark Partners and Company estimates 14 Key End Market Takeaways Available Market & CAGR Other End Market 2012 Net Sales $1.3B Networking & Communications Computing / Storage / Peripherals Aerospace & Defense Cellular Phone Medical / Industrial / Instrumentation Other |
| 15 Strategic Initiatives Continued focus on delivering advanced technology to broad base of customers across diverse end markets Increase product mix toward advanced HDI and rigid- flex Leverage niche position in substrates Evaluate M&A opportunities to drive further growth Manage balance sheet for growth and risk |

| 16 Financial Overview |
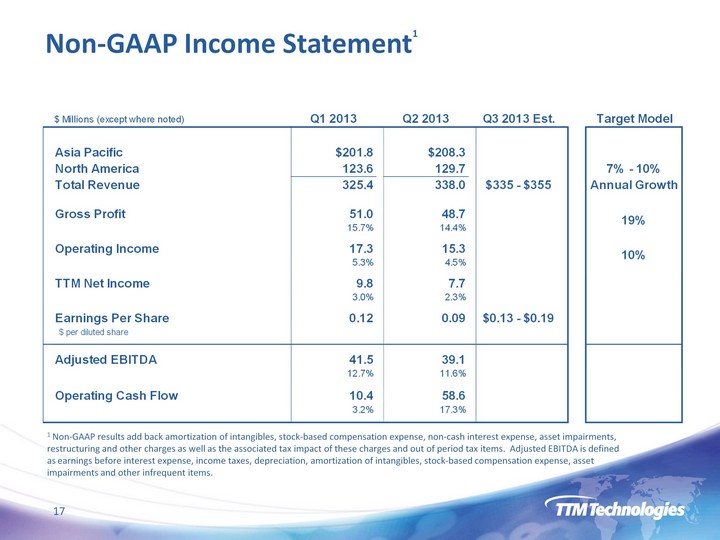
| Non-GAAP Income Statement1 1 Non-GAAP results add back amortization of intangibles, stock-based compensation expense, non-cash interest expense, asset impairments, restructuring and other charges as well as the associated tax impact of these changes and out of period tax items. Adjusted EBITDA is defined as earnings before interest expense, income taxes, depreciation, amortization of intangibles, stock-based compensation expense, asset impairments and other infrequent items. 17 |
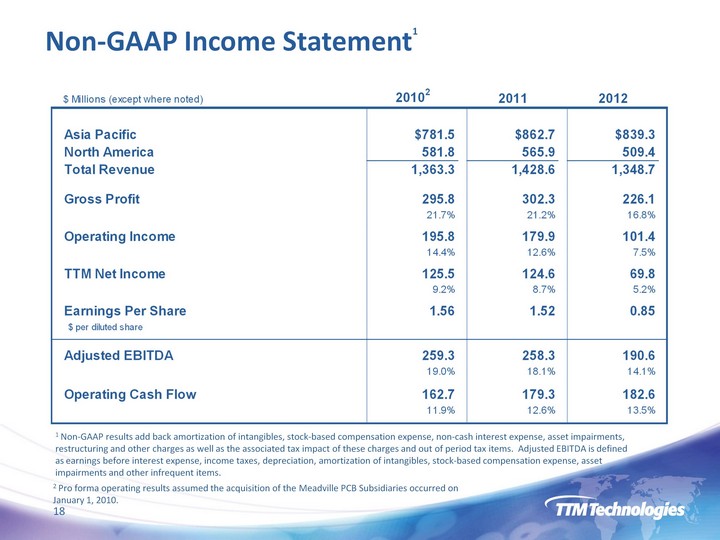
| Non-GAAP Income Statement1 1 Non-GAAP results add back amortization of intangibles, stock-based compensation expense, non-cash interest expense, asset impairments, restructuring and other charges as well as the associated tax impact of these changes and out of period tax items. Adjusted EBITDA is defined as earnings before interest expense, income taxes, depreciation, amortization of intangibles, stock-based compensation expense, asset impairments and other infrequent items. 2 Pro forma operating results assumed the acquisition of the Meadville PCB Subsidiaries occurred on January 1, 2010. 18 |
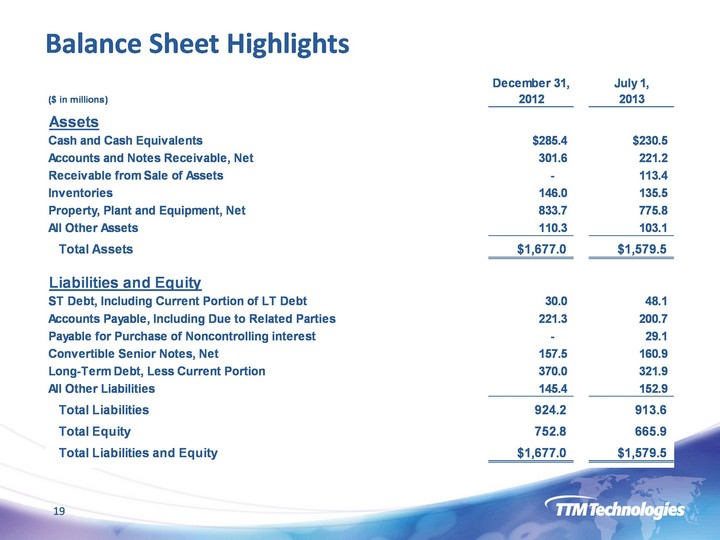
| Balance Sheet Highlights 19 |
| Investment Highlights 20 Well positioned in high growth segments of the PCB market Market leader in advanced technology PCBs globally Diversified end markets with broad customer base Healthy balance sheet and solid cash flow funding growth |
| 21 Appendix |
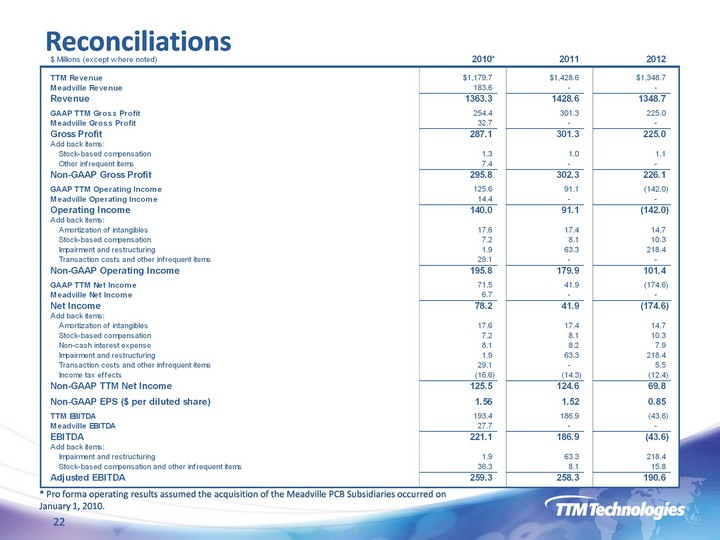
| Reconciliations * Pro forma operating results assumed the acquisition of the Meadville PCB Subsidiaries occurred on January 1, 2010. 22 |
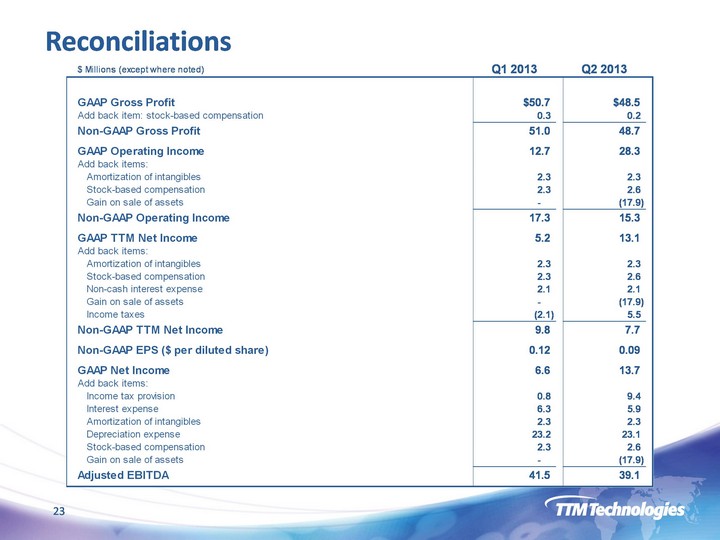
| Reconciliations 23 |
| IR Contacts 24 Asia Pacific Audrey Sim VP, Investor Relations & Marketing e-mail: audrey.sim@ttmtech.com.hk Corporate Todd Schull EVP & Chief Financial Officer e-mail: investor@ttmtech.com |