Attached files
| file | filename |
|---|---|
| 8-K - FORM 8-K - rue21, inc. | d580825d8k.htm |
Exhibit 99.1
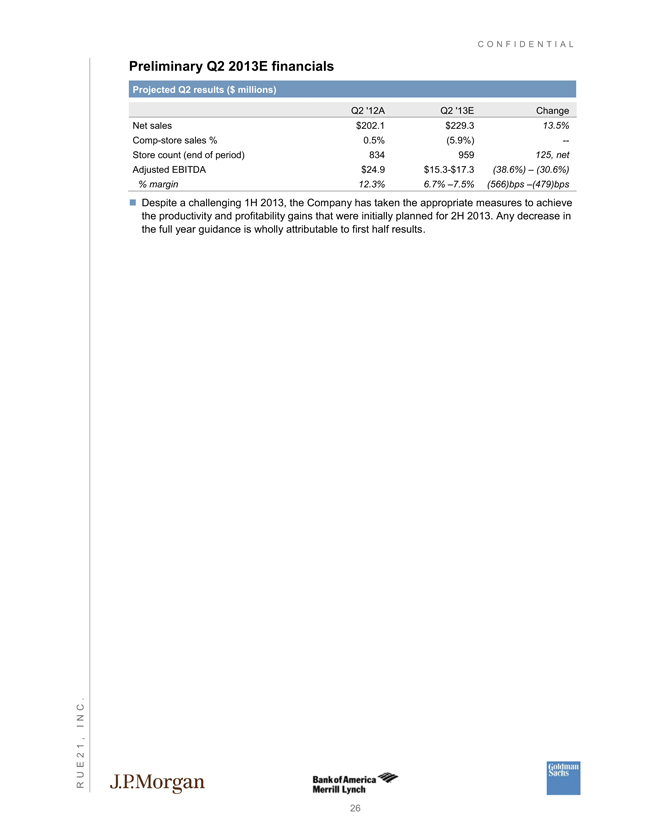
C O N F I D E N T I A L Preliminary Q2 2013E financials Projected Q2 results ($ millions) Q2 ’12A Q2 ’13E Change Net sales $202.1 $229.3 13.5% Comp-store sales % 0.5% (5.9%) -- Store count (end of period) 834 959 125, net Adjusted EBITDA $24.9 $15.3-$17.3 (38.6%) – (30.6%) % margin 12.3% 6.7% –7.5% (566)bps –(479)bps Despite a challenging 1H 2013, the Company has taken the appropriate measures to achieve the productivity and profitability gains that were initially planned for 2H 2013. Any decrease in the full year guidance is wholly attributable to first half results. R U E 2 1 , I N C . JP MORGAN Bank of America Merrill Lynch Goldman Sachs 26
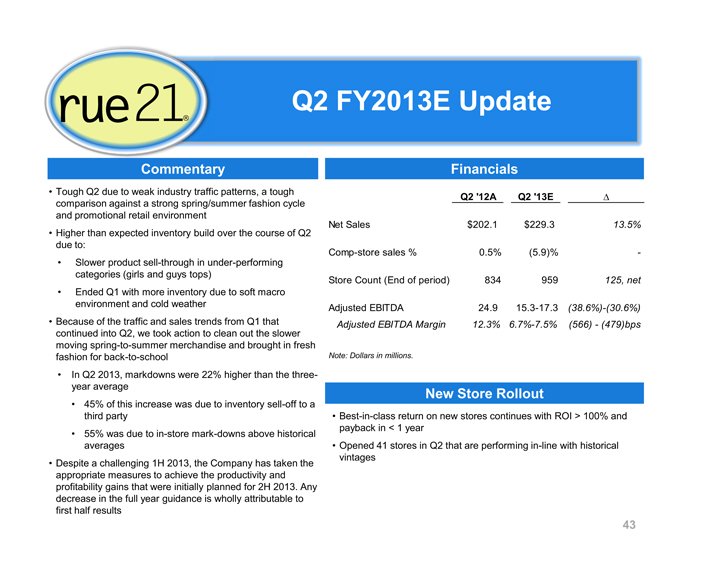
rue 21 Q2 FY2013E Update Commentary Tough Q2 due to weak industry traffic patterns, a tough comparison against a strong spring/summer fashion cycle and promotional retail environment Higher than expected inventory build over the course of Q2 due to: Slower product sell-through in under-performing categories (girls and guys tops) Ended Q1 with more inventory due to soft macro environment and cold weather Because of the traffic and sales trends from Q1 that continued into Q2, we took action to clean out the slower moving spring-to-summer merchandise and brought in fresh fashion for back-to-school In Q2 2013, markdowns were 22% higher than the three-year average 45% of this increase was due to inventory sell-off to a third party 55% was due to in-store mark-downs above historical averages Despite a challenging 1H 2013, the Company has taken the appropriate measures to achieve the productivity and profitability gains that were initially planned for 2H 2013. Any decrease in the full year guidance is wholly attributable to first half results Financials Q2 ’12A Q2 ’13E Net Sales $202.1 $229.3 13.5% Comp-store sales % 0.5% (5.9)% -Store Count (End of period) 834 959 125, net Adjusted EBITDA 24.9 15.3-17.3 (38.6%)-(30.6%) Adjusted EBITDA Margin 12.3% 6.7%-7.5% (566) - (479)bps Note: Dollars in millions. New Store Rollout Best-in-class return on new stores continues with ROI > 100% and payback in < 1 year Opened 41 stores in Q2 that are performing in-line with historical vintages 43
C O N F I D E N T I A L
6. Financial information
Summary historical financial information
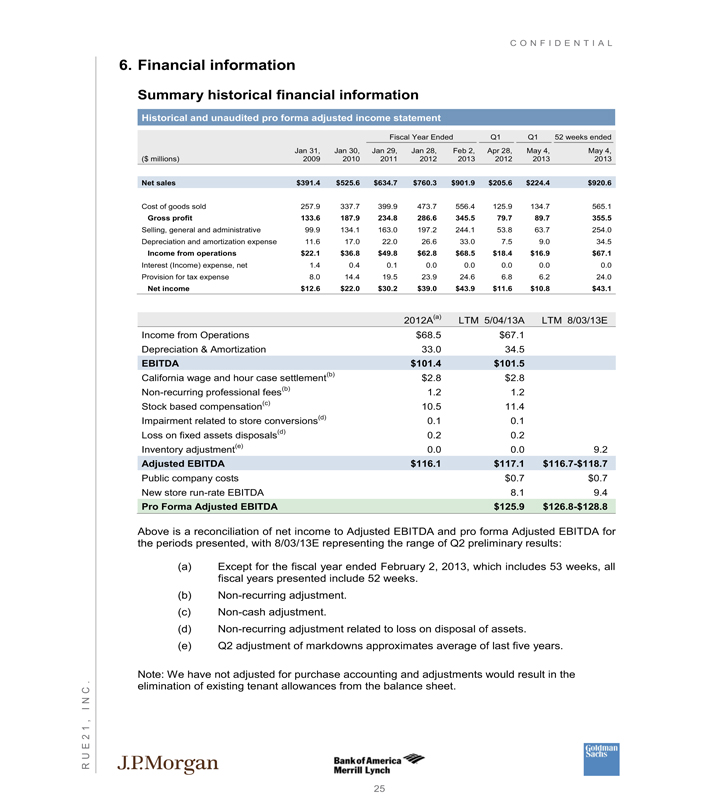
Historical and unaudited pro forma adjusted income statement
Fiscal Year Ended Q1 Q1 52 weeks ended
Jan 31, Jan 30, Jan 29, Jan 28, Feb 2, Apr 28, May 4, May 4,
($ millions) 2009 2010 2011 2012 2013 2012 2013 2013
Net sales $391.4 $525.6 $634.7 $760.3 $901.9 $205.6 $224.4 $920.6
Cost of goods sold 257.9 337.7 399.9 473.7 556.4 125.9 134.7 565.1
Gross profit 133.6 187.9 234.8 286.6 345.5 79.7 89.7 355.5
Selling, general and administrative 99.9 134.1 163.0 197.2 244.1 53.8 63.7 254.0
Depreciation and amortization expense 11.6 17.0 22.0 26.6 33.0 7.5 9.0 34.5
Income from operations $22.1 $36.8 $49.8 $62.8 $68.5 $18.4 $16.9 $67.1
Interest (Income) expense, net 1.4 0.4 0.1 0.0 0.0 0.0 0.0 0.0
Provision for tax expense 8.0 14.4 19.5 23.9 24.6 6.8 6.2 24.0
Net income $12.6 $22.0 $30.2 $39.0 $43.9 $11.6 $10.8 $43.1
2012A(a) LTM 5/04/13A LTM 8/03/13E
Income from Operations $68.5 $67.1
Depreciation & Amortization 33.0 34.5
EBITDA $101.4 $101.5
California wage and hour case settlement(b) $2.8 $2.8
Non-recurring professional fees(b) 1.2 1.2
Stock based compensation(c) 10.5 11.4
Impairment related to store conversions(d) 0.1 0.1
Loss on fixed assets disposals(d) 0.2 0.2
Inventory adjustment(e) 0.0 0.0 9.2
Adjusted EBITDA $116.1 $117.1 $116.7-$118.7
Public company costs $0.7 $0.7
New store run-rate EBITDA 8.1 9.4
Pro Forma Adjusted EBITDA $125.9 $126.8-$128.8
Above is a reconciliation of net income to Adjusted EBITDA and pro forma Adjusted EBITDA for
the periods presented, with 8/03/13E representing the range of Q2 preliminary results:
(a) Except for the fiscal year ended February 2, 2013, which includes 53 weeks, all
fiscal years presented include 52 weeks.
(b) Non-recurring adjustment.
(c) Non-cash adjustment.
(d) Non-recurring adjustment related to loss on disposal of assets.
(e) Q2 adjustment of markdowns approximates average of last five years.
Note: We have not adjusted for purchase accounting and adjustments would result in the
. elimination of existing tenant allowances from the balance sheet.
C
N
25
Adjusted EBITDA
Reconciliation
LTM LTM
2012A 5/04/13A 8/03/13E(5)
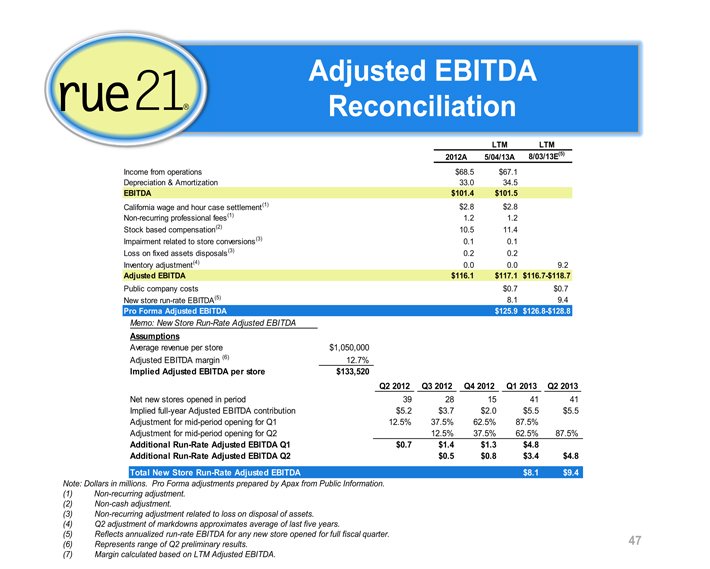
Income from operations $68.5 $67.1
Depreciation & Amortization 33.0 34.5
EBITDA $101.4 $101.5
California wage and hour case settlement(1) $2.8 $2.8
Non-recurring professional fees(1) 1.2 1.2
Stock based compensation(2) 10.5 11.4
Impairment related to store conversions(3) 0.1 0.1
Loss on fixed assets disposals(3) 0.2 0.2
Inventory adjustment(4) 0.0 0.0 9.2
Adjusted EBITDA $116.1 $117.1 $116.7-$118.7
Public company costs $0.7 $0.7
New store run-rate EBITDA(5) 8.1 9.4
Pro Forma Adjusted EBITDA $125.9 $126.8-$128.8
Memo: New Store Run-Rate Adjusted EBITDA
Assumptions
Average revenue per store $1,050,000
Adjusted EBITDA margin (6) 12.7%
Implied Adjusted EBITDA per store $133,520
Q2 2012 Q3 2012 Q4 2012 Q1 2013 Q2 2013
Net new stores opened in period 39 28 15 41 41
Implied full-year Adjusted EBITDA contribution $5.2 $3.7 $2.0 $5.5 $5.5
Adjustment for mid-period opening for Q1 12.5% 37.5% 62.5% 87.5%
Adjustment for mid-period opening for Q2 12.5% 37.5% 62.5% 87.5%
Additional Run-Rate Adjusted EBITDA Q1 $0.7 $1.4 $1.3 $4.8
Additional Run-Rate Adjusted EBITDA Q2 $0.5 $0.8 $3.4 $4.8
Total New Store Run-Rate Adjusted EBITDA $8.1 $9.4
Note: Dollars in millions. Pro Forma adjustments prepared by Apax from Public Information.
| (1) |
Non-recurring adjustment. |
| (2) |
Non-cash adjustment. |
| (3) |
Non-recurring adjustment related to loss on disposal of assets. |
| (4) |
Q2 adjustment of markdowns approximates average of last five years. |
| (5) |
Reflects annualized run-rate EBITDA for any new store opened for full fiscal quarter. |
| (6) |
Represents range of Q2 preliminary results. 47 |
| (7) |
Margin calculated based on LTM Adjusted EBITDA. |