Attached files
| file | filename |
|---|---|
| 8-K - 8-K - ROWAN COMPANIES PLC | v352116_8k.htm |
Investor Presentation August, 2013 Strong Heritage Strong Future
Forward - Looking Statements 2 This report contains forward - looking statements within the meaning of the Private Securities Litigation Reform Act of 1995, including, without limitation, statements about the proposed change in corporate structure as well as statements as to the expectations, beliefs and future expected financial performance of the Company that are based on current expectations and are subject to certain risks, trends and uncertainties that could cause actual results to differ materially from those projected by the Company. Among the factors that could cause actual results to differ materially include oil and natural gas prices, the level of offshore expenditures by energy companies, energy demand, the general economy, including inflation, weather conditions in the Company’s principal operating areas and environmental and other laws and regulations, including changes in tax laws and whether the Company achieves the benefits it expects from the change in Rowan's corporate structure. Other relevant factors have been and will be disclosed in the Company’s filings with the SEC.
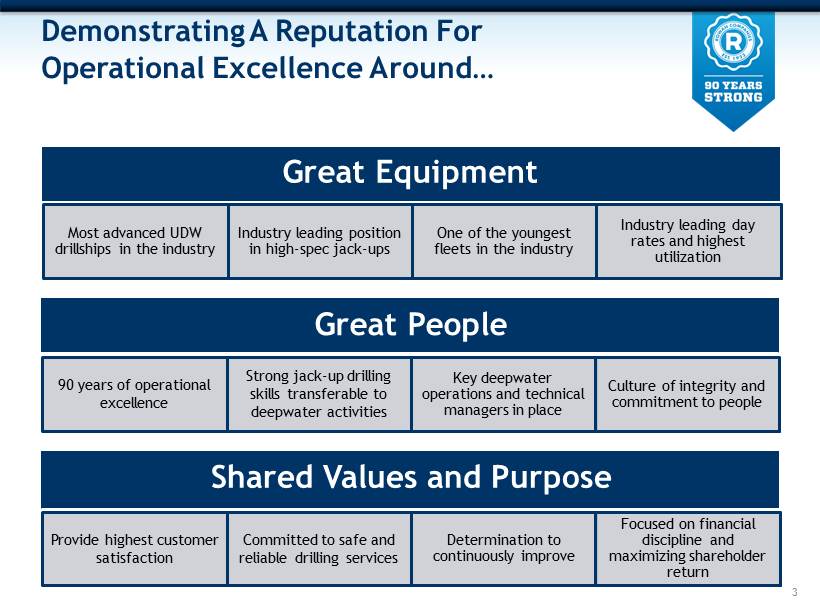
Great Equipment Great People Demonstrating A Reputation For Operational Excellence Around… 3 Great Equipment Most advanced UDW drillships in the industry Industry leading position in high - spec jack - ups One of the youngest fleets in the industry Industry leading day rates and highest utilization 90 years of operational excellence Strong jack - up drilling skills transferable to deepwater activities Key deepwater operations and technical managers in place Culture of integrity and commitment to people Shared Values and Purpose Provide highest customer satisfaction Committed to safe and reliable drilling services Determination to continuously improve Focused on financial discipline and maximizing shareholder return Great Equipment
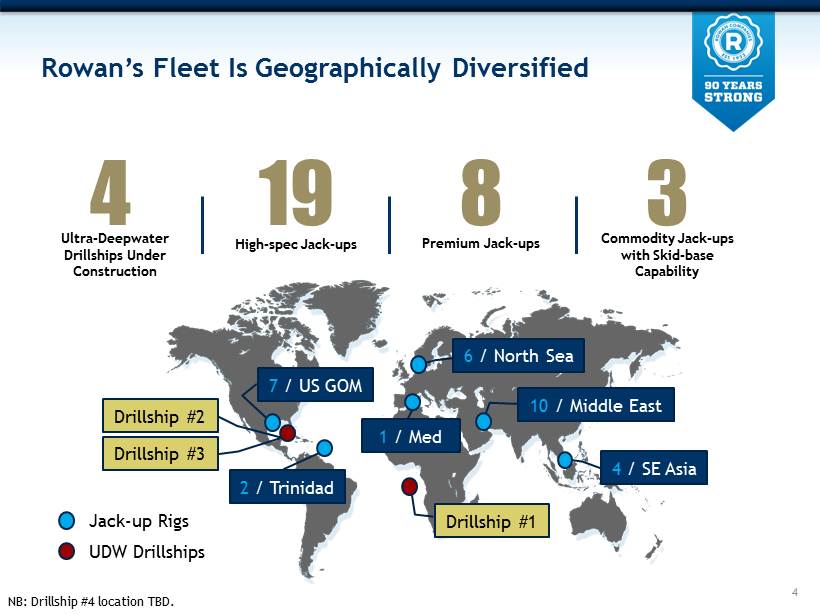
Rowan’s Fleet Is Geographically Diversified 4 6 / North Sea 10 / Middle East 4 / SE Asia 19 High - spec Jack - ups 8 Premium Jack - ups 3 Commodity Jack - ups with Skid - base Capability 7 / US GOM Drillship #1 4 Ultra - Deepwater Drillships Under Construction 1 / Med 2 / Trinidad Drillship #2 Jack - up Rigs UDW Drillships Drillship #3 NB: Drillship #4 location TBD.
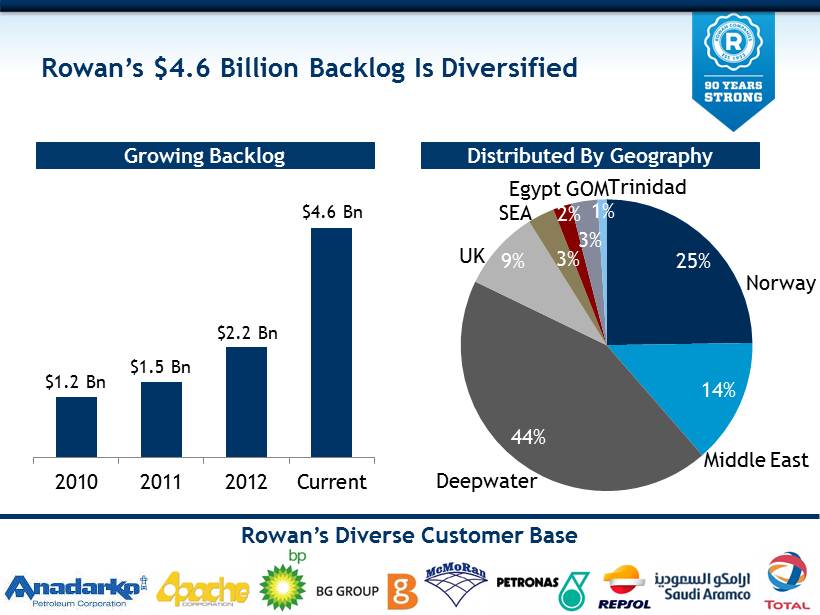
5 Rowan’s $4.6 Billion Backlog Is Diversified $1.2 Bn $1.5 Bn 2010 2011 2012 Current $2.2 Bn $4.6 Bn 25% 14% 44% 9% 3% 2% 3% 1% Norway Middle East Deepwater UK SEA Egypt GOM Trinidad Growing Backlog Distributed By Geography Rowan’s Diverse Customer Base
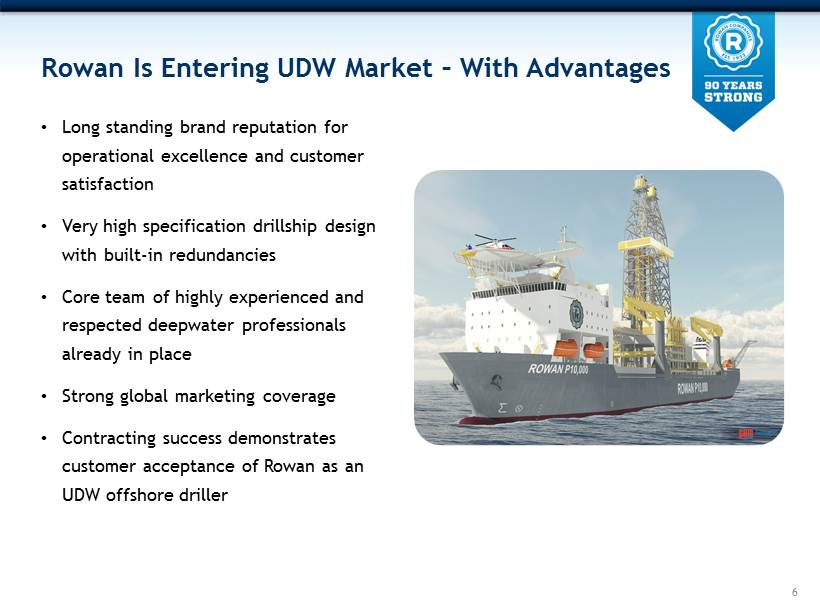
Rowan Is Entering UDW Market – With Advantages • Long standing brand reputation for operational excellence and customer satisfaction • Very high specification drillship design with built - in redundancies • Core team of highly experienced and respected deepwater professionals already in place • Strong global marketing coverage • Contracting success demonstrates customer acceptance of Rowan as an UDW offshore driller 6
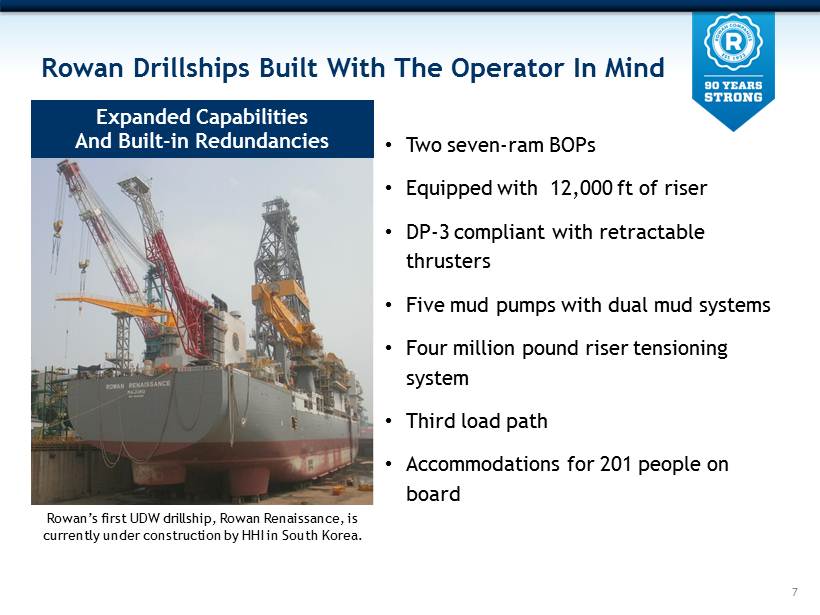
Rowan Drillships Built With The Operator In Mind • Two seven - ram BOPs • Equipped with 12,000 ft of riser • DP - 3 compliant with retractable thrusters • Five mud pumps with dual mud systems • Four million pound riser tensioning system • Third load path • Accommodations for 201 people on board 7 Expanded Capabilities And Built - in Redundancies Rowan’s first UDW drillship, Rowan Renaissance, is currently under construction by HHI in South Korea.
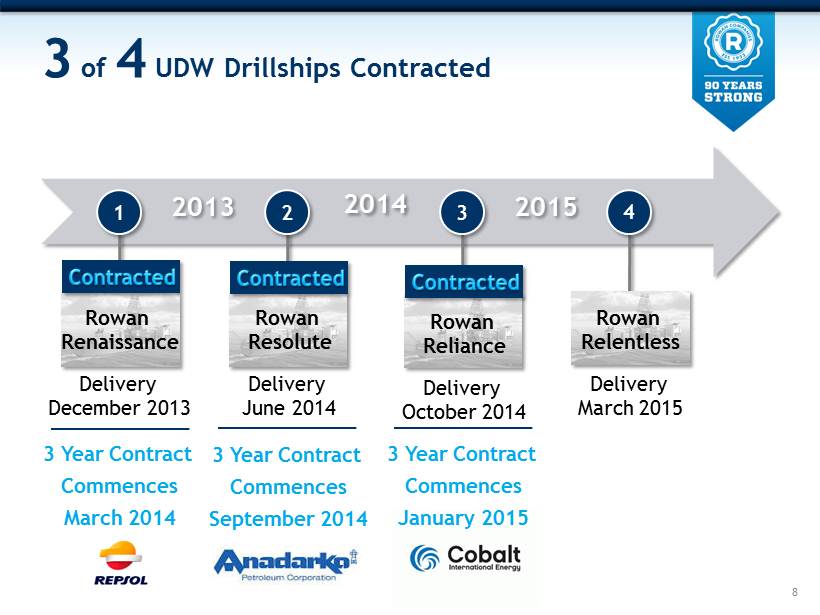
3 of 4 UDW Drillships Contracted 8 Delivery December 2013 2013 2014 2015 3 Year Contract Commences March 2014 Rowan Renaissance 1 Delivery June 2014 2 Rowan Resolute Delivery October 2014 3 Rowan Reliance Delivery March 2015 4 Rowan Relentless 3 Year Contract Commences September 2014 3 Year Contract Commences January 2015
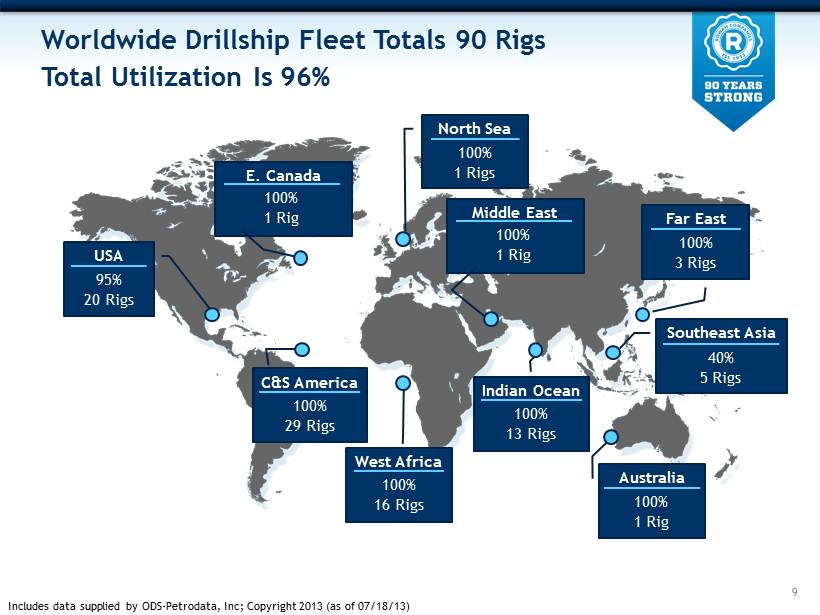
Worldwide Drillship Fleet Totals 90 Rigs Total Utilization Is 96% 9 USA Indian Ocean North Sea Middle East Far East Southeast Asia C&S America West Africa Australia 95% 20 Rigs 100% 29 Rigs 100% 16 Rigs 100% 13 Rigs 100% 1 Rig 4 0% 5 Rigs 100% 3 Rigs 100% 1 Rig 100% 1 Rigs Includes data supplied by ODS - Petrodata, Inc; Copyright 2013 (as of 07/18/13) E. Canada 100% 1 Rig
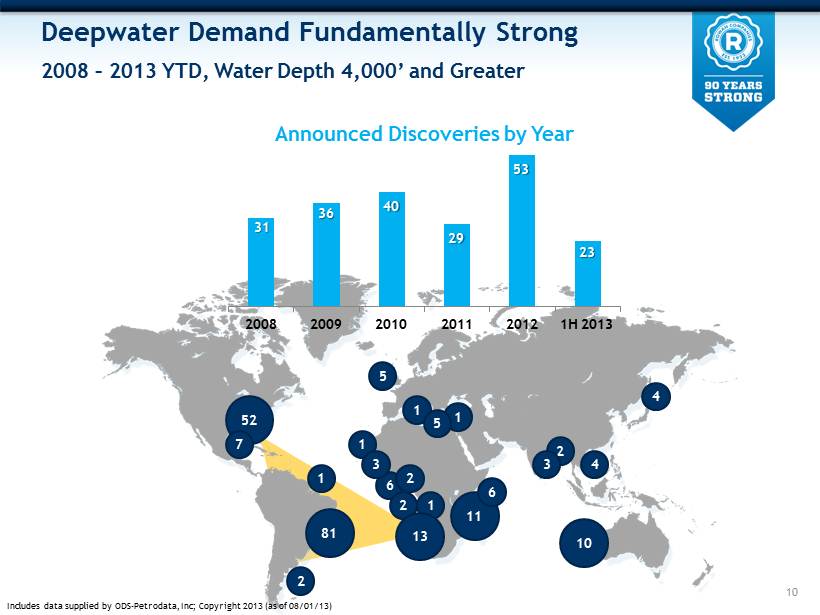
Deepwater Demand Fundamentally Strong 2008 – 2013 YTD, Water Depth 4,000’ and Greater 2008 2009 2010 2011 2012 1H 2013 Announced Discoveries by Year 31 36 40 29 53 2 6 2 2 2 4 4 3 10 11 6 1 1 3 5 1 1 5 52 13 8 1 7 1 Includes data supplied by ODS - Petrodata , Inc; Copyright 2013 (as of 08/01/13) 23 10

Deepwater GOM Activity Expected To Accelerate 11 Historical & Forecasted US GOM Floating Rig Count Deepwater GOM Wells Drilled By Exploration & Development (>1,000 ft) • GOM deepwater rig count forecast to grow from 36 to as many as 60 rigs by 2015 • Development wells forecast to triple to about 70 wells/year by 2015 • Exploration wells forecast to double to over 60 wells/year by 2015 Source: U.S. Gulf of Mexico Deepwater Outlook, ISI Group, December 2012
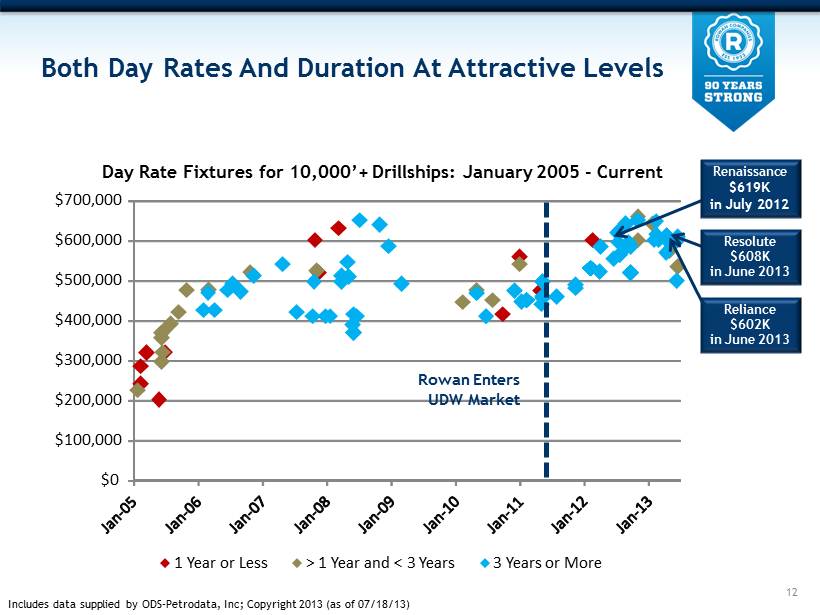
$0 $100,000 $200,000 $300,000 $400,000 $500,000 $600,000 $700,000 1 Year or Less > 1 Year and < 3 Years 3 Years or More 12 Both Day Rates And Duration At Attractive Levels Day Rate Fixtures for 10,000’+ Drillships : January 2005 - Current Rowan Enters UDW Market Includes data supplied by ODS - Petrodata, Inc; Copyright 2013 (as of 07/18/13) Resolute $608K in June 2013 Renaissance $619K in July 2012 Reliance $602K in June 2013
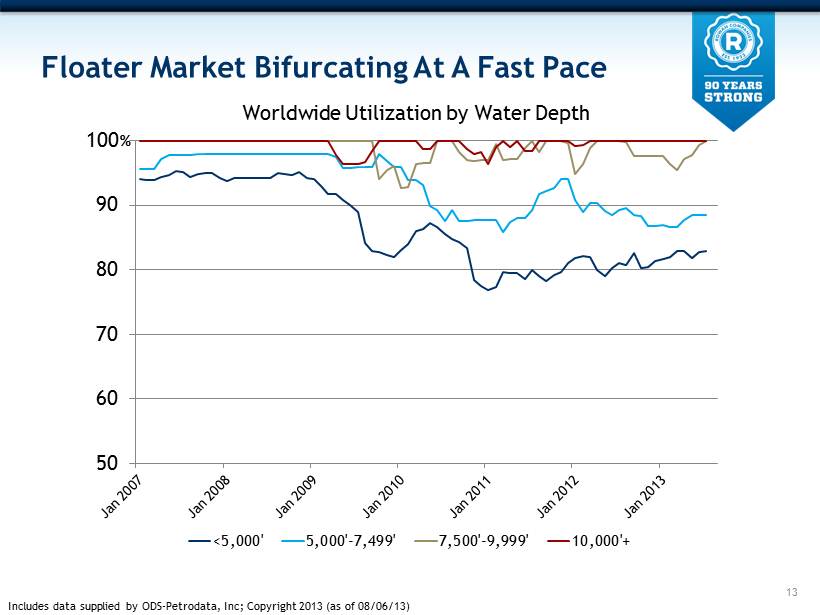
Floater Market Bifurcating At A Fast Pace 50 60 70 80 90 100 <5,000' 5,000'-7,499' 7,500'-9,999' 10,000'+ % Worldwide Utilization by Water Depth Includes data supplied by ODS - Petrodata, Inc; Copyright 2013 (as of 08/06/13) 13
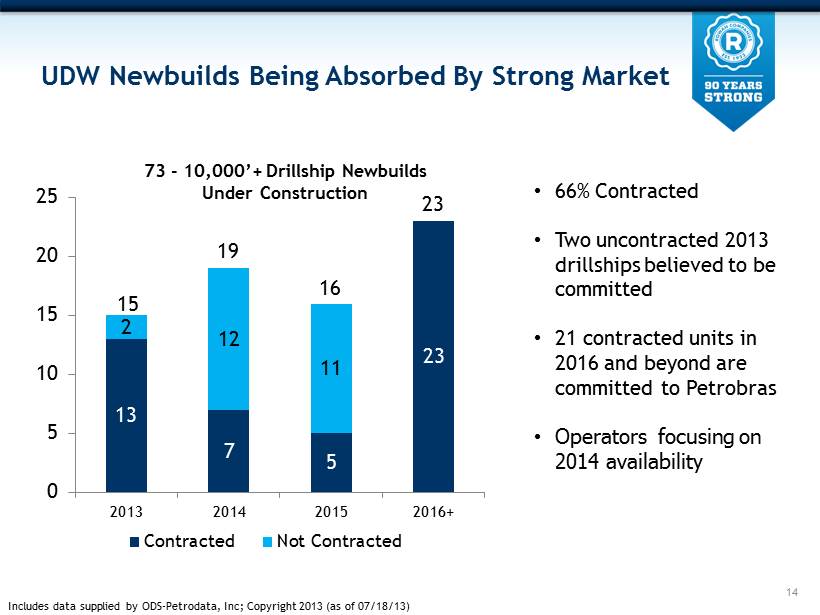
UDW Newbuilds Being Absorbed By Strong Market 14 13 7 5 23 2 12 11 0 5 10 15 20 25 2013 2014 2015 2016+ Contracted Not Contracted 73 - 10,000’+ Drillship Newbuilds Under Construction 16 15 19 • 66% Contracted • Two uncontracted 2013 drillships believed to be committed • 21 contracted units in 2016 and beyond are committed to Petrobras • Operators focusing on 2014 availability Includes data supplied by ODS - Petrodata, Inc; Copyright 2013 (as of 07/18/13) 23
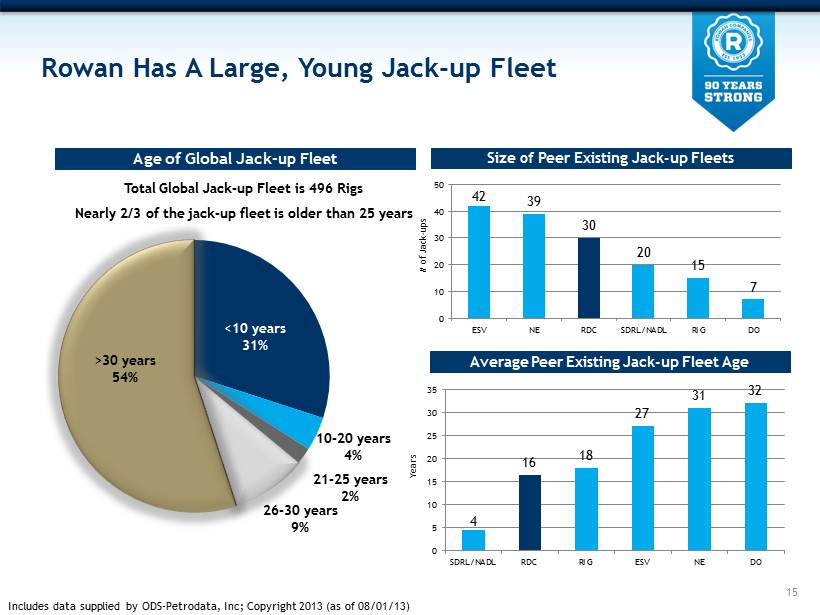
15 Age of Global Jack - up Fleet Total Global Jack - up Fleet is 496 Rigs Nearly 2/3 of the jack - up fleet is older than 25 years <10 years 31% >30 years 54% 26 - 30 years 9% 10 - 20 years 4% 21 - 25 years 2% Size of Peer Existing Jack - up Fleets 42 39 30 20 15 7 0 10 20 30 40 50 ESV NE RDC SDRL/NADL RIG DO # of Jack - ups Average Peer Existing Jack - up Fleet Age 4 16 18 27 31 32 0 5 10 15 20 25 30 35 SDRL/NADL RDC RIG ESV NE DO Years Includes data supplied by ODS - Petrodata, Inc; Copyright 2013 (as of 08/01/13) Rowan Has A Large, Young Jack - up Fleet
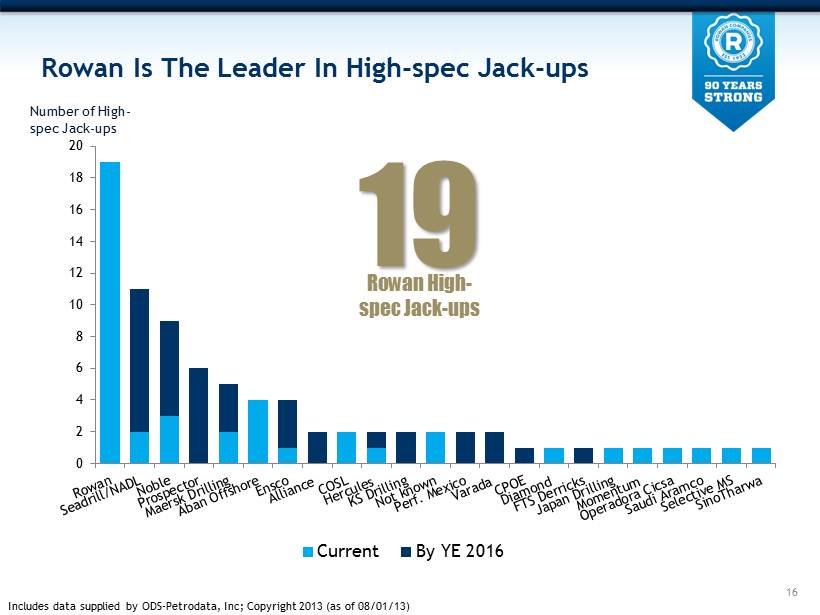
Rowan Is The Leader In High - spec Jack - ups Number of High - spec Jack - ups 0 2 4 6 8 10 12 14 16 18 20 Current By YE 2016 19 Rowan High - spec Jack - ups Includes data supplied by ODS - Petrodata, Inc; Copyright 2013 (as of 08/01/13) 16
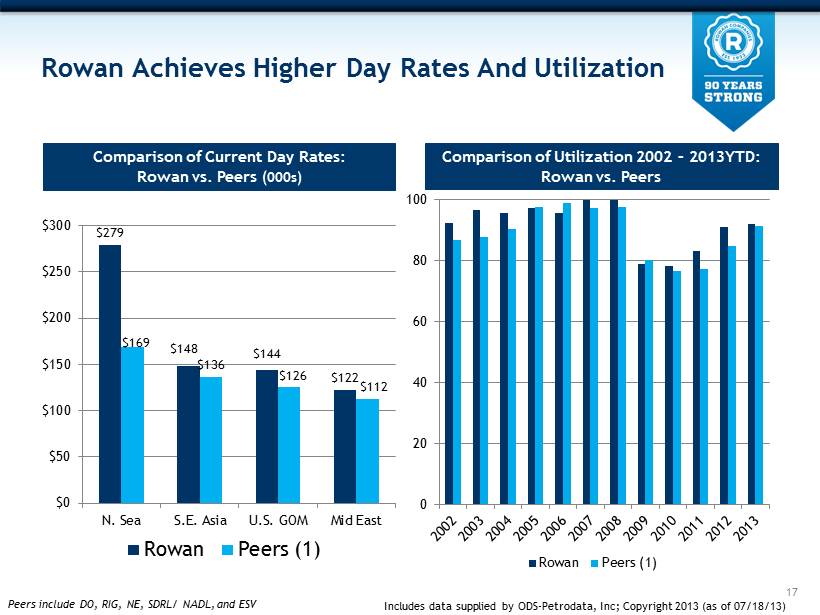
Rowan Achieves Higher Day Rates And Utilization Comparison of Current Day Rates: Rowan vs. Peers (000s) Comparison of Utilization 2002 – 2013YTD: Rowan vs. Peers 0 20 40 60 80 100 Rowan Peers (1) Peers include DO, RIG, NE, SDRL/ NADL, and ESV $279 $148 $144 $122 $169 $136 $126 $112 $0 $50 $100 $150 $200 $250 $300 N. Sea S.E. Asia U.S. GOM Mid East Rowan Peers (1) 17 Includes data supplied by ODS - Petrodata, Inc; Copyright 2013 (as of 07/18/13)
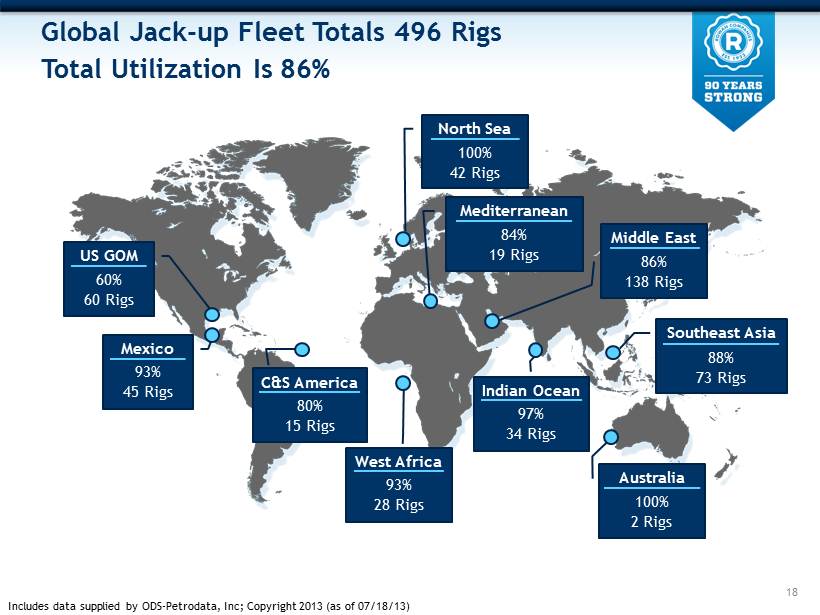
Global Jack - up Fleet Totals 496 Rigs Total Utilization Is 86% 18 US GOM Indian Ocean North Sea Mediterranean Middle East Southeast Asia Mexico C&S America West Africa Australia 60% 60 Rigs 93% 45 Rigs 80% 15 Rigs 93% 28 Rigs 97% 34 Rigs 100% 2 Rigs 88% 73 Rigs 86% 138 Rigs 84% 19 Rigs 100% 42 Rigs Includes data supplied by ODS - Petrodata, Inc; Copyright 2013 (as of 07/18/13)
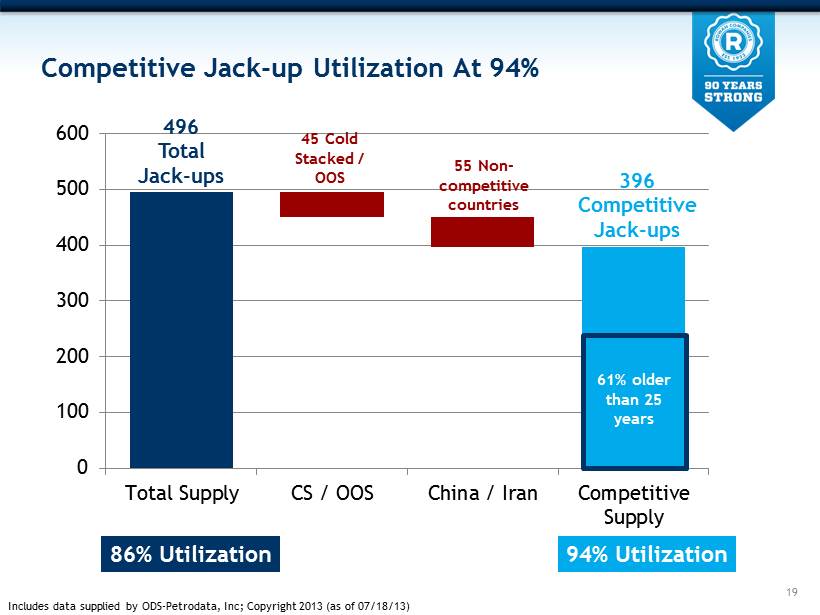
Competitive Jack - up Utilization At 94% 0 100 200 300 400 500 600 Total Supply CS / OOS China / Iran Competitive Supply 496 Total Jack - ups 45 Cold Stacked / OOS 55 Non - competitive countries 396 Competitive Jack - ups 61% older than 25 years 94% Utilization 86% Utilization 19 Includes data supplied by ODS - Petrodata, Inc; Copyright 2013 (as of 07/18/13)
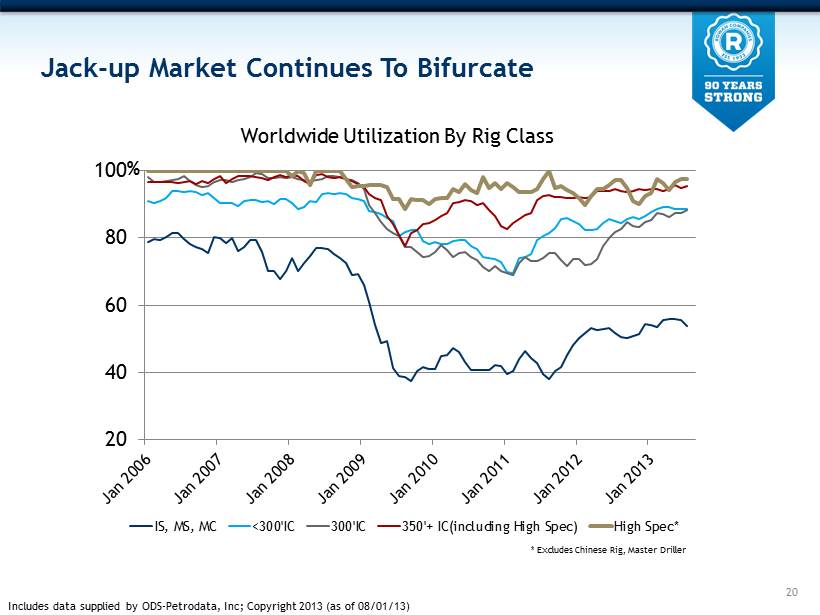
Jack - up Market Continues To Bifurcate 20 40 60 80 100 IS, MS, MC <300'IC 300'IC 350'+ IC(including High Spec) High Spec* Worldwide Utilization By Rig Class % * Excludes Chinese Rig, Master Driller Includes data supplied by ODS - Petrodata, Inc; Copyright 2013 (as of 08/01/13) 20
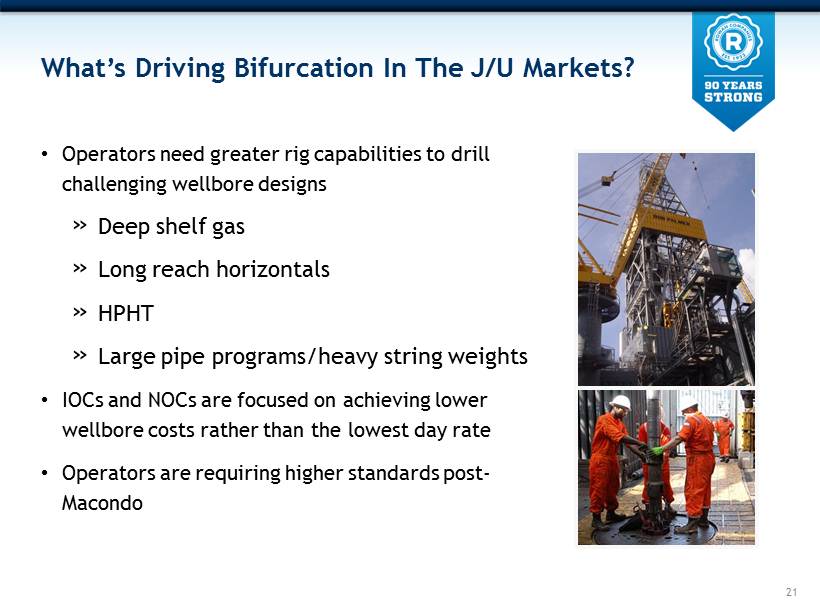
What’s Driving Bifurcation In The J/U Markets? • Operators need greater rig capabilities to drill challenging wellbore designs » Deep shelf gas » Long reach horizontals » HPHT » Large pipe programs/heavy string weights • IOCs and NOCs are focused on achieving lower wellbore costs rather than the lowest day rate • Operators are requiring higher standards post - Macondo 21
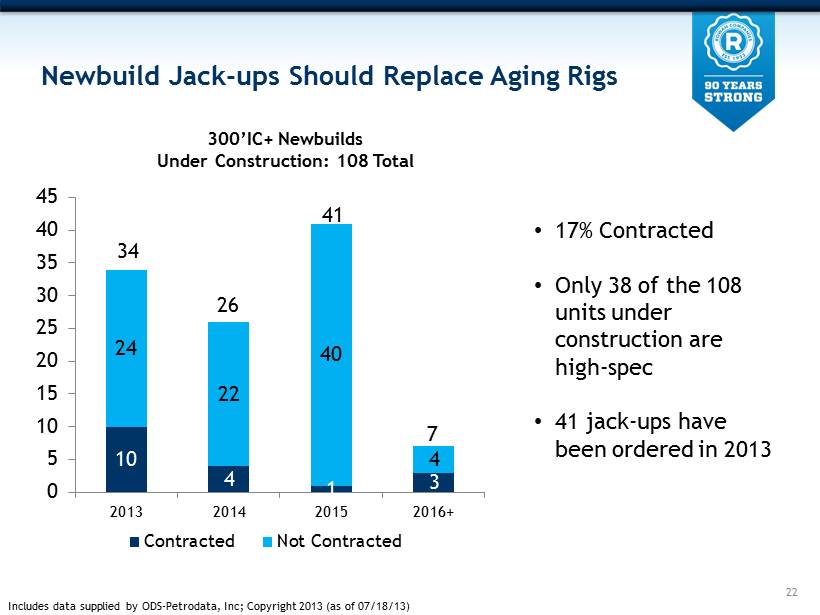
Newbuild Jack - ups Should Replace Aging Rigs 22 10 4 1 3 24 22 40 4 0 5 10 15 20 25 30 35 40 45 2013 2014 2015 2016+ Contracted Not Contracted 300’IC+ Newbuilds Under Construction: 108 Total 41 34 26 • 17% Contracted • Only 38 of the 108 units under construction are high - spec • 41 jack - ups have been ordered in 2013 Includes data supplied by ODS - Petrodata, Inc; Copyright 2013 (as of 07/18/13) 7

0 10 20 30 40 50 60 70 80 90 Newbuild Jack - ups Needed To Replace Aging Fleet 23 311 JACK - UPS OVER 25 YEARS 261 JACK - UPS IN LATEST CYCLE Jack - ups by Year Built Includes data supplied by ODS - Petrodata, Inc; Copyright 2013 (as of 07/18/13)

0 50 100 150 200 250 300 A Wave Of Jack - up Retirements Could Be Coming 24 World jack - up rig population over 40 years old is growing… Includes data supplied by ODS - Petrodata, Inc; Copyright 2013 (as of 07/18/13) # of jack - ups 40+ years JACK - UPS OVER 40+ YEARS IN 10 YEARS 289 18 JACK - UPS OVER 40+ YEARS TODAY
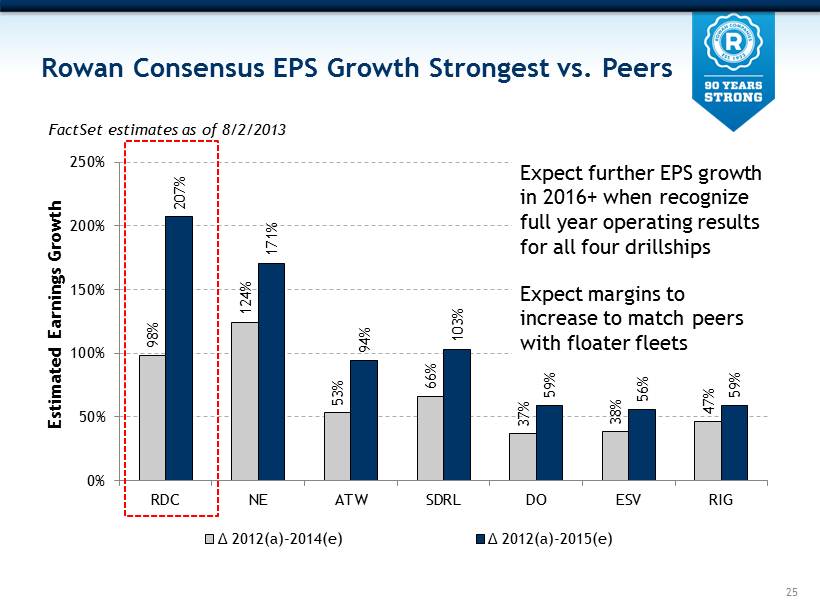
Rowan Consensus EPS Growth Strongest vs. Peers 25 98% 124% 53% 66% 37% 38% 47% 207% 171% 94% 103% 59% 56% 59% 0% 50% 100% 150% 200% 250% RDC NE ATW SDRL DO ESV RIG Estimated Earnings Growth 2012( a) - 2014(e) 2012( a) - 2015(e) FactSet e stimates as of 8/2/2013 Expect further EPS growth in 2016+ when recognize full year operating results for all four drillships Expect margins to increase to match peers with floater fleets

2.71% 3.37% 3.31% 3.93% 1.89% 1.65% 3.27% 2.47% 1.37% 0.80% Q1-11 Q2-11 Q3-11 Q4-11 Q1-12 Q2-12 Q3-12 Q4-12 Q1-13 Q2-13 Positive Trends - Downtime, Out of Service Time 25% 20% 27% 17% 11% 11% 14% 10% 9% 8% 12% Q1-11 Q2-11 Q3-11 Q4-11 Q1-12 Q2-12 Q3-12 Q4-12 Q1-13 Q2-13 Q3-13 Est Out of Service Operational Downtime Includes shipyard, transit and inspection days when: Rigs are on contract and available to earn day rate, but off rate due to operational issues. Rig is mobilizing or undergoing modifications between contracts and often compensated, but revenue is deferred. Rig is undergoing inspections, refurbishments, upgrades and generally not compensated. — — 9% 12% 22% 26
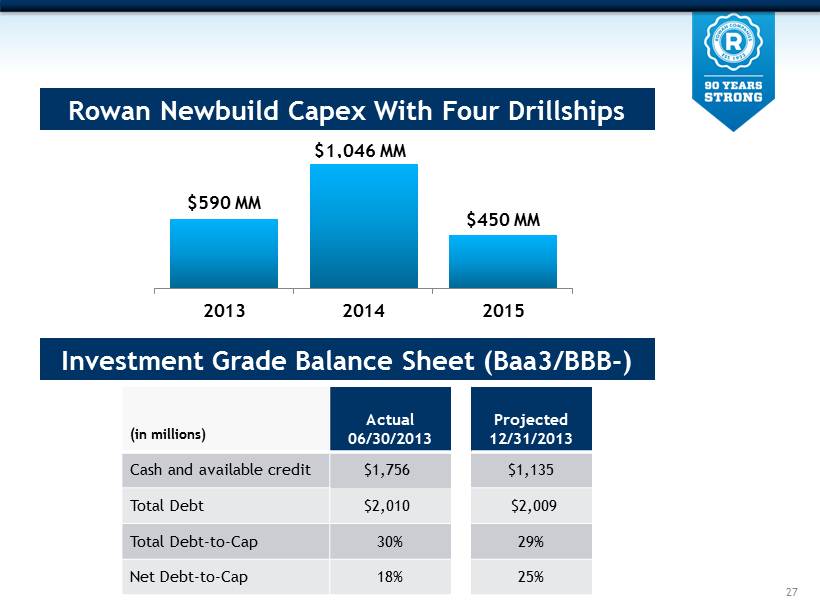
(in millions) Actual 06/30/2013 Projected 12/31/2013 Cash and available credit $1,756 $1,135 Total Debt $2,010 $2,009 Total Debt - to - Cap 30% 29% Net Debt - to - Cap 18% 25% 27 Investment Grade Balance Sheet (Baa3/BBB - ) Rowan Newbuild Capex With Four Drillships $ 590 MM $ 450 MM 2013 2014 2015 $1,046 MM
Rowan Focused On Optimum Allocation Of Capital • Return on investment analysis drives all capital decisions » Sensitivity analysis – Capital cost, Operating Cost, Day Rate, Tax Rate • Regular consideration of all options for available capital » Newbuilding , purchasing, investments in existing fleet, return on capital • Committed to maintaining investment grade balance sheet 28

29 Rowan Traits Support Our Shared Goal 29 Commitment to safety and integrity Focused on reliability Competency and can do attitude Determination to continuously improve Highest Customer Satisfaction
Appendix 31

Multiple Factors Will Impact Operating Costs Estimated Amount (in Millions) Gilbert Rowe in Service $10 - 15 Higher Expense Operating Areas $40 - 45 Shipyard Stays – Increase in Capitalized Expense ($5 – 10) Wage Increases (6% ) $10 - 15 Deepwater Support $10 - 15 Shorebase Expense Increases / Other $20 - 25 Rebills Reduction (1) ($10 – 15) PROJECTED TOTAL $78 - 88 32 • 2013 Operating expenses expected to be $830 - $840 million, up from $752 million in 2012. Projected Increase in Operating Costs 2013 vs. 2012 (1) Rebills unusually higher in 2012.

2013 Operating Cost Components 63% 17% 4% 3% 3% 10% Employee-related * R&M Insurance Rig moves Rebillables All other ** 33 * Employee - related costs include labor, fringes, training, catering and crew transportation ** Other includes rentals, medics, agent commissions, satellite communications and other misc. drilling costs
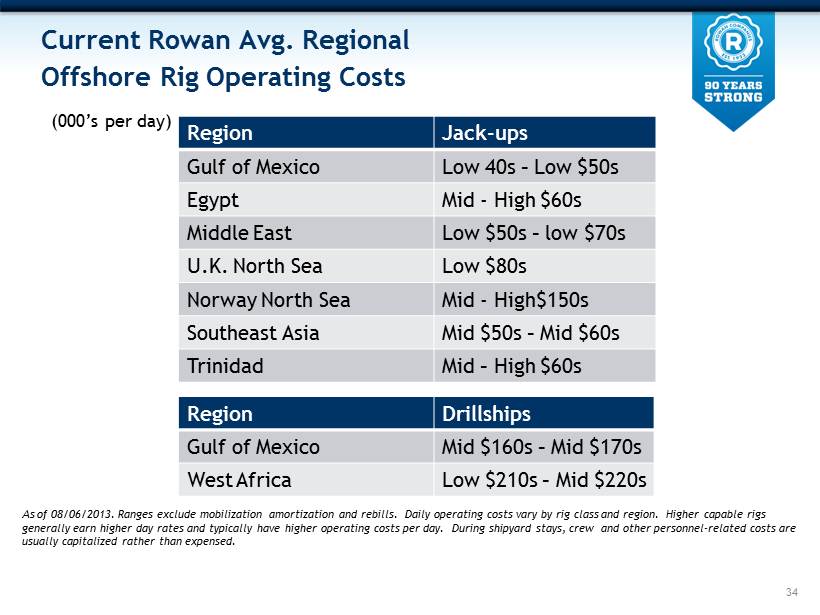
Current Rowan Avg. Regional Offshore Rig Operating Costs Region Jack - ups Gulf of Mexico Low 40s – Low $50s Egypt Mid - High $60s Middle East Low $50s – low $70s U.K. North Sea Low $80s Norway North Sea Mid - High$150s Southeast Asia Mid $50s – Mid $60s Trinidad Mid – High $60s 34 (000’s per day) As of 08/06/2013. Ranges exclude mobilization amortization and rebills . Daily operating costs vary by rig class and region. Higher capable rigs generally earn higher day rates and typically have higher operating costs per day. During shipyard stays, crew and other pe rso nnel - related costs are usually capitalized rather than expensed. Region Drillships Gulf of Mexico Mid $160s – Mid $170s West Africa Low $210s – Mid $220s
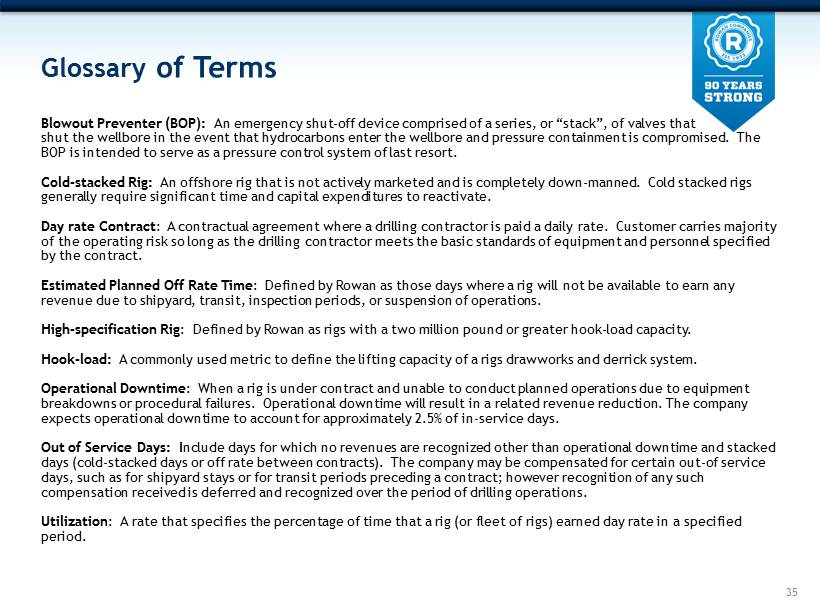
Glossary of Terms Blowout Preventer (BOP): An emergency shut - off device comprised of a series, or “stack”, of valves that shut the wellbore in the event that hydrocarbons enter the wellbore and pressure containment is compromised. The BOP is intended to serve as a pressure control system of last resort. Cold - stacked Rig: An offshore rig that is not actively marketed and is completely down - manned. Cold stacked rigs generally require significant time and capital expenditures to reactivate. Day rate Contract : A contractual agreement where a drilling contractor is paid a daily rate. Customer carries majority of the operating risk so long as the drilling contractor meets the basic standards of equipment and personnel specified by the contract. Estimated Planned Off Rate Time : Defined by Rowan as those days where a rig will not be available to earn any revenue due to shipyard, transit, inspection periods, or suspension of operations. High - specification Rig : Defined by Rowan as rigs with a two million pound or greater hook - load capacity. Hook - load: A commonly used metric to define the lifting capacity of a rigs drawworks and derrick system. Operational Downtime : When a rig is under contract and unable to conduct planned operations due to equipment breakdowns or procedural failures. Operational downtime will result in a related revenue reduction. The company expects operational downtime to account for approximately 2.5% of in - service days. Out of Service Days: I nclude days for which no revenues are recognized other than operational downtime and stacked days (cold - stacked days or off rate between contracts). The company may be compensated for certain out - of service days, such as for shipyard stays or for transit periods preceding a contract ; however recognition of any such compensation received is deferred and recognized over the period of drilling operations. Utilization : A rate that specifies the percentage of time that a rig (or fleet of rigs) earned day rate in a specified period. 35
Investor Contact: Suzanne M. Spera Director, Investor Relations sspera@rowancompanies.com Rowan Companies 2800 Post Oak Blvd. Suite 5450 Houston, TX 77056 713.621.7800 www.rowancompanies.com