Attached files
| file | filename |
|---|---|
| EX-99.2 - SUPPLEMENTAL INFORMATION, PDF FORMAT - NATIONAL HEALTH INVESTORS INC | q22013supplemental.pdf |
| 8-K - 8-K - NATIONAL HEALTH INVESTORS INC | a8-k2013q2supplemental.htm |

Supplemental Information
June 30, 2013
National Health Investors, Inc.
222 Robert Rose Drive
Murfreesboro, Tennessee 37129
Phone: (615) 890-9100
www.nhireit.com
Email: investor_relations@nhireit.com
Table of Contents
EBITDA Reconciliation and Interest Coverage | |
Lease Renewal Years & Mortgage Maturities | |
CORPORATE
DISCLAIMER
This Supplemental Information and other materials we have filed or may file with the Securities and Exchange Commission, as well as information included in oral statements made, or to be made, by our senior management contain certain “forward-looking” statements as that term is defined by the Private Securities Litigation Reform Act of 1995. All statements regarding our expected future financial position, results of operations, cash flows, funds from operations, continued performance improvements, ability to service and refinance our debt obligations, ability to finance growth opportunities, and similar statements including, without limitations, those containing words such as “may”, “will”, “believes”, anticipates”, “expects”, “intends”, “estimates”, “plans”, and other similar expressions are forward-looking statements.
Forward-looking statements involve known and unknown risks and uncertainties that may cause our actual results in future periods to differ materially from those projected or contemplated in the forward-looking. Such risks and uncertainties include, among other things, the following risks, which are described in more detail under the heading “Risk Factors” in Item 1A in our Form 10-K for the year ended December 31, 2013:
• | We depend on the operating success of our customers (facility operators) for collection of our revenues during this time of uncertain economic conditions in the U.S.; |
• | We are exposed to the risk that our tenants and borrowers may become subject to bankruptcy or insolvency proceedings; |
• | We are exposed to risks related to governmental regulations and payors, principally Medicare and Medicaid, and the effect that lower reimbursement rates will have on our tenants' and borrowers' business; |
• | We are exposed to the risk that the cash flows of our tenants and borrowers will be adversely affected by increased liability claims and general and professional liability insurance costs; |
• | We are exposed to risks related to environmental laws and the costs associated with the liability related to hazardous substances; |
• | We are exposed to the risk that we may not be indemnified by our lessees and borrowers against future litigation; |
• | We depend on the success of future acquisitions and investments; |
• | We depend on the ability to reinvest cash in real estate investments in a timely manner and on acceptable terms; |
• | We may need to incur more debt in the future, which may not be available on terms acceptable to the Company; |
• | We are exposed to the risk that the illiquidity of real estate investments could impede our ability to respond to adverse changes in the performance of our properties; |
• | We are exposed to risks associated with our investments in unconsolidated entities, including our lack of sole decision-making authority and our reliance on the financial condition of other interests; |
• | We depend on revenues derived mainly from fixed rate investments in real estate assets, while our debt capital used to finance those investments is primarily available at variable rates. This circumstance creates interest rate risk to the Company; |
• | We have covenants related to our indebtedness which impose certain operational limitations and a breach of those covenants could materially adversely affect our financial condition and results of operations; |
• | We are exposed to the risk that our assets may be subject to impairment charges; |
• | We depend on the ability to continue to qualify as a real estate investment trust; |
• | We have ownership limits in our charter with respect to our common stock and other classes of capital stock which may delay, defer or prevent a transaction or a change of control that might involve a premium price for our common stock or might otherwise be in the best interests of our stockholders; |
• | We are subject to certain provisions of Maryland law and our charter and bylaws that could hinder, delay or prevent a change in control transaction, even if the transaction involves a premium price for our common stock or our stockholders believe such transaction to be otherwise in their best interests. |
In this Supplemental Information, we refer to non-GAAP financial measures. These non-GAAP measures are not prepared in accordance with generally accepted accounting principles. A reconciliation of the non-GAAP financial measures to the most directly comparable GAAP measures is included in this presentation.
Throughout this presentation, certain abbreviations and acronyms are used to simplify the format. A list of definitions is provided at the end of this presentation to clarify the meaning of any reference that may be ambiguous.
Page :3
COMPANY PROFILE
ANALYST COVERAGE | INVESTOR RELATIONS CONTACT | |||
Stifel Nicolaus & Company, Inc. | Roger R. Hopkins, CPA | |||
J.J.B. Hilliard, W.L. Lyons, LLC | rhopkins@nhireit.com | |||
JMP Securities, LLC | (615) 890-9100 ext. 108 | |||
Wells Fargo Securities, LLC | ||||
BMO Capital Markets Corp. | ||||
KeyBanc Capital Markets, Inc. | ||||
Sidoti & Company, LLC | ||||
SENIOR MANAGEMENT | BOARD OF DIRECTORS | |||
J. Justin Hutchens | W. Andrew Adams | J. Justin Hutchens | ||
Chief Executive Officer and President | Venture Capital Investments | National Health Investors, Inc. | ||
Roger R. Hopkins, CPA | Robert A. McCabe, Jr. | Robert T. Webb | ||
Chief Accounting Officer | Pinnacle Financial Partners | Webb's Refreshments, Inc. | ||
Kristin S. Gaines | James R. Jobe | |||
Chief Credit Officer | Jobe, Hastings & Associates | |||
NATIONAL HEALTH INVESTORS, INC., a Maryland corporation incorporated in 1991, is a real estate investment trust ("REIT") which invests in income-producing health care properties primarily in the long-term care and senior housing industries. Our mission is to invest in health care real estate or in the operation thereof through independent third-party managers which generates current income that will be distributed to stockholders. We have pursued this mission by investing primarily in leased properties, mortgage loans, and RIDEA transactions. These investments include assisted living facilities, senior living campuses, independent living facilities, skilled nursing facilities, medical office buildings,and hospitals. We typically fund these investments through three sources of capital: (1) debt offerings, including bank lines of credit and ordinary term debt, (2) current cash flow, and (3) the sale of equity securities.
Investor Snapshot as of June 30, 2013 | ||||||||
Exchange: | NYSE | 52 week Low/High Close: | $50.12 | $72.30 | Market Capitalization: | $1.67 billion | ||
Symbol: | NHI | Dividend/Yield: | $2.94 | 4.91% | ||||
Closing Price: | $59.86 | Shares Outstanding: | 27,876,176 | |||||
Quarterly Revenue* Snapshot as of June 30, 2013
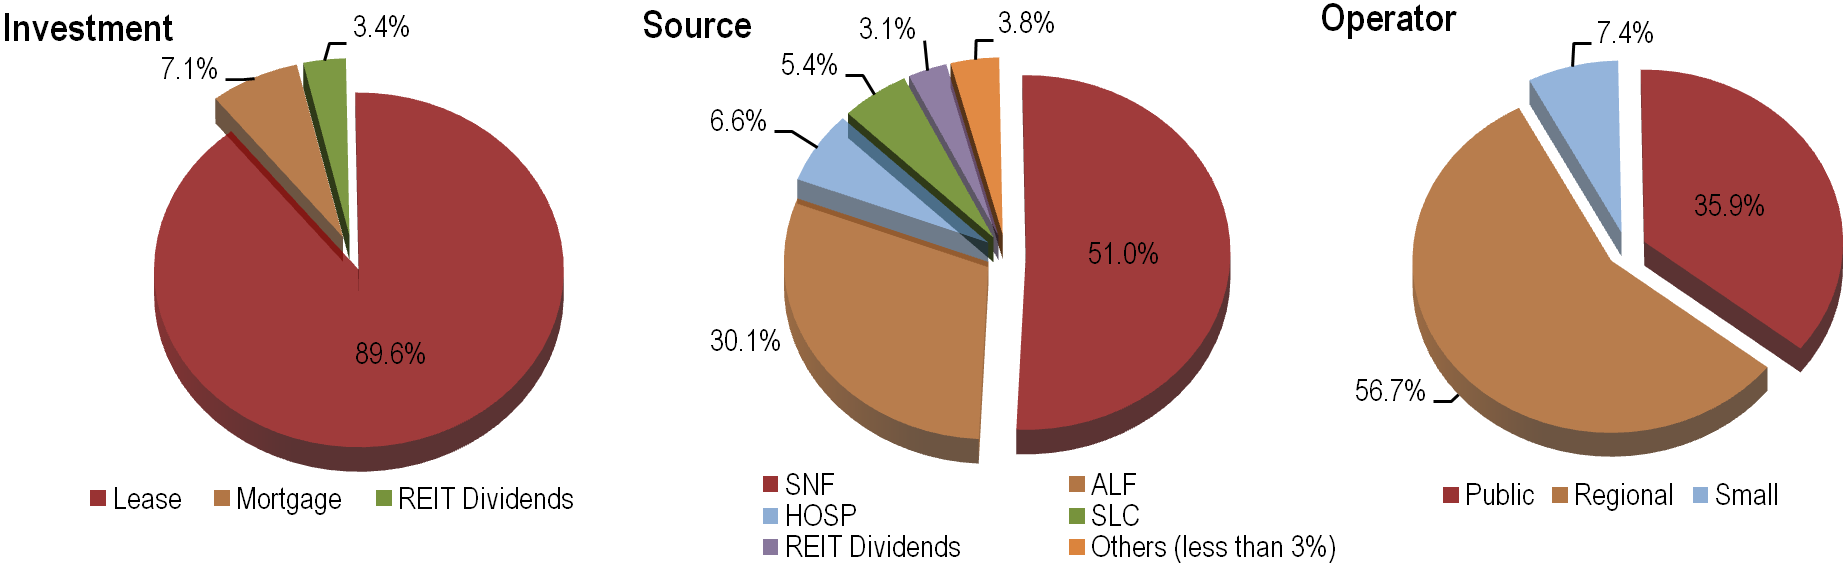
* includes Q2 pro forma impact of investments announced in July 2013
Page :4
LONG-TERM GROWTH
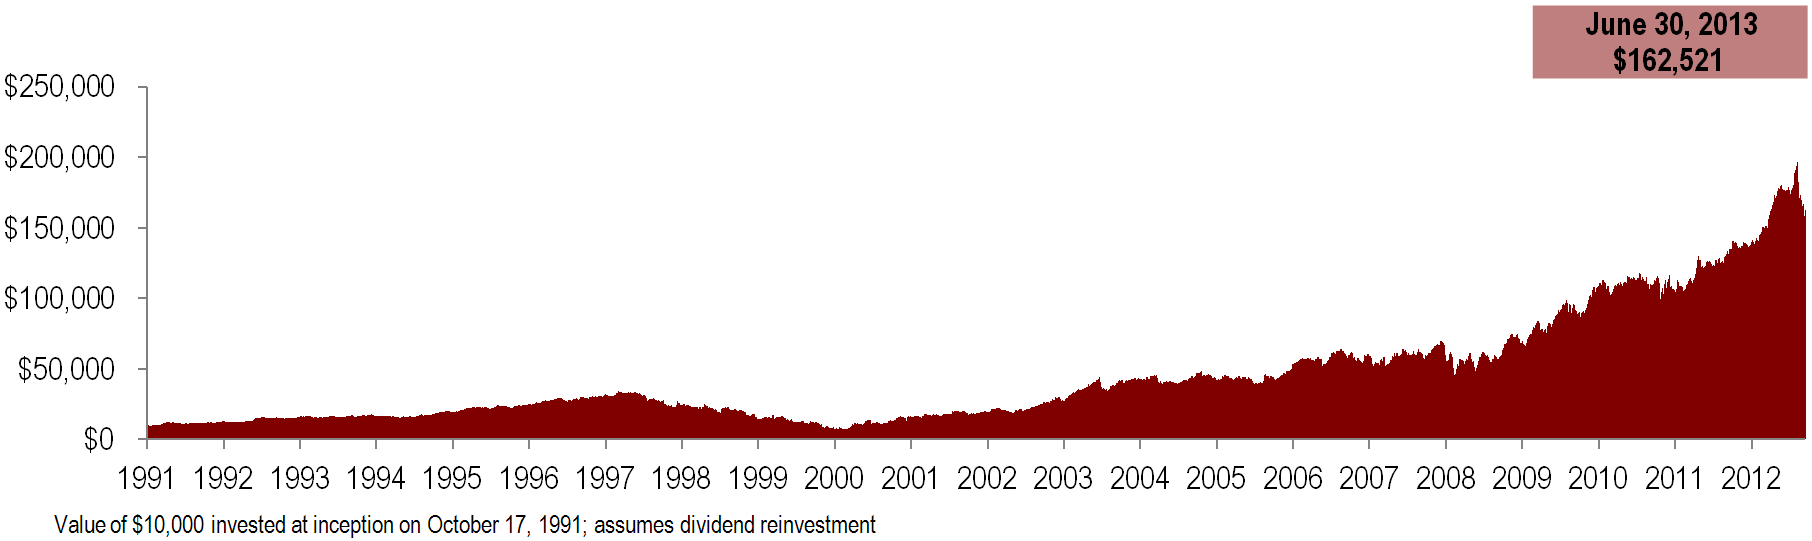
VALUE CREATION
Total Annual Return | ||||||||||||||
NHI | S&P 500 | NAREIT | S&P 500 - Standard & Poor's index of 500 large-cap common stocks | |||||||||||
1 year | 23.44 | % | 20.60 | % | 9.72 | % | ||||||||
5 years | 23.47 | % | 7.01 | % | 7.93 | % | ||||||||
10 years | 20.63 | % | 7.29 | % | 10.01 | % | NAREIT - FTSE NAREIT US Real Estate Index Series of all publicly traded REITs | |||||||
15 years | 12.69 | % | 4.24 | % | 9.03 | % | ||||||||
Since inception* | 13.84 | % | 8.94 | % | 10.76 | % | ||||||||
*since inception of NHI in Oct. '91 | ||||||||||||||
DIVIDEND HISTORY
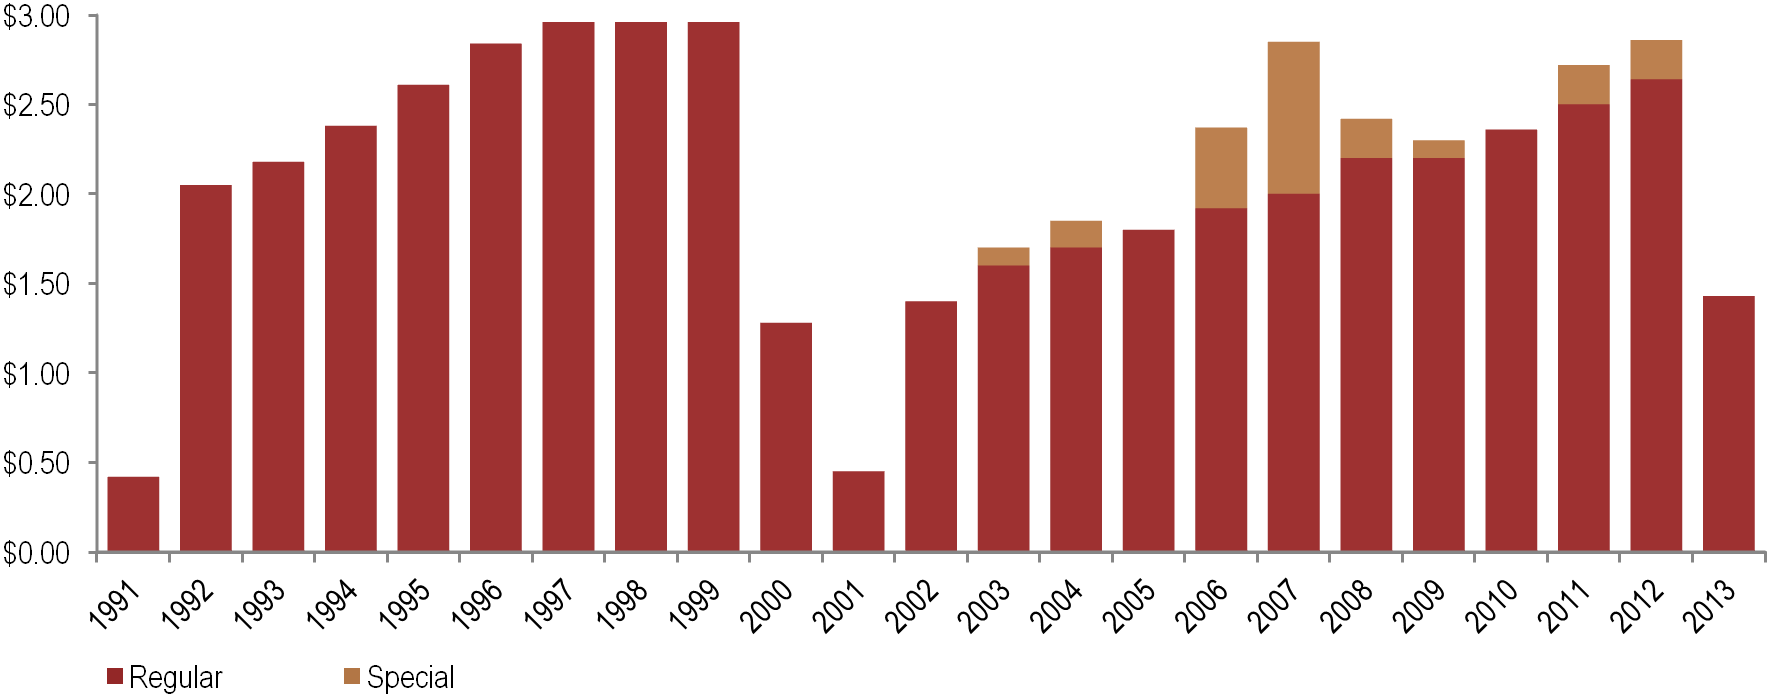
The Board of Directors approves a regular quarterly dividend which is reflective of expected taxable income on a recurring basis. Company transactions that are infrequent and non-recurring that generate additional taxable income have been distributed to shareholders in the form of special dividends. Taxable income is determined in accordance with the Internal Revenue Code and differs from net income for financial statement purposes determined in accordance with US GAAP.
Page :5
FINANCIAL
CONSOLIDATED BALANCE SHEETS
(in thousands, except share amounts)
June 30, 2013 | December 31, 2012 | ||||||
Assets: | |||||||
Real estate properties: | |||||||
Land | $ | 65,674 | $ | 58,869 | |||
Buildings and improvements | 795,455 | 636,994 | |||||
Construction in progress | 9,954 | 2,673 | |||||
871,083 | 698,536 | ||||||
Less accumulated depreciation | (172,097 | ) | (163,146 | ) | |||
Real estate properties, net | 698,986 | 535,390 | |||||
Mortgage and other notes receivable, net | 65,229 | 84,250 | |||||
Investment in preferred stock, at cost | 38,132 | 38,132 | |||||
Cash and cash equivalents | 36,469 | 9,172 | |||||
Marketable securities | 14,205 | 12,884 | |||||
Straight-line rent receivable | 15,065 | 12,370 | |||||
Equity-method investment and other assets | 17,537 | 12,172 | |||||
Assets held for sale, net | 1,611 | 1,611 | |||||
Total Assets | $ | 887,234 | $ | 705,981 | |||
Liabilities and Stockholders' Equity: | |||||||
Debt | $ | 386,778 | $ | 203,250 | |||
Real estate purchase liabilities | 5,856 | 4,256 | |||||
Accounts payable and accrued expenses | 3,894 | 4,301 | |||||
Dividends payable | 20,489 | 24,793 | |||||
Deferred income | 1,230 | 1,334 | |||||
Total Liabilities | 418,247 | 237,934 | |||||
Commitments and Contingencies | |||||||
National Health Investors Stockholders' Equity: | |||||||
Common stock, $.01 par value; 40,000,000 shares authorized; | |||||||
27,876,176 and 27,857,217 shares issued and outstanding, respectively | 279 | 279 | |||||
Capital in excess of par value | 470,639 | 467,843 | |||||
Cumulative dividends in excess of net income | (22,695 | ) | (18,495 | ) | |||
Accumulated other comprehensive income | 9,982 | 7,555 | |||||
Total National Health Investors Stockholders' Equity | 458,205 | 457,182 | |||||
Noncontrolling interest | 10,782 | 10,865 | |||||
Total Equity | 468,987 | 468,047 | |||||
Total Liabilities and Stockholders' Equity | $ | 887,234 | $ | 705,981 | |||
Page :6
CONSOLIDATED STATEMENTS OF INCOME
(in thousands, except share and per share amounts)
Three Months Ended | Six Months Ended | ||||||||||||||
June 30, | June 30, | ||||||||||||||
2013 | 2012 | 2013 | 2012 | ||||||||||||
Revenues: | |||||||||||||||
Rental income | $ | 25,012 | $ | 18,921 | $ | 50,062 | $ | 40,217 | |||||||
Interest income from mortgage and other notes | 1,972 | 1,847 | 3,941 | 3,549 | |||||||||||
Investment income and other | 1,064 | 1,054 | 2,116 | 2,114 | |||||||||||
28,048 | 21,822 | 56,119 | 45,880 | ||||||||||||
Expenses: | |||||||||||||||
Depreciation and amortization | 4,558 | 3,295 | 8,973 | 6,559 | |||||||||||
Interest | 1,598 | 747 | 2,721 | 1,321 | |||||||||||
Legal | 289 | 128 | 566 | 220 | |||||||||||
Franchise, excise and other taxes | 93 | 229 | 237 | 354 | |||||||||||
General and administrative | 2,325 | 1,593 | 5,414 | 4,379 | |||||||||||
Loan impairment | — | — | 4,037 | — | |||||||||||
8,863 | 5,992 | 21,948 | 12,833 | ||||||||||||
Income before equity-method investee, discontinued operations and noncontrolling interest | 19,185 | 15,830 | 34,171 | 33,047 | |||||||||||
Income from equity-method investee | 69 | — | 91 | — | |||||||||||
Investment and other gains | — | 30 | — | 30 | |||||||||||
Income from continuing operations | 19,254 | 15,860 | 34,262 | 33,077 | |||||||||||
Income from discontinued operations | 844 | 1,068 | 1,759 | 2,201 | |||||||||||
Net income | 20,098 | 16,928 | 36,021 | 35,278 | |||||||||||
Net income attributable to noncontrolling interest | (178 | ) | — | (358 | ) | — | |||||||||
Net income attributable to common stockholders | $ | 19,920 | $ | 16,928 | $ | 35,663 | $ | 35,278 | |||||||
Weighted average common shares outstanding: | |||||||||||||||
Basic | 27,876,176 | 27,792,834 | 27,871,120 | 27,784,469 | |||||||||||
Diluted | 27,913,727 | 27,820,831 | 27,907,600 | 27,812,027 | |||||||||||
Earnings per common share: | |||||||||||||||
Basic: | |||||||||||||||
Income from continuing operations attributable to common stockholders | $ | .68 | $ | .57 | $ | 1.22 | $ | 1.19 | |||||||
Discontinued operations | .03 | .04 | .06 | .08 | |||||||||||
Net income attributable to common stockholders | $ | .71 | $ | .61 | $ | 1.28 | $ | 1.27 | |||||||
Diluted: | |||||||||||||||
Income from continuing operations attributable to common stockholders | $ | .68 | $ | .57 | $ | 1.21 | $ | 1.19 | |||||||
Discontinued operations | .03 | .04 | .06 | .08 | |||||||||||
Net income attributable to common stockholders | $ | .71 | $ | .61 | $ | 1.27 | $ | 1.27 | |||||||
Regular dividends declared per common share | $ | .735 | $ | .65 | $ | 1.43 | $ | 1.30 | |||||||
Page :7
FUNDS FROM OPERATIONS (FFO)
(in thousands, except share and per share amounts)
Three Months Ended | Six Months Ended | ||||||||||||||
June 30, | June 30, | ||||||||||||||
2013 | 2012 | 2013 | 2012 | ||||||||||||
Net income attributable to common stockholders | $ | 19,920 | $ | 16,928 | $ | 35,663 | $ | 35,278 | |||||||
Elimination of certain non-cash items in net income: | |||||||||||||||
Real estate depreciation in continuing operations | 3,985 | 2,942 | 7,868 | 5,866 | |||||||||||
Real estate depreciation related to noncontrolling interest | (68 | ) | — | (135 | ) | — | |||||||||
Real estate depreciation in discontinued operations | — | 101 | — | 202 | |||||||||||
Funds from operations | $ | 23,837 | $ | 19,971 | $ | 43,396 | $ | 41,346 | |||||||
Gains on sales of marketable securities | — | (30 | ) | — | (30 | ) | |||||||||
Loan costs expensed due to credit facility amendment | 353 | — | 353 | — | |||||||||||
Non-cash write-off of straight-line rent receivable | — | 963 | — | 963 | |||||||||||
Write-offs and expenses due to early lease termination | — | 297 | — | 297 | |||||||||||
Acquisition costs under business combination accounting1 | 208 | 95 | 208 | 95 | |||||||||||
Legal settlement | — | 90 | — | 90 | |||||||||||
Loan impairment | — | — | 4,037 | — | |||||||||||
Normalized FFO | $ | 24,398 | $ | 21,386 | $ | 47,994 | $ | 42,761 | |||||||
1 excludes portion attributable to noncontrolling interest | |||||||||||||||
BASIC | |||||||||||||||
Weighted average common shares outstanding | 27,876,176 | 27,792,834 | 27,871,120 | 27,784,469 | |||||||||||
FFO per common share | $ | .86 | $ | .72 | $ | 1.56 | $ | 1.49 | |||||||
Normalized FFO per common share | $ | .88 | $ | .77 | $ | 1.72 | $ | 1.54 | |||||||
DILUTED | |||||||||||||||
Weighted average common shares outstanding | 27,913,727 | 27,820,831 | 27,907,600 | 27,812,027 | |||||||||||
FFO per common share | $ | .85 | $ | .72 | $ | 1.55 | $ | 1.49 | |||||||
Normalized FFO per common share | $ | .87 | $ | .77 | $ | 1.72 | $ | 1.54 | |||||||
Normalized FFO payout ratio: | |||||||||||||||
Dividends declared per common share | $ | .735 | $ | .65 | $ | 1.43 | $ | 1.30 | |||||||
Normalized FFO per diluted common share | $ | .87 | $ | .77 | $ | 1.72 | $ | 1.54 | |||||||
84.5 | % | 84.4 | % | 83.1 | % | 84.4 | % | ||||||||
Page :8
FUNDS AVAILABLE FOR DISTRIBUTION (FAD)
(in thousands, except share and per share amounts)
Three Months Ended | Six Months Ended | ||||||||||||||
June 30, | June 30, | ||||||||||||||
2013 | 2012 | 2013 | 2012 | ||||||||||||
Net income attributable to common stockholders | $ | 19,920 | $ | 16,928 | $ | 35,663 | $ | 35,278 | |||||||
Elimination of certain non-cash items in net income: | |||||||||||||||
Depreciation in continuing operations | 4,558 | 3,295 | 8,973 | 6,559 | |||||||||||
Depreciation related to noncontrolling interest | (87 | ) | — | (175 | ) | — | |||||||||
Depreciation in discontinued operations | — | 101 | — | 202 | |||||||||||
Straight-line lease revenue, net | (1,413 | ) | (14 | ) | (2,695 | ) | (1,077 | ) | |||||||
Non-cash stock based compensation | 253 | 248 | 1,833 | 1,679 | |||||||||||
Funds available for distribution | $ | 23,231 | $ | 20,558 | $ | 43,599 | $ | 42,641 | |||||||
Gains on sales of marketable securities | — | (30 | ) | — | (30 | ) | |||||||||
Loan costs expensed due to credit facility amendment | 353 | — | 353 | — | |||||||||||
Write-offs and expenses due to early lease termination | — | 297 | — | 297 | |||||||||||
Acquisition costs under business combination accounting1 | 208 | 95 | 208 | 95 | |||||||||||
Legal settlement | — | 90 | — | 90 | |||||||||||
Loan impairment | — | — | 4,037 | — | |||||||||||
Normalized FAD | $ | 23,792 | $ | 21,010 | $ | 48,197 | $ | 43,093 | |||||||
1 excludes portion attributable to noncontrolling interest | |||||||||||||||
BASIC | |||||||||||||||
Weighted average common shares outstanding | 27,876,176 | 27,792,834 | 27,871,120 | 27,784,469 | |||||||||||
FAD per common share | $ | .83 | $ | .74 | $ | 1.56 | $ | 1.53 | |||||||
Normalized FAD per common share | $ | .85 | $ | .76 | $ | 1.73 | $ | 1.55 | |||||||
DILUTED | |||||||||||||||
Weighted average common shares outstanding | 27,913,727 | 27,820,831 | 27,907,600 | 27,812,027 | |||||||||||
FAD per common share | $ | .83 | $ | .74 | $ | 1.56 | $ | 1.53 | |||||||
Normalized FAD per common share | $ | .85 | $ | .76 | $ | 1.73 | $ | 1.55 | |||||||
Normalized FAD payout ratio: | |||||||||||||||
Dividends declared per common share | $ | .735 | $ | .65 | $ | 1.43 | $ | 1.30 | |||||||
Normalized FAD per diluted common share | $ | .85 | $ | .76 | $ | 1.73 | $ | 1.55 | |||||||
86.5 | % | 85.5 | % | 82.7 | % | 83.9 | % | ||||||||
Page :9
EBITDA RECONCILIATION AND INTEREST COVERAGE RATIO
(in thousands)
Three Months Ended | Six Months Ended | ||||||||||||||
June 30, | June 30, | ||||||||||||||
2013 | 2012 | 2013 | 2012 | ||||||||||||
Net income | $ | 20,098 | $ | 16,928 | $ | 36,021 | $ | 35,278 | |||||||
Interest expense | 1,598 | 747 | 2,721 | 1,321 | |||||||||||
Franchise, excise and other taxes | 93 | 229 | 237 | 354 | |||||||||||
Depreciation | 4,558 | 3,295 | 8,973 | 6,559 | |||||||||||
EBITDA | $ | 26,347 | $ | 21,199 | $ | 47,952 | $ | 43,512 | |||||||
Interest expense | $ | 1,598 | $ | 747 | $ | 2,721 | $ | 1,321 | |||||||
Interest Coverage Ratio | 16:1 | 28:1 | 18:1 | 33:1 | |||||||||||
DEBT MATURITY SCHEDULE
(in thousands)
2013 | 2014 | 2015 | 2016 | Thereafter | |||||||||||||||
Revolving credit facility - unsecured | $ | — | $ | — | $ | — | $ | — | $ | 167,000 | |||||||||
Bank term loans - unsecured | — | — | — | — | 120,000 | ||||||||||||||
Bank term loan - secured | 19,250 | — | — | — | — | ||||||||||||||
Fannie Mae term loans - secured | 405 | 1,056 | 77,268 | — | — | ||||||||||||||
TOTAL | $ | 19,655 | $ | 1,056 | $ | 77,268 | $ | — | $ | 287,000 | |||||||||
Page :10
PORTFOLIO
PORTFOLIO SUMMARY as of June 30, 2013
(dollars in thousands)
Properties | Beds/Units/ Sq. Ft. | YTD Revenue | ||||||||
Leases | ||||||||||
Skilled Nursing1 | 57 | 7,988 | $ | 30,662 | ||||||
Assisted Living | 56 | 2,734 | 11,324 | |||||||
Senior Living Campus | 5 | 797 | 3,366 | |||||||
Hospitals | 3 | 181 | 3,549 | |||||||
Independent Living | 3 | 273 | 619 | |||||||
Medical Office Buildings | 2 | 88,517 | 542 | |||||||
Total Leases | 126 | $ | 50,062 | |||||||
1 | Skilled Nursing | |||||||||
NHC facilities* | 32 | 4,624 | $ | 16,529 | ||||||
All other facilities | 25 | 3,364 | 14,133 | |||||||
57 | 7,988 | $ | 30,662 | |||||||
* On October 17, 1991, the NHC facilities were transferred to NHI at their then current book value in a non-taxable exchange. | ||||||||||
Mortgages and Other Notes Receivable | ||||||||||
Skilled Nursing | 15 | 1,531 | $ | 1,825 | ||||||
Assisted Living | 2 | 190 | 363 | |||||||
Senior Living Campus | 1 | 76 | 56 | |||||||
Hospital | 1 | 70 | 597 | |||||||
Other Notes Receivable | — | — | 1,100 | |||||||
Total Mortgages | 19 | 1,867 | $ | 3,941 | ||||||
LEASE PORTFOLIO COVERAGE
Trailing 12 month EBITDARM Lease Coverage1 | |||||||||||
ALF | SNF | SLC | HOSP | MOB | Total | ||||||
Number of Stabilized Lease Properties2 | 26 | 64 | 5 | 2 | 2 | 99 | |||||
Stabilized Lease Portfolio EBITDARM Coverage Ratio | 1.31 | 3.21 | 1.50 | 3.42 | 6.25 | 2.88 | |||||
1 as of March 31, 2013 | |||||||||||
2 excludes new construction and RIDEA assets | |||||||||||
Page :11
RIDEA ASSETS
Bickford Senior Living
(dollars in thousands)
As of and for the three months ended: | |||||||||||||||
June 30, 2013 | March 31, 2013 | December 31, 2012 | September 30, 20121 | ||||||||||||
Original 10 in RIDEA Portfolio | |||||||||||||||
Properties | 10 | 10 | 10 | 10 | |||||||||||
Average age (years) | 10 | 10 | 9 | 9 | |||||||||||
Units | 488 | 488 | 488 | 488 | |||||||||||
Total occupancy | 85.6 | % | 87.2 | % | 88.7 | % | 85.4 | % | |||||||
Occupied units | 418 | 426 | 433 | 417 | |||||||||||
Revenues | $ | 6,131 | $ | 6,189 | $ | 6,335 | $ | 6,097 | |||||||
Operating expenses2 | 3,972 | 4,056 | 4,109 | 4,120 | |||||||||||
EBITDAR | $ | 2,159 | $ | 2,133 | $ | 2,226 | $ | 1,977 | |||||||
All 27 in RIDEA Portfolio3 | |||||||||||||||
Properties | 27 | 27 | 27 | 27 | |||||||||||
Average age (years) | 12 | 12 | 12 | 12 | |||||||||||
Units | 1,238 | 1,238 | 1,238 | 1,238 | |||||||||||
Total occupancy4 | 84.3 | % | 85.2 | % | 86.5 | % | 85.7 | % | |||||||
Occupied units | 1,044 | 1,055 | 1,071 | 1,061 | |||||||||||
Revenues | $ | 14,641 | $ | 14,692 | $ | 14,710 | $ | 14,382 | |||||||
Operating expenses2 | 9,512 | 9,543 | 9,559 | 9,681 | |||||||||||
EBITDAR | $ | 5,129 | $ | 5,149 | $ | 5,151 | $ | 4,701 | |||||||
1 3rd Quarter 2012 was utilized in underwriting but occurred prior to the RIDEA transaction | |||||||||||||||
2 includes a 5% management fee | |||||||||||||||
3 The 17 new assets did not join NHI's portfolio until June 2013. This combined presentation is for comparative information only. | |||||||||||||||
4 Includes 2 non-stabilized assets. The new portfolio of 17 properties is 90.7% occupied when excluding those assets. | |||||||||||||||
Page :12
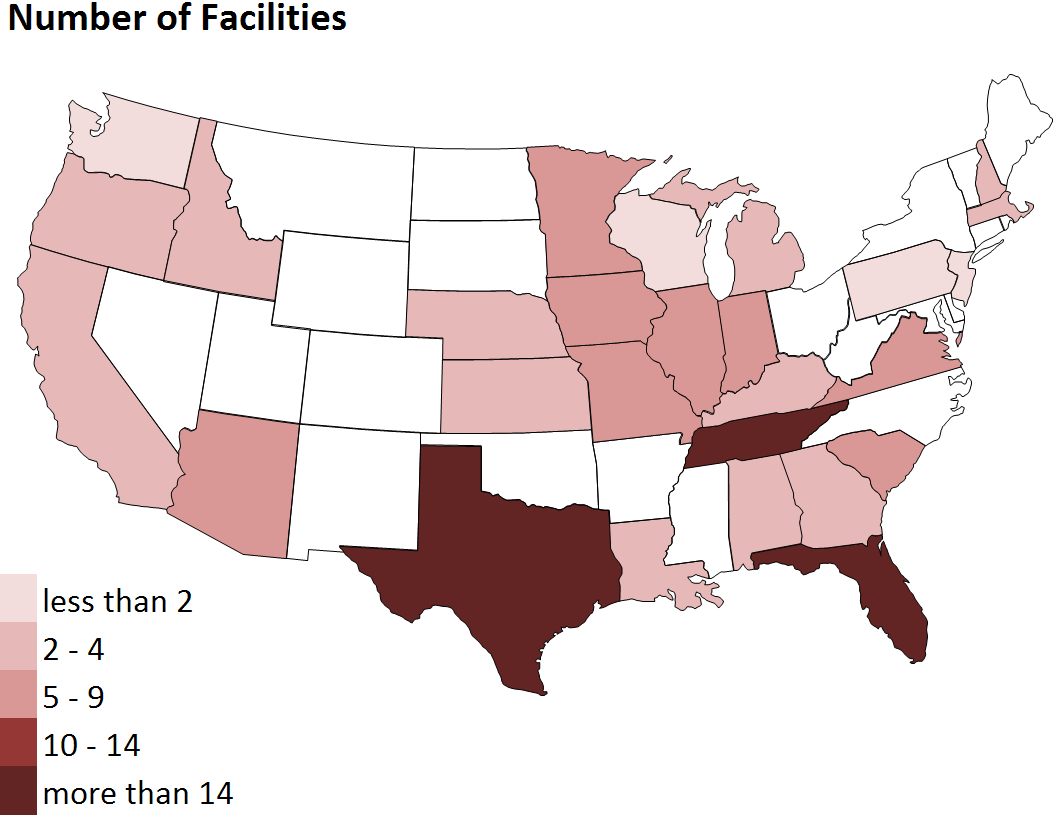
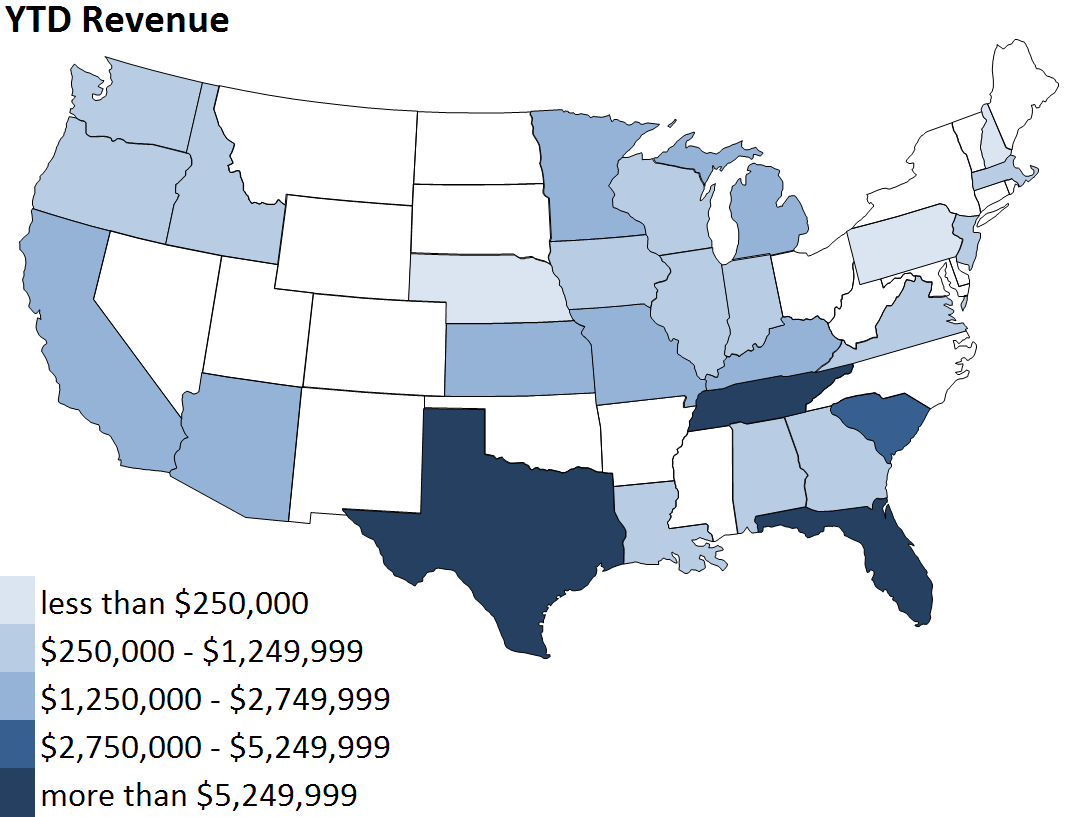
GEOGRAPHIC DISTRIBUTION as of June 30, 2013
(dollars in thousands)
SNF | ALF | SLC | ILF | HOSP | MOB | TOTAL | YTD Revenue | |||||||||||||||||
Texas | 17 | — | — | — | — | 1 | 18 | $ | 10,373 | |||||||||||||||
Tennessee | 16 | 3 | — | 2 | 1 | — | 22 | 9,167 | ||||||||||||||||
Florida | 10 | 5 | 2 | — | — | 1 | 18 | 8,570 | ||||||||||||||||
South Carolina | 4 | 1 | — | — | — | — | 5 | 3,374 | ||||||||||||||||
Arizona | 1 | 4 | — | — | 1 | — | 6 | 2,621 | ||||||||||||||||
Kentucky | 1 | — | — | — | 1 | — | 2 | 2,061 | ||||||||||||||||
Michigan | — | 4 | — | — | — | — | 4 | 1,732 | ||||||||||||||||
Missouri | 5 | — | — | 1 | — | — | 6 | 1,635 | ||||||||||||||||
Minnesota | — | 5 | — | — | — | — | 5 | 1,608 | ||||||||||||||||
California | — | — | 1 | — | 1 | — | 2 | 1,600 | ||||||||||||||||
Kansas | — | 2 | — | — | — | — | 2 | 1,406 | ||||||||||||||||
Washington | — | — | 1 | — | — | — | 1 | 1,211 | ||||||||||||||||
Alabama | 2 | — | — | — | — | — | 2 | 1,169 | ||||||||||||||||
Virginia | 7 | — | — | — | — | — | 7 | 1,096 | ||||||||||||||||
Wisconsin | — | 1 | — | — | — | — | 1 | 978 | ||||||||||||||||
Louisiana | — | 4 | — | — | — | — | 4 | 880 | ||||||||||||||||
Idaho | 1 | 1 | 1 | — | — | — | 3 | 620 | ||||||||||||||||
Iowa | — | 9 | — | — | — | — | 9 | 567 | ||||||||||||||||
Illinois | — | 6 | — | — | — | — | 6 | 438 | ||||||||||||||||
Georgia | 1 | 1 | — | — | — | — | 2 | 412 | ||||||||||||||||
Oregon | — | 2 | 1 | — | — | — | 3 | 378 | ||||||||||||||||
Indiana | — | 6 | — | — | — | — | 6 | 325 | ||||||||||||||||
Massachusetts | 4 | — | — | — | — | — | 4 | 299 | ||||||||||||||||
Pennsylvania | — | 1 | — | — | — | — | 1 | 201 | ||||||||||||||||
New Hampshire | 3 | — | — | — | — | — | 3 | 182 | ||||||||||||||||
Nebraska | — | 3 | — | — | — | — | 3 | — | ||||||||||||||||
Other | — | — | — | — | — | — | — | 1,100 | ||||||||||||||||
72 | 58 | 6 | 3 | 4 | 2 | 145 | $ | 54,003 | ||||||||||||||||
Page :13
LEASE RENEWAL YEARS AND MORTGAGE AND OTHER LOAN MATURITIES as of June 30, 2013
(dollars in thousands)
2013 | 2014 | 2015 | 2016 | 2017-2020 | 2021-2024 | Thereafter | TOTALS | ||||||||||||||||
Leases | |||||||||||||||||||||||
Skilled Nursing | |||||||||||||||||||||||
Annualized Revenue | 306 | 6,444 | — | 5,257 | 416 | 2,478 | 46,423 | 61,324 | |||||||||||||||
Properties | 1 | 6 | — | 5 | 1 | 3 | 41 | 57 | |||||||||||||||
Assisted Living | |||||||||||||||||||||||
Annualized Revenue | — | — | — | — | 22,130 | 5,072 | 6,532 | 33,734 | |||||||||||||||
Properties | — | — | — | — | 36 | 11 | 9 | 56 | |||||||||||||||
Senior Living Campus | |||||||||||||||||||||||
Annualized Revenue | — | — | — | 2,226 | — | 745 | 3,761 | 6,732 | |||||||||||||||
Properties | — | — | — | 2 | — | 1 | 2 | 5 | |||||||||||||||
Medical Office Buildings | |||||||||||||||||||||||
Annualized Revenue | 419 | — | — | — | 664 | — | — | 1,083 | |||||||||||||||
Properties | 1 | — | — | — | 1 | — | — | 2 | |||||||||||||||
Independent Living | |||||||||||||||||||||||
Annualized Revenue | — | — | — | — | — | — | 1,238 | 1,238 | |||||||||||||||
Properties | — | — | — | — | — | — | 3 | 3 | |||||||||||||||
Hospitals | |||||||||||||||||||||||
Annualized Revenue | — | — | — | — | — | 2,761 | 4,337 | 7,098 | |||||||||||||||
Properties | — | — | — | — | — | 1 | 2 | 3 | |||||||||||||||
Total Annualized Revenues | 725 | 6,444 | — | 7,483 | 23,210 | 11,056 | 62,291 | 111,209 | |||||||||||||||
Mortgages and Other Loans | |||||||||||||||||||||||
Skilled Nursing | |||||||||||||||||||||||
Annualized Revenue | 1,276 | — | 141 | — | — | — | 1,283 | 2,700 | |||||||||||||||
Properties | 8 | — | 1 | — | — | — | 6 | 15 | |||||||||||||||
Assisted Living | |||||||||||||||||||||||
Annualized Revenue | — | 327 | — | — | 400 | — | — | 727 | |||||||||||||||
Properties | — | 1 | — | — | 1 | — | — | 2 | |||||||||||||||
Senior Living Campus | |||||||||||||||||||||||
Annualized Revenue | — | 113 | — | — | — | — | — | 113 | |||||||||||||||
Properties | — | 1 | — | — | — | — | — | 1 | |||||||||||||||
Hospitals | |||||||||||||||||||||||
Annualized Revenue | — | — | 1,194 | — | — | — | — | 1,194 | |||||||||||||||
Properties | — | — | 1 | — | — | — | — | 1 | |||||||||||||||
Other Loans | |||||||||||||||||||||||
Annualized Revenue | — | — | 2,200 | — | — | — | — | 2,200 | |||||||||||||||
Total Annualized Revenues | 1,276 | 440 | 3,535 | — | 400 | — | 1,283 | 6,934 | |||||||||||||||
Page :14
DEFINITIONS
Annualized Revenue
The term Annualized Revenue refers to the amount of revenue that our portfolio would generate if all leases and mortgages were in effect for the twelve-month calendar year, regardless of the commencement date, maturity date, or renewals. Therefore, annualized revenue is used for financial analysis purposes, and is not indicative of actual or expected results.
EBITDA
Earnings before interest, taxes, depreciation and amortization
Facility Types
ALF - Assisted living facility HOSP - Hospital
ILF - Independent living facility MOB - Medical office building
SLC - Senior Living Campus SNF -Skilled nursing facility
Funds available for distribution - FAD
FAD represents net earnings available to common stockholders, excluding the effects of asset dispositions and straight-line rent adjustments, plus depreciation, stock based compensation and changes in the fair value of our interest rate swap agreement, if any. Our measure may not be comparable to similarly titled measures used by other REITs. Consequently, our FAD may not provide a meaningful measure of our performance as compared to that of other REITs. Since other REITs may not use our definition of FAD, caution should be exercised when comparing our Company's FAD to that of other REITs. FAD in and of itself does not represent cash generated from operating activities in accordance with GAAP (FAD does not include changes in operating assets and liabilities) and therefore should not be considered an alternative to net earnings as an indication of operating performance, or to net cash flow from operating activities as determined by GAAP as a measure of liquidity, and is not necessarily indicative of cash available to fund cash needs.
Funds from operations - FFO
FFO is an important supplemental measure of operating performance for a REIT. Because the historical cost accounting convention used for real estate assets requires depreciation (except on land), such accounting presentation implies that the value of real estate assets diminishes predictably over time. Since real estate values instead have historically risen and fallen with market conditions, presentations of operating results for a REIT that uses historical cost accounting for depreciation could be less informative, and should be supplemented with a measure such as FFO. FFO, as defined by the National Association of Real Estate Investment Trusts ("NAREIT") and applied by us, is net income (computed in accordance with GAAP), excluding gains (or losses) from sales of real estate property and impairment write-downs of depreciable real estate, plus real estate depreciation and amortization, and after adjustments for unconsolidated partnerships and joint ventures, if any. Our measure may not be comparable to similarly titled measures used by other REITs. Consequently, our FFO may not provide a meaningful measure of our performance as compared to that of other REITs. Since other REITs may not use our definition of FFO, caution should be exercised when comparing our Company's FFO to that of other REITs. FFO in and of itself does not represent cash generated from operating activities in accordance with GAAP (FFO does not include changes in operating assets and liabilities) and therefore should not be considered an alternative to net earnings as an indication of operating performance, or to net cash flow from operating activities as determined by GAAP as a measure of liquidity, and is not necessarily indicative of cash available to fund cash needs.
Normalized FFO & Normalized FAD
Normalized FFO and Normalized FAD exclude from FFO and FAD, respectively, certain items which, due to their infrequent or unpredictable nature, may create some difficulty in comparing FFO and FAD for the current period to similar prior periods, and may include, but are not limited to, impairment of assets, gains and losses attributable to the acquisition and disposition of assets and liabilities, recoveries of previous write-downs, and changes in the fair value of interest rate swap agreements for those agreements that do not qualify for hedge accounting.
Investment (NBV)
The term Investment (NBV) refers to the net carrying value of our real estate and mortgage investments.
Total Annual Return
The term Total Annual Return refers to the total return an investor would have realized on an annual basis over a certain period assuming that all dividends are reinvested on the dividend payment date.
RIDEA
The term RIDEA refers to the REIT Diversification and Empowerment Act of 2007. Our joint ventures are designed to be compliant with the provisions of this Act.
Page :15