Attached files
| file | filename |
|---|---|
| 8-K - FORM 8-K - Genpact LTD | d580368d8k.htm |
| EX-99.1 - EX-99.1 - Genpact LTD | d580368dex991.htm |
 Genpact
2
nd
Quarter 2013 Earnings Presentation
August 6, 2013
Ticker (NYSE: G)
Exhibit 99.2 |
 Forward
Looking Statements These
materials
contain
certain
statements
concerning
our
future
growth
prospects
and
forward-looking
statements,
as
defined
in
the
safe
harbor
provisions
of
the
U.S.
Private
Securities
Litigation
Reform
Act
of
1995. These statements are based on Genpact’s current expectations and
beliefs, as well as a number of assumptions
concerning
future
events.
These
statements
involve
a
number
of
risks,
uncertainties
and
other
factors that could cause actual results to differ materially from those in such
forward-looking statements. These risks and uncertainties include but
are not limited to a slowdown in the economies and sectors in which
our
clients
operate,
a
slowdown
in
the
BPM
and
IT
Services
sectors,
the
risks
and
uncertainties
arising from our past and future acquisitions, our ability to manage growth,
factors which may impact our cost advantage, wage increases, our ability to
attract and retain skilled professionals, risks and uncertainties regarding
fluctuations in our earnings, general economic conditions affecting our industry as
well as other risks detailed in our reports filed with the U.S. Securities and
Exchange Commission (the “SEC”),
including
the
Company's
Annual
Report
on
Form
10-K.
These
filings
are
available
at
www.sec.gov
or on the investor relations section of our website, www.genpact.com. Genpact may
from time to time make additional written and oral forward-looking
statements, including statements contained in our filings with the SEC. The
Company does not undertake to update any forward-looking statements that may be made from
time to time by or on behalf of the Company.
These materials also include measures defined by the SEC as non-GAAP financial
measures. Genpact believes that these non-GAAP measures can provide
useful supplemental information to investors regarding
financial
and
business
trends
relating
to
its
financial
condition
and
results
of
operations
when
read in conjunction with the Company’s reported results. Reconciliations of
these non-GAAP measures to GAAP are available in this presentation and
in our earnings release dated August 6, 2013. Non-GAAP Financial
Measures |
 3
Solid 2
nd
Quarter 2013
We continue to deliver consistent growth which is a reflection of our
differentiated, diversified and resilient business model
Q2 ‘13 versus Q2 ‘12 performance:
Total Revenue:
+14%
Revenue from Global Clients:
+20%
GE Revenue:
-1%
Adjusted Operating Income
(1)
:
+15%
Adjusted
Operating
Income
margin
(1)
of
16.7%
Broad-based growth across industry verticals and service offerings
Smart Decision Services resumed growth
Continued to significantly expand client relationships
Notes:
1)
Adjusted Operating Income is a Non-GAAP Measure. GAAP Operating Income increased 23.5% and GAAP
Operating
Margin was 15%. |
 4
Expanding Client Relationships
Notes:
1) Relationship size = Clients representing annual revenues based on rolling
four quarters 41
11
10
55
14
12
0
10
20
30
40
50
60
$5 to $15 MM
$15 to $25 MM
>$25 MM
Relationship Size
(1)
Q2 12
Q2 13 |
 5
Our Strategy is Resonating With Clients
Lead
Guide global enterprises to best-in-class through our
proprietary SEP
SM
framework
Example: Selected by large global industrial company to improve its
aftermarket services organization and processes
Expand
Invest in targeted industry verticals and domain expertise
Example:
Won
an
ITO
engagement,
leveraging
our
deep
expertise
in
the
CPG vertical, processes and technology
Allocate
Allocate capital and resources to support sustainable,
profitable growth and shareholder value
Example: Integrated recent acquisition that provided deep domain
expertise in the attractive, high-growth Healthcare market
Deliver
Execute seamlessly for clients across service lines and
geographies
Example: Engaged by large, existing Pharma client to improve end-
consumer experience |
 6
Macro-Environment Mixed; Pipeline Healthy
Macro-environment continues to be mixed
Challenges in some geographies and industries, improving in others
Pipeline remains healthy and stable with uptick in larger, transformative deals
U.S. and Europe strong
Growth across verticals led by Capital Markets, CPG, Life Sciences and BFS
Services led by F&A, ITO and Banking Operations
Increased share of large deals in pipeline; extends cycle times
Win rates steady; pricing competitive but stable
Clients’
continued focus on improving business models leading to
more transformative discussions |
 7
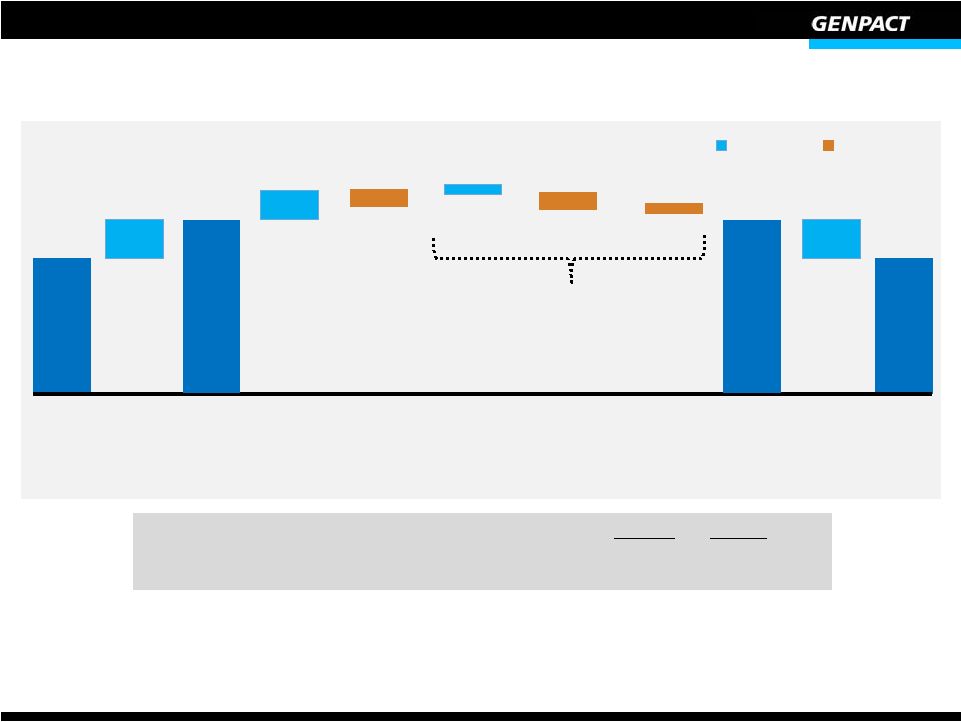
Revenue Growth of 14.4% Driven by Global Clients
Q2 2013 Global Clients
Business Process Management revenues increased 18% while ITO revenues increased
25% Q2 2013 GE
Growth in ITO more than offset by decline in Business Process Management
H1 2013 revenue at $1.039 billion; up 15.0% year over year
Global
Clients
(1)
GE
(1)
BPM
ITO
14.4%
YoY
Growth%
19.8%
(0.9)%
14.4%
20.9%
12.4%
YoY
Growth%
$467.6
$534.8
Q2 ‘12
Q2 ‘13
Q2 ‘12
Q2 ‘13
357.6
401.8
110.0
133.0
$467.6
$534.8
122.8
344.9
121.6
413.2
($ in millions)
Notes:
1) Data adjusted for divestitures from GE
($ in millions) |
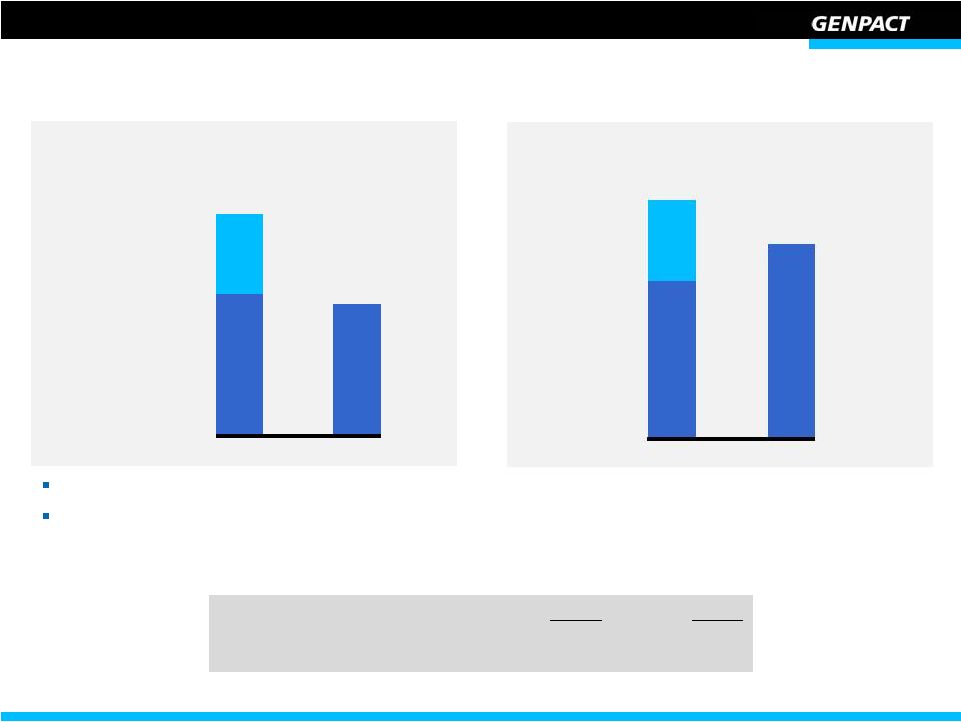
 8
Adjusted Income From Operations Growth of 14.6%
Q2 ‘12
Q2 ‘13
YoY Growth
Revenue
$467.6
$534.8
14.4%
Cost Of Revenue
285.2
332.7
16.7%
Gross Profit
182.4
202.1
10.8%
Gross Profit % of Revenue
39.0%
37.8%
(120)bps
Selling, general and administrative expenses
114.3
118.4
3.6%
SG&A % of Revenue
24.4%
22.1%
(230)bps
Adjusted Income From Operations
(1)
77.8
89.2
14.6%
Adjusted Income From Operations Margin %
16.6%
16.7%
10 bps
Notes:
($ millions)
1) Adjusted Operating Income is a Non-GAAP Measure. Income from Operations was $63.2 million
in Q2 ‘12 and $78.0 million in Q2 ’13 |
 9
EPS Bridge
27
4
Adjusted
Income from
Operations
Q2 ‘12
GAAP
EPS
Q2 ‘12
Q2 ‘13
Adjusted Net Income ($ millions)
72.6
74.7
Diluted
Shares
Outstanding
(millions)
(3)
228
235
(2)
(2)
Higher
Interest
Income/
Others
27
(1)
1
Lesser Fx
Re-
measurement
Gains
Incremental
Interest due
to previous
debt facility
One-time
write off due
to Q2 ‘13
refinance
(2)
Total Net Interest Expense-(2)
(Cents per share)
Net
other
Adjustments
(1)
32
32
5
5
Net
other
Adjustments
(1)
Q2 ‘12
Adjusted
EPS
Q2 ‘13
Adjusted
EPS
Q2 ‘13
GAAP
EPS
Increase Decrease
Notes:
- The above bridge reflects only significant variance items year over year
- EPS = Diluted earnings per share
1)
Adjustments primarily include amortization of intangibles relating to acquisition and share-based
compensation expenses. 2)
One-time write off relating to upfront fees and payment for early termination of previous
debt facility 3)
Weighted average number of diluted shares outstanding |
 10
Strong Cash Flow From Operations
One-time upfront client payment distorting year-over-year comparison
Normalizing
for
upfront
client
payment,
2
quarter
cash
flow
from
operations
declined
7%
due
to:
•
Accelerated
payments
from
clients
in
the
1
quarter
2013
•
Timing of employee bonus payments across quarter-end
82
45
Q2 ‘12
Q2 ‘13
(40)%
(7)%
Operating
Performance
Upfront Client
Payment
(One-time)
$127
$76
76
YoY
Growth%
($ in millions)
Q2 ‘12
Q2 ‘13
Days sales outstanding
82
80
Cash
and
Liquid
Assets
($
millions)
(1)
442
536
Notes:
1) Cash and Liquid Assets = Cash and Cash equivalents and short-term
deposits nd
st
H1 ‘12
H1 ‘13
$132
$108
(18)%
24%
YoY
Growth%
87
45
108
($ in millions) |
 11
Genpact Helps Clients Navigate Change
Our focus:
Build on strong position in large, under-penetrated target markets
Refine and consistently implement our growth strategy
Differentiate our capabilities and expertise in our targeted vertical markets
Deliver clear measurable business impact for clients |
 Q&A |
 13
Annexure 1: Reconciliation of Adjusted Income
from Operations
(USD, In Thousands)
2012
2013
Income from operations as per GAAP
$
63,167
$
77,988
Add: Amortization of acquired intangible assets resulting from
Formation Accounting
1,755
767
Add: Amortization of acquired intangible assets relating to
acquisitions
2,627
4,087
Add: Consultancy and legal fees relating to change of shareholding
and capital restructuring
1,687
-
Add: Stock based compensation
9,980
10,093
Add: Other income (expense)
322
(2,236)
Less: Equity-method investment activity, net
(13)
63
Less: Net income attributable to noncontrolling interest
(1,699)
(1,586)
Adjusted income from operations
$
77,826
$
89,176
Three
months
ended
June
30 |
 14
Annexure 2: Reconciliation of Adjusted Net Income
(USD, In Thousands, except per share data)
2012
2013
Net income as per GAAP
$
61,100
$
63,876
Add: Amortization of acquired intangible assets resulting from
Formation Accounting
1,755
767
Add: Amortization of acquired intangible assets relating to
acquisitions
2,627
4,087
Add: Stock based compensation
9,980
10,093
Add: Consultancy and legal fees relating to change of shareholding
and capital restructuring
1,687
-
Less: Tax impact on amortization of acquired intangibles resulting
from Formation Accounting
(366)
(158)
Less: Tax impact on amortization of acquired intangibles relating
from acquisitions
(902)
(1,394)
Less: Tax Impact on stock based compensation
(3,059)
(2,605)
Less: Tax impact on consultancy and legal fees relating to change
of shareholding and capital restructuring
(182)
-
Adjusted net income
$
72,640
$
74,666
Adjusted diluted earnings per share
$
0.32
$
0.32
Three
months
ended
June
30 |
 Thank
You |