Attached files
| file | filename |
|---|---|
| 8-K - FORM 8-K - SEALED AIR CORP/DE | d578206d8k.htm |
| EX-99.1 - EX-99.1 - SEALED AIR CORP/DE | d578206dex991.htm |
 SEALED AIR CORPORATION
Earnings Conference Call Supplement
Second Quarter 2013
(Unaudited Results)
August 2, 2013
Jerome A. Peribere –
President & Chief Executive Officer
Carol P. Lowe –
Senior Vice President & Chief Financial Officer
Exhibit 99.2 |
 Safe
Harbor and Regulation G Statement •
This
presentation
contains
“forward-looking
statements”
within
the
meaning
of
the
Private
Securities
Litigation
Reform
Act
of
1995.
Forward-looking
statements
can
be
identified
by
such
words
as
“anticipates,”
“believes,”
“plan,”
“assumes,”
“could,”
“estimates,”
“expects,”
“intends,”
“may,”
“plans
to,”
“will”
and
similar
expressions.
Examples of these forward-looking statements include 2013 financial
expectations and assumptions associated with
our
restructuring
programs,
availability
and
pricing
of
raw
materials,
success
of
our
growth
programs,
economic conditions, and the success of pricing actions. These statements reflect
our beliefs and expectations as to future events and trends affecting our
business, our consolidated financial position and our results of operations.
A variety of factors may cause actual results to differ materially from these
expectations, including general domestic and international economic and
political conditions affecting packaging utilization; changes in our raw
material and energy costs; credit ratings; competitive conditions and contract
terms; currency translation and devaluation effects, including Venezuela;
the success of our financial growth, profitability and manufacturing
strategies and our cost reduction and productivity efforts; the effects of animal
and food-related health issues; pandemics; environmental matters;
regulatory actions and legal matters; and the successful integration of
Diversey.
For more extensive information, see “Risk
Factors”
and
“Cautionary
Notice
Regarding
Forward-Looking
Statements,”
which
appear
in
our
most
recent
Annual
Report
on
Form
10-K, as filed with the Securities and
Exchange
Commission,
and
as
revised
and
updated
by
our
Quarterly
Reports
on
Form
10-Q
and
Current
Reports
on Form 8-K. While we may elect to update these forward-looking statements
at some point in the future, we specifically disclaim any obligation to do
so, whether as a result of new information, future events, or otherwise.
•
Our management uses non-U.S. GAAP financial measures to evaluate the
Company’s performance, which exclude items we consider unusual or
special items. We believe the use of such financial measures and
information
may
be
useful
to
investors.
We
believe
that
the
use
of
non-U.S. GAAP measures helps investors to
gain
a
better
understanding
of
core
operating
results
and
future
prospects,
consistent
with
how
management
measures and forecasts the Company's performance, especially when comparing such
results to previous periods or forecasts. For important information on our
use of non-U.S. GAAP financial measures and information, including
reconciliations of such non-U.S. GAAP financial measures and information to
comparable U.S. GAAP measures and information, please refer to the
financial tables and information provided in our earnings release. 1
|
 2
2
Key Takeaways
Second Quarter 2013
Q2 Performance Summary
•
Sales
$2.0B
-
Up
1.9%
as
reported
-
Up
3.2%
constant
currency
-
Volume
increased
2.4%
-
Price/mix
favorable
0.8%
•
Adj.
EBITDA:
$276.3M,
14.1%
of
sales
•
Adj.
EPS
$0.35;
Reported
EPS
of
$0.26
Excluding SARs
expense:
•
Q2
2013
Adj.
EBITDA:
$276.4M,
14.1%
of
sales
•
Q2
2012
Adj.
EBITDA:
$218.4M,
11.3%
of
sales
•
Q2
2013
Adj.
EPS:
$0.35
•
Q2
2012
Adj.
EPS:
$0.13
•
All divisions reported top line growth despite
global economic challenges
•
Strong growth in AMAT & Latin America,
modest growth in NA; offset by continued
weakness in Europe and Japan/ANZ
•
F&B and I&L delivered EBITDA margin
expansion
•
Seeing benefits from pricing initiatives, cost
synergies & operating efficiency improvements
•
Core Tax Rate of 23.8%
Reported U.S. GAAP Measures
Q2-13 Net Sales: $1.96B; Operating Profit: $169M; Net Income: $56M
Q2-12 Net Sales: $1.92B; Operating Profit: $108M; Net Loss: $21M
Q2-13 Effective tax rate: 25.1%
Please see Sealed Air’s August 2, 2013 earnings press release for important information about the
use of non- U.S. GAAP financial measures, including applicable reconciliations to U.S. GAAP
financial measures. All numbers reflect continuing operations, excluding the impact
of the sale of Diversey Japan. |
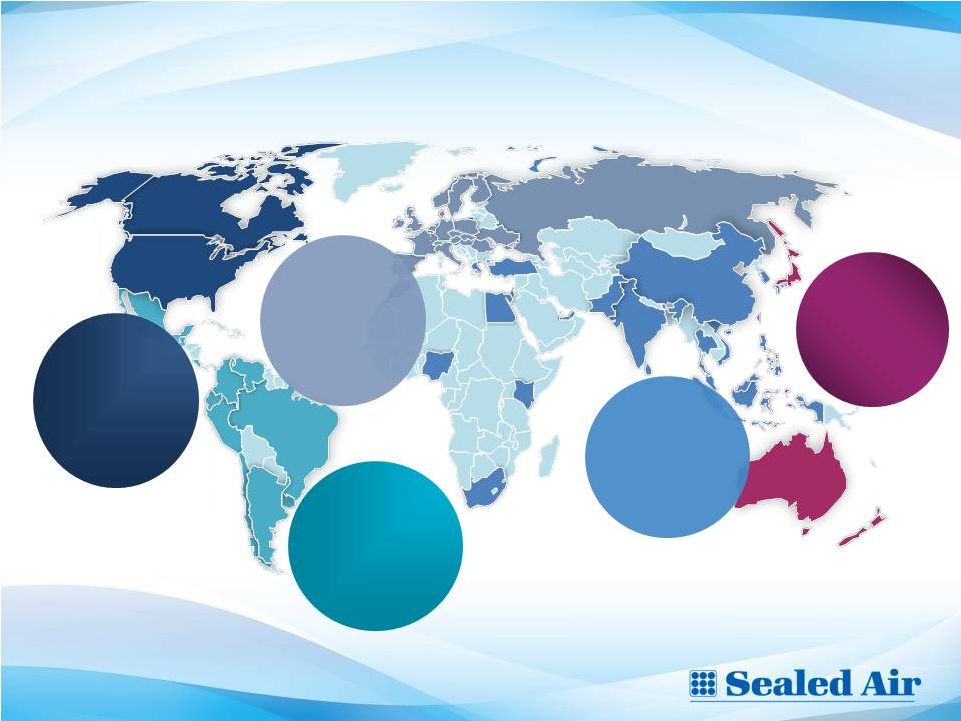 Regional Sales Performance
Second Quarter 2013
Latin
America
Reported: +7.6%
Organic: +11.7%
% of Sales: 10.6%
North
America
Reported: +2.1%
Organic: +2.3%
% of Sales: 39.6%
3
Japan/ANZ
Reported: -3.0%
Organic: -1.3%
% of Sales: 6.7%
Europe
Reported: -1.5%
Organic: -0.1%
% of Sales: 31.7%
AMAT
Reported: +9.4%
Organic: +10.8%
% of Sales: 11.4%
Please see Sealed Air’s August 2, 2013 earnings press release for important
information about the use of non- U.S. GAAP financial measures, including
applicable reconciliations to U.S. GAAP financial measures. *
Organic
sales
refers
to
unit
volume
and
price/mix
performance
and
excludes
the
impact
of
currency
translation |
 4
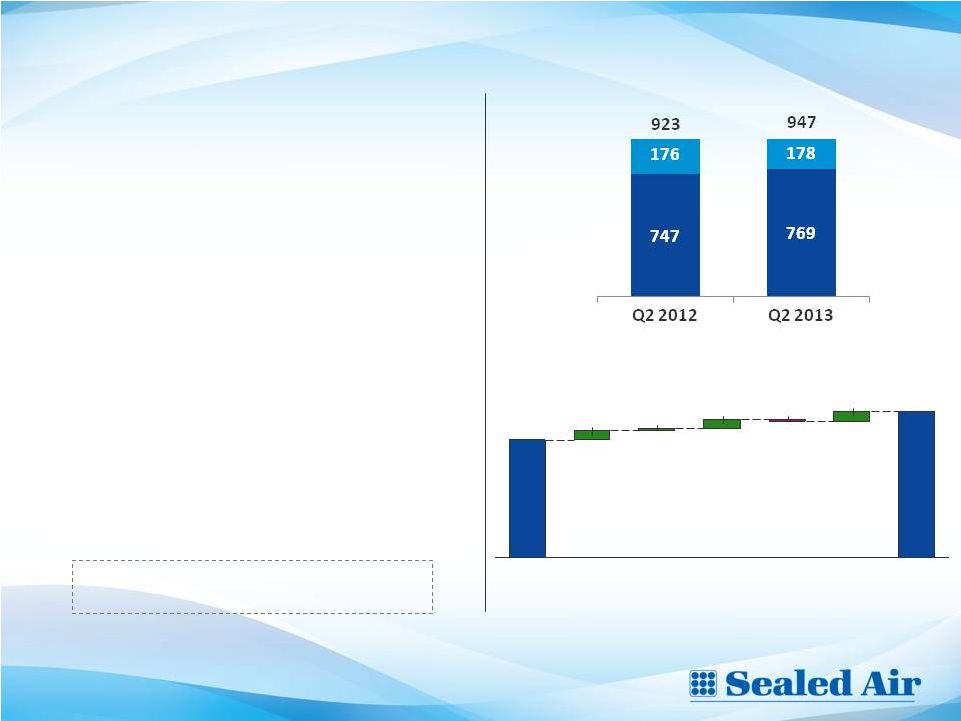
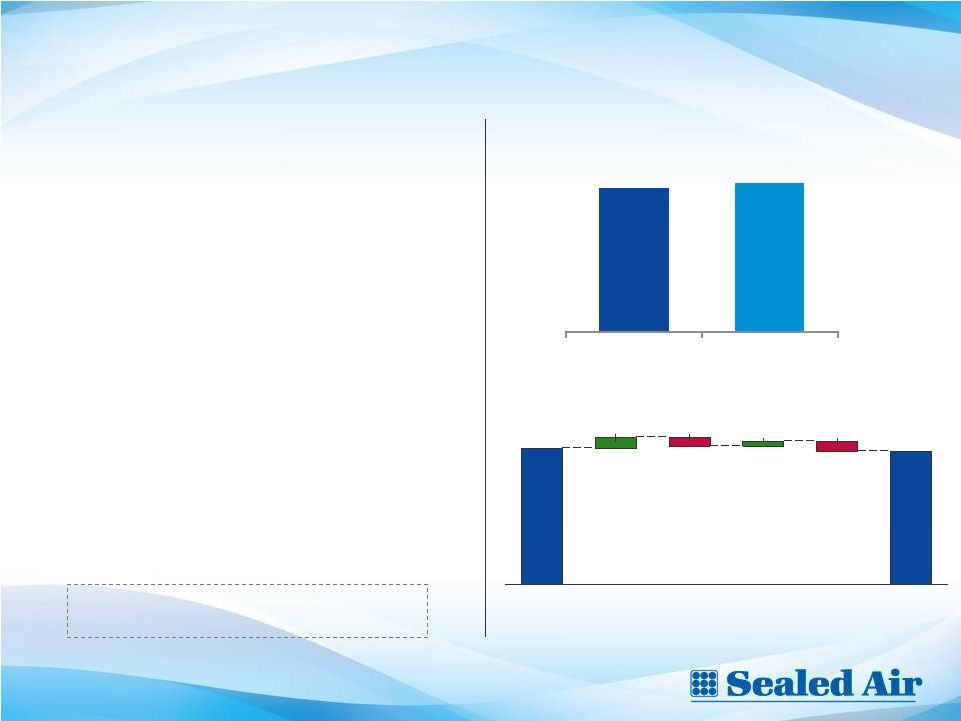
Food and Beverage: Achieved Sales and Adj. EBITDA Growth
•
Q2 Net Sales: +2.6%; organic growth: +3.9%
•
Volume increased 2.5%; Price/mix favorable 1.4%
•
Food Packaging organic sales increased 4.0%
•
Hygiene organic sales increased 3.4%
•
Q2 Adj. EBITDA Margin: 14.7%
•
Adjusted EBITDA growth of 24.2%
•
Excluding impact of SARs, growth of 26.9%
•
Key drivers: manufacturing efficiencies, cost
synergies and favorable product mix
•
Q2 Volume Trends by region vs. PY
•
North America: +1.4%
•
AMAT: +16.3%
•
Europe: -1.0%
•
JANZ: -0.5%
•
Latin America: +8.1%
Net Sales ($M)
Please see Sealed Air’s August 2, 2013 earnings press release for important
information about the use of non- U.S. GAAP financial measures, including
applicable reconciliations to U.S. GAAP financial measures. Hygiene
Packaging
Solutions
14.2%
Reported U.S. GAAP Measures:
Q2-13 F&B Operating Profit: $103.7M
Q2-12 F&B Operating Profit: $69.8M
Adjusted EBITDA ($M)
+8
Cost
Synergies
Q2
2013
139
SARs
SG&A/
Other*
+10
+2
-2
Mix &
Price/Cost
Spread
Q2
2012
112
Volume
+9
*
Other includes: Q2 2012 unfavorable Argentina labor settlement and facility
closures, consolidations & start-up costs
Largest
growth
drivers:
Fresh
red
meat
and
equipment sales, particularly in Latin America;
customer acceptance of new products and solutions
Challenges:
European
macro
economy;
Beef
volume in North America and Europe
•
• |
 5
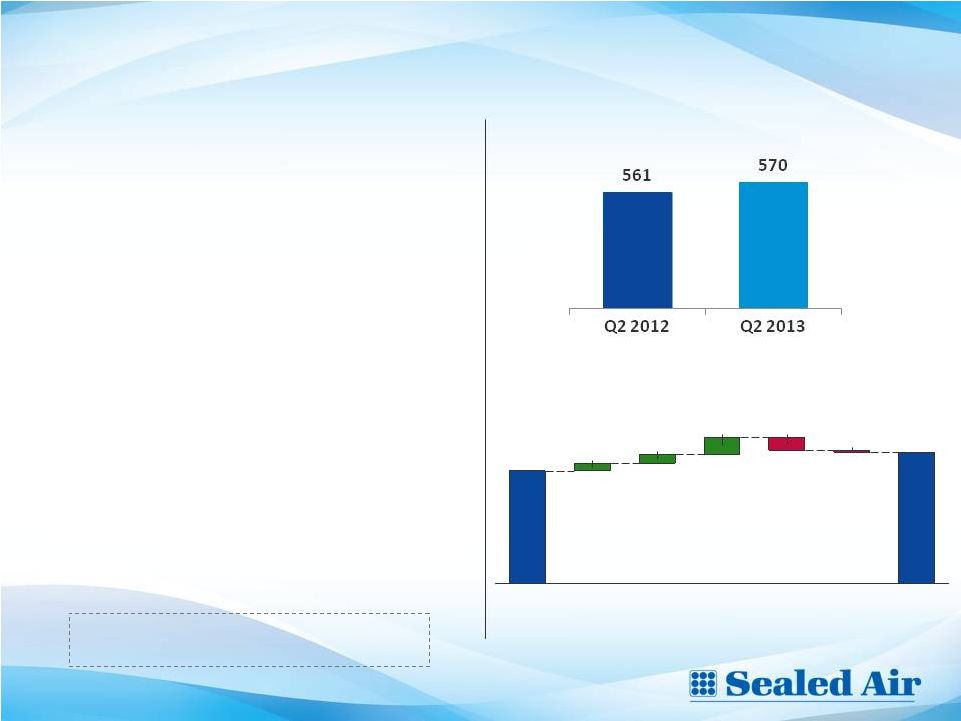
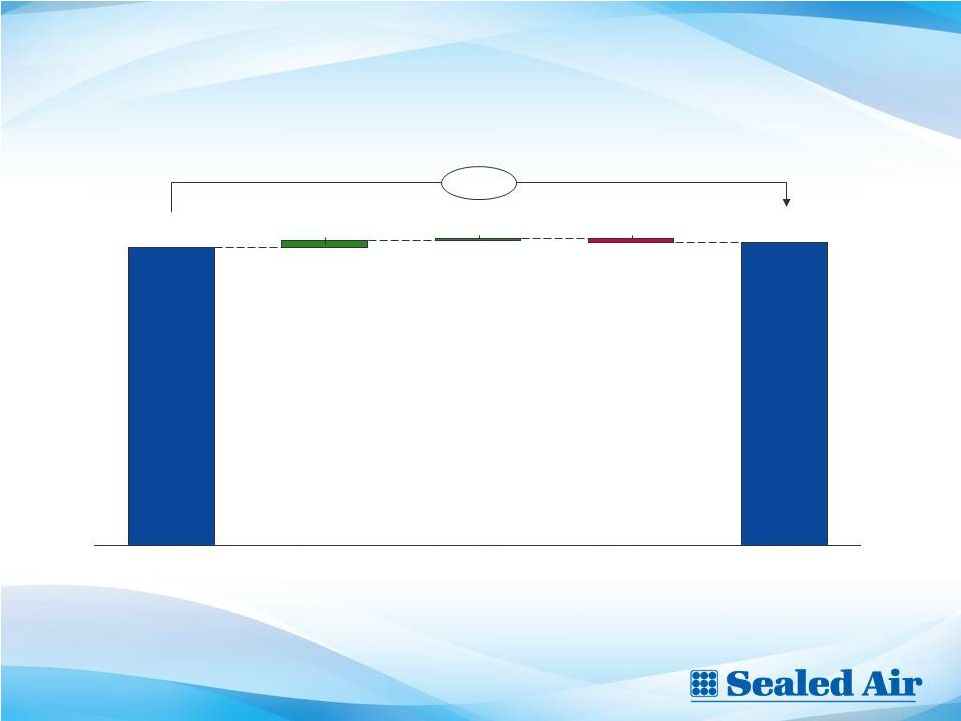
Institutional and Laundry: Achieved Sales and Adj. EBITDA Growth
•
Q2 Net Sales: +1.7%; +3.0% organic growth
•
Volume & Price both increased 1.5%
•
Double-digit organic sales growth in LA & AMAT
•
NA organic sales increased 2.5%
•
Europe organic sales declined 1.2%
•
Q2 Adj. EBITDA Margin: 12.4%
•
Adjusted EBITDA growth of 16.6%
•
Excluding impact of SARs, growth of 31.4%
•
Key drivers: Volume growth, cost containment &
cost synergies
•
Q2 Volume Trends by region vs. PY
•
North America: +0.5%
•
AMAT: +8.3%
•
Europe: -1.7%
•
ANZ: +1.3%
•
Latin America: +7.4%
•
Largest
Growth
Drivers:
New
customer
wins
&
account penetration in LA & AMAT; gaining traction in
U.S. with TASKI®
floorcare machine launch & new
customers wins
•
Challenges:
Exposure
to
European
macro
economy
Reported U.S. GAAP Measures:
Q2-13 I&L Operating Profit: $37.2M
Q2-12 I&L Operating Profit: $20.9M
Net Sales ($M)
Adjusted EBITDA ($M)
-1
SARs
-7
Mix &
Price/Cost
Spread
+5
Volume
+4
+9
Q2
2012
61
Cost
Synergies
Q2
2013
71
SG&A/
Other
Please see Sealed Air’s August 2, 2013 earnings press release for important
information about the use of non- U.S. GAAP financial measures, including
applicable reconciliations to U.S. GAAP financial measures. |
 6
Protective Packaging: Volume Increased, Price/Mix Unfavorable
•
Q2 Net Sales: +0.9%; +1.8% organic change
•
Volume increased 3.8%; Price/mix unfavorable 2.0%
•
NA organic sales increased 2.6%
•
Europe organic sales declined 0.7%
•
Q2 Adjusted EBITDA Margin: 14.2%
•
Adjusted EBITDA declined 2.1%
•
Key drivers: Unfavorable product mix, global economy,
raw material costs
•
Q2 Volume Trends by region v. PY
•
North America: +3.5%
•
AMAT: +11.0%
•
Europe: +2.2%
•
JANZ: +0.7%
•
Latin America: +11.3%
•
Largest
growth
drivers:
E-commerce, retail,
packaging systems
•
Challenges:
Global economic weakness, raw material
volatility
Reported U.S. GAAP Measures:
Q2-13 Protective Packaging Operating Profit: $44.0M
Q2-12 Protective Packaging Operating Profit: $46.7M
Net Sales ($M)
Adjusted EBITDA ($M)
Q2
2013
56
SG&A/
Other
-4
Mix &
Price/Cost
Spread
-4
Volume
+5
+2
Q2
2012
57
Cost
Synergies
Please see Sealed Air’s August 2, 2013 earnings press release for important
information about the use of non- U.S. GAAP financial measures, including
applicable reconciliations to U.S. GAAP financial measures. 391
394
Q2 2012
Q2 2013 |
 7
Q2 Net Sales Bridge
($ in millions)
1,962
Foreign
Exchange
-23
Price/Mix
+15
Volume
+46
1,925
+2.4%
+0.8%
-1.3%
+1.9%
Q2 2013
Net Sales
Q2 2012
Net Sales |
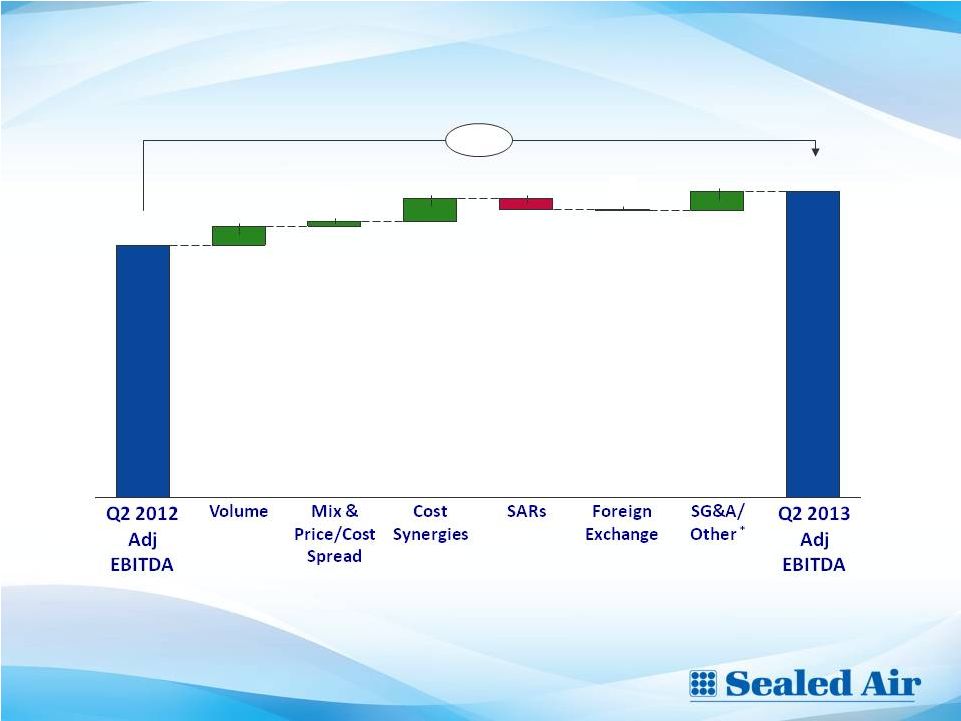 Q2
2013 Adjusted EBITDA Bridge 8
($ millions)
276
+21%
+17
-1
-9
+20
+4
+18
228
*
Other includes: Q2 2012 unfavorable Argentina labor settlement
and facility closures, consolidations & start-up costs
Please see Sealed Air’s August 2, 2013 earnings press release for important
information about the use of non- U.S. GAAP financial measures, including
applicable reconciliations to U.S. GAAP financial measures. |
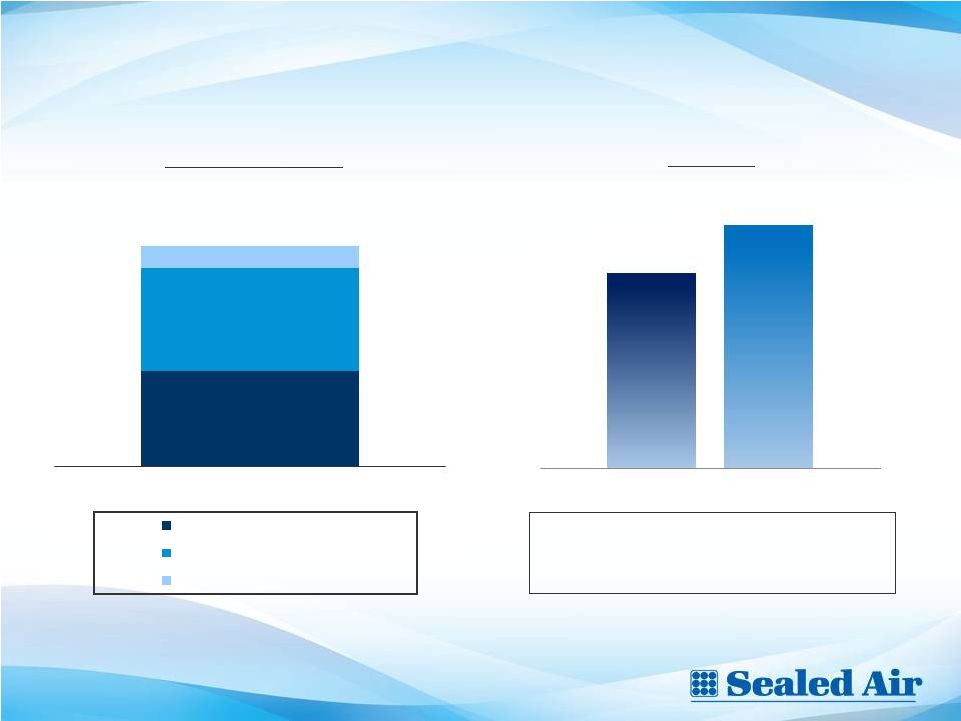
 9
9
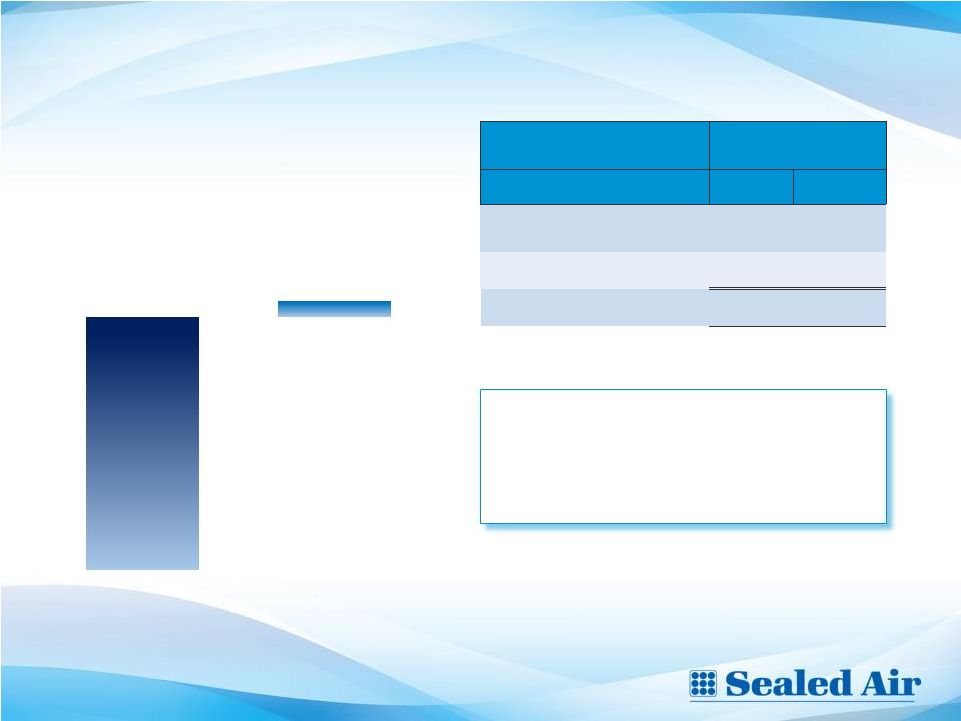
H1 2013 Free Cash Flow Improved $140 million
($ in millions)
Free Cash Flow Performance
Six Months Ended
June 30,
Free Cash Flow
2012
2013
U.S. GAAP Cash Flow from
Operating Activities
*
$ (62)
$ 63
Capital Expenditures
(66)
(51)
Free Cash Flow
$ (128)
$ 12
H1 2012
H1 2013
Please see Sealed Air’s August 2, 2013 earnings press release for important
information about the use of non- U.S. GAAP financial measures, including
applicable reconciliations to U.S. GAAP financial measures. *Six months ended
2012 & 2013, net of restructuring & SARs payments of $63M H1 2013
vs. H1 2012 Improvement Higher
net
earnings
Lower
Capital
Expenditures
•
•
(128)
+12 |
 Outlook for Full Year 2013
Management’s full year outlook includes:
•
•
•
•
–
Includes estimated cash costs of $65 million for earnings quality improvement
program and $70 million for the 2011-2014 Integration and Optimization
Program –
Includes 2013 estimated capital expenditures of $160 million
–
Includes higher SARs payments
–
2012 Free Cash Flow was $280 million and was net of $81 million of Integration and
Optimization
cash
payments,
$125
million
of
capital
expenditures
and
$24
million
of
SARs payments
10
Adjusted EPS guidance excludes the impact of special items. It also excludes the
payment of the W. R. Grace settlement, as the exact timing of the settlement
is unknown. Final payment of the W. R. Grace settlement is expected to be accretive to adjusted EPS by approximately
$0.13 annually following the payment date under the assumption of using a substantial
portion of cash on hand for the payment and ceasing to accrue interest on the
settlement amount. Additionally, guidance excludes any non-operating gains or losses that may be recognized in
2013 due to currency fluctuations in Venezuela.
Please see Sealed Air’s August 2, 2013 earnings press release for important
information about the use of non- U.S. GAAP financial measures, including
applicable reconciliations to U.S. GAAP financial measures. Net Sales
approximately $7.7 billion to $7.9 billion (No Change) Adjusted EBITDA
tracking toward high-end of previously given guidance of approximately
$1.01 billion to $1.03 billion Earnings Per Share tracking toward
high-end of previously guidance of approximately $1.10 to $1.20 per
share Free Cash Flow approximately $275 million to $325 million (No
Change) |
 SEALED AIR CORPORATION
Earnings Conference Call
Second Quarter 2013
Please see Sealed Air’s August 2, 2013 earnings press release for important
information about the use of non-U.S. GAAP financial measures,
including applicable reconciliations to U.S. GAAP financial measures. |
 SEALED AIR CORPORATION
Earnings Conference Call
Second Quarter 2013
Please see Sealed Air’s August 2, 2013 earnings press release for important
information about the use of non-U.S. GAAP financial measures,
including applicable reconciliations to U.S. GAAP financial measures. |
 2Q
2013 Adjusted EPS Calculation 13
Reported U.S. GAAP Measures :
Q2 2013 Operating Income: $168.9M; Net Income $56.3M
(1)
Comprised of $44M of property and equipment depreciation, $32M of amortization of
Intangibles and $7M of share-based compensation
(2)
Contributions to be made in Sealed Air common stock
Please see Sealed Air’s August 2, 2013 earnings press release for important
information about the use of non-U.S. GAAP financial measures,
including applicable reconciliations to U.S. GAAP financial measures. Adjusted
EBITDA $ 276.3
Depreciation and amortization
(1)
(82.6)
Write down of non-strategic assets, including D&A
4.8
Interest expense
(89.7)
Non-cash profit sharing expense
(2)
(10.0)
Adjusted pre-tax earnings
$ 98.8
Core taxes (23.8%)
(23.5)
Adjusted net earnings
$ 75.3
Diluted Shares
213.6
Adjusted EPS
$ 0.35 |
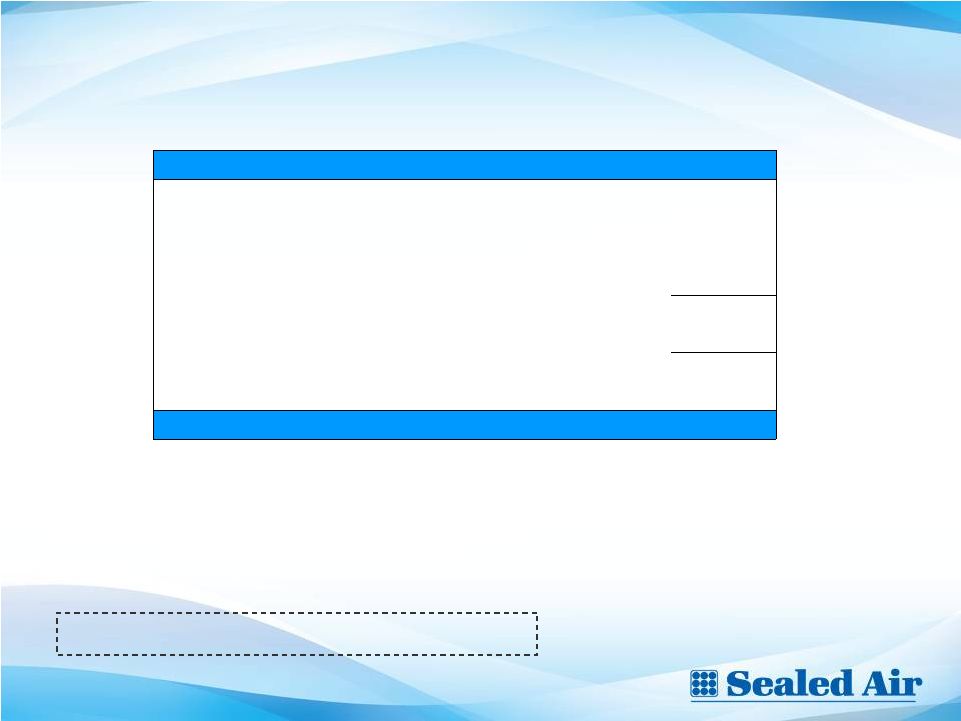
 14
14
Liquidity & Net Debt
($ in millions)
Liquidity
Position
1,546
Net Debt
Higher net debt as a result of:
•
•
•
Please see Sealed Air’s August 2, 2013 earnings press release for important
information about the use of non- U.S. GAAP financial measures, including
applicable reconciliations to U.S. GAAP financial measures. Seasonal
inventory growth Certain annual incentive compensation payments
Financing activities
640
700
206
June 2013
4,779
4,843
Dec 2012
June 2013
Cash & Cash Equivalents
Revolving Credit Facility
A/R Securitization |