Attached files
| file | filename |
|---|---|
| 8-K - 8-K - CARPENTER TECHNOLOGY CORP | a13-17553_28k.htm |
Exhibit 99.1
|
|
Carpenter Technology Corporation ENGINEERED MATERIALS FOR A CHANGING WORLD Unless otherwise noted, the logo and registered trademarks are property of CRS Holdings , Inc . a subsidiary of Carpenter Technology Corporation. © 2013 CRS Holdings, Inc. All rights reserved 4th Quarter and Fiscal Year 2013 Earnings Call July 30, 2013 |
|
|
© 2013 CRS Holdings, Inc. All rights reserved Cautionary Statement 2 Forward-Looking Statements This presentation contains “forward-looking statements” within the meaning of the Private Securities Litigation Reform Act of 1995 and Section 27A of the Securities Act. These statements, which represent the Company’s expectations or beliefs concerning various future events, include statements concerning future revenues, projections, targets, synergies, strategy, earnings, and liquidity associated with continued growth in various market segments, cost reductions expected from various initiatives, our acquisitions and other events. These forward-looking statements are subject to risks and uncertainties that could cause actual results to differ from those projected, anticipated or implied. Any of these risks could have adverse and/or fluctuating effects on the Company’s results of operations. For additional information about factors that could cause actual results to differ materially from those described in the forward-looking statements, please see the Company’s SEC filings including its annual report on Form 10-K for the year ended June 30, 2012, Forms 10-Q for the quarters ended September 30, 2012, December 31, 2012, and March 31, 2013 and the exhibits attached to those filings. All subsequent forward-looking statements attributable to the Company or any person acting on its behalf are expressly qualified in their entirety by the cautionary statements contained or referred to in this section. The Company is not under any obligation to, and expressly disclaims any obligation to, update or alter any forward-looking statements whether as a result of such changes, new information, subsequent events or otherwise. Non-GAAP Financial Measures Some of the information included in this presentation is derived from Carpenter’s consolidated financial information but is not presented in Carpenter’s financial statements prepared in accordance with U.S. generally accepted accounting principles (GAAP). Certain of these data are considered “non-GAAP financial measures” under SEC rules. These non-GAAP financial measures supplement our GAAP disclosures and should not be considered an alternative to the GAAP measure. Reconciliations to the most directly comparable GAAP financial measures and management’s rationale for the use of the non-GAAP financial measures can be found in the Appendix to this presentation. |

|
|
© 2013 CRS Holdings, Inc. All rights reserved 4th Quarter & Fiscal Year Summary Bill Wulfsohn President and CEO 3 |

|
|
© 2013 CRS Holdings, Inc. All rights reserved • Focused strategy with disciplined execution in challenging environment . Operating margins neared 15% for quarter and year . Increased margin per pound at SAO for year • Growth investments made in PEP businesses . Increased titanium wire capacity . Expanded footprint at Amega West • Operational execution . Integrated Latrobe above deal economics . Fully offset SAO variable production inflation on a cost per ton basis for fourth consecutive year . Signed several strategic contracts with key customers . Athens facility continued to be on time and under budget . Salaried workforce reduction 4th Quarter and FY13 Summary 4 |

|
|
© 2013 CRS Holdings, Inc. All rights reserved • Strong financial performance in challenging environment . EPS up 12% on an adjusted basis versus Q3 . Record full year adjusted EBITDA of $406 million up 21% versus year ago . Latrobe contributed $87 million . Legacy CRS up 1% including Athens related start-up expenses • Enhanced liquidity . Free cash flow of $61 million in Q4 . Cash-on hand of $258 million . Expanded revolving credit facility capacity from $350 million to $500 million • Aligned and strengthened management team 4th Quarter and FY13 Summary 5 |

|
|
© 2013 CRS Holdings, Inc. All rights reserved Financial Update Tony Thene Senior Vice President and Chief Financial Officer 6 |

|
|
© 2013 CRS Holdings, Inc. All rights reserved • Q4 Net income of $40.9 million or $0.77 per share • Sales, excluding surcharge, of $496.6 million – Aerospace and energy comprised 62% of sales • Operating margins (ex pension EID) improved sequentially by 190 basis points due to increased volumes and manufacturing efficiencies • Cash Flow from Operations of $184 million and Free Cash Flow of $61 million – Achieved $27 million inventory reduction • CapEx of $113 million, largely related to Athens • $750 million of total liquidity – Increased revolving credit facility capacity from $350 to $500 million – Cash-on hand of $258 million 4th Quarter FY13 Financial Overview 7 |

|
|
© 2013 CRS Holdings, Inc. All rights reserved Income Statement Summary Achieved solid gross and operating margin expansion 8 * Detailed s chedule included in Non-GAAP Schedules in Appendi x $ Millions, except per-share amounts Q4-12 Q3-13 Q4-13 Sequential Change Net Sales 643.7 581.4 611.8 30.4 Sales ex. Surcharge * 506.7 471.2 496.6 25.4 Gross Profit 120.6 101.0 120.5 19.5 % of Sales ex. Surcharge 23.8% 21.4% 24.3% 2.9% pts. Selling, General and Administrative Expenses 54.1 48.0 55.1 7.1 % of Sales ex. Surcharge 10.7% 10.2% 11.1% 0.9% pts. Operating Income ex. Pension EID * 70.8 61.0 73.4 12.4 % of Sales ex. Surcharge 14.0% 12.9% 14.8% 1.9% pts. Effective Tax Rate 33.9% 33.1% 30.7% -2.4% Net Income 40.8 32.9 40.9 8.0 Diluted Earnings Per Share $0.77 $0.62 $0.77 $0.15 Adjusted Diluted Earnings per Share * $0.88 $0.69 $0.77 $0.08 |

|
|
© 2013 CRS Holdings, Inc. All rights reserved Restructuring and Other Special Items 9 $ Millions, except per-share amounts Q4-13 Income Statement Classification Net Income 40.9 Diluted Earnings Per Share $0.77 • Restructuring-related 0.04 CGS / SG&A Expense • Income tax impact of the change in assumption regarding discretionary pension contributions (0.04) Income Tax Expense Special Items 0.00 Diluted Earnings per Share ex. Special Items $0.77 Net Income ex. Special Items 40.7 Special items net to zero impact |

|
|
© 2013 CRS Holdings, Inc. All rights reserved $ Millions Q1 Q2 Q3 Q4 FY13 Net Income + Non-cash Items 82 76 115 58 331 Inventory (79) (10) 47 27 (15) Working capital / other 7 (17) (47) 101 44 Total Net Working Capital / Other (72) (27) 0 128 29 Pension Plan Contributions - Required (48) (10) (10) (2) (70) Net Cash from Operating Activities (38) 39 105 184 290 Before Discretionary Pension Plan Contributions Pension Plan Contribution - Discretionary 0 0 (75) 0 (75) Net Cash from Operating Activities (38) 39 30 184 215 Purchases of property, equipment and software (56) (81) (87) (113) (337) Dividends paid (10) (10) (9) (9) (38) Other 1 1 0 (1) 1 Free Cash Flow (103) (51) (66) 61 (159) Free Cash Flow ex. discretionary pension contribution (103) (51) 9 61 (84) 10 Free Cash Flow Summary Solid progress in working capital management contributed to positive Q4 FCF |

|
|
© 2013 CRS Holdings, Inc. All rights reserved Business Update Bill Wulfsohn President and CEO 11 |

|
|
© 2013 CRS Holdings, Inc. All rights reserved Aerospace & Defense 227.9 49% 4% 6% • Commercial aerospace build rates remain s trong; outlook positive • Shorter lead times allowing dis tributors to delay purchases and benefi t from falling Ni prices • Demand growth for proprietary materials for structural applications Energy 81.5 18% 0% 15% • Growth in ul tra-premium materials for Oil & Gas completions due primarily to share gain • Drilling alloys impacted by des tocking and low growth in North American rig count • Gas turbine orders remain sluggish Medical 26.4 6% -23% 4% • Supply chain Inventory adjustments and industry cos t reduction efforts impacted Q4 • Expect modest resumption of demand as OEM inventories reach s tructurally low levels Transportation 27.9 6% -10% -2% • Demand in NA auto offset by continued weakness in Europe and heavy duty equipment • Continued demand growth for materials for new fuel delivery systems offset by s ofter demand for valve alloys Industrial & Consumer 97.3 21% -5% 0% • Strong demand for materials used in sporting good and offshore drilling valves and fi ttings applications • Soft demand for industrial valve material and materials sold through dis tribution vs . prior period 12 End Market Highlights Q413 Net Sales ex. Sur ($M)* vs. Q412 vs. Q313 Comments *Excludes $35.6M of Distribution sales |

|
|
© 2013 CRS Holdings, Inc. All rights reserved Business Update Andy Ziolkowski S.V.P. – Commercial, Specialty Alloys Operations 13 |

|
|
© 2013 CRS Holdings, Inc. All rights reserved Q4 Operating Results Q4 Business Highlights Q1-14 Outlook • Manufacturing gross margin expansion from operational execution . Better melt yields . Improved scrap management . Enhanced focus on manufacturing costs and OH • Better mix management within manufacturing • Additional cost reductions from integration efforts • Latrobe Manufacturing to be reported in SAO Segment for FY14, while Latrobe Distribution to be reported in PEP Segment in FY14 Latrobe Segment Summary 14 Latrobe Segment Q4-13 Results and Q1-14 Outlook Manufacturing fully integrated into SAO, with earnings and synergies above plan Q4-12 Q3-13 Q4-13 vs LY vs Q3 Pounds ('000) 17,124 17,946 17,614 490 (332) Sales ex. Surcharge ($M) 111.0 114.1 112.2 1.2 (1.9) Op Inc ex. EID ($M) 7.6 12.3 17.2 9.6 4.9 % of Sales ex. Surcharge 6.8% 10.8% 15.3% 8.5% 4.5% |

|
|
© 2013 CRS Holdings, Inc. All rights reserved Aerospace demand remains solid, while other economically-sensitive markets remained challenged Q4 Operating Results Q4 Business Highlights Q1-14 Outlook • Solid operational execution . Sequential margin expansion . Continued focus on reducing costs per ton . Decline in higher-value material sold to transportation and industrial markets • Growth in Aerospace structural and engine applications • Market penetration in Oil and Gas completions • Deferrals down versus Q3 • Order inquiry activity and backlog improving • Seasonal volume decline • Planned 3 to 4 week major preventative maintenance outage • Expect continuing supply chain adjustments • Economically sensitive markets still challenging SAO Segment Summary 15 SAO Segment Q4-13 Results and Q1-14 Outlook Q4-12 Q3-13 Q4-13 vs LY vs Q3 Pounds ('000) 60,720 53,202 57,260 (3,460) 4,058 Sales ex. Surcharge ($M) 324.5 297.6 323.0 (1.5) 25.4 Op Inc ex. EID ($M) 65.5 48.8 66.0 0.5 17.2 % of Sales ex. Surcharge 20.2% 16.4% 20.4% 0.2% 4.0% |

|
|
© 2013 CRS Holdings, Inc. All rights reserved Business Update Bill Wulfsohn President and CEO 16 |

|
|
© 2013 CRS Holdings, Inc. All rights reserved Q4 Operating Results Q4 Business Highlights Q1-14 Outlook • Sales up 7% sequentially but down 11% y-o-y - Strong demand for ti aero fastener material - Tool steel and distribution remained soft • Margins negatively impact by - Facility start-up costs and new product launches - Lower production rates and a weaker mix • Accelerating operational improvement plans • Solid Aerospace titanium fastener demand • Powder sales expected to remain weak • Equipment sold into the Oil & Gas market to remain under pressure due to lower capex by service companies PEP Segment Summary 17 Action taken to improve operating performance of PEP PEP Segment Q4-13 Results and Q1-14 Outlook Q4-12 Q3-13 Q4-13 vs LY vs Q3 Pounds ('000) 3,840 3,338 3,502 (338) 164 Sales ex. Surcharge ($M) 107.1 89.2 95.8 (11.3) 6.6 Op Inc ex. EID ($M) 11.3 10.0 6.1 (5.2) (3.9) % of Sales ex. Surcharge 10.6% 11.2% 6.4% -4.2% -4.8% |

|
|
© 2013 CRS Holdings, Inc. All rights reserved Growth Enablers 18 Driving Innovation & Responding to Increased Customer Demand Athens Facility Forge Finishing Capacity • On time and under budget • Data Center and Met/Chem Laboratory both on-line for start of qualifications • Radial press foundation completed ontime and equipment being installed • First four VAR furnaces being installed • FY14 fixed OH of approximately $9.5M versus $5.5M in FY13, excluding depreciation • Budgeted start-up costs of $8 – 10M in FY14 • $24M forge finishing expansion in Reading operational for full quarter • Overall 30% increase in finishing capacity for straightening, cutting, polishing and ultra sonic testing of large diameter bars • Supports continued growth in demand for Aerospace and Energy markets |

|
|
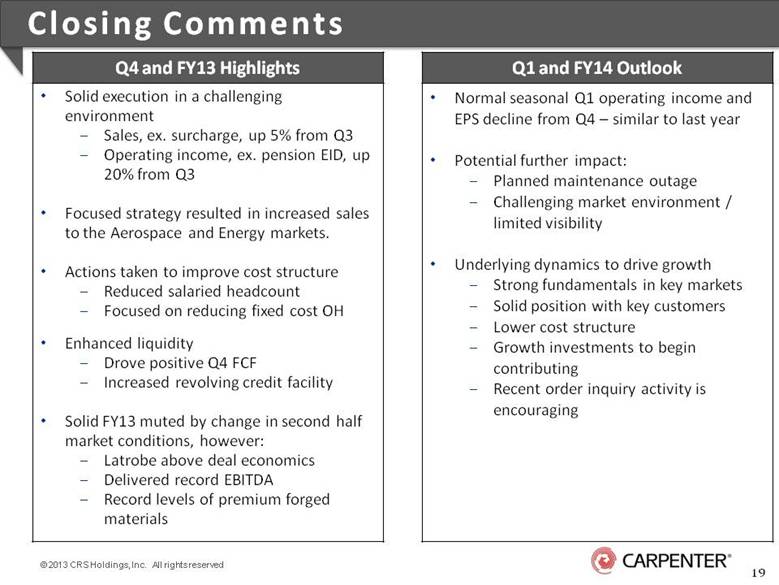
© 2013 CRS Holdings, Inc. All rights reserved Q4 and FY13 Highlights Q1 and FY14 Outlook • Solid execution in a challenging environment . Sales, ex. surcharge, up 5% from Q3 . Operating income, ex. pension EID, up 20% from Q3 • Focused strategy resulted in increased sales to the Aerospace and Energy markets. • Actions taken to improve cost structure . Reduced salaried headcount . Focused on reducing fixed cost OH • Enhanced liquidity . Drove positive Q4 FCF . Increased revolving credit facility • Solid FY13 muted by change in second half market conditions, however: . Latrobe above deal economics . Delivered record EBITDA . Record levels of premium forged materials • Normal seasonal Q1 operating income and EPS decline from Q4 – similar to last year • Potential further impact: . Planned maintenance outage . Challenging market environment / limited visibility • Underlying dynamics to drive growth . Strong fundamentals in key markets . Solid position with key customers . Lower cost structure . Growth investments to begin contributing . Recent order inquiry activity is encouraging Closing Comments 19 |
|
|
© 2013 CRS Holdings, Inc. All rights reserved Appendix of Non-GAAP Schedules 20 |

|
|
© 2013 CRS Holdings, Inc. All rights reserved 21 Preliminary Non-GAAP Unaudited Schedules (in millions) OPERATING MARGIN EXCLUDING SURCHARGE AND Three Months Ended Year Ended PENSION EARNINGS, INTEREST AND DEFERRALS June 30, March 31, June 30, AND SPECIAL ITEMS 2013 2012 2013 2013 2012 Net sales $ 611.8 $ 643.7 $ 581.4 $ 2,271.7 $ 2,028.7 Less: surcharge revenue 115.2 137.0 110.2 432.4 459.1 Consolidated net sales excluding surcharge $ 496.6 $ 506.7 $ 471.2 $ 1,839.3 $ 1,569.6 Operating income $ 65.4 $ 66.5 $ 53.0 $ 232.7 $ 210.1 Pension earnings, interest & deferrals 8.0 4.3 8.0 31.9 15.3 Operating income excluding pension earnings, interest and deferrals $ 73.4 $ 70.8 $ 61.0 $ 264.6 $ 225.4 Special Items Restructuring related costs 3.3 - 2.0 5.5 - Inventory reduction initiative costs - - 0.9 2.5 - Latrobe acquisition related costs (from transaction) - - - - 11.7 76.7 70.8 63.9 272.6 237.1 (A) Latrobe acquisition inventory fair value cost adjustments - 8.7 - - 11.6 Operating income excluding pension earnings, interest and deferrals and special items $ 76.7 $ 79.5 $ 63.9 $ 272.6 $ 248.7 Operating margin excluding surcharge and pension earnings, interest and deferrals 14.8% 14.0% 12.9% 14.4% 14.4% Management believes that removing the impacts of raw material surcharges from operating margin provides a more consistent basis for comparing results of operations from period to period. Management believes that excluding the impact of pension earnings, interest and deferrals, which may be volatile due to changes in the financial markets, is helpful in analyzing the true operating performance of the Company. Management believes that removing the impacts of costs associated with the special items (i.) restructuring related costs, (ii.) an inventory reduction initiative costs aimed at identifying opportunities to reduce inventory levels and improve inventory turnover across the mill operations (iii.) Latrobe acquisition related costs (from transaction) (vi.) Latrobe acquisition inventory fair value cost adjustments are helpful in analyzing the operating performance of the Company, as these costs are expected to be nonrecurring in nature and may result in significant fluctuations in operating results from period to period. (A) For purposes of providing earnings and guidance for fiscal year 2013, the Company excluded $11.6 of Latrobe acquisition inventory fair value adjustments from adjusted operating income for fiscal year 2012. |

|
|
© 2013 CRS Holdings, Inc. All rights reserved 22 Preliminary Non-GAAP Unaudited Schedules (in millions, except per share data) Three Months Ended June 30, March 31, IMPACT OF SPECIAL ITEMS 2013 2012 2013 Restructuring related costs $ 3.3 $ - $ - Inventory fair value cost adjustment - 8.7 - Inventory reduction initiative costs - - 0.9 Restructuring costs from manufacturing footprint optimization activities - - 2.0 Additional interest expense - - 1.1 Operating income impact $ 3.3 $ 8.7 $ 4.0 Income tax benefit from special items (1.2) (3.0) (1.4) Income tax impact regarding discretionary pension contributions (2.3) - 2.9 Income tax impact of R&D tax credit extension - - (1.7) Net income impact $ (0.2) $ 5.7 $ 3.8 Impact per diluted share $ - $ 0.11 $ 0.07 Weighted average shares outstanding 53.5 53.3 53.5 Management believes that removing the impacts of costs associated with special items is helpful in analyzing the operating performance of the Company. |

|
|
© 2013 CRS Holdings, Inc. All rights reserved 23 Preliminary Non-GAAP Unaudited Schedules (in millions) Three Months Ended Year Ended June 30, June 30, ADJUSTED EARNINGS BEFORE INTEREST, TAXES, 2013 2012 2013 2012 DEPRECIATION AND AMORTIZATION (EBITDA) Net income $ 40.9 $ 41.0 $ 146.5 $ 121.6 Interest expense 6.3 5.4 21.0 23.8 Income tax expense 18.1 21.0 70.3 67.0 Depreciation and amortization 27.0 25.4 104.1 83.8 Other (expense) income, net 0.1 (0.9) (5.1) (2.3) EBITDA $ 92.4 $ 91.9 $ 336.8 $ 293.9 Net pension expense 17.1 11.8 68.8 42.1 Adjusted EBITDA $ 109.5 $ 103.7 $ 405.6 $ 336.0 Management believes that earnings before interest, taxes, depreciation and amortization adjusted to exclude net pension expense is helpful in analyzing the operating performance of the Company. |

|
|
© 2013 CRS Holdings, Inc. All rights reserved 24 Preliminary Non-GAAP Unaudited Schedules Three Months Ended Year Ended (in millions) June 30, June 30, FREE CASH FLOW 2013 2012 2013 2012 Net cash provided from operating activities $ 183.5 $ 112.4 $ 215.2 $ 160.3 Purchases of property, equipment and software (113.4) (64.6) (336.9) (171.9) Proceeds from disposals of property and equipment 0.8 0.6 1.2 1.2 Capital contributions to equity method investment - (1.8) - (1.8) Purchase of subsidiary shares from noncontrolling interest - - (8.4) - Proceeds from sale of equity method investment - - 7.9 - Dividends paid (9.6) (9.5) (38.3) (33.7) Acquisition of business, net of cash acquired - - - (12.9) Free cash flow $ 61.3 $ 37.1 $ (159.3) $ (58.8) Management believes that the free cash flow measure provides useful information to investors regarding our financial condition because it is a measure of cash generated which management evaluates for alternative uses. |

|
|
© 2013 CRS Holdings, Inc. All rights reserved 25 Preliminary Non-GAAP Unaudited Schedules Three Months Ended Year Ended June 30, June 30, NET PENSION EXPENSE PER DILUTED SHARE 2013 2012 2013 2012 Pension plans expense 14.8 $ 10.1 $ 59.5 $ 38.5 $ Other postretirement benefits expense 2.3 1.7 9.3 3.6 Net pension expense 17.1 11.8 68.8 42.1 Income tax benefit (6.0) (4.4) (24.1) (15.9) Net pension expense, net of tax 11.1 $ 7.4 $ 44.7 $ 26.2 $ Net pension expense per diluted share 0.21 $ 0.14 $ 0.84 $ 0.55 $ Weighted average diluted common shares 53.5 53.3 53.4 47.8 Management believes that net pension expense per diluted share is helpful in analyzing the operating performance of the Company, as net pension expense may be volatile due to changes in the financial markets, which may result in significant fluctuations in operating results from period to period. (in millions, except per share data) |
