Attached files
| file | filename |
|---|---|
| 8-K - FORM 8-K - TMS International Corp. | d577833d8k.htm |
| EX-99.1 - EX-99.1 - TMS International Corp. | d577833dex991.htm |
 Second Quarter 2013
Earnings Call and Webcast
August 1, 2013
Exhibit 99.2 |
 This
presentation includes forward-looking statements within the meaning of Section 27A of the Securities
Act
of
1933,
(the
“Exchange
Act”),
as
amended,
and
Section
21E
of
the
Securities
Exchange
Act
of
1934,
as
amended, with respect to our financial condition, results of operations and
business and our expectations or beliefs concerning future events. Such
forward-looking statements include the discussions of our business
strategies, estimates of future global steel production, trends toward outsourcing
and other market metrics and our expectations concerning future operations,
margins, profitability, liquidity and capital resources, among others.
Although we believe that such forward-looking statements are reasonable, there can be no assurance
that any forward-looking statements will prove to be correct. Such
forward-looking statements involve known and unknown risks,
uncertainties and other factors that may cause our actual results, performance or
achievements
to
be
materially
different
from
any
future
results,
performance
or
achievements
expressed
or
implied by such forward-looking statements.
Certain areas of this presentation depict Revenue After Raw Materials Costs, EBITDA
and Discretionary Cash Flow, which are non-GAAP
financial measures. Revenue After Raw Materials Costs, EBITDA and
Discretionary Cash Flow are not and should not be considered alternatives to
revenues or net income or any other financial measure under U.S. GAAP. We
reconcile these measurements to GAAP in certain reports we file with the
S.E.C. pursuant to the Exchange Act, including current reports on Form 8-K that contain our
earnings releases and our quarterly and annual reports on forms 10-Q and
10-K. When
we
use
the
term
“North
America
”
in
this
presentation,
we
are
referring
to
the
United
States
and
Canada;
when
we
use
the
term
“International,”
we
are
referring
to
countries
other
than
the
United
States
and
Canada;
when
we
use
the
term
“Latin
America,
”
we
are
referring
to
Mexico,
Central
America,
South
America
and the Caribbean, including Trinidad & Tobago.
Safe Harbor Provision
1 |
 REVENUE AFTER RAW MATERIALS COSTS ($MM)
ADJUSTED EBITDA ($MM)
Second Quarter 2013 Results
REVENUE AFTER RAW MATERIALS COSTS ($MM)
ADJUSTED EBITDA ($MM)
2
153.6
153.1
37.8
36.1
155.8
153.1
38.3
36.1
2Q 2012
2Q 2013
2Q 2013
2Q 2012
1Q 2013
1Q 2013
2Q 2013
2Q 2013 |
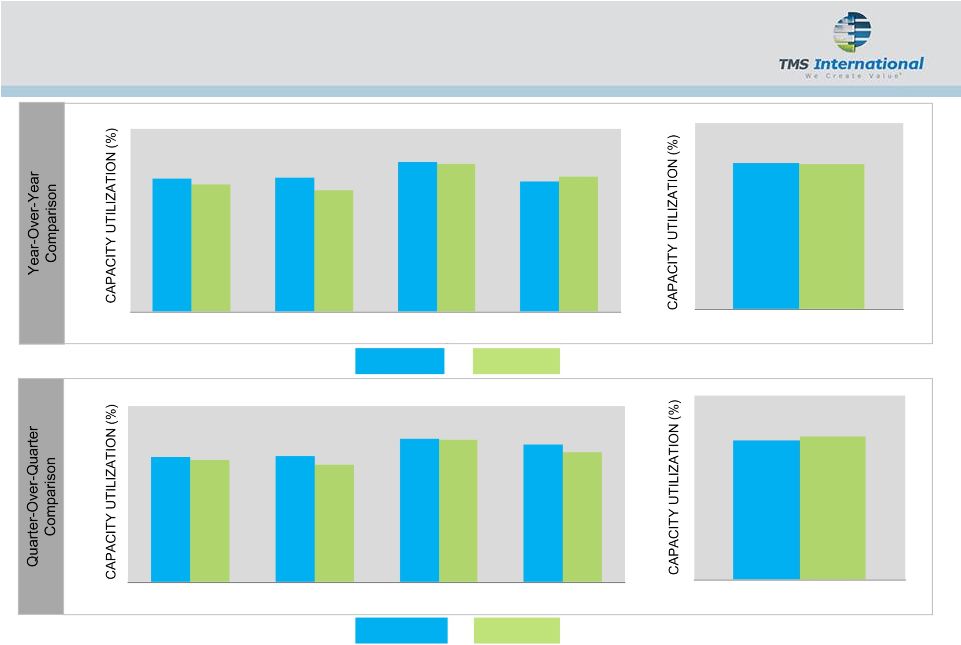 Operating Environment Summary
2Q 2013
2Q 2012
TMS CUSTOMERS BY REGION ¹
TMS CUSTOMERS BY REGION ¹
1Q 2013
2Q 2013
²
²
(1)
Capacity utilization data excludes two greenfield mills (one in North America and
one in Latin America) that are currently ramping up production. (2)
North America capacity utilization decreased during 2Q2013 due to temporary
production outages at three sites. 3
75.7
77.9
77.9
78.6
81.0
86.1
88.8
89.5
73.2
78.5
76.4
78.3
80.1
76.4
80.7
73.2
89.9
88.8
78.0
81.0
TMS Global
North America
Europe
Latin America
U.S. Industry
U.S. Industry
TMS Global
North America
Europe
Latin America |
 MSG
Operational Highlights 4
North American same-site results decreased due to three temporary
outages and a non-recurring arbitration award received in 2Q 2012
Increased production year-over-year at customer sites in Latin
America, South Africa and UAE
New contracts continue to perform well
Increased Mexican market penetration with expansion of services at
an existing customer site
New stainless steel recovery system being installed at customer’s
facility in Pennsylvania
Continued contract renewal rate momentum YTD 2013, a testament
to our ongoing value proposition for our customers |
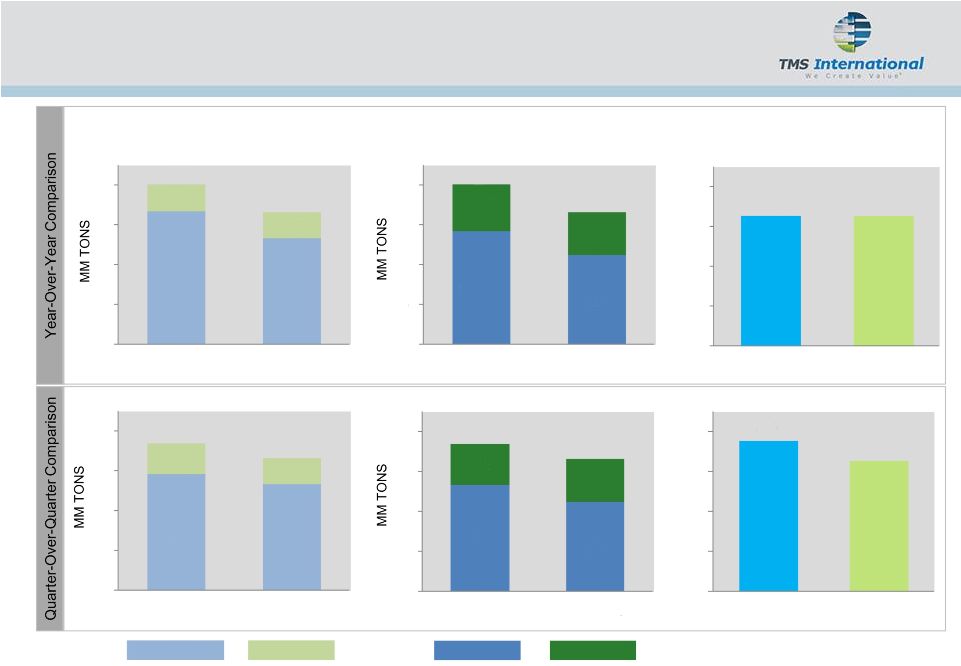 5
RMOG Operational Highlights
VOLUME BY CHANNEL
4.0
NORTH AMERICA
INTERNATIONAL
AGENCY
NON-AGENCY
VOLUME BY GEOGRAPHY
3.3
4.0
3.3
3.7
3.7
3.3
3.3
REVENUE AFTER RAW
MATERIALS COSTS ($MM)
16.4
16.4
18.8
16.4
4
3
2
1
0
4
3
2
1
0
4
3
2
1
0
4
3
2
1
0
2Q 2012
2Q 2013
2Q 2012
2Q 2013
2Q 2012
2Q 2013
1Q 2013
2Q 2013
1Q 2013
2Q 2013
1Q 2013
2Q 2013
$20
$15
$10
$5
$0
$20
$15
$10
$5
$0
0.7
0.7
0.7
3.3
2.7
2.7
1.1
1.2
2.9
2.2
2.2
2.7
1.0
1.1
0.8
2.9 |
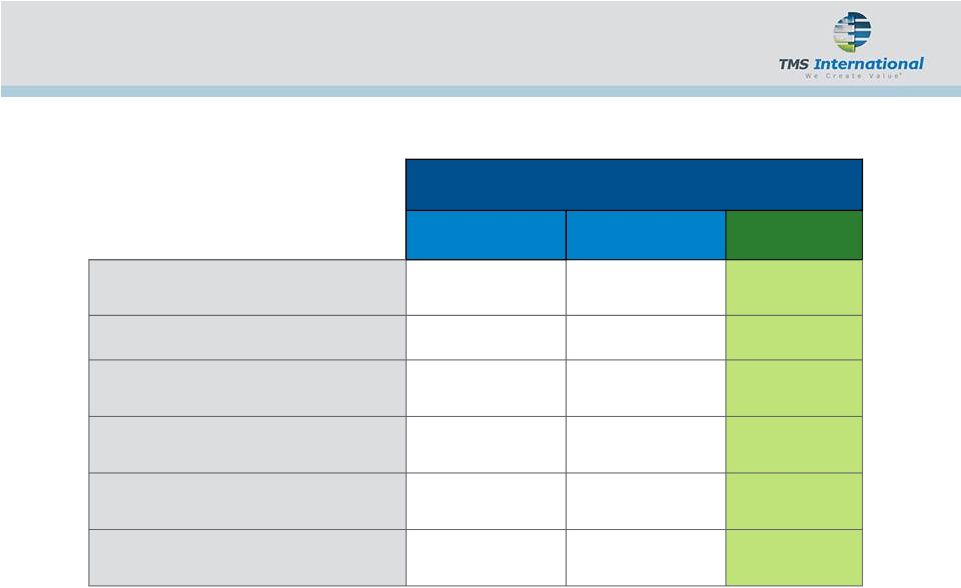 Second Quarter
($MM)
2013
2012
% Change
Revenue After Raw Materials Costs
$153.1
$153.6
(0.3)%
Adjusted EBITDA
$36.1
$37.8
(4.7)%
Discretionary
Cash
Flow
1
$25.7
$28.6
(10.3)%
Growth Capital
$5.0
$12.6
Net Debt
$278.8
$283.5
Net Leverage Ratio
1.9x
2.0x
(1) Adjusted EBITDA less Maintenance Capital Expenditures.
Second Quarter Financial Highlights
6 |
 Concluding Remarks
7
2013 Adjusted EBITDA Guidance of $150-$155 million
Challenging quarter due to temporary site outages in North America
and lower volumes in brokerage business
We and our customers are optimistic for improvement in production
volumes in second half of 2013
New contracts continue to perform well
Continued focus on cost discipline and cash flow generation
Pipeline of new projects remains strong and pleased with expansion
of business in Mexico |
 |