Attached files
| file | filename |
|---|---|
| 8-K - 8-K - ROSETTA STONE INC | a13-17097_18k.htm |
| EX-99.1 - EX-99.1 - ROSETTA STONE INC | a13-17097_1ex99d1.htm |
Exhibit 99.2
|
|
Acquisition of Lexia Learning Investor Presentation July 25, 2013 |

|
|
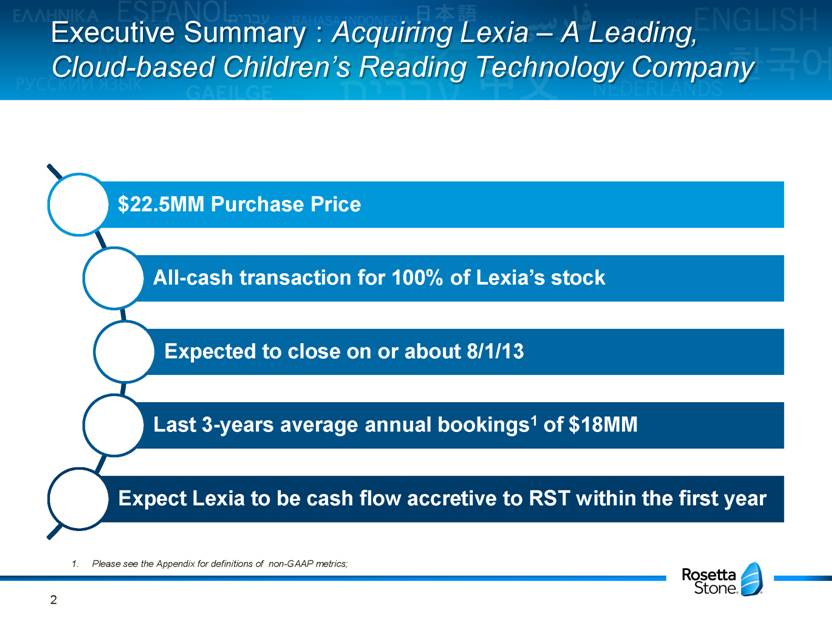
Executive Summary : Acquiring Lexia – A Leading, Cloud-based Children’s Reading Technology Company Please see the Appendix for definitions of non-GAAP metrics; 2 |
|
|
Deal Rationale: Lexia Takes Rosetta Stone into Children’s Reading - A Natural Adjacency Beyond Language 3 |

|
|
Lexia Profile: Established, Respected Leader in K-12 Reading Market 4 Lexia Learning Systems, Inc. Based in Concord, MA ~30 Years of experience Founded in 1984 60+ employees Technology-based, individually adaptable reading instruction Core and remedial solutions Well-known for efficacy Used by over 14,000 schools (~18% penetration) >1MM students online Broad distribution and High Penetration of Schools Please see the Appendix for definitions of non-GAAP metrics; Operating EBITDA is defined as EBITDA plus the change in deferred revenue and the company believes that this is a good proxy for cash flow generation ($MM) 2010 2011 2012 2013E % Change '13/'12 Bookings $ 18 $ 20 $ 16 $ 19 19% Operating EBITDA2 $ 2 $ (1) $ (3) $ (1) 326% % Margin 9% -4% -21% -4% 1700 bps Revenue $ 8 $ 12 $ 15 $ 17 17% EBITDA $ (8) $ (9) $ (4) $ (2) 104% % Margin -94% -73% -29% -12% 1700 bps |

|
|
Product Overview |

|
|
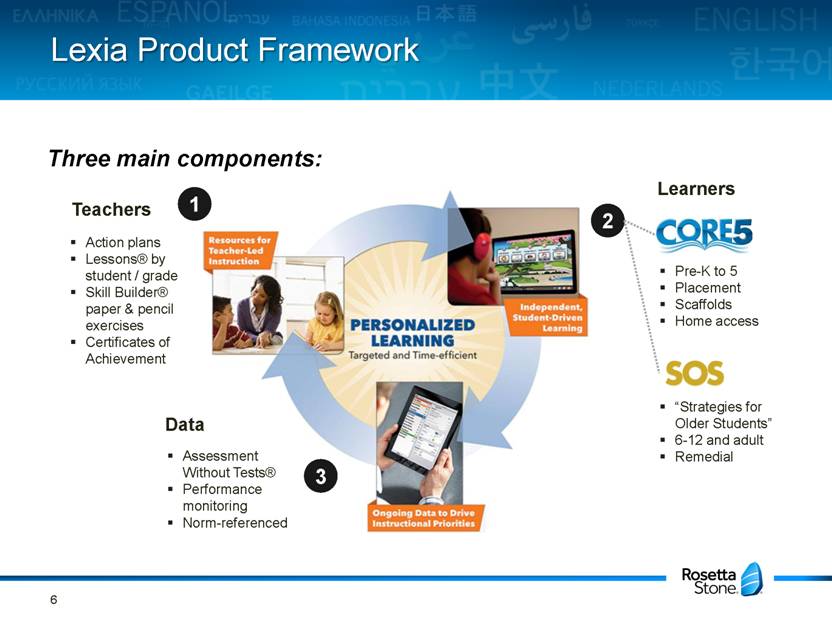
Lexia Product Framework 6 Pre-K to 5 Placement Scaffolds Home access Three main components: 1 2 3 “Strategies for Older Students” 6-12 and adult Remedial Action plans Lessons® by student / grade Skill Builder® paper & pencil exercises Certificates of Achievement Teachers Learners Data Assessment Without Tests® Performance monitoring Norm-referenced |
|
|
Core5: A Differentiated and Timely Product; Most Robust Product on the Market Aligned to Common Core of State Standards Product designed for the Common Core and correlated to other common standards Completely re-built product launched July 1, 2013 Shifting from remedial use and focus to general student population (grade focus is PreK-5) Foundational program for reading classes Embedded Assessment Without Testing® Saves teachers time Data-driven approach enables predictive capability - Based on 2 years of normative results Robust back-end reporting for Administrators & Teachers Mobile (iPad and iPhone) access to reports Rigorously researched and evaluated Outcomes research published in five peer-reviewed journal 7 |

|
|
U.S. K-12 Reading Market |

|
|
U.S. K-12 Reading & Literacy Market 9 1) Source: “The Complete K-12 Report®: 2013” Education Market Research, Company estimates U.S. Digital Reading Market Estimate: $500MM-700MM Reading spend includes: Learn-to-read (all students) Assessment Remedial (response to intervention) Literacy Practice and fluency ELL / ESL 28-40% of Digital spent on Reading Industry characteristics: Multiple segments and grade ranges Fragmented / many offerings Mix of publishers and EduTech |

|
|
Financials and Guidance |

|
|
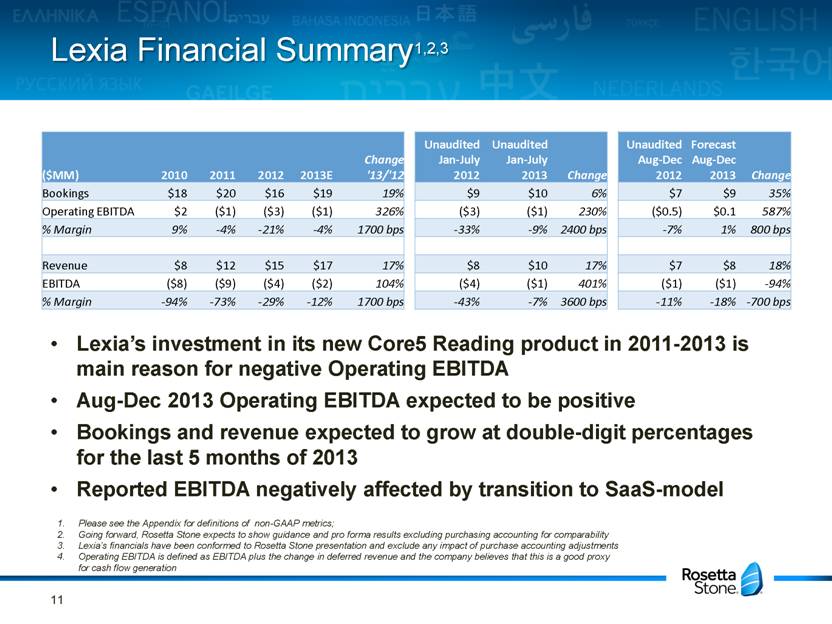
Lexia Financial Summary1,2,3 Lexia’s investment in its new Core5 Reading product in 2011-2013 is main reason for negative Operating EBITDA Aug-Dec 2013 Operating EBITDA expected to be positive Bookings and revenue expected to grow at double-digit percentages for the last 5 months of 2013 Reported EBITDA negatively affected by transition to SaaS-model Please see the Appendix for definitions of non-GAAP metrics; Going forward, Rosetta Stone expects to show guidance and pro forma results excluding purchasing accounting for comparability Lexia’s financials have been conformed to Rosetta Stone presentation and exclude any impact of purchase accounting adjustments Operating EBITDA is defined as EBITDA plus the change in deferred revenue and the company believes that this is a good proxy for cash flow generation 11 ($MM) 2010 2011 2012 2013E Change '13/'12 Unaudited Jan-July 2012 Unaudited Jan-July 2013 Change c Unaudited Aug-Dec 2012 Forecast Aug-Dec 2013 Change Bookings $18 $20 $16 $19 19% $9 $10 6% $7 $9 35% Operating EBITDA $2 ($1) ($3) ($1) 326% ($3) ($1) 230% ($0.5) $0.1 587% % Margin 9% -4% -21% -4% 1700 bps -33% -9% 2400 bps -7% 1% 800 bps Revenue $8 $12 $15 $17 17% $8 $10 17% $7 $8 18% EBITDA ($8) ($9) ($4) ($2) 104% ($4) ($1) 401% ($1) ($1) -94% % Margin -94% -73% -29% -12% 1700 bps -43% -7% 3600 bps -11% -18% -700 bps |
|
|
Guidance Reconciliation1,2 Please see the Appendix for definitions of non-GAAP metrics; Going forward, Rosetta Stone expects to show guidance and pro forma results excluding purchasing accounting for comparability No Change Lexia is expected to generate positive cash flow in the first year 12 |

|
|
Long-Term Outlook for Lexia1,2 Expect Lexia’s Bookings to increase by 2x over 2013 estimate Driven by increasing amount of renewal business Further penetration of U.S. K-12 marketplace Entrance into U.S. consumer market Expansion into international markets Expect Lexia’s Adjusted EBITDA margins to grow to the low-to-mid-teens as a percentage of Revenue Expect synergies from Lexia to be in the low, single-digit millions of dollars on an annualized basis 13 2015 Rosetta Stone long-term goals remain unchanged: $400MM+ of Revenue and 10-13% Adjusted EBITDA margins 1. Please see the Appendix for definitions of non-GAAP metrics; 2. Going forward, Rosetta Stone expects to show guidance and pro forma results excluding purchasing accounting for comparability |

|
|
Appendix |

|
|
Purchase Accounting Impact* Purchase price will be allocated to assets acquired and liabilities assumed at fair value Significant purchase accounting items will include: Reduction in Deferred revenue ~$32.5MM (Pre-close Deferred Revenue of $34.0MM) The remaining amount will be recorded as revenue as the service is provided, estimated over a period of 3-5 years. Deferred sales commissions reduced by $15MM to ~$0 Due to the significant purchase accounting adjustments associated with deferred revenue and deferred commissions, we anticipate introducing new Non-GAAP metrics to facilitate comparisons to future periods and to exclude the impact of such purchase accounting adjustments: Pro Forma Revenue Pro Forma Adjusted EBITDA Pro Forma Adjusted Net Income/(Loss) Pro Forma Adjusted EPS 15 * The impact of purchase accounting is based on management’s preliminary estimates of fair value and are subject to change. |

|
|
Non-GAAP Metric Definitions Adjusted EBITDA is GAAP net income or loss plus interest income and expense, income tax benefit and expense, depreciation, amortization and stock-based compensation expenses. Adjusted EBITDA excludes any items related to the litigation with Google Inc., restructuring costs and transaction and other costs associated with mergers and acquisitions. Adjusted net income/(loss) and adjusted net income/(loss) per share exclude the impact of items related to its litigation with Google Inc., restructuring costs and transaction and other costs associated with mergers and acquisitions as well as all adjustments related to recording the non-cash tax valuation allowance for deferred tax assets. Free cash flow is cash flow from operations less cash used in purchases of property and equipment. Bookings represent executed sales contracts received by the Company that are either recorded immediately as revenue or as deferred revenue. Pro Forma Revenue is GAAP revenue plus the purchase accounting impact on acquired deferred revenue Pro Forma Adjusted EBITDA is Adjusted EBITDA (as defined above) plus the purchase accounting impact on acquired deferred revenue less the purchase accounting impact on acquired deferred commissions Pro Forma Adjusted Net Income/(Loss) and Pro Forma Adjusted EPS are Adjusted Net Income/(Loss) and Adjusted Net Income/(Loss) per Share (as defined above) plus the purchase accounting impact on acquired deferred revenue less the purchase accounting impact on acquired deferred commissions 16 |
