Attached files
| file | filename |
|---|---|
| 8-K - FORM 8-K - Jefferies Financial Group Inc. | d573558d8k.htm |
 Leucadia National Corporation
2013 Annual Meeting
July 25, 2013
Exhibit 99.1 |
 Note on
Forward Looking Statements This
document
contains
“forward
looking
statements”
within
the
meaning
of
the
safe
harbor
provisions
of
Section
27A
of
the
Securities Act of 1933 and Section 21E of the Securities Exchange Act of 1934.
Forward looking statements include statements about our future and
statements that are not historical facts. These forward looking statements are usually preceded by the words
“should,”
“expect,”
“intend,”
“may,”
“will,”
or similar expressions. Forward looking statements may contain expectations
regarding revenues, earnings, operations, and other results, and may include
statements of future performance, plans, and objectives. Forward looking
statements also include statements pertaining to our strategies for future development of our business and products.
Forward looking statements represent only our belief regarding future events, many
of which by their nature are inherently uncertain. It is possible that the
actual results may differ, possibly materially, from the anticipated results indicated in these forward-looking
statements. Information regarding important factors, including our Risk Factors,
that could cause actual results to differ, perhaps materially, from those in
our forward looking statements is contained in reports we file with the SEC. You should read and
interpret
any
forward
looking
statement
together
with
reports
we
file
with
the
SEC.
i |
 Book
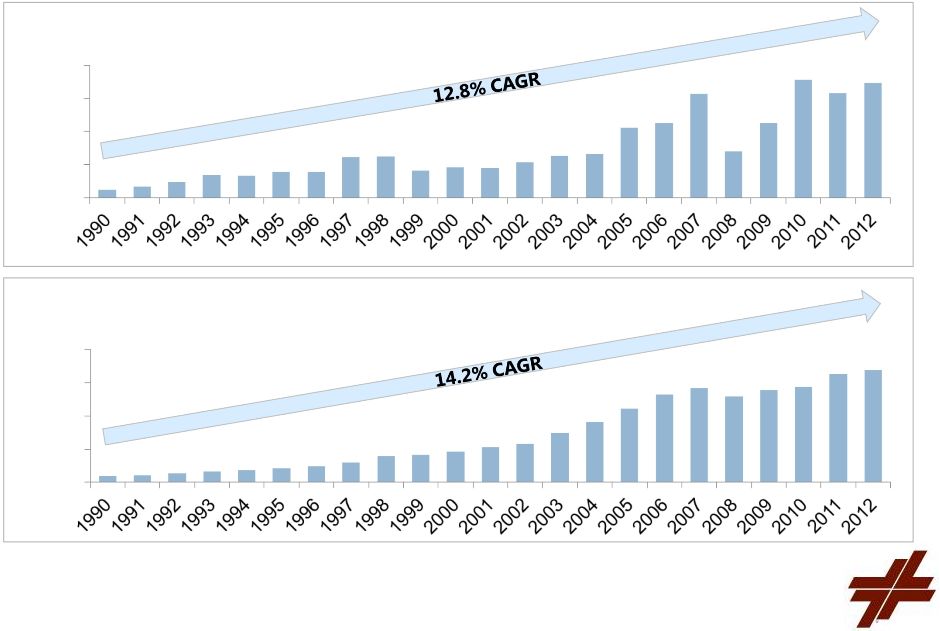
Value per Share Growth Since 1990 Note: Book value per share figures are
split-adjusted. (1) Reduction in book value per share reflects special
1999 dividend payments totaling $811.9 million, or $4.53 per share. 1
Leucadia –
Book Value per Share Growth Since 1990
Jefferies –
Book Value per Share Growth Since 1990
(1)
$1.97
$6.16
$7.26
$16.95
$28.53
$27.67
$32.00
$24.00
$16.00
$8.00
$0.00
$0.91
$2.07
$4.64
$11.07
$14.43
$16.90
$20.00
$15.00
$10.00
$5.00
$0.00 |
 Overview
Our Businesses:
Liquidity:
National Beef
(Beef Processing)
2012
Berkadia
(Mortgage Servicing)
2009
Garcadia
(Auto Retail)
2006
Jefferies
(Investment Banking)
2013
Conwed
(Plastics)
1985
Idaho Timber
(Wood Products)
2005
Premier
Entertainment
(Gaming)
2006
Cash & Investments
$2.8 billion
Deferred Tax Asset
$1.8 billion
Linkem
(Telecommunications)
2011
Real Estate /
HomeFed
Note: Figures reflect book value as of 03/31/13.
2 |
 Liquidity Events –
Last Twelve Months
Leucadia has generated over $2 billion of proceeds in the last
twelve months
Fortescue Metals note redemption and stock sale (July
and October 2012): $868 million
Inmet Mining merger consideration (March 2013): $732 million,
including $340 million of First Quantum stock
Mueller stock sale (September 2012): $427 million
Keen Energy sale (October 2012): $128 million plus $40 million
note
TeleBarbados sale (September 2012): $28 million
3 |
 Long-Term Strategy –
Compelling Value in Sectors We
Understand
Financial Services
Jefferies
Berkadia
Asset Management
Auto Retail –
Garcadia
Agribusiness –
National Beef
Project Development
Gasification
Oregon Liquefied Natural Gas
Energy, Metals and Mining, Consumer, Industrial, Media,
Telecom
4 |
 5 |
 6
National Beef harvests ~3.7M fed cattle per year representing ~14.5% market share
3 processing plants strategically located in Liberal and Dodge City, KS and Brawley, CA
Compete with Tyson, Cargill, JBS and numerous small beef packers
Export beef and beef by-products to more than 20 countries
Beef processing is a spread margin business, but National Beef is intensely focused on
value-added production to drive superior performance versus its commodity-focused
competitors
National
Beef
operates
3
further
processing
plants
converting
beef
and
pork
into
fresh,
consumer-ready products
Strategically located in PA, GA and KS
National Beef’s tannery is among the largest in the world
Convert
raw
cattle
hides
to
wet
blue
leather
for
use
in
finished
leather
production
for
automotive, shoes, fashion, etc.
www.kansascitysteaks.com
Premium direct to consumer beef and other center-of-the-plate entrees
National Carriers refrigerated and livestock transportation and logistics business
Services National Beef along with numerous 3rd party shippers
Overview |
 U.S. beef cowherd has been in downward trend for a generation, however
due to improvements in genetics and production practices, overall beef
supply has actually increased
The U.S. has historically been a net importer of beef. Due to increasing
international demand for U.S. beef and a decline of lean beef imports, the
U.S. is now a net exporter of beef. This has had a positive impact on industry
margins
U.S. Net Beef Trade –
Imports Minus
Exports (Million lbs)
(1)
U.S. Commercial Beef Production vs. Beef
Cow Inventory
(1)
Industry Trends
(1)
Source: USDA.
7
28
27
26
25
24
23
22
21
20
46
44
42
40
38
36
34
32
30
28
3,500
3,000
2,500
2,000
1,500
1,000
500
0
(500)
(1,000) |
 The cutout ratio is a good proxy for industry profitability…and demonstrates
the variability of beef processing margins
KS
Steer
Comprehensive
Beef
Cutout
Ratio
August
2002
–
June
2013
(1)
Industry Trends (Cont’d)
Avg.
1.60
(1)
Cutout ratio is calculated as the USDA National Comprehensive Boxed Beef Cutout
divided by the USDA Kansas Weekly Weighted Average Steer Price.
8
2.00
1.95
1.90
1.85
1.80
1.75
1.70
1.60
1.65
1.55
1.50
1.45
1.40
1.35
1.30
1.25
Aug-02
Aug-03
Aug-04
Aug-05
Aug-06
Aug-07
Aug-08
Aug-09
Aug-10
Aug-11
Aug-12 |
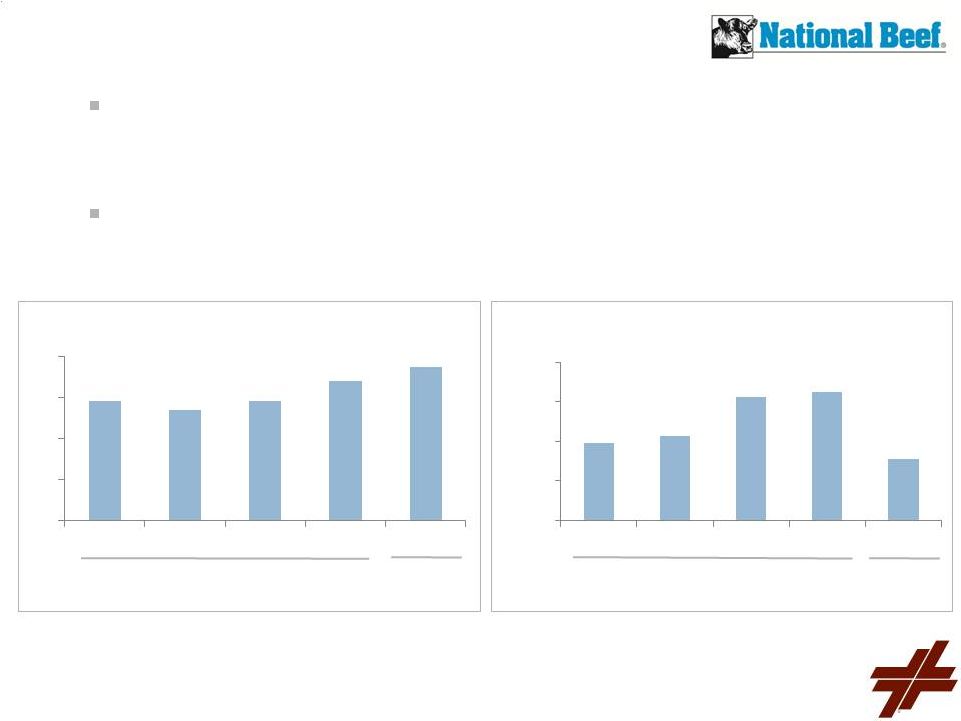 Financial Performance
The beef processing industry is cyclical and working capital intensive.
However, it has significant barriers to entry and offers attractive prospects for
free cash flow generation over the cycle
Given cattle supply constraints, strategies designed to drive margin
expansion are more important to long-term profit growth versus those focused
on increasing revenue
(1)
Prior to being acquired by Leucadia in December 2011, National Beef’s fiscal
year ended in August. In addition, 2012 amounts are not comparable to prior
periods as they reflect the application of acquisition accounting for National Beef, principally resulting in greater
depreciation and amortization expenses during 2012.
(2)
Profit from operations is a non-GAAP measure. Profit from operations equals
pre-tax income, plus depreciation and amortization expenses and
excluding interest expense / (income), net. See page 29 in the appendix for a reconciliation to GAAP amounts.
FYE August,
FYE
Dec.,
FYE August,
FYE
Dec.,
9
Profit from Operations ($ Millions)
(1, 2)
Revenue ($ Billions)
(1)
$8
$6
$4
$2
$0
$5.8
$5.4
$5.8
$6.8
$7.5
2008
2009
2010
2011
2012
$400
$300
$200
$100
$0
2008
2009
2010
2011
2012
$196.9
$212.7
$313.3
$324.5
$154.5 |
 Recent
Developments Global protein demand is expected to continue current growth
trend; growth of middle class in developing countries points to increasing
demand for beef Recent regulatory change in cattle age requirement by Japan
has resulted in industry-wide increase in export volume to Japan
Acquired remaining minority interest in Kansas City Steaks, increasing
ownership from 75% to 100%
Retrofit of hide tanning facility expected to be completed in December 2013,
at which point National Beef will have the largest tannery, anticipated to be
the most efficient in the United States
Widespread
drought
conditions
have
contributed
to
a
delay
in
the
reversal
of
the downward trend in U.S beef cow numbers. Fewer cows ultimately result in
lower supplies of fed cattle and that has reduced industry-wide beef packing
margins and National Beef’s profitability
10 |
 11 |
 Acquired by Leucadia in a 50/50 joint venture with Berkshire Hathaway from the
Capmark bankruptcy estate
3rd
largest
servicer
of
commercial
real
estate
loans
in
the
U.S.
Berkadia
collects
payments,
manages
tax,
insurance
and
maintenance
escrow
reserves
on behalf of, and reports and remits funds to, the owners of 30,500 loans.
Berkadia
bears
the
risk
of
loss
on
less
than
1%
of
its
servicing
portfolio
5th
largest
multifamily
loan
originator
(12th
largest
commercial
real
estate
loan
originator overall) in the U.S. Berkadia originates loans on behalf of third
party investors, primarily Government Sponsored Enterprises (GSEs), HUD,
conduits and life insurance companies
Able to direct the investment of, and retain the investment earnings on, a
significant portion of the escrow cash balances associated with the servicing
portfolio
Leucadia’s original investment was $217 million. As of July 15, 2013,
cumulative cash distributions to Leucadia have been $191 million, with
substantial value going
forward Overview
12 |
 Despite the ongoing run-off of the historical servicing base, Berkadia has been
able to grow in originations, revenues, margins, servicing portfolio and,
most importantly, cash flow
Low-cost high quality master and primary servicer, driven in part by
company-
owned operations in India
2012 production volume of $9.5 billion was up 81% over 2011 while the
overall market was up 30%
In December 2012, Berkadia acquired Hendricks & Partners to add
investment sales capabilities and deepen borrower relationships in multifamily
space
Impending real estate loan maturities in industry should drive significant future
loan originations
$840 billion of the $1.5 trillion commercial real estate loans outstanding
(excluding banks) mature over the next 5 years
Multifamily loan maturities increase every year through 2017
Overview (Cont’d)
13 |
 Financial Performance
(1)
Cash Earnings is a non-GAAP measure. Cash Earnings equals pre-tax income
plus depreciation and amortization of mortgage servicing rights
(MSR’s), intangible assets, the increase in balance sheet loan loss reserves, less gains
attributable to origination of MSR’s. See page 30 in the appendix for a
reconciliation to GAAP amounts. 14
Loan Originations ($ Billions)
Pre-Tax Margin (% of Revenue)
Pre-Tax Income ($ Millions)
Cash Earnings
($ Millions)
(1) |
 Servicing
Portfolio
–
Unpaid
Principal
Balance
($
Billions)
(1)
Portfolio Growth
(1)
Shown net of Special Servicing.
15
220.3
185.8
155.7
127.0
114.2
6.6
14.6
53.3
121.7
4.8
9.9
16.8
21.7
$220.3
$197.2
$180.2
$197.1
$257.6
$0
$50
$100
$150
$200
$250
$300
2009
2010
2011
2012
Jul-13
Purchased
Servicer's Servicer
Originations
More than 50% of the servicing portfolio has been added since acquisition
As of July 2013, the U.S. servicing portfolio is the largest it has been in its
history |
 Opportunities
Benefit from a rise in interest rates, especially short term interest rates
Fill-in
national
footprint
by
hiring
experienced
mortgage
bankers
and
investment
sales
advisors in new markets and diversify across all product types
Better capitalize on our combined mortgage banking and investments sales team by
continuing to build and improve tools that better serve our customers
(including additional differentiating products, capital sources, and process
improvements) Both servicing and origination markets are fragmented and
consolidating Increased efficiency
Risks
Reduced Fannie Mae, HUD and Freddie Mac presence in the multifamily lending markets
due to changes in government policy or regulation may impact margins
Banking counterparty risks
Credit
quality
deterioration
–
credit
performance
has
been
excellent
as
losses
and
delinquency have been very low and are lower than industry averages
Not being able to enter into additional Servicer’s Servicers transactions on
favorable economic terms
Sustaining current growth rates
Opportunities & Risks
16 |
 Garcadia
17 |
 Number of Dealerships by Manufacturer
(52% Domestic, 48% Foreign)
15th Largest U.S. Dealership Group
21 dealerships
1,800 employees
Current group will sell 50,000 units annually
Garcadia Overview
Units Sold by Current Platform
18 |
 Auto
Market Overview U.S. New Vehicle Sales (Thousands)
(1)
(1)
Source: WardsAuto.
19
Pent up demand
Average age of vehicle on road –
10.8 years
Consumer financing available at pre-recession levels
Aggressive loan to value
Prime and near prime approval levels on the rise
Number of licensed drivers on the rise
Used vehicle valuations remain strong
Key Market Trends |
 $700 billion in annual sales
17,900 dealerships nationwide
Top 10 groups represent only 8% of market
Aging dealer body without succession plans
Many “old school”
processes exist in auto dealerships
Must embrace new technology to stay ahead
Auto Retail Industry
20
Technology Changing Business
Many Acquisition Opportunities
Large and Fragmented Market |
 Build geographic clusters in medium to large markets
Target medium to high volume stores
Focus on profitable, but underperforming dealerships
Solve succession issues
Hire the best people
Maintain flat organization
Execute on key operational initiatives
Data-
and results-driven culture
Manage to $1,000 net income per vehicle retailed
Garcadia Model
21
Operations
Acquisition Strategy |
 Company Performance ($ Millions)
Garcadia Joint Venture
JV Partner: Ken Garff Automotive Group
85 years in the industry
Acts as the dealer principal
Provides operating management
(1)
Represent
combined
amounts
for
all
Garcadia
dealership
holdings,
not
just
Leucadia’s
share.
(2)
Represents
Leucadia’s
share
of
cash
distributions
and
rent
paid
by
Garcadia
for
land
owned
by
Leucadia.
22
FYE December 31,
2010
2011
2012
Total Units Sold
20,832
25,483
35,394
# of Dealerships
14
17
18
Garcadia Revenue
(1)
639.5
$
789.4
$
1,100.8
$
% Growth
NA
23.4%
39.4%
Garcadia Pre-Tax Income
(1)
14.1
$
22.3
$
37.4
$
% Margin
2.2%
2.8%
3.4%
Garcadia Distributions
(2)
13.8
$
16.0
$
30.4
$
|
 23 |
 Jefferies Group
Full-Service Capital Markets Platform:
expertise and depth across
equities, fixed income, commodities and investment banking
Client-Focused:
providing investor and issuer clients with the highest
quality advice and execution
Global Footprint:
sales & trading and investment banking presence
across the United States, Europe and Asia
Strong, Stable Foundation:
robust long-term capital base,
comparatively low leverage and free from dependence upon
government support
Positioned to Seize Market Share:
having broadened our product
offering and hired additional key talent during the downturn, Jefferies is
growing rapidly
24 |
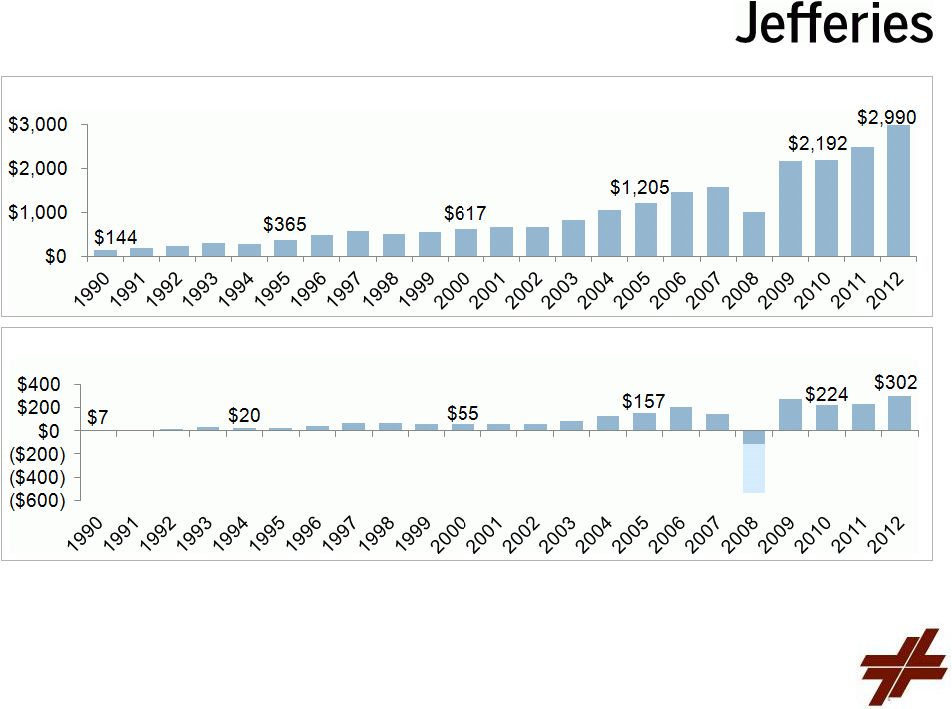 Net
Income Net Revenues
Jefferies Revenues & Net Income –
Since 1990
($ Millions)
(1)
(2)
25
(2)
(1)
(3)
(1)
The selected financial information for the year ended November 30, 2011
are non-GAAP financial measures. See page 31 in the appendix for
a reconciliation to GAAP amounts.
(2)
The selected financial information for the year ended November 30, 2012
are non-GAAP financial measures. See page 31 in the appendix for
a reconciliation to GAAP amounts.
(3)
Includes post-tax losses of $427 million related to the
modification of the terms of Jefferies’ employee stock awards in Q4 2008, such that
previously granted awards were written off and current year employee
stock compensation awards were expensed in the year in which service
was provided. |
 A
Full Service
Investment
Bank
Derivatives
Cash
Equities
Electronic
Trading
Prime
Brokerage /
Securities
Finance
ETFs
Convertibles
Wealth
Management
MBS / ABS
Emerging
Markets
Investment
Grade
Rates /
Repos
Leveraged
Credit
Municipals
Base Metals
Listed
Futures
Precious
Metals
Foreign
Exchange
Metals &
Mining
Industrials
Healthcare
Financials
TMT
Real
Estate,
Gaming &
Lodging
Energy
Consumer
Equity
Capital
Markets
Leveraged
Finance
M&A
Financial
Sponsors
Equities
Fixed Income
Jefferies Bache
Investment Banking
Public
Finance
Restructu-
ring
Research
ETFs
Research
Research
26 |
 Recent
Developments Jefferies continues to win market share and deliver consistent
profitability Investment Banking revenues underline the quality and
durability of
Jefferies’
platform
Solid growth in Equities revenues
Durable Fixed Income, Commodities and Currencies platforms
Continued emphasis on earnings growth through increased employee
productivity
Jefferies’
full-service capabilities and momentum outside the U.S. present a
significant growth opportunity
27 |
 Appendix
28 |
 National Beef –
GAAP Reconciliation
Note: Prior to being acquired by Leucadia in December 2011, National Beef’s
fiscal year ended in August. In addition, 2012 amounts are not comparable to
prior periods as they reflect the application of acquisition accounting for National Beef, principally resulting in greater
depreciation and amortization expenses during 2012.
($ Millions)
29
FYE August,
FYE Dec.,
2008
2009
2010
2011
2012
Pre-Tax Income (GAAP)
127.0
$
145.1
$
249.0
$
261.6
$
59.0
$
Interest Expense / (Income), net
33.5
23.2
14.7
11.7
12.4
Depreciation & Amortization
36.4
44.4
49.6
51.2
83.1
Profit from Operations (Non-GAAP)
196.9
$
212.7
$
313.3
$
324.5
$
154.5
$ |
 Berkadia –
GAAP Reconciliation
($ Millions)
30
FYE December 31,
Three Months Ended,
2010
2011
2012
03/31/12
03/31/13
Pre-Tax Income (GAAP)
31.0
$
34.6
$
103.8
$
26.0
$
37.8
$
Amortization, Impairment and Depreciation
88.1
107.5
112.7
23.7
25.7
Gains Attributable to Origination of MSR's
(42.4)
(45.2)
(93.1)
(11.5)
(22.2)
Loan Loss Reserves and Guarantee Liabilities, net of cash losses
3.1
3.2
18.8
0.4
3.1
Unrealized (Gains) / Losses; and all other, net
(9.1)
7.0
(7.7)
(6.7)
(6.1)
Cash Earnings (Non-GAAP)
70.7
$
107.1
$
134.5
$
31.9
$
38.3
$ |
 Jefferies –
GAAP Reconciliation
($ Millions)
(1)
(2)
(3)
(4)
(5)
(6)
(7)
(8)
31
FYE November 30,
2011
2012
GAAP
Adjustments
Adjusted
GAAP
Adjustments
Adjusted
Net Revenues
2,548.8
$
72.7
$
2,476.1
$
2,998.8
$
8.4
$
2,990.4
$
Compensation and Benefits
1,482.6
11.8
1,470.8
1,770.8
24.7
1,746.1
Noncompensation Expenses
643.3
7.8
635.4
693.3
14.5
678.8
Total Non-interest Expenses
2,125.9
19.6
2,106.2
2,464.1
39.2
2,424.9
Earnings Before Income Taxes
419.3
53.1
366.3
491.8
(30.8)
522.6
Income Tax Expense (Benefit)
133.0
0.2
132.7
168.6
(11.4)
180.1
Net Earnings
286.4
52.8
233.5
323.1
(19.4)
342.5
Net Earnings to Common Shareholders
284.6
$
52.8
$
231.8
$
282.4
$
(19.4)
$
301.8
$
(1)
In accordance with debt extinguishment accounting under ASC 405 and
470, Jefferies recorded a gain on debt extinguishment of $20.2 million, relating to trading
activities in its own long term debt. The 2011 year also includes a
bargain purchase gain of $52.5 million resulting from the acquisition of the Bache entities from
Prudential recorded in 2011.
(2)
In connection with the acquisition of the Bache entities, compensation
expense was recognized for 2011 related to 1) severance costs for certain employees of the
acquired Bache entities that were terminated subsequent to the
acquisition, 2) the amortization of stock awards granted to former Bache employees as replacement
awards for previous Prudential stock awards that were forfeited in the
acquisition and 3) bonus costs for employees as a result of the completion of the acquisition.
(3)
Includes the amortization of intangible assets of $0.7 million
recognized during 2011 in connection with the acquisition of the Bache entities as well as expenses
(primarily professional fees) totaling $7.1 million related to the
acquisition and/or integration of the Bache entities within Jefferies.
(4)
A total domestic marginal tax rate of 41.7% was applied. The bargain
purchase gain of $52.5 million on the acquisition of Bache is not a taxable item.
(5)
Includes a gain on debt extinguishment of $9.9 million in accordance
with debt extinguishment accounting relating to trading activities in Jefferies own long term
debt and a bargain purchase gain of $3.4 million resulting from the
acquisition of Hoare Govett, partially offset by additional interest expense of $4.8 million from
subsequent amortization of debt discounts upon reissuance of Jefferies
own long-term debt. (6)
Includes compensation expense related to the amortization
of retention and stock replacement awards granted in connection with the acquisition of the Bache entities
and Hoare Govett and bonus costs for employees as a result of the
completion of the Hoare Govett acquisition. (7) Reflects an impairment charge of
$2.9 million on indefinite-lived intangible assets and amortization of intangible assets recognized in connection with the
acquisitions of Hoare Govett and the Bache entities, donations to
Hurricane Sandy relief of $4.1 million and transaction costs (primarily professional fees) associated
with the merger with Leucadia National Corporation of $4.7 million.
(8)
Reflects the tax benefit on the additional interest expense, Hoare
Govett and Bache related expense items, Hurricane Sandy relief donations and transaction costs
associated with the merger with Leucadia at a domestic and foreign
marginal tax rate of 42.3% and 24.7%, respectively. |
 Leucadia National Corporation
2013 Annual Meeting
July 25, 2013 |