Attached files
| file | filename |
|---|---|
| 8-K - 8-K - General Motors Co | a2q2013earningsreleaseform.htm |
| EX-99.1 - PRESS RELEASE AND FINANCIAL HIGHLIGHTS - General Motors Co | gm2013q2earningspressrelea.htm |

General Motors Company Q2 2013 Results July 25, 2013 Exhibit 99.2

Forward Looking Statements In this presentation and in related comments by our management, our use of the words “expect,” “anticipate,” “possible,” “potential,” “target,” “believe,” “commit,” “intend,” “continue,” “may,” “would,” “could,” “should,” “project,” “projected,” “positioned,” “outlook” or similar expressions is intended to identify forward looking statements that represent our current judgment about possible future events. We believe these judgments are reasonable, but these statements are not guarantees of any events or financial results, and our actual results may differ materially due to a variety of important factors. Among other items, such factors may include: our ability to realize production efficiencies and to achieve reductions in costs as a result of our restructuring initiatives and labor modifications; our ability to maintain quality control over our vehicles and avoid material vehicle recalls; our ability to maintain adequate financing sources, including as required to fund our planned significant investment in new technology; our ability to successfully integrate Ally Financial’s International Operations; the ability of our suppliers to timely deliver parts, components and systems; our ability to realize successful vehicle applications of new technology; overall strength and stability of our markets, particularly Europe; and our ability to continue to attract new customers, particularly for our new products. GM's most recent annual report on Form 10-K provides information about these and other factors, which we may revise or supplement in future reports to the SEC. 1
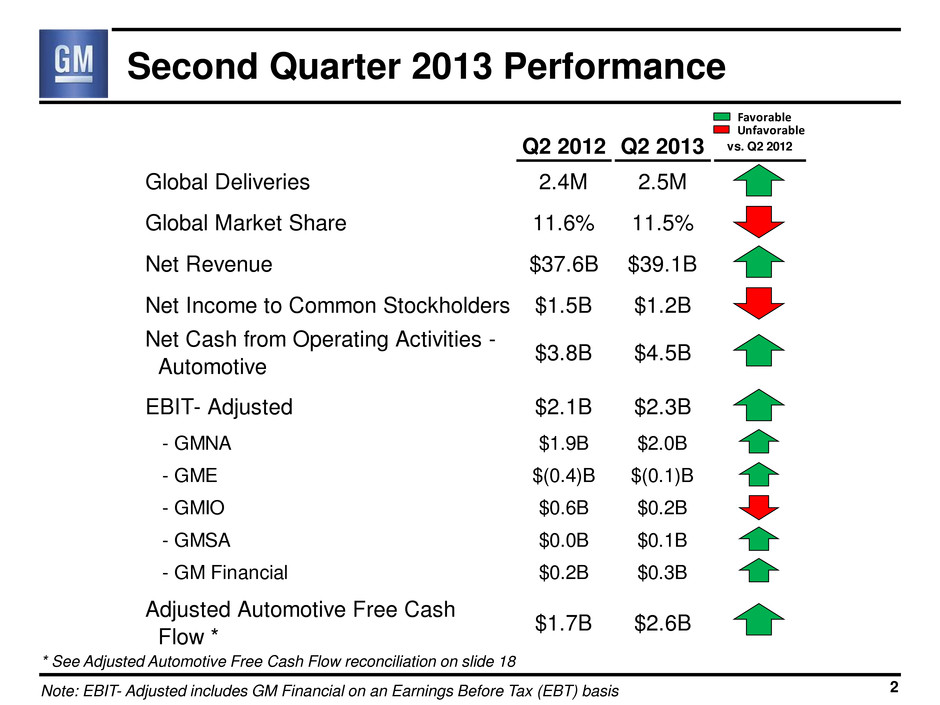
Second Quarter 2013 Performance 2Note: EBIT- Adjusted includes GM Financial on an Earnings Before Tax (EBT) basis * See Adjusted Automotive Free Cash Flow reconciliation on slide 18 Q2 2012 Q2 2013 vs. Q2 2012 Global Deliveries 2.4M 2.5M Global Market Share 11.6% 11.5% Net Revenue $37.6B $39.1B Net Income to Common Stockholders $1.5B $1.2B Net Cash from Operating Activities - Automotive $3.8B $4.5B EBIT- Adjusted $2.1B $2.3B - GMNA $1.9B $2.0B - GME $(0.4)B $(0.1)B - GMIO $0.6B $0.2B - GMSA $0.0B $0.1B - GM Financial $0.2B $0.3B Adjusted Automotive Free Cash Flow * $1.7B $2.6B Favorable Unfavorable

Second Quarter 2013 Highlights • GM #1 in J.D. Power and Associates Initial Quality Study • Record global Chevrolet sales • Chevrolet Silverado and GMC Sierra launches on track • Cadillac U.S. sales up more than 33 percent year-to-date • Broke ground on a new Cadillac assembly plant in Shanghai • Closed on acquisition of Ally Europe operations • Created an all-new Global Business Services Group 3

Summary of Q2 2013 Results 4Note: EBIT- Adjusted includes GM Financial on an Earnings Before Tax (EBT) basis Q2 Q2 2012 2013 Net Revenue ($B) 37.6 39.1 Operating Income ($B) 1.8 1.8 Net Income to Common Stockholders ($B) 1.5 1.2 EPS – Diluted ($/Share) 0.90 0.75 Net Cash from Operating Activities – Automotive ($B) 3.8 4.5 EBIT- Adjusted ($B) 2.1 2.3 EBIT- Adjusted % Revenue 5.6% 5.8% Adjusted Automotive Free Cash Flow ($B) 1.7 2.6 GAAP Non- GAAP

5 Impact of Special Items Q2 Q2 2012 2013 Net Income to Common Stockholders ($B) 1.5 1.2 EPS – Diluted ($/Share) 0.90 0.75 Included in Above ($B): Acquisition of GM Korea Preferred Shares - (0.2) Total Impact Net Income to Common Stockholders ($B) 0.0 (0.2) Total Impact EPS – Diluted ($/Share) - (0.09)
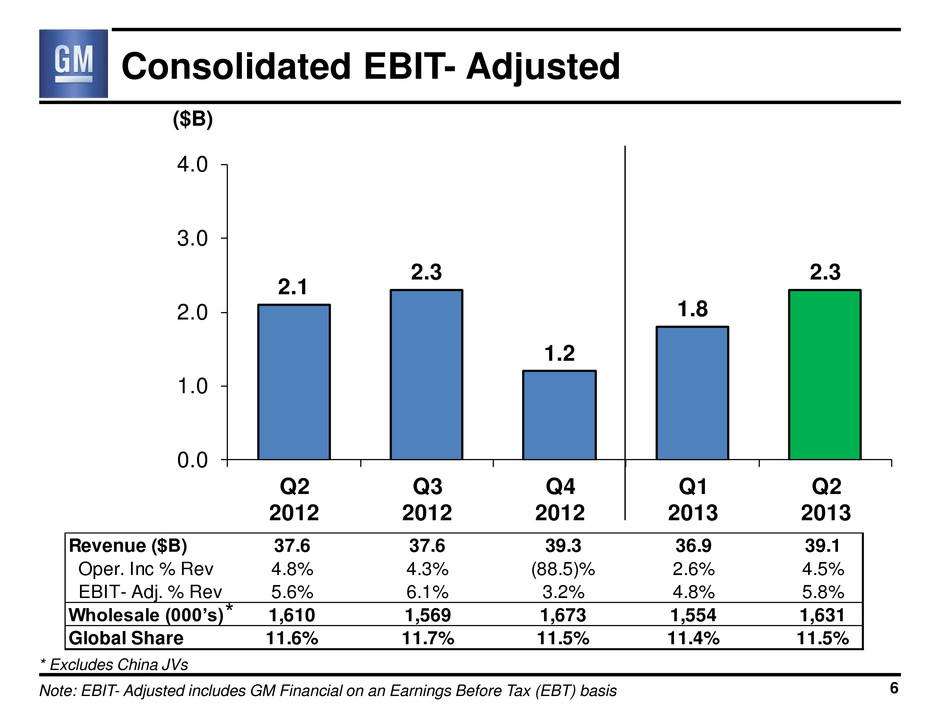
2.1 2.3 1.2 1.8 2.3 0.0 1.0 2.0 3.0 4.0 Q2 2012 Q3 2012 Q4 2012 Q1 2013 Q2 2013 Consolidated EBIT- Adjusted ($B) Note: EBIT- Adjusted includes GM Financial on an Earnings Before Tax (EBT) basis 6 Revenue ($B) 37.6 37.6 39.3 36.9 39.1 Oper. Inc % Rev 4.8% 4.3% (88.5)% 2.6% 4.5% EBIT- Adj. % Rev 5.6 6.1 3.2% 4.8 5.8 Wholesale (000’s) 1,610 1,569 1,673 1,554 1,631 Global Share 11.6% 11.7% 11.5% 11.4% 11.5% * Excludes China JVs *

2.1 2.3 (0.5) (0.2)0.3 0.4 0.1 EBIT-Adj Volume Mix Price Cost Other EBIT-Adj 7 $0.2B IncreaseQ2 2012 Q2 2013 ($B) Consolidated EBIT- Adj. – Q2 2012 vs. Q2 2013 Note: EBIT- Adjusted includes GM Financial on an Earnings Before Tax (EBT) basis; Results may not foot due to rounding

1.9 (0.4) 0.6 0.0 0.2 (0.2) 2.1 2.0 (0.1) 0.2 0.1 0.3 (0.1) 2.3 GMNA GME GMIO GMSA GM Financial* Corp. / Elims Total GM Q2 2012 Q2 2013 EBIT- Adjusted ($B) 8 Q2 2013 EBIT- Adjusted * GM Financial at an Earnings Before Tax basis (EBT); Note: Results may not foot due to rounding

Key GMNA Performance Indicators

1.9 1.7 1.1 1.4 2.0 -1.0 0.0 1.0 2.0 3.0 Q2 2012 Q3 2012 Q4 2012 Q1 2013 Q2 2013 GMNA EBIT- Adjusted ($B) 10 Revenue ($B) 21.6 22.3 22.8 23.0 23.5 EBIT- Adj. % Rev 8.8% 7.7% 5.0% 6.2% 8.4% U.S. Dealer Inv (000’s) 701 689 717 744 708 Wholesale (000’s) 760 773 826 829 809 North America Share 17.4% 16.9% 16.6% 17.1% 17.3% * 2012 Q3 - Q4 estimated; all periods unaudited * *

1.9 2.0 (0.2) (0.4) 0.0 0.4 0.3 EBIT-Adj Volume Mix Price Cost Other EBIT-Adj GMNA EBIT- Adj. – Q2 2012 vs. Q2 2013 11 ($B) Q2 2012 Q2 2013 $0.1B Increase

(0.4) (0.5) (0.8) (0.2) (0.1) -1.0 0.0 1.0 2.0 3.0 Q2 2012 Q3 2012 Q4 2012 Q1 2013 Q2 2013 GME EBIT- Adjusted ($B) 12 Revenue ($B) 5.5 4.7 5.2 4.8 5.2 EBIT- Adj. % Rev (7.1)% (10.4)% (14.6)% (3.6)% (2.1)% Wholesale (000’s) 290 254 269 249 276 Europe Share 8.8% 8.6% 8.3% 8.3% 8.5% (1) (1) (1) 2012 Q3 - Q4 estimated; all periods unaudited (2) Includes Chevrolet Europe (2)

GME EBIT- Adj. – Q2 2012 vs. Q2 2013
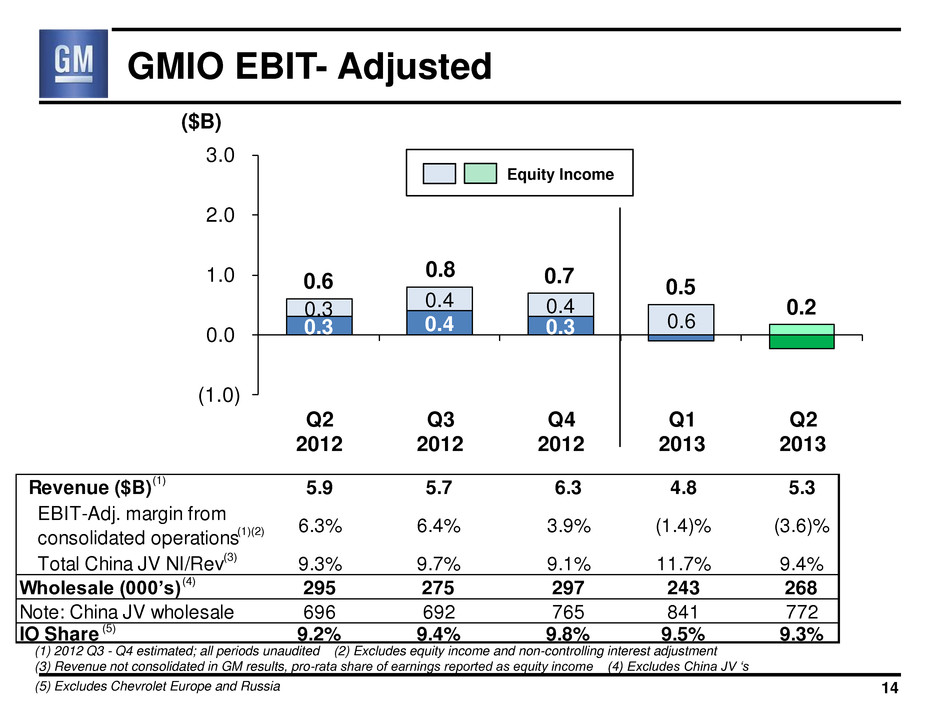
Revenue ($B) 5.9 5.7 6.3 4.8 5.3 EBIT-Adj. margin from consolidated operations 6.3% 6.4% 3.9% (1.4)% (3.6)% Total China JV NI/Rev 9.3% 9.7% 9.1% 11.7% 9.4% Wholesale (000’s) 295 275 297 243 268 Note: China JV wholesale 696 692 765 841 772 IO Share 9.2% 9.4% 9.8% 9.5% 9.3% 0.3 0.4 0.3 0.3 0.4 0.4 0.6 (1.0) 0.0 1.0 2.0 3.0 Q2 2012 Q3 2012 Q4 2012 Q1 2013 Q2 201 GMIO EBIT- Adjusted ($B) 14 0.6 (1) 2012 Q3 - Q4 estimated; all periods unaudited (2) Excludes equity income and non-controlling interest adjustment (3) Revenue not consolidated in GM results, pro-rata share of earnings reported as equity income (4) Excludes China JV ‘s (5) Excludes Chevrolet Europe and Russia 0.8 Equity Income 0.7 0.5 0.2 (4) (1)(2) (1) (3) (5)

0.6 0.2 (0.1) (0.2) (0.1) (0.1) 0.1 EBIT-Adj Volume Mix Price Cost Other EBIT-Adj GMIO EBIT- Adj. – Q2 2012 vs. Q2 2013 Q2 2012 Q2 2013 15 ($B) $0.4B Decrease

0.0 0.2 0.1 0.0 0.1 0.0 1.0 2.0 3.0 Q2 2012 Q3 2012 Q4 2012 Q1 2013 Q2 2013 GMSA EBIT- Adjusted ($B) 16 Revenue ($B) 4.1 4.3 4.4 3.7 4.3 EBIT- Adj. % Rev 0.4 % 3.7 % 3.0 % (1.0)% 1.3 % Wholesale (000’s) 265 267 282 233 278 South America Share 18.1% 17.9% 17.7% 17.2% 17.1% * * * 2012 Q3 - Q4 estimated; all periods unaudited

GMSA EBIT- Adj. – Q2 2012 vs. Q2 2013

Adjusted Automotive Free Cash Flow 18 * Excludes impact of non-cash special items ($B) Q2 2012 Q2 2013 Net Income to Common Stockholders 1.5 1.2 Adjusted for Non-Controlling Interests, Preferred Dividends & undistributed earnings allocated to Series B 0.4 0.2 Deduct Non-Auto (GM Financial) (0.1) (0.2) Automotive Income 1.8 1.2 Non-Cash Special Items - 0.2 Depreciation and Amortization 1.5 1.5 Working Capital (1.0) 0.3 Pension / OPEB – Cash in Excess of Expense* (0.2) (0.1) Other* 1.7 1.3 Automotive Net Cash Provided/(Used) Operating Activities 3.8 4.5 Capital Expenditures (2.1) (1.9) Adjusted Automotive Free Cash Flow 1.7 2.6

Key Automotive Balance Sheet Items 19 Jun. 30 Mar. 31 Jun. 30 ($B) 2012 2013 2013 Cash & Current Marketable Securities 32.6 24.3 24.2 Available Credit Facilities(1) 5.3 11.0 10.6 Available Liquidity 37.9 35.3 34.8 Key Obligations: Debt 5.1 5.2 4.0 Series A Preferred Stock 5.5 5.5 5.5 U.S. Pension Underfunded Status(2) (3) 12.8 13.0 12.9 Non-U.S. Pension Underfunded Status(3) 11.2 13.3 13.1 Unfunded OPEB(3) 7.2 7.7 7.6 (1) Excludes uncommitted facilities (2) Excludes U.S. non-qualified plan PBO of ~$0.8 billion (3) Balances are rolled forward and do not reflect remeasurement, except for the remeasurement of certain U.S., Canada and GME plans in March and June, 2012

GM Financial 20Note: GM Sales Penetrations based on JD Power PIN Q2 Q2 Q2 Q2 GM Sales Penetrations 2012 2013 2012 2013 U.S. Subprime APR (<=620) 8.6% 8.6% 5.9% 6.4% U.S. Lease 15.4% 20.0% 21.8% 24.3% Canada Lease 9.1% 9.2% 19.2% 21.2% GM / GM Financial Linkage GM as % of GM Financial Loan and Lease Originations* (GM New / GMF Loan & Lease) GMF as % of GM U.S. Subprime & Lease 22% 25% GM Financial Performance* GM Financial Credit Losses (annualized net credit losses as % avg. consumer finance receivables) EBT ($M) 217 254 1.5% 1.4% Industry Avg. (Excl. GM) 45% 68% * Includes international Operations purchased in Q2 2013; Q2 2012 reflects North American operations only

Second Half Areas of Focus 21 • Strong execution of new vehicle launches • Continued efforts on reducing cost and complexity to ensure winning vehicles at a compelling value • Build on the momentum of industry best J.D. Power Initial Quality Study scores with intense focus on quality and customer experience • Develop and execute initiatives to improve GMIO consolidated operations
General Motors Company Select Supplemental Financial Information

Q2 Q3 Q4 Q1 Q2 (000’s) 2012 2012 2012 2013 2013 North America 820 759 735 761 880 Europe 455 382 372 373 425 Chevrolet in Europe 155 138 135 112 139 International Operations 862 857 968 992 925 China 672 665 754 816 751 South America 254 285 265 235 262 Brazil 154 183 169 141 164 Global Deliveries 2,392 2,283 2,339 2,361 2,492 Global Deliveries Note: GM deliveries include vehicles sold around the world under GM and JV brands, and through GM-branded distribution network. S1 * * International Operations deliveries excludes Chevrolet Europe and Russia

Global Market Share Note: GM market share includes vehicles sold around the world under GM and JV brands, and through GM-branded distribution network. Market share data excludes the markets of Iran, North Korea, Sudan and Syria. S2 (1) Europe share includes Chevrolet Europe (2) International Operations share excludes Chevrolet Europe and Russia (1) (2) Q2 Q3 Q4 Q1 Q2 2012 2012 2012 2013 2013 North America 17.4% 16.9% 16.6% 17.1% 17.3% U.S. 18.2% 17.6% 17.1% 17.7% 18.0% Europe 8.8% 8.6% 8.3% 8.3% 8.5% Germany 8.1% 7.4% 6.8% 7.3% 7.7% U.K. 12.0% 11.6% 12.3% 11.7% 11.7% International Operations 9.2% 9.4% 9.8% 9.5% 9.3% China 13.9% 14.9% 14.5% 15.1% 13.9% India 2.5% 2.7% 2.4% 2.5% 3.0% South America 18.1% 17.9% 17.7% 17.2% 17.1% Brazil 17.1% 17.1% 16.7% 17.0% 17.0% Global Market Share 11.6% 11.7% 11.5% 11.4% 11.5%
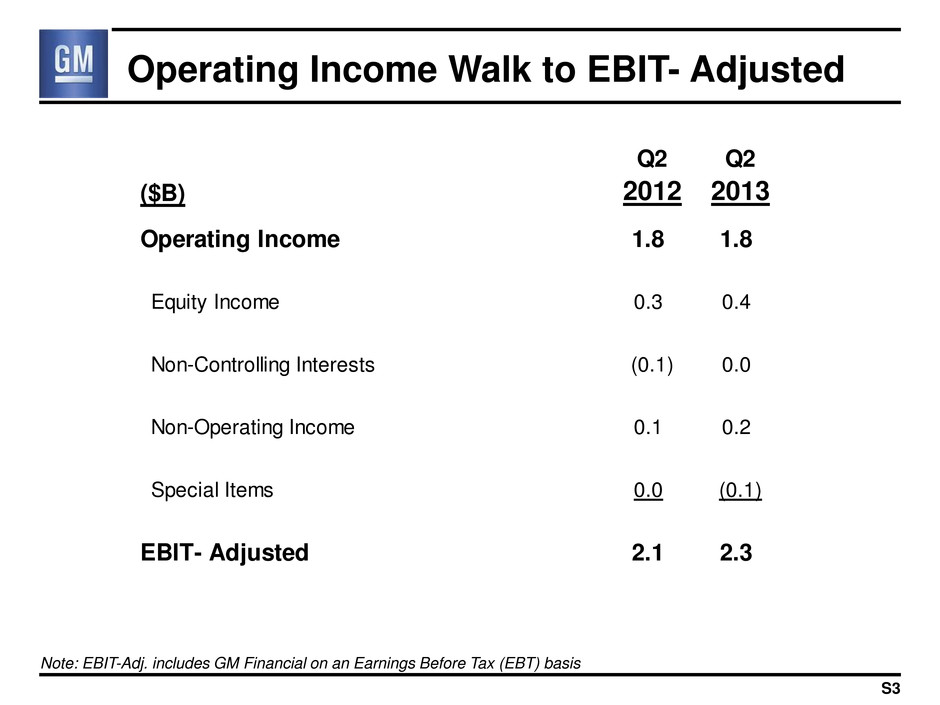
Operating Income Walk to EBIT- Adjusted S3 Note: EBIT-Adj. includes GM Financial on an Earnings Before Tax (EBT) basis Q2 Q2 2012 2013 Operating Income 1.8 1.8 Equity Income 0.3 0.4 Non-Controlling Interests (0.1) 0.0 Non-Operating Income 0.1 0.2 Special Items 0.0 (0.1) EBIT- Adjusted 2.1 2.3 ($B)

Reconciliation of EBIT- Adjusted S4Note: EBIT-Adj. includes GM Financial on an Earnings Before Tax (EBT) basis; Results may not foot due to rounding Q2 Q2 2012 2013 Net Income to Common Stockholders 1.5 1.2 Add Back: Undistributed earnings allocated to Series B (Basic) 0.1 0.0 Dividends on Preferred Stock 0.2 0.2 Interest Expense / (Income) 0.0 0.0 Income Tax Expense / (Benefit) 0.2 0.7 Special Items: Acquisition of GM Korea Preferred Shares - 0.2 Total Special Items 0.0 0.2 EBIT- Adjusted 2.1 2.3 ($B)

Restructuring (not included in special items) S5Note: Results may not foot due to rounding Q2 Q3 Q4 Q1 Q2 ($B) 2012 2012 2012 2013 2013 GMNA 0.0 0.1 0.0 0.0 0.0 GME 0.0 0.0 (0.1) 0.0 0.0 GMIO 0.0 0.0 0.0 0.0 0.0 GMSA (0.1) 0.0 0.0 0.0 0.0 Total (0.1) 0.0 (0.2) (0.1) (0.1)

GM Financial – Key Metrics S6 (1) Includes international Operations purchased in Q2 2013; Q2 2012 reflects North American operations only (2) Excludes $7M and $625M for Q2 2012 and Q2 2013 respectively in outstanding loans to dealers that are majority- owned and consolidated by GM, in connection with our commercial lending program (3) Excludes consumer finance receivables in repossession (1) (3) (2) Q2 Q2 ($M) 2012 2013 Earnings Before Tax 217 254 Total Loan and Lease Originations 1,884 3,301 GM as % of GM Financial Loan and Lease Originations 45% 68% Commercial Finance Receivables 128 4,334 Consumer Finance Receivables 10,441 18,617 Consumer Finance Delinquencies (>30 days) 5.6% 4.8% Annualized Net Credit Losses as % of Avg. Consumer Finance Receivables 1.5% 1.4%

Info Item: Fully Diluted EPS Calculation Note: Results may not foot due to rounding S7
