Attached files
EXHIBIT 99.2

* Second Quarter 2013 Conference Call July 23, 2013

* Forward-Looking Statements This presentation contains forward-looking statements within the meaning of Section 27A of the Securities Act of 1933 and Section 21E of the Securities Exchange Act of 1934. All such statements, other than statements of historical fact, are “forward-looking statements” within the meaning of the Private Securities Litigation Reform Act of 1995, including, without limitation, any projections of financial items; projections of contracting services activity; future operations expenditures; projections of utilization; any statements of the plans, strategies and objectives of management for future operations; any statements concerning developments; any statements regarding future economic conditions or performance; any statements of expectation or belief; and any statements of assumptions underlying any of the foregoing. These statements involve certain assumptions we made based on our experience and perception of historical trends, current conditions, expected future developments and other factors we believe are reasonable and appropriate under the circumstances. The forward-looking statements are subject to a number of known and unknown risks, uncertainties and other factors that could cause our actual results to differ materially. The risks, uncertainties and assumptions referred to above include the performance of contracts by suppliers, customers and partners; actions by governmental and regulatory authorities; operating hazards and delays; our ultimate ability to realize current backlog; employee management issues; local, national and worldwide economic conditions; complexities of global political and economic developments; geologic risks; volatility of oil and gas prices and other risks described from time to time in our reports filed with the Securities and Exchange Commission (“SEC”), including the Company’s most recently filed Annual Report on Form 10-K and in the Company’s other filings with the SEC. Free copies of the reports can be found at the SEC’s website, www.SEC.gov. You should not place undue reliance on these forward-looking statements which speak only as of the date of this presentation and the associated press release. We assume no obligation or duty and do not intend to update these forward-looking statements except as required by the securities laws.

* Presentation Outline Executive Summary Summary of Q2 2013 Results (pg. 4) Operational Highlights by Segment Contracting Services (pg. 9) Key Balance Sheet Metrics (pg. 14) 2013 Outlook (pg. 17) Non-GAAP Reconciliations (pg. 21) Questions & Answers UHD ROV mobilizing in the Gulf of Mexico

* Executive Summary *

* Executive Summary ($ in millions, except per share data) Q2 2012 includes: $14.1 million asset impairment charge related to the Intrepid; $6.9 million ARO increase related to our non-domestic oil and gas property located in the North Sea. See non-GAAP reconciliation on slide 22.

* Executive Summary Q2 2013 earnings per share of $0.26 per diluted share compared with $0.02 per diluted share in Q1 2013 Contracting Services and Production Facilities Skandi Constuctor (chartered vessel) entered Well Intervention fleet in Q2 93% utilization of Well Intervention vessels; outlook remains strong for the remainder of 2013 and beyond Robotics chartered vessel utilization improved to 98% in Q2 Closed the previously announced sale transactions involving our pipelay assets (the Caesar in June and Express in July)

* Executive Summary Balance sheet Cash and cash equivalents decreased to $514 million at 06/30/2013 from $626 million at 03/31/2013 Repaid term loan and revolver borrowings during Q2 ($150 million) $108 million in pre-tax proceeds from the sale of the Caesar in June 2013 offset by aforementioned payments on term loan and revolver Liquidity* at $1.1 billion at 06/30/2013 Net debt decreased to $35 million at 06/30/2013 from $72 million at 03/31/2013 See updated maturity profile on slide 15 In June 2013 we entered into new $900 million credit agreement consisting of $600 million revolving credit facility and a $300 million term loan (5 year term) On July 22, 2013 we redeemed all of the remaining $275 million of 9.5% Senior Unsecured Notes outstanding using the $300 million Term Loan proceeds that we received in July Liquidity, as we define it, is equal to cash and cash equivalents ($514 million), plus available capacity under our revolving credit facility ($579 million).

* Operational Highlights *
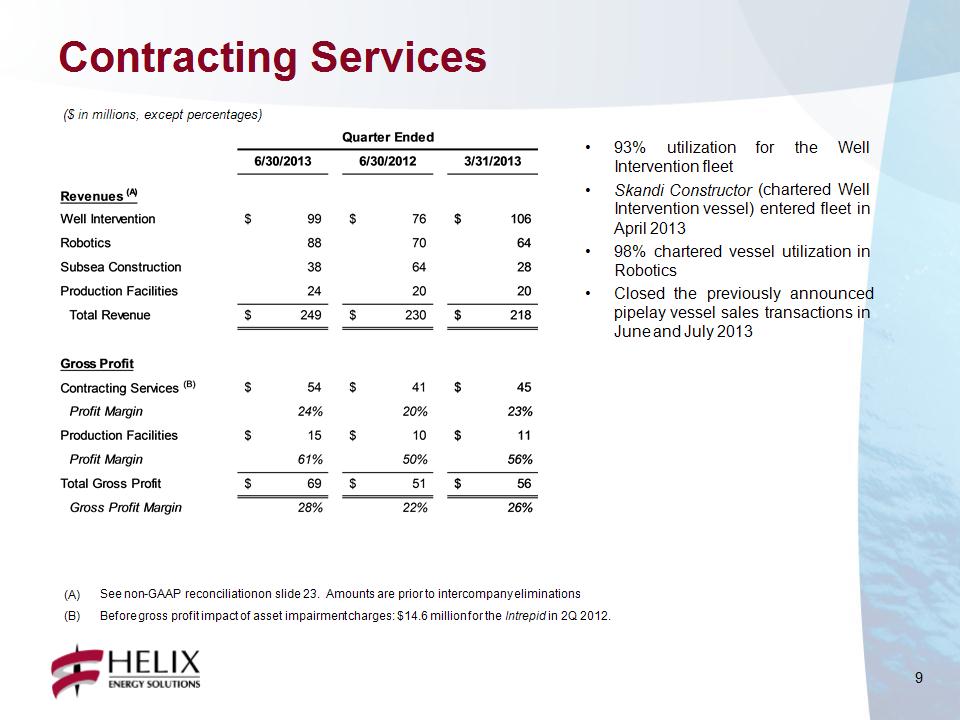
* ($ in millions, except percentages) See non-GAAP reconciliation on slide 23. Amounts are prior to intercompany eliminations. Before gross profit impact of asset impairment charges: $14.6 million for the Intrepid in 2Q 2012. 93% utilization for the Well Intervention fleet Skandi Constructor (chartered Well Intervention vessel) entered fleet in April 2013 98% chartered vessel utilization in Robotics Closed the previously announced pipelay vessel sales transactions in June and July 2013 Contracting Services

* GOM Q4000 86% utilized during Q2; downtime for inspections and maintenance IRS no. 2 on hire starting June 1, 2013 for the remainder of 2013 Helix 534 now expected to commence operating in the Gulf of Mexico in late Q4 with full backlog for remainder of 2013, 2014, and extending into 2017 Negotiations on-going to extend Q4000 commitments into 2018 North Sea 95% utilization across all 3 vessels during Q2 on various well intervention and ROV support projects Skandi Constructor is currently being upgraded to receive its new intervention system for deployment in the UK and W. Africa All vessels fully booked through 2014, with commitments extending into 2015 Contracting Services – Well Ops Intervention Riser System undergoing testing

* 98% chartered vessel utilization in Q2 Four vessels under long-term charter, plus five vessels of opportunity 61% utilization for ROVs, trenchers, and ROVDrills Deep Cygnus performing ROVDrill project for Statoil in Norway Grand Canyon achieved 97% utilization performing both trenching and ROV services projects in the North Sea Olympic Triton continued various scopes of work in Brazil throughout the quarter Awarded 18-month contract extension for ROV services project in India utilizing the Olympic Canyon Awarded multi-year contract to deploy two work class ROVs commencing Q3 2013 Integrated two new 200hp work class ROVs onboard newbuild vessel REM Installer Three-year charter commenced in July 2013 Immediately went to work on an accommodations project in the North Sea Contracting Services – Robotics Renderings of T1500 seabed trenching ROV

* Express had 100% utilization in Q2 working in the GOM Sale of the Caesar was completed on June 17th Sale of the Express was completed on July 17th Entered into an agreement to sell Ingleside shorebase facilities to EMAS-AMC (closing expected in January 2014) Contracting Services – Subsea Construction Express at work in the Gulf of Mexico
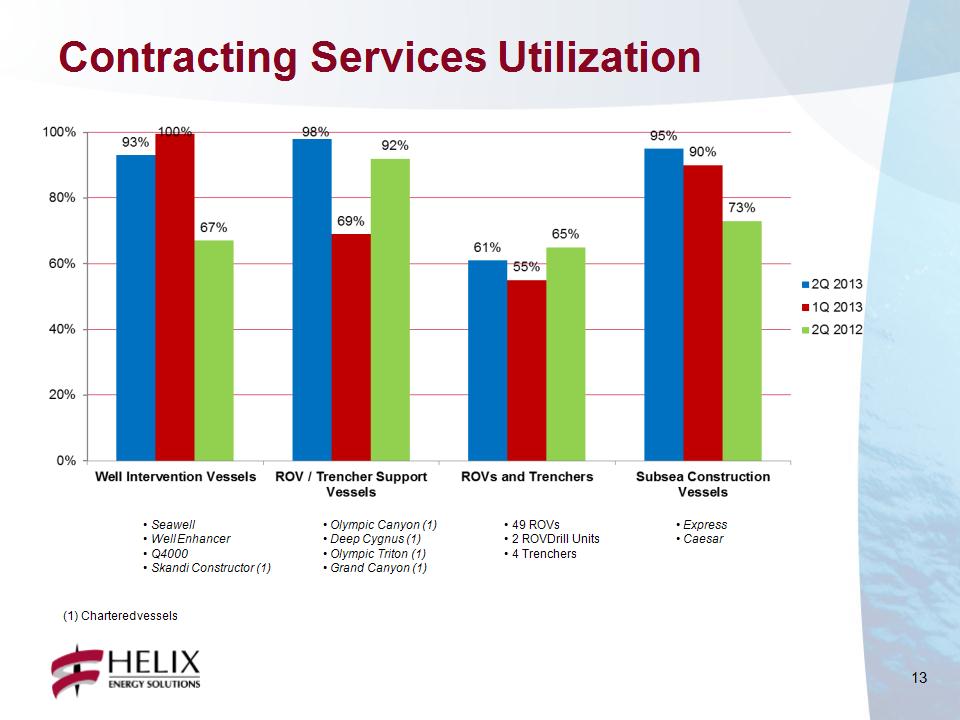
* Express Caesar Olympic Canyon (1) Deep Cygnus (1) Olympic Triton (1) Grand Canyon (1) Seawell Well Enhancer Q4000 Skandi Constructor (1) 49 ROVs 2 ROVDrill Units 4 Trenchers (1) Chartered vessels Contracting Services Utilization

* Key Balance Sheet Metrics *

* Total funded debt of $603 million at end of Q2 2013 (Pro forma retirement of senior notes): $200 million Convertible Senior Notes – 3.25% (A) ($171 million net of unamortized debt discount) $300 million Term Loan – LIBOR + 2.75% Annual amortization payments of 5% in years 1 and 2, 10% per annum in years 3 through 5 $103 million MARAD Debt – 4.93% Semi-annual payments toward principal Convertible Notes Term Loan MARAD Debt Debt Maturity Profile Stated maturity 2032. First put / call date – March 2018.

* Liquidity of approximately $1.1 billion at 6/30/2013 ($ amounts in millions) Includes impact of unamortized debt discount under our convertible senior notes. Liquidity, as we define it, is equal to cash and cash equivalents ($514 million), plus available capacity under our revolving credit facility ($579 million). Pro forma July 2013 balance reflects cash proceeds of $80 million from the sale of the Express and $300 million in proceeds received from the Term Loan, less $282 million used to retire the remaining Senior Unsecured Notes outstanding. Debt and Liquidity Profile

* 2013 Outlook *

* 2013 Outlook ($ in millions) 2013 Outlook and 2012 Actual includes $32 million and $367 million, respectively, from Oil and Gas discontinued operations. 2013 Outlook excluding Subsea Construction and Oil and Gas, plus expected annualized contribution from Helix 534 and chartered Skandi Constructor vessel.
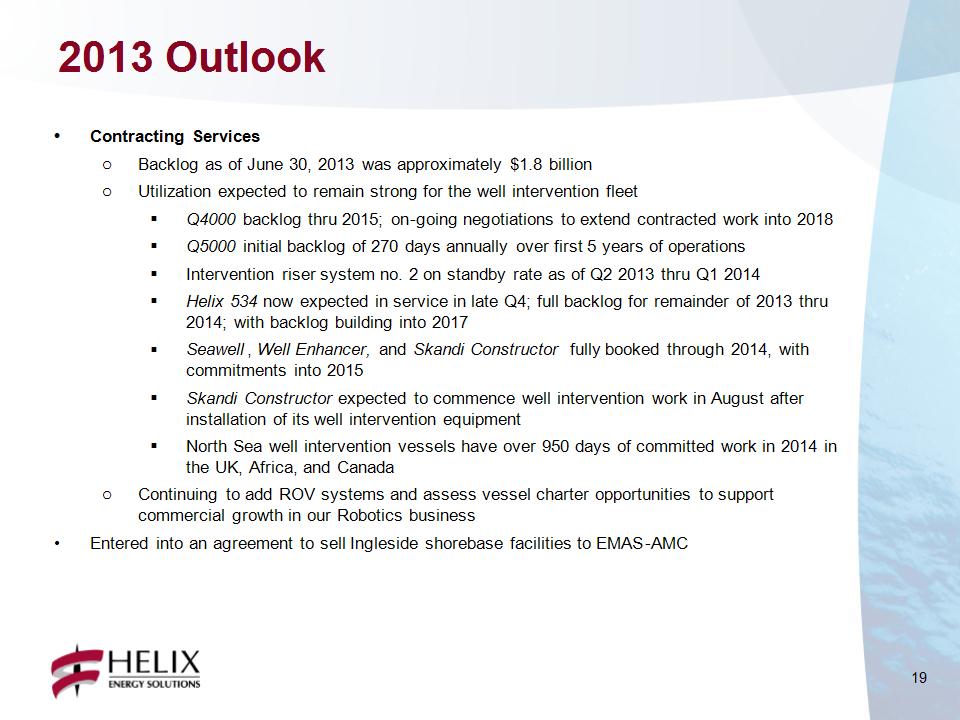
* 2013 Outlook Contracting Services Backlog as of June 30, 2013 was approximately $1.8 billion Utilization expected to remain strong for the well intervention fleet Q4000 backlog thru 2015; on-going negotiations to extend contracted work into 2018 Q5000 initial backlog of 270 days annually over first 5 years of operations Intervention riser system no. 2 on standby rate as of Q2 2013 thru Q1 2014 Helix 534 now expected in service in late Q4; full backlog for remainder of 2013 thru 2014; with backlog building into 2017 Seawell, Well Enhancer, and Skandi Constructor fully booked through 2014, with commitments into 2015 Skandi Constructor expected to commence well intervention work in August after installation of its well intervention equipment North Sea well intervention vessels have over 950 days of committed work in 2014 in the UK, Africa, and Canada Continuing to add ROV systems and assess vessel charter opportunities to support commercial growth in our Robotics business Entered into an agreement to sell Ingleside shorebase facilities to EMAS-AMC

* 2013 Outlook – Capex Capital Expenditures Contracting Services (approximately $365 million in 2013) $59 million incurred in Q2, $121 million year to date Q5000 new build (approximately $135 million in 2013) On schedule for delivery in 2015 Helix 534 continues conversion in Singapore into a well intervention vessel Updated estimate of $206 million for vessel, conversion and intervention riser system (approximately $39 million remaining be incurred in 2013) Now expected to deploy vessel in the Gulf of Mexico in late Q4 2013 Approximately $43 million for intervention riser system and deck modifications for the Skandi Constructor (approximately $13 million remaining to be incurred in 2013) Continued incremental investment in Robotics business Maintenance capital for Seawell life extension and Helix Producer I dry dock

* Non-GAAP Reconciliations *

* Non-GAAP Reconciliations We calculate Adjusted EBITDA from continuing operations as earnings before net interest expense and other, taxes, depreciation and amortization. Adjusted EBITDAX is Adjusted EBITDA from continuing operations plus the earnings of our former oil and gas business before net interest expense and other, taxes, depreciation and amortization, and exploration expense. These non-GAAP measures are useful to investors and other internal and external users of our financial statements in evaluating our operating performance; they are widely used by investors in our industry to measure a company’s operating performance without regard to items which can vary substantially from company to company, and help investors meaningfully compare our results from period to period. Adjusted EBITDA from continuing operations and Adjusted EBITDAX should not be considered in isolation or as a substitute for, but instead is supplemental to, income from operations, net income and other income data prepared in accordance with GAAP. Non-GAAP financial measures should be viewed in addition to, and not as an alternative to our reported results prepared in accordance with GAAP. Users of this financial information should consider the types of events and transactions which are excluded from this measure. ($ in millions)

* Non-GAAP Reconciliations ($ in millions)

* * Follow Helix ESG on Twitter: www.twitter.com/Helix_ESG Join the discussion on LinkedIn: www.linkedin.com/company/helix