Attached files
| file | filename |
|---|---|
| 8-K - FORM 8-K - PUBLIC SERVICE ENTERPRISE GROUP INC | d570806d8k.htm |
 Forward Looking Statement
EXHIBIT 99
3 |
 GAAP Disclaimer
PSEG presents Operating Earnings in addition to its Income from Continuing
Operations/Net Income reported in accordance with accounting principles
generally accepted in the United States (GAAP). Operating Earnings
is a non- GAAP financial measure that differs from Net Income because
it excludes gains or losses associated with Nuclear Decommissioning
Trust (NDT), Mark-to-Market (MTM) accounting, and other material
one-time items. PSEG presents Operating Earnings because
management believes that it is appropriate for investors to consider
results excluding these items in addition to the results reported in
accordance with GAAP. PSEG believes that the non-GAAP financial
measure of Operating Earnings provides a consistent and comparable
measure of performance of its businesses to help shareholders understand
performance trends. This information is not
intended to be viewed as an alternative to GAAP
information. The last slide in this presentation includes a list
of items excluded
from Income from Continuing Operations/Net Income to reconcile to Operating
Earnings, with a reference to that slide included on each of the
slides where the
non-GAAP information appears.
4 |
 2013 Operating Earnings Guidance
$2.74
$2.44
$2.25 -
$2.50 E
2011 Operating Earnings*
2012 Operating Earnings*
2013 Guidance
* SEE PAGE A FOR ITEMS EXCLUDED FROM INCOME FROM CONTINUING
OPERATIONS/NET INCOME TO RECONCILE TO OPERATING
EARNINGS. E = ESTIMATE.
9 |
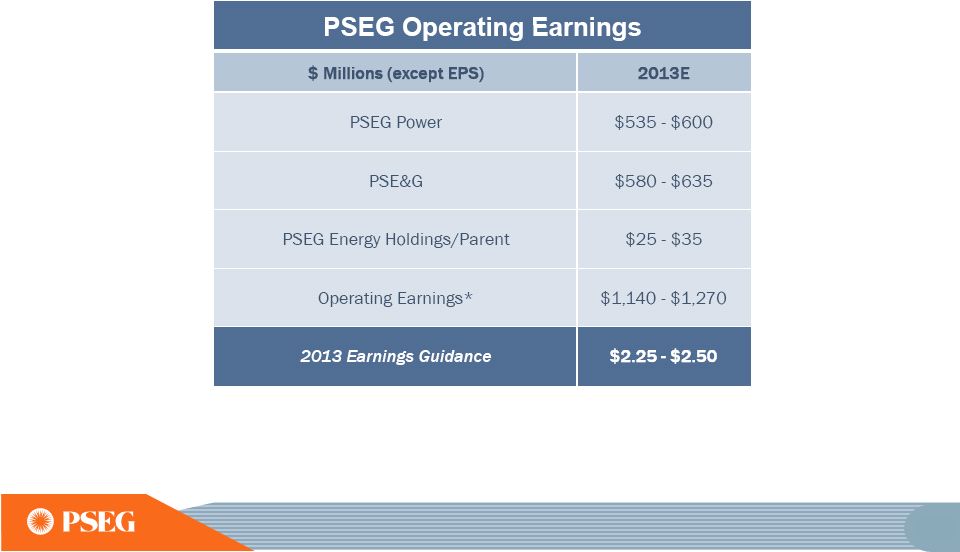
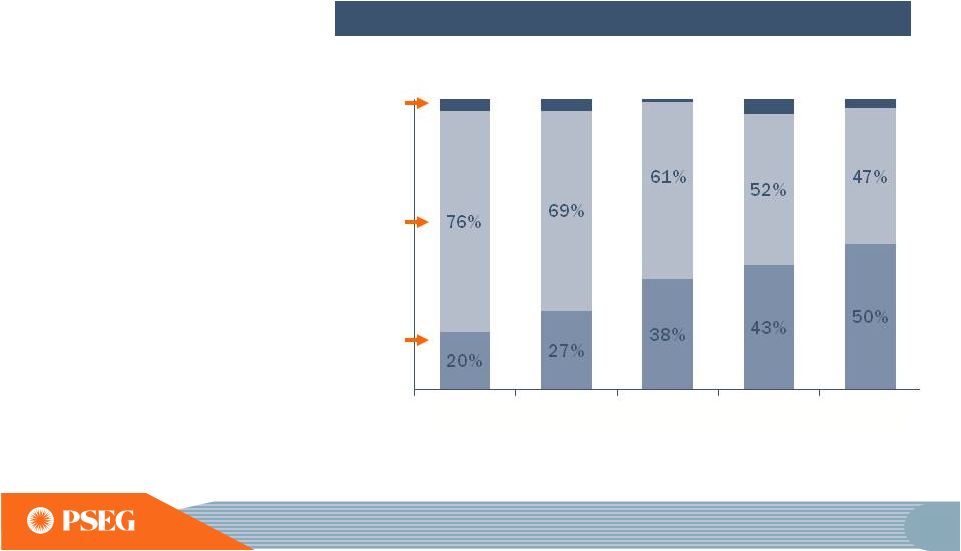 2013 Operating Earnings
*
*SEE PAGE A FOR ITEMS EXCLUDED FROM INCOME FROM CONTINUING OPERATIONS/NET
INCOME TO RECONCILE TO OPERATING EARNINGS; ALL PERIODS REFLECT TEXAS IN
DISCONTINUED OPERATIONS. E=ESTIMATE. Investment in the
regulated business
has changed the
earnings mix
Our 2009-2013
investment focus has
brought us to a 50/50
mix for 2013
PSE&G’s 2013-2017
Energy Strong Program
and ongoing transmission
investments will support
continued growth in
PSE&G’s earnings
Percent of Operating Earnings Contribution by Subsidiary
PSE&G
Power
Other
$2.74
$2.44
$2.25 -$2.50E
$3.09
$3.12
10
2009
2010
2011
2012
2013E |
 54 local NJ towns and 5 counties
support
•
54 municipalities and five counties (Bergen, Hudson, Mercer,
Passaic and Somerset) have approved resolutions in support
of Energy Strong, PSE&G’s infrastructure proposal to improve
and fortify its electric and gas distribution systems
•
The Energy Strong proposal is currently being evaluated by
the NJ Board of Public Utilities
16 |
 Providing
solutions
for
New Jersey’s
energy and
economic
development
goals
($ Millions)
Approval
Date
Forecast
Amount*
Spending
Thru 2012
Remaining
Spending
Renewables
Solar Loan I & II
April 2008/
November
2009
$243
$209
34
Solar 4 All
July 2009
456
437
19
Energy Efficiency
Carbon Abatement
December
2008
45
45
-
Energy Efficiency
Economic Stimulus
July 2009
161
156
5
Demand Response
July 2009
35
27
8
Energy Efficiency
Economic Stimulus
Extension
July 2011
95
14
81
Distribution
NJ Capital Infrastructure
Program 1 (CIP 1)
April 2009
702
702
-
NJ Capital Infrastructure
Program 2 (CIP 2)
July 2011
273
253
20
Total
$2,010
$1,843
$167
* THIS FORECAST DOES NOT REFLECT THE IMPACT OF A RECENTLY APPROVED
AGREEMENT FOR SL3 AND S4AE. DATA AS OF MARCH 31, 2013.
33 |
 PSE&G’s capital program will continue to be
focused on delivering energy solutions to meet New Jersey’s
public policy
PSE&G’s Capital Expenditures
35
0
500
1,000
1,500
2,000
2,500
2009
2010
2011
2012
2013E
2014E
2015E
2016E
2017E
Transmission Hardening
Proposed Filings*
Approved Solar/Energy Efficiency
Transmission
Gas Distribution
Electric Distribution
* PROPOSED FILINGS INCLUDE EE4A, SL3, S4AE, AND ENERGY STRONG (ES). DATA
AS OF MARCH 31, 2013. E = ESTIMATE |
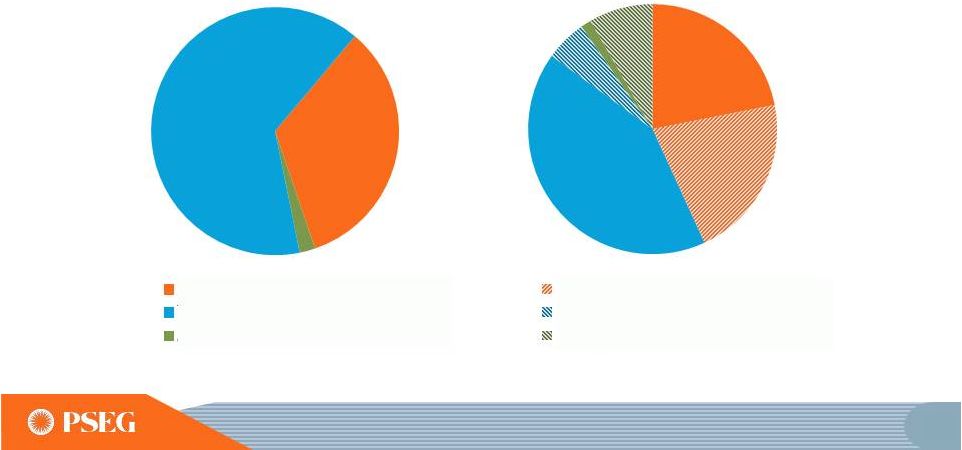 2013-2017 proposed investment plan
would grow our current capital plan by up to 50%
2013-2017E Capital Expenditures
* Distribution ES and Transmission Hardening extend 10 years
*
*
DATA AS OF MARCH 31, 2013. E = ESTIMATE
36
34%
2%
64%
Distribution
Distribution ES Filing
Transmission
Transmission Hardening
Approved Solar/Energy Efficiency
Solar/Energy Efficiency Filings
22%
21%
42%
6%
1%
8%
Existing Plan
$6.9 Billion
Existing Plan and Proposed Filings
$10.6 Billion |
 PSE&G’s proposed investments would be
recovered through contemporaneous recovery mechanisms
DATA AS OF MARCH 31, 2013. E = ESTIMATE
37
2013
-
2017E Capital Spending by Recovery Method
Energy Strong Filing (ES)
Solar/Energy Efficiency
Clauses
FERC Formula Rates
Distribution Base Rates
21%
10%
47%
22%
$10.6 Billion
Contemporaneous Recovery Mechanisms
Traditional Recovery Mechanisms |
 PSE&G is continuing to provide solutions
to assist New Jersey in achieving its EMP goals
The NJBPU approved the Solar Agreement reached with BPU Staff
and certain other parties on May 29
The agreement provides for investment of $446 million over a
3-year period, and a return on equity of 10%
Solar Agreement Approved
46 |
 PSE&G’s 2013 operating earnings
is benefiting from transmission growth and
cost containment initiatives
E = ESTIMATE
*SEE SLIDE A FOR ITEMS EXCLUDED FROM INCOME FROM CONTINUING OPERATIONS/NET
INCOME TO RECONCILE TO OPERATING EARNINGS.
48
$528
2012
2013 Guidance
PSE&G Operating Earnings*
($ Millions)
$580 -
$635E |
 Maintaining 2013 operating earnings guidance
E = ESTIMATE
*SEE SLIDE A FOR ITEMS EXCLUDED FROM INCOME FROM CONTINUING
OPERATIONS/NET INCOME TO RECONCILE TO OPERATING EARNINGS.
90 |
 PSEG Summary
•
Maintaining
2013
operating
earnings
guidance
of
$2.25
-
$2.50
per share, with earnings mix shifting to ~50% regulated
•
Double digit operating earnings growth at PSE&G starting in 2013,
and continuing through 2015 driven by transmission investments
and approved programs
•
Power’s continued focus on operational excellence, market expertise
and financial strength reduces risk in low price environment
•
Strong Balance Sheet and Cash Flow support full capital program
without the need for equity
•
Long history of returning cash to the shareholder through the
common dividend, with opportunity for further growth
103 |
 New Jersey Board of Public Utilities (BPU)
•
The Board of Public Utilities consists of five commissioners
appointed by the Governor. These appointees are confirmed by the
NJ Senate for six-year, staggered terms. The Governor appoints one
of the five to serve as Commission President.
Currently, the commissioners are:
•
Robert M. Hanna, Commission President
•
Jeanne M. Fox
•
Joseph L. Fiordaliso
•
Mary-Anna Holden
•
Dianne Solomon
•
Stefanie Brand, Director of the N.J. Division of Rate Counsel
110 |
   Items Excluded from Income from Continuing
Operations/Net Income to Reconcile to Operating Earnings
Three Months Ended
March 31,
2013
2012
2012
2011
2010
2009
2008
Earnings Impact ($ Millions)
Gain (Loss) on Nuclear Decommissioning Trust (NDT)
Fund Related Activity (PSEG Power)
9
$
5
$
52
$
50
$
46
$
9
$
(71)
$
Gain (Loss) on Mark-to-Market (MTM) (PSEG Power)
(105)
52
(10)
107
(1)
(11)
14
Lease Transaction Activity (Energy Holdings)
-
4
36
(173)
-
29
(490)
Storm O&M (PSEG Power)
(17)
-
(39)
-
-
-
-
Market Transition Charge Refund (PSE&G)
-
-
-
-
(72)
-
-
Gain (Loss) on Asset Sales and Impairments (Energy Holdings)
-
-
-
34
-
-
(13)
Total Pro-forma adjustments
(113)
$
61
$
39
$
18
$
(27)
$
27
$
(560)
$
Fully Diluted Average Shares Outstanding (in Millions)
507
507
507
507
507
507
508
Per Share Impact (Diluted)
Gain (Loss) on NDT Fund Related Activity (PSEG Power)
0.02
$
0.01
$
0.10
$
0.10
$
0.09
$
0.02
$
(0.14)
$
Gain (Loss) on MTM (PSEG Power)
(0.21)
0.10
(0.02)
0.21
-
(0.02)
0.03
Lease Transaction Activity (Energy Holdings)
-
0.01
0.07
(0.34)
-
0.05
(0.96)
Storm O&M (PSEG Power)
(0.03)
-
(0.08)
-
-
-
-
Market Transition Charge Refund (PSE&G)
-
-
-
-
(0.14)
-
-
Gain (Loss) on Asset Sales and Impairments (Energy Holdings)
-
-
-
0.06
-
-
(0.03)
Total Pro-forma adjustments
(0.22)
$
0.12
$
0.07
$
0.03
$
(0.05)
$
0.05
$
(1.10)
$
For the Year Ended
December 31,
(Unaudited)
Pro-forma Adjustments, net of tax
A
PLEASE SEE PAGE 3 FOR AN EXPLANATION OF PSEG’S USE OF OPERATING
EARNINGS AS A NON-GAAP FINANCIAL MEASURE AND HOW IT DIFFERS FROM
INCOME FROM CONTINUING OPERATIONS/NET INCOME. |