Attached files
| file | filename |
|---|---|
| EX-1.1 - EX-1.1 - Del Frisco's Restaurant Group, Inc. | d565097dex11.htm |
| EX-23.1 - EX-23.1 - Del Frisco's Restaurant Group, Inc. | d565097dex231.htm |
Table of Contents
As filed with the Securities and Exchange Commission on July 16, 2013
Registration No. 333-
UNITED STATES
SECURITIES AND EXCHANGE COMMISSION
Washington, D.C. 20549
FORM S-1
REGISTRATION STATEMENT
UNDER
THE SECURITIES ACT OF 1933
DEL FRISCO’S RESTAURANT GROUP, INC.
(Exact name of registrant as specified in its charter)
| Delaware | 5812 | 20-8453116 | ||
| (State or other jurisdiction of incorporation or organization) |
(Primary Standard Industrial Classification Code Number) |
(I.R.S. Employer Identification Number) |
930 S. Kimball Ave., Suite 100
Southlake, TX 76092
(817) 601-3421
(Address, including zip code, and telephone number, including area code, of registrant’s principal executive offices)
Mark S. Mednansky
Chief Executive Officer
Del Frisco’s Restaurant Group, Inc.
930 S. Kimball Ave., Suite 100
Southlake, TX 76092
(817) 601-3421
(Name, address, including zip code, and telephone number, including area code, of agent for service)
Copies to:
| Jeffrey A. Chapman Peter W. Wardle Gibson, Dunn & Crutcher LLP 2100 McKinney Ave., Suite 1100 Dallas, TX 75201 tel: (214) 698-3100 fax: (214) 571-2900 |
Colin J. Diamond White & Case LLP 1155 Avenue of the Americas New York, NY 10036 tel: (212) 819-8200 fax: (212) 354-8113 |
Approximate date of commencement of proposed sale to the public: As soon as practicable after the effective date of this registration statement.
If any of the securities being registered on this form are to be offered on a delayed or continuous basis pursuant to Rule 415 under the Securities Act of 1933, check the following box: ¨
If this form is filed to register additional securities for an offering pursuant to Rule 462(b) under the Securities Act, check the following box and list the Securities Act registration statement number of the earlier effective registration statement for the same offering: ¨
If this form is a post-effective amendment filed pursuant to Rule 462(c) under the Securities Act, check the following box and list the Securities Act registration statement number of the earlier effective registration statement for the same offering. ¨
If this form is a post-effective amendment filed pursuant to Rule 462(d) under the Securities Act, check the following box and list the Securities Act registration statement number of the earlier effective registration statement for the same offering: ¨
Indicate by check mark whether the registrant is a large accelerated filer, an accelerated filer, a non-accelerated filer, or a smaller reporting company. See the definitions of “large accelerated filer,” “accelerated filer” and “smaller reporting company” in Rule 12b-2 of the Exchange Act. (Check one):
| Large accelerated filer | ¨ | Accelerated filer | ¨ | |||
| Non-accelerated filer | x (Do not check if a smaller reporting company) | Smaller reporting company | ¨ | |||
CALCULATION OF REGISTRATION FEE
|
| ||||||||
| Title of Each Class of Securities to be Registered |
Amount to be Registered(1) |
Proposed Maximum Offering Price |
Proposed Maximum Aggregate Offering Price(1)(2) |
Amount of Registration Fee | ||||
| Common Stock, par value $0.001 per share |
5,750,000 | $21.84 | $125,580,000 | $17,130 | ||||
|
| ||||||||
|
| ||||||||
| (1) | Includes 750,000 shares that the underwriters have the option to purchase. See “Underwriting.” |
| (2) | Estimated solely for the purpose of calculating the registration fee under Rule 457(c) of the Securities Act of 1933, as amended, based on the average of the high and low prices of a share of common stock on the Nasdaq Global Select Market on July 10, 2013, which was $21.84. |
The Registrant hereby amends this Registration Statement on such date or dates as may be necessary to delay its effective date until the Registrant shall file a further amendment which specifically states that this Registration Statement shall thereafter become effective in accordance with Section 8(a) of the Securities Act of 1933 or until the Registration Statement shall become effective on such date as the Commission, acting pursuant to said Section 8(a), may determine.
Table of Contents
The information in this preliminary prospectus is not complete and may be changed. The selling stockholder may not sell these securities until the registration statement filed with the Securities and Exchange Commission is declared effective. This preliminary prospectus is not an offer to sell these securities and it is not soliciting an offer to buy these securities in any state where the offer or sale is not permitted.
Subject to Completion, Dated July 16, 2013

Del Frisco’s Restaurant Group, Inc.
5,000,000 Shares
Common Stock
The selling stockholder identified in this prospectus is offering 5,000,000 shares of our common stock. We will not receive any proceeds from the sale of shares by the selling stockholder.
Our common stock is listed on the Nasdaq Global Select Market under the symbol “DFRG.” We are an “emerging growth company” under applicable Securities and Exchange Commission rules and are therefore subject to reduced public company reporting requirements. On July 15, 2013, the last reported sales price of a share of our common stock on the Nasdaq Global Select Market was $22.59.
Investing in our common stock involves risk. See “Risk Factors” beginning on page 13.
Neither the Securities and Exchange Commission nor any state securities commission has approved or disapproved of these securities or passed upon the adequacy or accuracy of this prospectus. Any representation to the contrary is a criminal offense.
| Per Share | Total | |||||||
| Public offering price |
$ | $ | ||||||
| Underwriting discounts and commissions(1) |
$ | $ | ||||||
| Proceeds, before expenses, to the selling stockholder |
$ | $ | ||||||
| (1) | See “Underwriting” for a description of the compensation payable to the underwriters. |
The selling stockholder identified in this prospectus has granted the underwriters an option to purchase up to 750,000 additional shares of common stock. We will not receive any proceeds from the sale of shares by the selling stockholder.
The underwriters expect to deliver the shares of common stock to purchasers on , 2013.
| Deutsche Bank Securities | Piper Jaffray | Wells Fargo Securities |
| Cowen and Company | Raymond James |
The date of this prospectus is , 2013.
Table of Contents
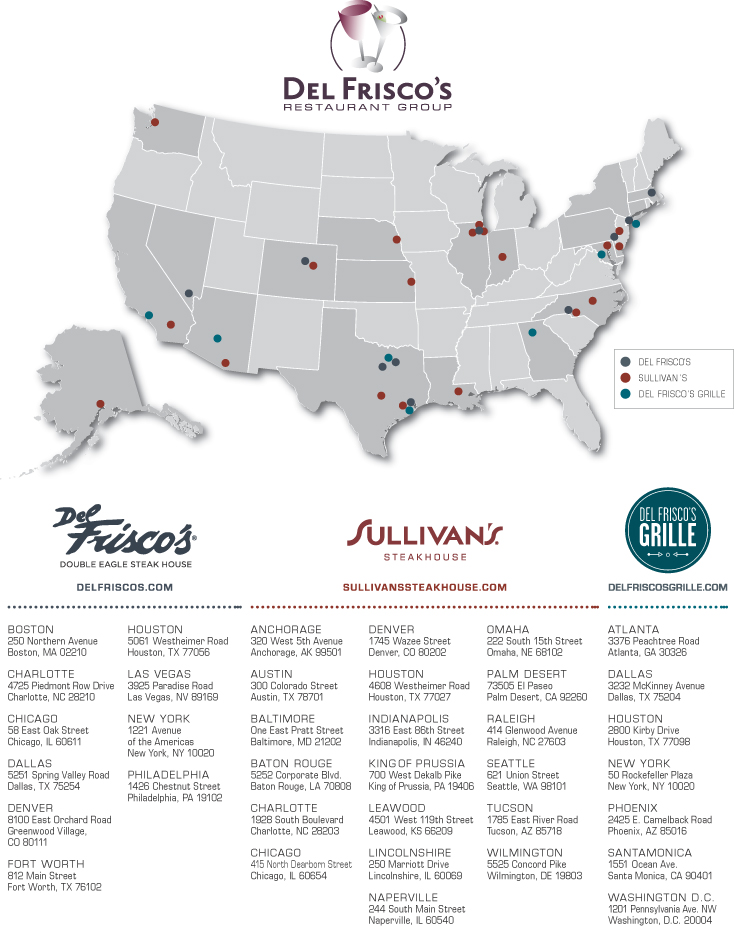
Table of Contents
Market and Industry Data and Forecasts
Industry, market and demographic data appearing throughout this prospectus, including information relating to our relative position in the restaurant industry, the projected growth of sales in the U.S. restaurant industry, projected changes in food expenditures and projected changes in the U.S. population, are derived principally from publicly available information, industry publications, U.S. government data, data made available by market research firms, our own data and similar sources, which we believe to be reasonable. None of the independent industry publications used in this prospectus was prepared on our or our affiliates’ behalf. Information in this prospectus concerning the average check at our restaurants is calculated on a per entrée basis and excludes tax and tip.
Table of Contents
This summary highlights information contained elsewhere in this prospectus. This summary does not contain all of the information that may be important to you. You should carefully read this prospectus in its entirety before making an investment decision. In particular, you should read the section entitled “Risk Factors” and the consolidated and combined financial statements and notes related to those statements included elsewhere in this prospectus.
As used in this prospectus, unless the context otherwise indicates, the references to “DFRG,” “Del Frisco’s Restaurant Group,” “our company,” “the Company,” “us,” “we” and “our” refer to Del Frisco’s Restaurant Group, Inc. and its consolidated subsidiaries. Unless otherwise indicated or the context otherwise requires, financial and operating data in this prospectus reflects the consolidated business and operations of Del Frisco’s Restaurant Group, Inc. and its wholly-owned subsidiaries.
Our Company
We develop, own and operate three contemporary, high-end, complementary restaurants: Del Frisco’s Double Eagle Steak House, or Del Frisco’s, Sullivan’s Steakhouse, or Sullivan’s, and Del Frisco’s Grille, or the Grille. We are a leader in the full-service steakhouse industry based on average unit volume, or AUV, EBITDA margin and comparable restaurant sales growth. We currently operate 36 restaurants in 19 states. Each of our three restaurant concepts offers steaks as well as other menu selections, such as chops and fresh seafood. Our Grille concept is designed to appeal to both business as well as upscale casual diners and features relatively less expensive entrées, such as flatbread pizzas, sandwiches and salads. These menu selections are complemented by an extensive, award-winning wine list. Del Frisco’s, Sullivan’s and the Grille are positioned within the fine dining segment and are designed to appeal to both business and local dining customers. Our Del Frisco’s restaurants are sited in urban locations to target customers seeking a “destination dining” experience while our Sullivan’s and Grille restaurants are intended to appeal to a broader demographic, allowing them to be located either in urban areas or in close proximity to affluent residential neighborhoods. We believe our success reflects consistent execution across all aspects of the dining experience, from the formulation of proprietary recipes to the procurement and presentation of high quality menu items and delivery of a positive customer experience.
We generated revenues of $232.4 million for the fiscal year ended December 25, 2012, representing 17.0% total revenue growth and 4.2% comparable restaurant sales growth over 2011. We recorded net income of $13.8 million and adjusted EBITDA of $43.0 million for 2012, representing 53.3% net income growth and 18.1% adjusted EBITDA growth over 2011. Our 2012 operating income and adjusted EBITDA margins were 10.7% and 18.5%, respectively. We generated revenues of $120.2 million for the 24 weeks ended June 11, 2013, representing 15.9% total revenue growth and 1.0% comparable restaurant sales growth over the 24 weeks ended June 12, 2012. We recorded net income of $8.0 million and adjusted EBITDA of $20.0 million for the 24 weeks ended June 11, 2013, representing a 7.1% and 2.7% decrease in net income and adjusted EBITDA, respectively, as compared to the 24 weeks ended June 12, 2012. Our operating income and adjusted EBITDA margins for the 24 weeks ended June 11, 2013 were 9.9% and 16.6%, respectively. For a reconciliation of adjusted EBITDA and adjusted EBITDA margin and a discussion of why we consider them useful, see “—Summary Historical Consolidated Financial and Operating Data.”
1
Table of Contents
Del Frisco’s Double Eagle Steak House
We believe Del Frisco’s is one of the premier steakhouse concepts in the United States. The Del Frisco’s brand is defined by its menu, which includes USDA Prime grade, wet-aged steaks hand-cut at the time of order and a range of other high-quality offerings, including prime lamb, fresh seafood, and signature side dishes and desserts. It is also distinguished by its “swarming service,” whereby customers are served simultaneously by multiple servers. Each restaurant has a sommelier to guide diners through an extensive, award-winning wine list and our bartenders specialize in hand-shaken martinis and crafted cocktails. Del Frisco’s restaurants target customers seeking a full-service, fine dining steakhouse experience. We believe the décor and ambiance, with both contemporary and classic designs, enhance our customers’ experience and differentiate Del Frisco’s from other upscale steakhouse concepts. We currently operate ten Del Frisco’s steakhouses in eight states. These restaurants range in size from 11,000 to 24,000 square feet with seating capacity for at least 300 people. Annual AUVs per Del Frisco’s restaurant were $13.8 million for the fiscal year ended December 25, 2012. During the same period, the average check at Del Frisco’s was $104.
Sullivan’s Steakhouse
Sullivan’s was created in the mid-1990’s as a complementary concept to Del Frisco’s. The Sullivan’s brand is defined by a fine dining experience at a more accessible price point, along with a vibrant atmosphere created by an open kitchen, live music and a bar area designed to be a center for social gathering and entertainment. Each Sullivan’s features fine hand-selected aged steaks, fresh seafood and a broad list of custom cocktails, along with an extensive selection of award-winning wines. We currently operate 19 Sullivan’s steakhouses in 15 states. These restaurants range in size from 7,000 to 11,000 feet with seating capacity for at least 250 people. Annual AUVs per current Sullivan’s restaurant were $4.4 million for the fiscal year ended December 25, 2012. During the same period, the average check at Sullivan’s was $59.
Del Frisco’s Grille
We developed the Grille, our newest concept, to take advantage of the positioning of the Del Frisco’s brand and to provide greater potential for expansion due to its smaller size, lower build out cost and more diverse menu. The Grille is an upscale casual concept with a menu designed to appeal more broadly to both business and casual diners that features a variety of Del Frisco’s prime aged steaks, top selling signature menu items and a broad selection of the same quality wines. The Grille also offers an assortment of relatively less expensive entrées, such as flatbread pizzas, sandwiches and salads, all prepared with the same signature flavors, high quality ingredients and presentation associated with the Del Frisco’s brand. We believe the ambiance of the concept appeals to a wide range of customers seeking a less formal atmosphere for their dining occasions. We currently operate seven Grilles in five states and the District of Columbia. Additional Grille openings are planned over the next year and we anticipate they will, like existing Grille locations, range in size from 6,500 to 8,500 square feet with seating capacity for at least 200 people. We are targeting annual AUVs per Grille restaurant of between $4.5 million and $6.0 million with an average check of between $45 and $55.
Our Business Strengths
We believe the following are key strengths of our business and serve to differentiate us from our competitors:
Multiple Top Performing Concepts with an Expanding National Platform. We are one of the nation’s leading fine dining restaurant operators. We currently have 36 restaurants in
2
Table of Contents
29 cities in 19 states in a wide variety of geographic and demographic markets. Our current locations that were operating throughout the fiscal year ended December 25, 2012 had AUVs of $7.5 million per location across all concepts, $13.8 million at our Del Frisco’s locations ($10.9 million excluding our New York location) and $4.4 million at our Sullivan’s locations. Further, we believe we appeal to landlords with desirable locations by offering three complementary concepts adaptable to a variety of areas and venues. In 2011, we expanded our national platform by opening a Del Frisco’s in Boston, Massachusetts and our first two Grille restaurants in New York City and Dallas, Texas. In 2012, we opened Grilles in Phoenix, Arizona, Washington D.C. and Atlanta, Georgia, and a Del Frisco’s in Chicago, Illinois. In 2013, we have to date opened Grilles in Houston, Texas and Santa Monica, California and expect to open three to four additional Grilles by the end of the year.
Operating Model Driving Higher Margins. Our AUVs and high average check per person, combined with our operating efficiencies, enable us to achieve industry-leading operating margins based on 2012 public company data for U.S. based full-service dining restaurants that generate a majority of their revenues from restaurant operations and excluding companies with a majority of franchised operations. We believe that our success is driven by our consistent execution across all aspects of the dining experience, from the formulation of proprietary recipes to the procurement and presentation of high quality menu items and our focus on providing a positive customer experience. Our entrepreneurial culture and bonus incentives empower and motivate the general manager at each restaurant to act as the owner of his or her restaurant. These general managers meet weekly as a group with senior management to share best practices. Chefs and kitchen staff at each restaurant are responsible for maintaining and ordering their own food inventory, thereby increasing efficiency and reducing waste and the need for additional headcount at the corporate level. We believe we achieve significant cost, quality and availability advantages through centralized sourcing from our primary suppliers of beef, wine and other products. In fiscal 2012, our revenues were comprised 66% of food and 34% of alcohol. We had operating income and restaurant-level EBITDA margins of 10.7% and 24.3% in fiscal 2012 and 9.9% and 23.2% for the 24 weeks ended June 11, 2013, respectively.
Fine Dining Concepts with Complementary Market Positions. Del Frisco’s, Sullivan’s and the Grille are fine dining concepts that share a focus on high quality food, individualized interior design and attentive service. The concepts were designed to coexist with one another, each maintaining its own identity and price point. Average checks at Del Frisco’s and Sullivan’s were $104 and $59, respectively, for the fiscal year ended December 25, 2012, and the targeted average check at the Grille is between $45 and $55. Currently, we operate multiple concepts in close proximity to each other in six of our markets. We believe our complementary positioning will continue to allow us to develop our concepts in a single metropolitan area without competing for customers. We have secured prominent locations for our restaurants and a number of unique sites not typically used for steakhouse locations, including a historic bank building, a redeveloped wharf, a landmark theater building and a former retail space in Rockefeller Center. We believe the locations of our restaurants distinguish us from our competitors, add to the strength of our brands and help drive our AUVs. Furthermore, we believe many landlords and developers seek out our concepts to be restaurant anchors for their developments as our concepts are complementary to upscale national retailers with similar target demographics.
Focus on Innovation. We have developed and created three full-service restaurant concepts. As we have grown our concepts, we have evolved each to incorporate proprietary recipes with bold and flavorful seasonings that reflect our heritage in the Southern United States, extensive wine lists, prominent bar scenes and our “swarming service.” We have
3
Table of Contents
positioned the Del Frisco’s brand as a contemporary alternative to the traditional fine dining steakhouse dining concept. We developed Sullivan’s in the mid-1990’s, featuring lower price points and live music to attract a broader clientele. The Grille, introduced in 2011, leverages and broadens Del Frisco’s appeal in a less formal and smaller format. The Grille has been recognized in the industry as an innovative and exciting new concept, including being honored with Nation’s Restaurant News’ 2012 Hot Concepts Award. We remain committed to evolving our existing concepts to remain relevant to a range of customers.
High Quality Menu Offerings with a Focus on Social Experience and Customer Service. We believe our concepts provide our customers with a true fine dining steakhouse and upscale grille experience by combining high quality food, atmosphere and service. We offer high quality cuisine across all menu items, with an emphasis on aged beef, fresh seafood and locally sourced ingredients. These offerings are complemented by an extensive, award-winning wine list and a broad cocktail selection. The dining experience is enhanced by our commitment to providing a social atmosphere and décor that includes carefully-selected artwork, private dining rooms and separate bar areas. To further enhance our customers’ dining experience we have a staff of highly-trained employees who undergo an extensive training program and are evaluated regularly by management. These employees provide our “swarming service,” which creates frequent interactions with our customers.
Experienced Executive and Restaurant Management Teams. Our executive team has extensive experience with an average of over 20 years in the restaurant industry, including significant tenure with our company as well as other high-end restaurant concepts. Our restaurant-level managers are also very experienced, with average tenure at Del Frisco’s and Sullivan’s of ten and four years, respectively, and additional experience at other fine dining establishments. Our management team, which includes senior management, regional managers and general managers, meets on a weekly basis to review financial and operating results as well as receive feedback from both senior management and their peers to collaborate on best practices. We believe this management process fosters a commitment to operational excellence focused on producing a positive customer experience and strong financial performance.
Our Growth Strategy
We believe there are significant opportunities to grow our business, strengthen our competitive position and enhance our concepts through the continued implementation of the following strategies:
Pursue Disciplined New Unit Expansion. We believe our concepts have significant room to grow. We have an established growth pipeline and a disciplined strategy for opening new restaurants. Our growth strategy includes entering new markets and expanding our presence in existing markets. We believe our concepts’ market positioning, broad range of average checks and menu offerings, coupled with the flexibility of our restaurant models across a range of trade areas and square footage layouts will allow us to expand each of our three concepts into a greater number of locations. We have successfully opened new restaurants in a number of diverse markets. We target a cash-on-cash return beginning in the third operating year of at least 25% for new restaurants across all of our concepts. We believe there are opportunities to open four to six restaurants annually, generally composed of one Del Frisco’s and three to five Sullivan’s and/or Grilles, with new openings of our Grille concept likely serving as the primary driver of new unit growth in the near term. In 2012, we opened Grilles in Phoenix, Arizona, Washington D.C. and Atlanta, Georgia, and a Del Frisco’s in Chicago, Illinois. In 2013, we have to
4
Table of Contents
date opened Grilles in Houston, Texas and Santa Monica, California and expect to open three to four additional Grilles by the end of the year. Beyond domestic new unit growth, although we have no current intention to do so, we believe our concepts have the potential for expansion in select international markets through franchising, licensing, Company-owned restaurants or a combination of the foregoing. While we do not have a specific global expansion strategy and we have no current intention to expand into international markets, we believe there is a long-term opportunity for our concepts beyond the U.S. market.
Grow Our Existing Restaurant Sales. Our concepts achieve strong sales and customer count growth. We have increased comparable restaurant sales in twelve out of the last thirteen quarters, including fourteen consecutive quarterly increases for our Del Frisco’s concept. We believe there are opportunities to continue to increase our sales and average check through maintaining our focus on tableside up-selling and salesmanship by our servers and by strategically adjusting menu prices and enhancing our concepts’ brand awareness through increased marketing efforts. In addition, we are adding seating to select locations, which we believe will increase sales at these restaurants.
Further Grow Our Private Dining Business. We believe we are well-positioned to grow our private dining business due to our commitment to our customers’ dining experience, our unique locations and our plans to invest in improving our private dining facilities at select locations. All of our restaurants can serve large and small groups for private dining events, including corporate events, sales meetings, presentations, charity events and private parties. We are focused on growing our private dining business as it typically has a higher average check per customer and higher overall margins than regular dining room business. Private dining, excluding the Grille, represented approximately 15.3% of our total sales in the fiscal year ended December 25, 2012 as compared to 14.1% in the fiscal year ended December 27, 2011. We intend to drive growth by enhancing our private dining capacity and increasing awareness of our private dining services. To help drive this growth, we are creating additional private dining space at select locations by expanding or reconfiguring existing space. In addition, each location currently dedicates a staff member to increasing its private dining business. At the beginning of 2011, we hired a corporate-wide private dining executive who meets weekly with each restaurant’s private dining coordinator regarding upcoming events and sales initiatives, and during 2012, we hired a national private dining sales coordinator who coordinates private dining for national accounts for all restaurant locations.
Our Equity Sponsor
Lone Star Fund V (U.S.), L.P., which we refer to in this prospectus, along with its affiliates and associates (excluding us and other companies that it or they own as a result of their investment activities), as Lone Star Fund, is a leading U.S. private equity firm. Since 1995, the principals of Lone Star Fund have organized private equity funds totaling approximately $38.5 billion to invest globally in corporate secured and unsecured debt instruments, real estate-related assets and select corporate acquisitions. Lone Star Fund has affiliate offices in Dallas, New York, London, Tokyo, Dublin, Brussels, Luxembourg, Frankfurt, France, Montreal and Bermuda. Immediately prior to this offering, Lone Star Fund owned 13,094,667 shares, or 55.0%, of our outstanding common stock, and it will own 8,094,667 shares, or 34.0%, of our outstanding common stock immediately following the consummation of this offering, assuming the underwriters do not exercise their option to purchase additional shares of common stock.
5
Table of Contents
Conflicts of Interest
Certain conflicts of interest may arise in connection with this offering. Specifically, Lone Star Fund, an affiliate of our controlling stockholder, beneficially owns a majority of our outstanding common stock, which makes us a “controlled company” within the meaning of the NASDAQ corporate governance rules. While Lone Star Fund will no longer beneficially own a majority of our outstanding common stock following the completion of this offering, it will beneficially own approximately 8,094,667 shares, or 34.0%, of our outstanding common stock immediately following the completion of this offering, assuming no exercise of the underwriters’ option to purchase additional shares of common stock, and therefore will continue to have sufficient voting power to significantly affect the outcome of all matters submitted to our stockholders, including a merger, consolidation or other business combination. In addition, the interests of Lone Star Fund and its principals, members, directors, managers, partners, stockholders, officers, employees and other representatives, some of whom serve as our directors, may not always coincide with our interests as a company or the interests of our other stockholders. Neither Lone Star Fund nor these individuals have any duty to refrain from engaging in business that conflicts with ours or to communicate business opportunities to us. As a result, Lone Star Fund may from time to time acquire and hold interests in businesses that compete directly or indirectly with us or pursue acquisition opportunities that may be complementary to our business resulting in those acquisition opportunities not being available to us. See “Risk Factors—Risks Related to this Offering.” We also guarantee five leases for affiliates of Lone Star Fund that are not controlled or managed by our company. At June 11, 2013, the maximum potential amount of future lease payments we could be required to make as a result of the guarantees was $1.8 million. In July 2012, we entered into a transition services agreement with affiliates of Lone Star Fund pursuant to which we are provided certain insurance management, legal and benefits administration services. See “Certain Relationships and Related Party Transactions—Relationships with Lone Star Fund and its Affiliates—Termination of Asset Advisory Agreement.” Finally, we expect that Mr. Mark S. Mednansky, our Chief Executive Officer, and Mr. Thomas J. Pennison, Jr., our Chief Financial Officer, will be paid transaction bonuses of approximately $ and $ , respectively, (or $ and $ , respectively, if the underwriters fully exercise their option to purchase additional shares), by our parent company in connection with this offering, as discussed in greater detail under “Executive Compensation—Payments in Connection with Our Initial Public Offering and this Offering—Transaction Bonuses.”
Corporate Information
Our corporate headquarters is located at 930 S. Kimball Avenue, Suite 100, Southlake, TX 76092, and our telephone number is (817) 601-3421. Our website address is www.dfrg.com, and we also host www.delfriscos.com, www.sullivanssteakhouse.com and www.delfriscosgrille.com. Information contained on our websites or connected thereto does not constitute a part of this prospectus or the registration statement of which it forms a part. DEL FRISCO’S®, SULLIVAN’S®, DEL FRISCO’S GRILLE™ and DEL FRISCO’S RESTAURANT GROUP™, and other trademarks or service marks of ours appearing in this prospectus are the property of Del Frisco’s Restaurant Group, Inc. Other trademarks and service marks appearing in this prospectus are the property of their respective holders.
Summary Risk Factors
An investment in our common stock involves various risks. You should consider carefully the risks discussed below and under “Risk Factors” before purchasing our common stock. If any
6
Table of Contents
of these risks actually occur, our business, financial condition or results of operations may be materially adversely affected. In such case, the trading price of our shares of common stock would likely decline and you may lose all or part of your investment. The following is a summary of some of the principal risks we face:
| • | Changes in general economic conditions, including economic uncertainty, have adversely impacted our business and results of operations and may continue to do so. |
| • | If our restaurants are not able to compete successfully with other restaurants, our business and results of operations may be adversely affected. |
| • | Our future growth depends on our ability to open new restaurants and operate them profitably, and if we are unable to successfully execute this strategy, our results of operations could be adversely affected. |
| • | If we are unable to increase our sales or improve our margins at existing restaurants, our profitability and overall results of operations may be adversely affected. |
| • | The failure to continue to successfully develop our Grille concept may have a material adverse effect on our financial condition and results of operations. |
| • | Our growth, including the continued development of the Grille, may strain our infrastructure and resources, which could delay the opening of new restaurants and adversely affect our ability to manage our existing restaurants. |
| • | Our New York Del Frisco’s location represents a significant portion of our revenues, and any significant downturn in its business or disruption in the operation of this location could harm our business, financial condition and results of operations. |
| • | Negative customer experiences or negative publicity surrounding our restaurants or other restaurants could adversely affect sales in one or more of our restaurants and make our brands less valuable. |
| • | Negative publicity relating to the consumption of beef, including in connection with food-borne illness, could result in reduced consumer demand for our menu offerings, which could reduce sales. |
7
Table of Contents
The Offering
| Common stock offered by the selling stockholder |
5,000,000 shares, or 5,750,000 shares if the underwriters fully exercise their option to purchase additional shares |
| Common stock to be outstanding immediately after this offering |
23,794,667 shares |
| Option to purchase additional shares of common stock |
The selling stockholder has granted the underwriters an option for a period of 30 days to purchase up to 750,000 additional shares of common stock. |
| Use of proceeds |
The selling stockholder will receive all net proceeds from the sale of the shares of common stock to be sold in this offering, and we will not receive any of these proceeds. See “Use of Proceeds,” “Principal and Selling Stockholders” and “Underwriting.” |
| NASDAQ symbol |
“DFRG” |
| Risk factors |
Investment in our common stock involves substantial risks. You should read this prospectus carefully, including the section entitled “Risk Factors” and the consolidated financial statements and the related notes to those statements included elsewhere in this prospectus before investing in our common stock. |
Unless otherwise indicated, this prospectus:
| • | is based upon 23,794,667 shares of common stock outstanding as of July 15, 2013; |
| • | assumes the underwriters do not exercise their option to purchase up to an additional 750,000 shares from the selling stockholder; |
| • | assumes no exercise of options to purchase 851,500 shares of our common stock outstanding as of July 15, 2013, with a weighted average exercise price of $13.37; and |
| • | assumes no issuances of additional options to purchase shares of our common stock or other equity-based awards under our stock incentive plan. |
8
Table of Contents
Summary Historical Consolidated Financial and Operating Data
The following table sets forth, for the periods and dates indicated, our summary historical consolidated financial and operating data. We have derived the summary income statement data for the fiscal years ended December 28, 2010, December 27, 2011 and December 25, 2012 from our audited consolidated financial statements appearing elsewhere in this prospectus. We have derived the summary income statement data for each of the 24 weeks ended June 12, 2012 and June 11, 2013 and the summary balance sheet data as of June 11, 2013 from our unaudited interim consolidated financial statements appearing elsewhere in this prospectus. In the opinion of management, these unaudited interim consolidated financial statements include all adjustments, consisting of normal recurring adjustments, necessary for a fair presentation of our financial position and operating results for these periods. Results from interim periods are not necessarily indicative of results that may be expected for the entire year and historical results are not indicative of the results to be expected in the future. The summary financial data presented below represent portions of our financial statements and are not complete. You should read this information in conjunction with “Use of Proceeds,” “Capitalization,” “Selected Consolidated and Combined Financial Data,” “Management’s Discussion and Analysis of Financial Condition and Results of Operations” and our consolidated financial statements and the related notes to those statements included elsewhere in this prospectus.
| Fiscal Year Ended(1) | 24 Weeks Ended | |||||||||||||||||||
| December 28, 2010 |
December 27, 2011 |
December 25, 2012 |
June 12, 2012 |
June 11, 2013 |
||||||||||||||||
| (in thousands, except per share data) | ||||||||||||||||||||
| Income Statement Data: |
||||||||||||||||||||
| Revenues |
$ | 162,855 | $ | 198,625 | $ | 232,435 | $ | 103,678 | $ | 120,162 | ||||||||||
| Costs and expenses: |
||||||||||||||||||||
| Costs of sales |
49,481 | 60,743 | 71,093 | 31,963 | 36,533 | |||||||||||||||
| Restaurant operating expenses |
71,917 | 86,311 | 100,143 | 43,778 | 53,454 | |||||||||||||||
| Marketing and advertising costs |
2,744 | 4,246 | 4,682 | 2,006 | 2,256 | |||||||||||||||
| Pre-opening costs |
798 | 3,018 | 4,058 | 902 | 919 | |||||||||||||||
| General and administrative |
7,512 | 10,640 | 13,449 | 5,400 | 7,938 | |||||||||||||||
| Management and accounting fees paid to related party |
3,345 | 3,399 | 1,252 | 1,196 | — | |||||||||||||||
| Asset advisory agreement termination fee |
— | — | 3,000 | — | — | |||||||||||||||
| Secondary public offering costs |
— | — | — | — | 412 | |||||||||||||||
| Public offering transaction bonuses |
— | — | 1,462 | — | 1,805 | |||||||||||||||
| Depreciation and amortization |
6,459 | 6,998 | 8,675 | 3,570 | 5,006 | |||||||||||||||
|
|
|
|
|
|
|
|
|
|
|
|||||||||||
| Operating income |
20,599 | 23,270 | 24,621 | 14,863 | 11,839 | |||||||||||||||
| Other income (expense), net: |
||||||||||||||||||||
| Interest expense-affiliates |
(1,775 | ) | — | — | — | — | ||||||||||||||
| Interest expense-other |
(9,906 | ) | (6,355 | ) | (2,920 | ) | (2,228 | ) | (48 | ) | ||||||||||
| Write-off of debt issuance costs |
— | (2,501 | ) | (1,649 | ) | — | — | |||||||||||||
| Other, net |
(249 | ) | (114 | ) | 113 | 65 | — | |||||||||||||
|
|
|
|
|
|
|
|
|
|
|
|||||||||||
| Income from continuing operations before income taxes |
8,669 | 14,300 | 20,165 | 12,700 | 11,791 | |||||||||||||||
| Income tax expense (benefit) |
(88 | ) | 4,653 | 5,592 | 4,172 | 3,791 | ||||||||||||||
|
|
|
|
|
|
|
|
|
|
|
|||||||||||
| Income from continuing operations |
$ | 8,757 | $ | 9,647 | $ | 14,573 | $ | 8,528 | $ | 8,000 | ||||||||||
|
|
|
|
|
|
|
|
|
|
|
|||||||||||
| Discontinued operations, net of income tax benefit |
(27 | ) | (674 | ) | (819 | ) | 84 | — | ||||||||||||
|
|
|
|
|
|
|
|
|
|
|
|||||||||||
| Net income |
$ | 8,730 | $ | 8,973 | $ | 13,754 | $ | 8,612 | $ | 8,000 | ||||||||||
|
|
|
|
|
|
|
|
|
|
|
|||||||||||
9
Table of Contents
| Fiscal Year Ended(1) | 24 Weeks Ended | |||||||||||||||||||
| December 28, 2010 |
December 27, 2011 |
December 25, 2012 |
June 12, 2012 |
June 11, 2013 |
||||||||||||||||
| (in thousands, except per share data) | ||||||||||||||||||||
| Basic net income (loss) per common share(2): |
||||||||||||||||||||
| Continuing operations |
$ | 0.49 | $ | 0.54 | $ | 0.71 | $ | 0.47 | $ | 0.34 | ||||||||||
| Discontinued operations |
(0.00 | ) | (0.04 | ) | (0.04 | ) | 0.01 | 0.00 | ||||||||||||
|
|
|
|
|
|
|
|
|
|
|
|||||||||||
| Basic net income per share |
$ | 0.49 | $ | 0.50 | $ | 0.67 | $ | 0.48 | $ | 0.34 | ||||||||||
|
|
|
|
|
|
|
|
|
|
|
|||||||||||
| Diluted net income (loss) per common share(2): |
||||||||||||||||||||
| Continuing operations |
$ | 0.49 | $ | 0.54 | $ | 0.71 | $ | 0.47 | $ | 0.34 | ||||||||||
| Discontinued operations |
(0.00 | ) | (0.04 | ) | (0.04 | ) | 0.01 | 0.00 | ||||||||||||
|
|
|
|
|
|
|
|
|
|
|
|||||||||||
| Diluted net income per share |
$ | 0.49 | $ | 0.50 | $ | 0.67 | $ | 0.48 | $ | 0.34 | ||||||||||
|
|
|
|
|
|
|
|
|
|
|
|||||||||||
| Weighted average shares used in computing net income per common share(2): |
||||||||||||||||||||
| Basic |
17,994,667 | 17,994,667 | 20,432,579 | 17,994,667 | 23,794,667 | |||||||||||||||
|
|
|
|
|
|
|
|
|
|
|
|||||||||||
| Diluted |
17,994,667 | 17,994,667 | 20,432,579 | 17,994,667 | 23,794,869 | |||||||||||||||
|
|
|
|
|
|
|
|
|
|
|
|||||||||||
| December 28, 2010 |
December 27, 2011 |
December 25, 2012 |
June 11, 2013 |
|||||||||||||
| (in thousands) | ||||||||||||||||
| Balance Sheet Data (at end of period): |
||||||||||||||||
| Cash and cash equivalents |
$ | 4,157 | $ | 14,119 | $ | 10,763 | $ | 14,443 | ||||||||
| Working capital (deficit)(3) |
(232 | ) | 2,940 | (755 | ) | 8,038 | ||||||||||
| Total assets |
217,725 | 234,274 | 258,385 | 266,244 | ||||||||||||
| Total debt |
78,922 | 70,000 | — | — | ||||||||||||
| Total stockholders’ equity |
87,155 | 95,872 | 177,901 | 188,146 | ||||||||||||
| Fiscal Year Ended(1) | 24 Weeks Ended | |||||||||||||||||||
| December 28, 2010 |
December 27, 2011 |
December 25, 2012 |
June 12, 2012 |
June 11, 2013 |
||||||||||||||||
| (in thousands, except restaurant and percentage amounts) | ||||||||||||||||||||
| Other Financial Data: |
||||||||||||||||||||
| Net cash provided by operating activities |
$ | 11,999 | $ | 28,503 | $ | 30,968 | $ | 12,691 | $ | 12,151 | ||||||||||
| Net cash used in investing activities |
(1,210 | ) | (7,151 | ) | (32,173 | ) | (12,545 | ) | (10,250 | ) | ||||||||||
| Net cash provided by (used in) financing activities |
(19,889 | ) | (11,390 | ) | (2,151 | ) | (8,500 | ) | 1,779 | |||||||||||
| Capital Expenditures |
5,550 | 20,063 | 33,635 | 12,429 | 10,230 | |||||||||||||||
| Adjusted EBITDA(4) |
29,926 | 36,415 | 43,005 | 20,531 | 19,981 | |||||||||||||||
| Adjusted EBITDA Margin(5) |
18.4 | % | 18.3 | % | 18.5 | % | 19.8 | % | 16.6 | % | ||||||||||
| Restaurant-level EBITDA(4) |
38,713 | 47,325 | 56,454 | 25,931 | 27,919 | |||||||||||||||
| Restaurant-level EBITDA Margin(6) |
23.8 | % | 23.8 | % | 24.3 | % | 25.0 | % | 23.2 | % | ||||||||||
| Operating Data: |
||||||||||||||||||||
| Total Restaurants (at end of period) |
27 | 30 | 34 | 32 | 35 | |||||||||||||||
| Total comparable restaurants (at end of period)(7) |
26 | 26 | 28 | 28 | 29 | |||||||||||||||
| Average sales per comparable restaurant |
$ | 6,237 | $ | 6,802 | $ | 7,457 | $ | 3,451 | $ | 3,479 | ||||||||||
| Percentage change in comparable restaurant sales(7) |
4.4 | % | 11.2 | % | 4.2 | % | 5.4 | % | 1.0 | % | ||||||||||
| (1) | We utilize a 52- or 53-week accounting period which ends on the last Tuesday of December. The fiscal years ended December 28, 2010, December 27, 2011 and December 25, 2012 each had 52 weeks. |
| (2) | Basic and diluted income per share is computed by dividing net income for each period by the shares of common stock issued following our conversion from a limited liability company to a corporation immediately prior to our initial public offering. Such shares are assumed to be outstanding for all periods presented. |
10
Table of Contents
| (3) | Defined as total current assets minus total current liabilities. |
| (4) | Adjusted EBITDA and restaurant-level EBITDA are metrics used by management to measure operating performance. Adjusted EBITDA represents net income before interest, taxes, and depreciation and amortization, plus the sum of certain non-operating expenses, including pre-opening costs, management fees and expenses, asset advisory agreement termination fees, public offering transaction bonuses and secondary public offering costs. Restaurant-level EBITDA represents net income before interest, taxes and depreciation and amortization, plus the sum of certain non-operating expenses, including pre-opening costs, management fees and expenses, asset advisory agreement termination fees, public offering transaction bonuses, secondary public offering costs and general and administrative expenses. |
The following table presents a reconciliation of adjusted EBITDA and restaurant-level EBITDA to net income:
| Fiscal Year Ended(1) | 24 Weeks Ended | |||||||||||||||||||
| December 28, 2010 |
December 27, 2011 |
December 25, 2012 |
June 12, 2012 |
June 11, 2013 |
||||||||||||||||
| (in thousands) | ||||||||||||||||||||
| Income from continuing operations |
$ | 8,757 | $ | 9,647 | $ | 14,573 | $ | 8,528 | $ | 8,000 | ||||||||||
| Income tax expense (benefit) |
(88 | ) | 4,653 | 5,592 | 4,172 | 3,791 | ||||||||||||||
| Interest income |
(75 | ) | (16 | ) | (9 | ) | (6 | ) | — | |||||||||||
| Interest expense-other |
9,906 | 6,355 | 2,920 | 2,228 | 48 | |||||||||||||||
| Interest expense-affiliate |
1,775 | — | — | — | — | |||||||||||||||
| Write-off of debt issuance costs |
— | 2,501 | 1,649 | — | — | |||||||||||||||
| Depreciation and amortization |
6,459 | 6,998 | 8,675 | 3,570 | 5,006 | |||||||||||||||
| Pre-opening costs |
798 | 3,018 | 4,058 | 902 | 919 | |||||||||||||||
| Lease guarantee payments and other |
324 | 130 | (167 | ) | (59 | ) | — | |||||||||||||
| Management fees and expenses(a) |
2,070 | 3,129 | 1,252 | 1,196 | — | |||||||||||||||
| Asset advisory agreement termination fee |
— | — | 3,000 | — | — | |||||||||||||||
| Public offering transaction bonuses |
— | — | 1,462 | — | 1,805 | |||||||||||||||
| Secondary public offering costs |
— | — | — | — | 412 | |||||||||||||||
|
|
|
|
|
|
|
|
|
|
|
|||||||||||
| Adjusted EBITDA |
$ | 29,926 | $ | 36,415 | $ | 43,005 | $ | 20,531 | $ | 19,981 | ||||||||||
| General and administrative |
7,512 | 10,640 | 13,449 | 5,400 | 7,938 | |||||||||||||||
| Related party shared services fees |
1,275 | 270 | — | — | — | |||||||||||||||
|
|
|
|
|
|
|
|
|
|
|
|||||||||||
| Restaurant-level EBITDA |
$ | 38,713 | $ | 47,325 | $ | 56,454 | $ | 25,931 | $ | 27,919 | ||||||||||
|
|
|
|
|
|
|
|
|
|
|
|||||||||||
| (a) | Includes asset management fees and expenses paid to an affiliate of Lone Star Fund pursuant to our previously existing asset advisory agreement, but excludes amounts paid to another affiliate of Lone Star Fund for accounting, administrative and management services under our previously existing shared services agreement, which is referred to as the related party shared services fee. See “Management’s Discussion and Analysis of Financial Condition and Results of Operations—Key Financial Definitions—Management and Accounting Fees Paid to Related Party” and “Certain Relationships and Related Party Transactions—Relationships with Lone Star Fund and its Affiliates—Termination of Asset Advisory Agreement.” |
We present adjusted EBITDA and restaurant-level EBITDA as supplemental performance measures because we believe they facilitate a comparative assessment of our operating performance relative to our performance based on our results under generally accepted accounting principles in the United States, or GAAP, while isolating the effects of some items that vary from period to period without any correlation to core operating performance. Specifically, adjusted EBITDA allows for an assessment of our operating performance without the effect of non-cash depreciation and amortization expenses or our ability to service or incur indebtedness. Restaurant-level EBITDA allows for further assessment of our operating performance by eliminating the effect of general and administrative expenses incurred at the corporate level. These measures also function as a benchmark to evaluate our operating performance or compare our performance to that of our competitors because companies within our industry exhibit significant variations with respect to capital structures and cost of capital (which affect interest expense and tax rates) and differences in book depreciation of facilities and equipment (which affect relative depreciation expense), including significant differences in the depreciable lives of similar assets among various companies.
This prospectus also includes information concerning adjusted EBITDA margin, which is defined as the ratio of adjusted EBITDA to revenues, and restaurant-level EBITDA margin, which is defined as the ratio of restaurant-level
11
Table of Contents
EBITDA to revenues. We present adjusted EBITDA margin and restaurant-level EBITDA margin because they are used by management as a performance measurement to judge the level of adjusted EBITDA and restaurant-level EBITDA, respectively, generated from revenues. We believe their inclusion is appropriate to provide additional information to investors and other external users of our financial statements.
Adjusted EBITDA, restaurant-level EBITDA, adjusted EBITDA margin and restaurant-level EBITDA margin are not measurements of our financial performance under GAAP and should not be considered in isolation or as an alternative to net income, net cash provided by operating, investing or financing activities or any other financial statement data presented as indicators of financial performance or liquidity, each as presented in accordance with GAAP. We understand that although adjusted EBITDA is frequently used by securities analysts, lenders and others in their evaluation of companies, it and restaurant-level EBITDA have limitations as analytical tools, and you should not consider them in isolation, or as substitutes for analysis of our results as reported under GAAP, as adjusted EBITDA and restaurant-level EBITDA do not reflect:
| • | discretionary cash available to us to invest in the growth of our business; |
| • | changes in, or cash requirements for, our working capital needs; |
| • | our capital expenditures or future requirements for capital expenditures; |
| • | the interest expense, or the cash requirements necessary to service interest or principal payments, associated with our indebtedness; or |
| • | depreciation and amortization, which are non-cash charges, although the assets being depreciated and amortized will likely have to be replaced in the future, and adjusted EBITDA does not reflect any cash requirements for such replacements. |
| (5) | Adjusted EBITDA margin is the ratio of adjusted EBITDA to revenues. |
| (6) | Restaurant-level EBITDA margin is the ratio of restaurant-level EBITDA to revenues. |
| (7) | We consider a restaurant to be comparable in the first full fiscal period following the eighteenth month of operations. Changes in comparable restaurant sales reflect changes in sales for the comparable group of restaurants over a specified period of time. |
12
Table of Contents
Investing in our common stock involves a high degree of risk. You should carefully consider the following risk factors and all other information contained in this prospectus before purchasing our common stock. If any of the following risks occur, our business, financial condition or results of operations could be materially and adversely affected. In that case, the trading price of our common stock could decline and you may lose some or all of your investment.
Risks Related to Our Business
Changes in general economic conditions, including economic uncertainty, have adversely impacted our business and results of operations and may continue to do so.
Purchases at our restaurants are discretionary for consumers and we are therefore susceptible to economic slowdowns. We believe that consumers generally are more willing to make discretionary purchases, including high-end restaurant meals, during favorable economic conditions. The recent economic uncertainty, continuing disruptions in the overall economy, including high unemployment and financial market volatility and unpredictability, and the related reduction in consumer confidence negatively affected customer traffic and sales throughout our industry, including our segment. In addition, we believe that uncertainty over U.S. budgetary and fiscal policy that ultimately led to higher personal income tax rates may have adversely impacted sales in the early part of 2013 and, together with adverse weather affects, created challenges for us to achieve an increase in comparable restaurant sales in the first quarter of 2013. If the economy experiences a new downturn or there are continued uncertainties regarding U.S. budgetary and fiscal policies, our customers, including our business clientele, may further reduce their level of discretionary spending, impacting the frequency with which they choose to dine out or the amount they spend on meals while dining out. We believe the majority of our weekday revenues in our Del Frisco’s and Sullivan’s concepts are derived from business customers using expense accounts and our business therefore may be affected by reduced expense account or other business-related dining by our business clientele. If business clientele were to dine less frequently at our restaurants, our business and results of operations would be adversely affected as a result of a reduction in customer traffic or average revenues per customer.
There is also a risk that if the current uncertain economic conditions persist for an extended period of time or worsen, consumers might make long-lasting changes to their discretionary spending behavior, including dining out less frequently. The ability of the U.S. economy to handle this uncertainty is likely to be affected by many national and international factors that are beyond our control, including current economic trends in Europe. These factors, including national, regional and local politics and economic conditions, disposable consumer income and consumer confidence, also affect discretionary consumer spending. Continued uncertainty in or a worsening of the economy, generally or in a number of our markets, and our customers’ reactions to these trends could adversely affect our business and cause us to, among other things, reduce the number and frequency of new restaurant openings, close restaurants and delay our re-modeling of existing locations.
If our restaurants are not able to compete successfully with other restaurants, our business and results of operations may be adversely affected.
Our industry is intensely competitive with respect to price, quality of service, restaurant location, ambiance of facilities and type and quality of food. A substantial number of national
13
Table of Contents
and regional restaurant chains and independently owned restaurants compete with us for customers, restaurant locations and qualified management and other restaurant staff. The principal competitors for our Del Frisco’s and Sullivan’s concepts are other upscale steakhouse chains such as Fleming’s Prime Steakhouse and Wine Bar, The Capital Grille, Smith & Wollensky, The Palm, Ruth’s Chris Steak House and Morton’s The Steakhouse. The principal competitors for our Grille concept also include other upscale chains such as Hillstone and Seasons 52. Our concepts also compete with additional restaurants in the broader upscale dining segment. Some of our competitors have greater financial and other resources, have been in business longer, have greater name recognition and are better established in the markets where our restaurants are located or where we may expand. Our inability to compete successfully with other restaurants may harm our ability to maintain acceptable levels of revenue growth, limit or otherwise inhibit our ability to grow one or more of our concepts, or force us to close one or more of our restaurants. We may also need to evolve our concepts in order to compete with popular new restaurant formats or concepts that emerge from time to time, and we cannot provide any assurance that we will be successful in doing so or that any changes we make to any of our concepts in response will be successful or not adversely affect our profitability. In addition, with improving product offerings at fast casual restaurants and quick-service restaurants combined with the effects of uncertain economic conditions and other factors, consumers may choose less expensive alternatives, which could also negatively affect customer traffic at our restaurants. Any unanticipated slowdown in demand at any of our restaurants due to industry competition may adversely affect our business and results of operations.
Our future growth depends in part on our ability to open new restaurants and operate them profitably, and if we are unable to successfully execute this strategy, our results of operations could be adversely affected.
Our financial success depends in part on management’s ability to execute our growth strategy. One key element of our growth strategy is opening new restaurants. We believe there are opportunities to open four to six new restaurants annually, generally composed of one Del Frisco’s and three to five Sullivan’s and/or Grilles, with new openings of our Grille concept likely serving as the primary driver of new unit growth in the near term. In 2012 we opened Grilles in Phoenix, Arizona, Washington D.C. and Atlanta, Georgia, and one Del Frisco’s in Chicago, Illinois. In 2013, we have to date opened Grilles in Houston, Texas and Santa Monica, California and expect to open three to four additional Grilles by the end of the year. For the opening of a new restaurant, we measure our cash investment costs net of landlord contributions and equipment financing, but including pre-opening costs. We target average cash investment costs of $7.0 million to $9.0 million for a new Del Frisco’s and $3.0 million to $4.5 million for a new Sullivan’s or Grille.
Our ability to open new restaurants and operate them profitably is dependent upon a number of factors, many of which are beyond our control, including:
| • | finding quality site locations, competing effectively to obtain quality site locations and reaching acceptable agreements to lease or purchase sites; |
| • | complying with applicable zoning, land use and environmental regulations and obtaining, for an acceptable cost, required permits and approvals; |
| • | having adequate capital for construction and opening costs and efficiently managing the time and resources committed to building and opening each new restaurant; |
| • | timely hiring and training and retaining the skilled management and other employees necessary to meet staffing needs; |
14
Table of Contents
| • | successfully promoting our new locations and competing in their markets; |
| • | acquiring food and other supplies for new restaurants from local suppliers; and |
| • | addressing unanticipated problems or risks that may arise during the development or opening of a new restaurant or entering a new market. |
A new restaurant typically experiences a “ramp-up” period of approximately 18 months before it achieves our targeted level of performance. This is due to the costs associated with opening a new restaurant, as well as higher operating costs caused by start-up and other temporary inefficiencies associated with opening new restaurants. For example, there are a number of factors which may impact the amount of time and money we commit to the construction and development of new restaurants, including landlord delays, shortages of skilled labor, labor disputes, shortages of materials, delays in obtaining necessary permits, local government regulations and weather interference. Once the restaurant is open, how quickly it achieves a desired level of profitability is impacted by many factors, including the level of market familiarity and acceptance when we enter new markets, as well as the availability of experienced staff and the time required to negotiate reasonable prices for food and other supplies from local suppliers. Our business and profitability may be adversely affected if the “ramp-up” period for a new restaurant lasts longer than we expect.
If we are unable to increase our sales or improve our margins at existing restaurants, our profitability and overall results of operations may be adversely affected.
Another key aspect of our growth strategy is increasing comparable restaurant sales and improving restaurant-level margins. Improving comparable restaurant sales and restaurant-level margins depends in part on whether we achieve revenue growth through increases in the average check and further expand our private dining business at each restaurant. We believe there are opportunities to increase the average check at our restaurants through, for example, selective introduction of higher priced items and increases in menu pricing. We also believe that expanding and enhancing our private dining capacity will also increase our restaurant sales, as our private dining business typically has a higher average check and higher overall margins than regular dining room business. However, these strategies may prove unsuccessful, especially in times of economic hardship, as customers may not order or enjoy higher priced items and discretionary spending on private dining events may decrease. Select price increases have not historically adversely impacted customer traffic; however, we expect that there is a price level at which point customer traffic would be adversely affected. It is also possible that these changes could cause our sales volume to decrease. If we are not able to increase our sales at existing restaurants for any reason, our profitability and results of operations could be adversely affected.
The failure to continue to successfully develop our Grille concept could have a material adverse effect on our financial condition and results of operations.
We launched our new concept, the Grille, in the third quarter of 2011 with the opening of our New York City location. We opened a second location in Dallas, Texas in the fourth quarter of 2011, locations in Phoenix, Arizona, Washington D.C. and Atlanta, Georgia in 2012 and locations in Houston, Texas and Santa Monica, California thus far in 2013. We believe that new openings of the Grille are likely to serve as the primary driver of new unit growth in the near term. Our ability to continue to succeed with this new concept will require significant capital expenditures and management attention and is subject to certain risks in addition to those of opening a new restaurant under one of our existing concepts, including customer acceptance of and competition to that concept. If the “ramp-up” period for our Grille restaurants and for our
15
Table of Contents
development of concepts in general does not meet our expectations, our operating results may be adversely affected. In addition, we are targeting restaurant-level EBITDA margins of between 20% and 25% for the Grille. However, because we face new challenges at the Grille, such as predicting demand for new menu selections that are not offered at our other concepts, we cannot provide any assurance that our operating margins will achieve these levels. As a result, we may need to adjust our pricing and menu offering strategies. We may not be successful enough to recoup our investments in the concept. There can be no assurance that we will be able to successfully develop and grow the Grille or any other new concept to a point where it will become profitable or generate positive cash flow or that it will prove to be a platform for future expansion. We may not be able to attract enough customers to meet targeted levels of performance at new restaurants because potential customers may be unfamiliar with our concepts or the atmosphere or menu might not appeal to them. The Grille may even operate at a loss, which could have a material adverse effect on our overall operating results. In addition, opening a new restaurant concept such as a Grille in an existing market could reduce the revenue of our existing restaurants in that market. If we cannot successfully execute our growth strategies for the Grille, or if customer traffic generated by the Grille results in a decline in customer traffic at one of our other restaurants in the same market, our business and results of operations may be adversely affected.
Our growth, including the continued development of the Grille, may strain our infrastructure and resources, which could delay the opening of new restaurants and adversely affect our ability to manage our existing restaurants.
We plan to continue our current pace of new restaurant growth, including the continued development and promotion of the Grille. We believe there are opportunities to open four to six restaurants annually, generally composed of one Del Frisco’s and three to five Sullivan’s and/or Grilles, with new openings of our Grille concept likely serving as the primary driver of new unit growth in the near term. We typically target an average cash investment of approximately $7.0 million to $9.0 million per restaurant for a Del Frisco’s restaurant and $3.0 million to $4.5 million for a Sullivan’s or a Grille, in each case net of landlord contributions and equipment financing and including pre-opening costs. In addition to new openings, we also may “refresh” a number of our Del Frisco’s and Sullivan’s locations to, among other things, add additional seating, further grow our private dining business and add patio seating. During 2012, we completed refreshes, with varying scopes of work, of five Del Frisco’s and six Sullivan’s at an average cost of $0.3 million per location. Thereafter, we expect to complete one to two refreshes each year at an approximate cost of $0.5 million per location. This growth and these investments will increase our operating complexity and place increased demands on our management as well as our human resources, purchasing and site management teams. While we have committed significant resources to expanding our current restaurant management systems, financial and management controls and information systems in connection with our recent growth, if this infrastructure is insufficient to support this expansion, our ability to open new restaurants, including the continued development and promotion of the Grille, and to manage our existing restaurants, including the expansion of our private dining business, would be adversely affected. If we fail to continue to improve our infrastructure or if our improved infrastructure fails, we may be unable to implement our growth strategy or maintain current levels of operating performance in our existing restaurants.
Our New York Del Frisco’s location represents a significant portion of our revenues, and any significant downturn in its business or disruption in the operation of this location could harm our business, financial condition and results of operations.
Our New York Del Frisco’s location represented approximately 21%, 18% and 16% of our revenues in 2010, 2011 and 2012, respectively. Accordingly, we are susceptible to any
16
Table of Contents
fluctuations in the business at our New York Del Frisco’s location, whether as a result of adverse economic conditions, negative publicity, changes in customer preferences or for other reasons. In addition, any natural disaster, prolonged inclement weather, act of terrorism or national emergency, accident, system failure or other unforeseen event in or around New York City could result in a temporary or permanent closing of this location, could influence potential customers to avoid this geographic region or this location in particular or otherwise lead to a decrease in revenues. Any significant interruption in the operation of this location or other reduction in sales could adversely affect our business and results of operations.
Negative customer experiences or negative publicity surrounding our restaurants or other restaurants could adversely affect sales in one or more of our restaurants and make our brands less valuable.
The quality of our food and our restaurant facilities are two of our competitive strengths. Therefore, adverse publicity, whether or not accurate, relating to food quality, public health concerns, illness, safety, injury or government or industry findings concerning our restaurants, restaurants operated by other foodservice providers or others across the food industry supply chain could affect us more than it would other restaurants that compete primarily on price or other factors. A restaurant in Louisville, Kentucky has the right to use, and uses, a specific registration of the Del Frisco’s name pursuant to a concurrent use agreement and we licensed the use of the Del Frisco’s name to one restaurant in Orlando, Florida through June 1, 2013, as described in greater detail in “Business—Intellectual Property.” We do not own or control the Louisville restaurant, and we did not own or control the Orlando restaurant, but any adverse publicity relating to those operations could negatively affect us. In addition, although we would not be legally liable for any such failure, because the Louisville and Orlando restaurants operate or operated under one of our brand names, we may be subject to litigation as a result of either restaurant’s failure to comply with food quality, preparation or other applicable rules and regulations. If customers perceive or experience a reduction in our food quality, service or ambiance or in any way believe we have failed to deliver a consistently positive experience, the value and popularity of one or more of our concepts could suffer. Any shifts in consumer preferences away from the kinds of food we offer, particularly beef, whether because of dietary or other health concerns or otherwise, would make our restaurants less appealing and could reduce customer traffic and/or impose practical limits on pricing.
Negative publicity relating to the consumption of beef, including in connection with food-borne illness, could result in reduced consumer demand for our menu offerings, which could reduce sales.
Instances of food-borne illness, including Bovine Spongiform Encephalopathy, which is also known as BSE or mad cow disease, aphthous fever, which is also known as hoof and mouth disease, as well as hepatitis A, lysteria, salmonella and e-coli, whether or not found the United States or traced directly to one of our suppliers or our restaurants, could reduce demand for our menu offerings. Any negative publicity relating to these and other health-related matters, such as the confirmation of a case of mad cow disease in a dairy cow in California in April 2012, may affect consumers’ perceptions of our restaurants and the food that we offer, reduce customer visits to our restaurants and negatively impact demand for our menu offerings. Adverse publicity relating to any of these matters, beef in general or other similar concerns could adversely affect our business and results of operations.
Increases in the prices of, and/or reductions in the availability of commodities, primarily beef, could adversely affect our business and results of operations.
Our profitability depends in part on our ability to anticipate and react to changes in commodity costs, which have a substantial effect on our total costs. For example, we purchase
17
Table of Contents
large quantities of beef, particularly USDA prime beef and premium choice beef. Our beef costs represented approximately 32%, 33% and 34% of our food and beverage costs during 2010, 2011 and 2012, respectively, and we currently do not purchase beef pursuant to any long-term contractual arrangements with fixed pricing or use futures contracts or other financial risk management strategies to reduce our exposure to potential price fluctuations. The market for USDA prime beef and premium choice beef is particularly volatile and is subject to extreme price fluctuations due to seasonal shifts, climate conditions, the price of feed, industry demand, energy demand and other factors. For example, during 2011 and 2012, beef costs were impacted by (i) the summer drought in Texas and Oklahoma, (ii) the price of corn, (iii) the entrance of major supermarkets into the USDA choice beef market and (iv) new free trade agreements increasing exports. Although we currently do not engage in futures contracts or other financial risk management strategies with respect to potential price fluctuations, from time to time, we may opportunistically enter into fixed price beef supply contracts or contracts for other food products or consider other risk management strategies with regard to our meat and other food costs to minimize the impact of potential price fluctuations. This practice could help stabilize our food costs during times of fluctuating prices, although there can be no assurances that this will occur. However, because our restaurants feature USDA prime beef and premium choice beef, we generally expect to purchase these types of beef even if we have not entered into any such arrangements and the price increased significantly. The prices of other commodities can affect our costs as well, including corn and other grains, which are ingredients we use regularly and are also used as cattle feed and therefore affect the price of beef. Energy prices can also affect our bottom line, as increased energy prices may cause increased transportation costs for beef and other supplies, as well as increased costs for the utilities required to run each restaurant. Historically we have passed increased commodity and other costs on to our customers by increasing the prices of our menu items. While we believe these price increases did not historically affect our customer traffic, there can be no assurance additional price increases would not affect future customer traffic. If prices increase in the future and we are unable to anticipate or mitigate these increases, or if there are shortages for USDA Prime beef and premium choice beef, our business and results of operations would be adversely affected.
We depend upon frequent deliveries of food and other supplies, in most cases from a limited number of suppliers, which subjects us to the possible risks of shortages, interruptions and price fluctuations.
Our ability to maintain consistent quality throughout our restaurants depends in part upon our ability to acquire fresh products, including USDA prime beef and premium choice beef, fresh seafood, quality produce and related items from reliable sources in accordance with our specifications. In addition, we rely on one or a limited number of suppliers for certain ingredients. For example, U.S. Foodservice supplies all of the beef for our restaurants and has done so since June of 2009. This contract expires in June 2015 and can be terminated by either party for any reason upon 90 days advanced notice. This dependence on one or a limited number of suppliers, as well as the limited number of alternative suppliers of USDA prime beef and premium choice beef and quality seafood, subjects us to the possible risks of shortages, interruptions and price fluctuations in beef and seafood. If any of our suppliers is unable to obtain financing necessary to operate its business or its business is otherwise adversely affected, does not perform adequately or otherwise fails to distribute products or supplies to our restaurants, or terminates or refuses to renew any contract with us, particularly with respect to one of the suppliers on which we rely heavily for specific ingredients, we may be unable to find an alternative supplier in a short period of time or if we can, it may not be on acceptable terms. Our inability to replace our suppliers in a short period of time on acceptable terms could increase our costs or cause shortages at our restaurants that may cause us to remove certain items from a menu, increase the price of certain offerings or temporarily close a restaurant, which could adversely affect our business and results of operations.
18
Table of Contents
We depend on the services of key executives, and our business and growth strategy could be materially harmed if we were to lose these and executives and were unable to replace them with executives of equal experience and capabilities.
Some of our senior executives, such as Mark S. Mednansky, our Chief Executive Officer, are particularly important to our success because they have been instrumental in setting our strategic direction, operating our business, identifying, recruiting and training key personnel, identifying expansion opportunities and arranging necessary financing. We have employment agreements with all members of senior management; however, we cannot prevent our executives from terminating their employment with us. Losing the services of any of these individuals could adversely affect our business until a suitable replacement could be found. We also believe that they could not quickly be replaced with executives of equal experience and capabilities and their successors may not be as effective. We do not maintain key person life insurance policies on any of our executives. See “Management.”
Changes in consumer preferences and discretionary spending patterns could adversely impact our business and results of operations.
The restaurant industry is characterized by the continual introduction of new concepts and is subject to rapidly changing consumer preferences, tastes and eating and purchasing habits. Our success depends in part on our ability to anticipate and respond quickly to changing consumer preferences, as well as other factors affecting the restaurant industry, including new market entrants and demographic changes. Shifts in consumer preferences away from upscale steakhouses or beef, which is a significant component of our Del Frisco’s and Sullivan’s concepts’ menus and appeal, whether as a result of economic, competitive or other factors, could adversely affect our business and results of operations.
Restaurant companies, including ours, have been the target of class action lawsuits and other proceedings alleging, among other things, violations of federal and state workplace and employment laws. Proceedings of this nature, if successful, could result in our payment of substantial damages.
In recent years, we and other restaurant companies have been subject to lawsuits, including class action lawsuits, alleging violations of federal and state laws regarding workplace and employment matters, discrimination and similar matters. A number of these lawsuits have resulted in the payment of substantial damages by the defendants. Similar lawsuits have been instituted from time to time alleging violations of various federal and state wage and hour laws regarding, among other things, employee meal deductions, the sharing of tips amongst certain employees, overtime eligibility of assistant managers and failure to pay for all hours worked. Although we maintain what we believe to be adequate levels of insurance, insurance may not be available at all or in sufficient amounts to cover any liabilities with respect to these matters. Accordingly, if we are required to pay substantial damages and expenses as a result of these types or other lawsuits our business and results of operations would be adversely affected.
Occasionally, our customers file complaints or lawsuits against us alleging that we are responsible for some illness or injury they suffered at or after a visit to one of our restaurants, including actions seeking damages resulting from food borne illness and relating to notices with respect to chemicals contained in food products required under state law. We are also subject to a variety of other claims from third parties arising in the ordinary course of our business, including personal injury claims, contract claims and claims alleging violations of federal and state laws. In addition, our restaurants are subject to state “dram shop” or similar laws which generally allow a person to sue us if that person was injured by a legally intoxicated person who
19
Table of Contents
was wrongfully served alcoholic beverages at one of our restaurants. The restaurant industry has also been subject to a growing number of claims that the menus and actions of restaurant chains have led to the obesity of certain of their customers. In addition, we may also be subject to lawsuits from our employees or others alleging violations of federal and state laws regarding workplace and employment matters, discrimination and similar matters. A number of these lawsuits have resulted in the payment of substantial damages by the defendants.
Regardless of whether any claims against us are valid or whether we are liable, claims may be expensive to defend and may divert time and money away from our operations. In addition, they may generate negative publicity, which could reduce customer traffic and sales. Although we maintain what we believe to be adequate levels of insurance, insurance may not be available at all or in sufficient amounts to cover any liabilities with respect to these or other matters. A judgment or other liability in excess of our insurance coverage for any claims or any adverse publicity resulting from claims could adversely affect our business and results of operations.
Our business is subject to substantial government regulation.
Our business is subject to extensive federal, state and local government regulation, including regulations related to the preparation and sale of food, the sale of alcoholic beverages, the sale and use of tobacco, zoning and building codes, land use and employee, health, sanitation and safety matters. For example, the preparation, storing and serving of food and the use of certain ingredients is subject to heavy regulation. Alcoholic beverage control regulations govern various aspects of our restaurants’ daily operations, including the minimum age of patrons and employees, hours of operation, advertising, wholesale purchasing and inventory control, handling and storage. Typically our restaurants’ licenses to sell alcoholic beverages must be renewed annually and may be suspended or revoked at any time for cause. In addition, because we operate in a number of different states, we are also required to comply with a number of different laws covering the same topics. The failure of any of our restaurants to timely obtain and maintain necessary governmental approvals, including liquor or other licenses, permits or approvals required to serve alcoholic beverages or food could delay or prevent the opening of a new restaurant or prevent regular day-to-day operations, including the sale of alcoholic beverages, at a restaurant that is already operating, any of which would adversely affect our business and results of operations.
In addition, the costs of operating our restaurants may increase if there are changes in laws governing minimum hourly wages, working conditions, overtime and tip credits, health care, workers’ compensation insurance rates, unemployment tax rates, sales taxes or other laws and regulations such as those governing access for the disabled, including the Americans with Disabilities Act. For example, the Federal Patient Protection and Affordable Care Act, or PPACA, which was enacted on March 23, 2010, among other things, includes guaranteed coverage requirements and imposes new taxes on health insurers and health care benefits that could increase the costs of providing health benefits to employees. In addition, because we have a significant number of restaurants located in certain states, regulatory changes in these states could have a disproportionate impact on our business. If any of the foregoing increased costs and we were unable to offset the change by increasing our menu prices or by other means, our business and results of operations could be adversely affected.
Government regulation can also affect customer traffic at our restaurants. A number of states, counties and cities have enacted menu labeling laws requiring multi-unit restaurant operators to disclose certain nutritional information. For example, the PPACA establishes a uniform, federal requirement for restaurant chains with 20 or more locations operating under the same trade name and offering substantially the same menus to post nutritional information
20
Table of Contents
on their menus, including the total number of calories. The law also requires such restaurants to provide to consumers, upon request, a written summary of detailed nutritional information, including total calories and calories from fat, total fat, saturated fat, cholesterol, sodium, total carbohydrates, complex carbohydrates, sugars, dietary fiber, and total protein in each serving size or other unit of measure, for each standard menu item. The FDA is also permitted to require additional nutrient disclosures, such as trans-fat content. We are not currently subject to requirements to post nutritional information on our menus or in our restaurants, but because we currently operate 19 Sullivan’s locations, if we open a new Sullivan’s location we would be subject to the rules established by the FDA under the PPACA once they become effective. The publication of the final rules has been delayed and the FDA has not provided an expected date for their publication. Our compliance with the PPACA or other similar laws to which we may become subject could reduce demand for our menu offerings, reduce customer traffic and/or reduce average revenue per customer, which would have an adverse effect on our revenue. Also, further government regulation restricting smoking in restaurants and bars, may reduce customer traffic. Any reduction in customer traffic related to these or other government regulations could affect revenues and adversely affect our business and results of operations.
To the extent that governmental regulations impose new or additional obligations on our suppliers, including, without limitation, regulations relating to the inspection or preparation of meat, food and other products used in our business, product availability could be limited and the prices that our suppliers charge us could increase. We may not be able to offset these costs through increased menu prices, which could have a material adverse effect on our business. If any of our restaurants were unable to serve particular food products, even for a short period of time, or if we are unable to offset increased costs, our business and results of operations could be adversely affected.
Changes to minimum wage laws could increase our labor costs substantially.
Under the minimum wage laws in most jurisdictions, we are permitted to pay certain hourly employees a wage that is less than the base minimum wage for general employees because these employees receive tips as a substantial part of their income. As of June 11, 2013, approximately 44% of our employees earn this lower minimum wage in their respective locations since tips constitute a substantial part of their income. If cities, states or the federal government change their laws to require all employees to be paid the general employee minimum base wage regardless of supplemental tip income, our labor costs would increase substantially. In addition, any increase in the minimum wage, such as the increase in the minimum wage on July 24, 2009 to $7.25 per hour under the Federal Minimum Wage Act of 2007, would increase our costs. Certain states in which we operate restaurants have adopted or are considering adopting minimum wage statutes that exceed the federal minimum wage as well. We may be unable or unwilling to increase our prices in order to pass these increased labor costs on to our customers, in which case, our business and results of operations could be adversely affected.
We occupy most of our restaurants under long-term non-cancelable leases for which we may remain obligated to perform under even after a restaurant closes, and we may be unable to renew leases at the end of their terms. We also guarantee five leases with third parties for affiliates of Lone Star Fund.
All but one of our restaurants are located in leased premises. Many of our current leases are non-cancelable and typically have terms ranging from five to 15 years with renewal options for terms ranging from five to 10 years. We believe that leases that we enter into in the future will be on substantially similar terms. If we were to close or fail to open a restaurant at a location we
21
Table of Contents
lease, we would generally remain committed to perform our obligations under the applicable lease, which could include, among other things, payment of the base rent for the balance of the lease term. Our obligation to continue making rental payments and fulfilling other lease obligations in respect of leases for closed or unopened restaurants could have a material adverse effect on our business and results of operations. Alternatively, at the end of the lease term and any renewal period for a restaurant, we may be unable to renew the lease without substantial additional cost, if at all. If we cannot renew such a lease we may be forced to close or relocate a restaurant, which could subject us to construction and other costs and risks. We also guarantee five leases entered into by various operating subsidiaries of Lone Star Steakhouse & Saloon that were entered into by certain of the Casual Dining Companies prior to the acquisition of Lone Star Steakhouse and Saloon by Lone Star Fund, which is discussed in greater detail in “Business” and “Management’s Discussion and Analysis of Financial Condition and Results of Operations.” At June 11, 2013, the maximum potential amount of future lease payments we could be required to make as a result of the guarantees was $1.8 million. The entities that are party to these leases are not controlled or managed by us. See “Management’s Discussion and Analysis of Financial Condition and Results of Operations—Off-Balance Sheet Arrangements.” If we are required to make payments under one of our leases after a restaurant closes or one of the leases that we guarantee, or if we are unable to renew our restaurant leases, our business and results of operations could be adversely affected.
The impact of negative economic factors, including the availability of credit, on our landlords and other retail center tenants could negatively affect our financial results.
Negative effects on our existing and potential landlords due to any inaccessibility of credit and other unfavorable economic factors may, in turn, adversely affect our business and results of operations. If our landlords are unable to obtain financing or remain in good standing under their existing financing arrangements, they may be unable to provide construction contributions or satisfy other lease covenants to us. If any landlord files for bankruptcy protection, the landlord may be able to reject our lease in the bankruptcy proceedings. While we would have the option to retain our rights under the lease, we could not compel the landlord to perform any of its obligations and would be left with damages as our sole recourse. In addition, if our landlords are unable to obtain sufficient credit to continue to properly manage their retail sites, we may experience a drop in the level of quality of such retail centers. Our development of new restaurants may also be adversely affected by the negative financial situations of developers and potential landlords. Many landlords have delayed or cancelled recent development projects (as well as renovations of existing projects) due to the instability in the credit markets and declines in consumer spending, which has reduced the number of high-quality locations available that we would consider for our new restaurants. In addition, several other tenants at retail centers in which we are located or where we have executed leases have ceased operations or, in some cases, have deferred openings or failed to open after committing to do so. These failures may lead to reduced customer traffic and a general deterioration in the surrounding retail centers in which our restaurants are located and may contribute to lower customer traffic at our restaurants. If any of the foregoing affect any of our landlords or their other retail tenants our business and results of operations may be adversely affected.
Fixed rental payments account for a significant portion of our operating expenses, which increases our vulnerability to general adverse economic and industry conditions and could limit our operating and financing flexibility.
Payments under our operating leases account for a significant portion of our operating expenses and we expect the new restaurants we open in the future will similarly be leased by us. Specifically, payments under our operating leases accounted for 11.6%, 12.7% and 12.8% of
22
Table of Contents
our restaurant operating expenses in 2010, 2011 and 2012, respectively. Our substantial operating lease obligations could have significant negative consequences, including:
| • | increasing our vulnerability to general adverse economic and industry conditions; |
| • | limiting our ability to obtain additional financing; |
| • | requiring a substantial portion of our available cash flow to be applied to our rental obligations, thus reducing cash available for other purposes; |
| • | limiting our flexibility in planning for or reacting to changes in our business or the industry in which we compete; and |
| • | placing us at a disadvantage with respect to some of our competitors. |
We depend on cash flow from operations to pay our lease obligations and to fulfill our other cash needs. If our business does not generate sufficient cash flow from operating activities and sufficient funds are not otherwise available to us from borrowings under our credit facility or other sources, we may not be able to meet our operating lease obligations, grow our business, respond to competitive challenges or fund our other liquidity and capital needs, which could adversely affect our business and results of operations.
Any future indebtedness we may incur may limit our operational and financing flexibility and negatively impact our business.
We currently have a credit facility that provides for a revolving loan of up to $25.0 million which we entered into in October 2012. There were no outstanding borrowings under this facility at June 11, 2013. We may incur substantial additional indebtedness in the future. Our credit facility, and other debt instruments we may enter into in the future, may have important consequences to you, including the following:
| • | our ability to obtain additional financing for working capital, capital expenditures, acquisitions or general corporate purposes may be impaired; |
| • | the requirement that we use a significant portion of our cash flows from operations to pay interest on any outstanding indebtedness, which would reduce the funds available to us for operations and other purposes; and |
| • | our flexibility in planning for, or reacting to, changes in our business and the industry in which we operate may be limited. |
We expect that we will depend primarily on cash generated by our operations for funds to pay our expenses and any amounts due under our credit facility and any other indebtedness we may incur. Our ability to make these payments depends on our future performance, which will be affected by financial, business, economic and other factors, many of which we cannot control. Our business may not generate sufficient cash flows from operations in the future and our currently anticipated growth in revenues and cash flows may not be realized, either or both of which could result in our being unable to repay indebtedness or to fund other liquidity needs. If we do not have enough money, we may be required to refinance all or part of our then existing debt, sell assets or borrow more money, in each case on terms that are not acceptable to us. In addition, the terms of existing or future debt agreements, including our existing credit facility, may restrict us from adopting any of these alternatives. Our ability to recapitalize and incur additional debt in the future could also delay or prevent a change in control of our company, make some transactions more difficult and impose additional financial or other covenants on us. In addition, any significant levels of indebtedness in the future could place us at a competitive disadvantage compared to our competitors that may have proportionately less
23
Table of Contents
debt and could make us more vulnerable to economic downturns and adverse developments in our business. Our indebtedness and any inability to pay our debt obligations as they come due or inability to incur additional debt could adversely affect our business and results of operations.
The terms of our credit facility impose operating and financial restrictions on us.
Our credit facility contains a number of significant restrictions and covenants that generally limit our ability to, among other things:
| • | pay dividends or purchase stock or make other restricted payments to our stockholders; |
| • | incur additional indebtedness; |
| • | issue guarantees; |
| • | make investments; |
| • | use assets as security in other transactions; |
| • | sell assets or merge with or into other companies; |
| • | make capital expenditures; |
| • | enter into transactions with affiliates; |
| • | sell equity or other ownership interests in our subsidiaries; and |
| • | create or permit restrictions on our subsidiaries’ ability to make payments to us. |
Our credit facility limits our ability to engage in these types of transactions even if we believed that a specific transaction would contribute to our future growth or improve our operating results. Our credit facility also requires us to achieve specified financial and operating results and maintain compliance with specified financial ratios. Specifically, these covenants require that we have a fixed charge coverage ratio of greater than 2.00 and a leverage ratio of less than 1.00. As of June 11, 2013, we were in compliance with these tests. See “Management’s Discussion and Analysis of Financial Condition and Results of Operations—Liquidity and Capital Resources—Credit Facility.” Our ability to comply with these provisions may be affected by events beyond our control. A breach of any of these provisions or our inability to comply with required financial ratios in our credit facility could result in a default under the credit facility in which case the lenders will have the right to declare all borrowings to be immediately due and payable. If we are unable to repay all borrowings when due, whether at maturity or if declared due and payable following a default, the lenders would have the right to proceed against the collateral granted to secure the indebtedness. If we breach these covenants or fail to comply with the terms of the credit facility and the lenders accelerate the amounts outstanding under the credit facility our business and results of operations would be adversely affected.
Our credit facility carries floating interest rates, thereby exposing us to market risk related to changes in interest rates to the extent there are borrowings outstanding thereunder. Accordingly, our business and results of operations may be adversely affected by changes in interest rates. Assuming a one percentage point increase on our base interest rate on our credit facility and a full drawdown on the credit facility, our interest expense would increase by approximately $0.3 million over the course of 12 months.
We could face labor shortages that could slow our growth and adversely impact our ability to operate our restaurants.
Our success depends in part upon our ability to attract, motivate and retain a sufficient number of qualified employees, including restaurant managers, kitchen staff and servers,
24
Table of Contents
necessary to keep pace with our anticipated expansion schedule and meet the needs of our existing restaurants. A sufficient number of qualified individuals of the requisite caliber to fill these positions may be in short supply in some communities. Competition in these communities for qualified staff could require us to pay higher wages and provide greater benefits. Any inability to recruit and retain qualified individuals may also delay the planned openings of new restaurants and could adversely impact our existing restaurants. Any such inability to retain or recruit qualified employees, increased costs of attracting qualified employees or delays in restaurant openings could adversely affect our business and results of operations.
The failure to enforce and maintain our intellectual property rights could enable others to use names confusingly similar to the names and marks used by our restaurants, which could adversely affect the value of our brands.
We have registered the names Del Frisco’s, Double Eagle Steak House, Sullivan’s, Del Frisco’s Grille and have applications pending to register certain other names and logos used by our restaurants as trade names, trademarks or service marks with the United States Patent and Trademark Office and in certain foreign countries. We have the exclusive right to use these trademarks throughout the United States, other than with respect to one restaurant in Louisville, Kentucky, including the 50 mile surrounding area, where an unrelated third party has the right to use a specific registration of the Del Frisco’s name in Jefferson and Fayette Counties in Kentucky, Marion County in Indiana and Hamilton County in Ohio. In addition, one restaurant in Orlando, Florida operated by an unrelated third party had a license to use the Del Frisco’s name in Orange, Seminole and Ocala counties through June 1, 2013. See “Business—Intellectual Property.” The success of our business depends in part on our continued ability to utilize our existing trade names, trademarks and service marks as currently used in order to increase our brand awareness. In that regard, we believe that our trade names, trademarks and service marks are valuable assets that are critical to our success. The unauthorized use or other misappropriation of our trade names, trademarks or service marks could diminish the value of our brands and restaurant concepts and may cause a decline in our revenues and force us to incur costs related to enforcing our rights. In addition, the use of trade names, trademarks or service marks similar to ours in some markets may keep us from entering those markets. While we may take protective actions with respect to our intellectual property, these actions may not be sufficient to prevent, and we may not be aware of all incidents of, unauthorized usage or imitation by others. Any such unauthorized usage or imitation of our intellectual property, including the costs related to enforcing our rights, could adversely affect our business and results of operations.
Information technology system failures or breaches of our network security, including with respect to confidential information, could interrupt our operations and adversely affect our business.
We rely on our computer systems and network infrastructure across our operations, including point-of-sale processing at our restaurants. Our operations depend upon our ability to protect our computer equipment and systems against damage from physical theft, fire, power loss, telecommunications failure or other catastrophic events, as well as from internal and external security breaches, viruses, worms and other disruptive problems. Any damage or failure of our computer systems or network infrastructure that causes an interruption in our operations could subject us to litigation or actions by regulatory authorities. In addition, the majority of our restaurant sales are by credit or debit cards. Other restaurants and retailers have experienced security breaches in which credit and debit card information of their customers has been stolen. If this or another type of breach occurs at one of our restaurants, we may become subject to lawsuits or other proceedings for purportedly fraudulent transactions arising out of
25
Table of Contents
the actual or alleged theft of our customers’ credit or debit card information. Although we employ both internal resources and external consultants to conduct auditing and testing for weaknesses in our systems, controls, firewalls and encryption and intend to maintain and upgrade our security technology and operational procedures to prevent such damage, breaches or other disruptive problems, there can be no assurance that these security measures will be successful. Any such claim, proceeding or action by a regulatory authority, or any adverse publicity resulting from these allegations, could adversely affect our business and results of operations.
Risks Related to This Offering
The price of our common stock has been volatile and the market price of our common stock may decline and you could lose all or a significant part of your investment.
Following our initial public offering, our stock price has ranged from a high of $23.22 to a low of $11.73. The market price of our common stock could be subject to additional wide fluctuations in response to many factors, some of which are beyond our control, including:
| • | our quarterly or annual earnings or those of other companies in our industry; |
| • | the failure of securities analysts to continue to cover our common stock or changes in financial estimates by analysts who cover us, our competitors or the restaurant industry in general and the fine dining segment in particular; |
| • | announcements by us or our competitors of new locations or menu items, capacity changes, strategic investments or acquisitions; |
| • | actual or anticipated variations in our or our competitors’ operating results, and our and our competitors’ growth rates; |
| • | failure by us or our competitors to meet analysts’ projections or guidance that we or our competitors may give the market; |
| • | general or regional economic conditions; |
| • | fluctuations in operating results; |
| • | additions or departures of our senior management personnel; |
| • | terrorist acts; |
| • | changes in laws or regulations, or new interpretations or applications of laws and regulations, that are applicable to our business; |
| • | changes in accounting standards, policies, guidance, interpretations or principles; |
| • | short sales, hedging and other derivative transactions in the shares of our common stock; |
| • | future sales or issuances of our common stock, including sales or issuances by us, our directors or executive officers and our significant stockholders; |
| • | our dividend policy; and |
| • | investor perceptions of us, our competitors and our industry. |
Furthermore, the stock markets recently have experienced extreme price and volume fluctuations that have affected and continue to affect the market prices of equity securities of many companies. These fluctuations have often been unrelated or disproportionate to the
26
Table of Contents
operating performance of those companies. These broad market and restaurant industry fluctuations, as well as general economic, political and market conditions such as recessions or interest rate changes may cause the market price of our common stock to decline. If the market price of our common stock after this offering does not exceed the public offering price, you may not realize any return on your investment in us and may lose some or all of your investment.
In addition, in the past, companies that have experienced volatility in the market price of their stock have been subject to securities class action litigation. We may be the target of this type of litigation in the future. Securities litigation against us could result in substantial costs and divert our management’s attention from other business concerns, which could seriously harm our business.
If securities or industry analysts do not continue to publish research or reports about our business, or if they change their recommendations regarding our stock adversely, our stock price and trading volume could decline.
The trading market for our common stock is influenced in part by the research and other reports that industry or securities analysts may publish about us or our business. If one or more of the analysts who cover us downgrade our stock or if analysts issue other unfavorable commentary, our stock price would likely decline. If one or more of these analysts cease coverage of our company or fail to regularly publish reports on us, we could lose visibility in the financial markets, which in turn could cause our stock price or trading volume to decline.
Lone Star Fund owns a substantial portion of our common stock, it may have conflicts of interest with other stockholders in the future and its significant ownership will limit your ability to influence corporate matters.
Immediately after this offering, Lone Star Fund will beneficially own 34.0% (or 30.9% if the underwriters fully exercise their option to purchase additional shares) of our outstanding common stock. As a result of this concentration of stock ownership, Lone Star Fund acting on its own will have sufficient voting power to significantly affect the outcome of all matters submitted to our stockholders for approval, including director elections and proposed amendments to our bylaws.
In addition, this concentration of ownership may delay or prevent a merger, consolidation or other business combination or change in control of our company and make some transactions that might otherwise give you the opportunity to realize a premium over the then-prevailing market price of our common stock more difficult or impossible without the support of Lone Star Fund. The interests of Lone Star Fund may not always coincide with our interests as a company or the interests of other stockholders. Accordingly, Lone Star Fund’s voting power could contribute to our entering into transactions or agreements of which you would not approve or make decisions with which you would disagree. This concentration of ownership may also adversely affect our share price.
Additionally, Lone Star Fund is in the business of making investments in companies and may from time to time acquire and hold interests in businesses that compete directly or indirectly with us. Lone Star Fund may also pursue acquisition opportunities that may be complementary to our business, and as a result, those acquisition opportunities may not be available to us. In recognition that principals, members, directors, managers, partners, stockholders, officers, employees and other representatives of Lone Star Fund and its affiliates and investment funds may serve as our directors or officers, our certificate of incorporation provides, among other things, that none of Lone Star Fund or any principal, member, director,
27
Table of Contents
manager, partner, stockholder, officer, employee or other representative of Lone Star Fund has any duty to refrain from engaging directly or indirectly in the same or similar business activities or lines of business that we do. In the event that any of these persons or entities acquires knowledge of a potential transaction or matter which may be a corporate opportunity for itself and us, we will not have any expectancy in such corporate opportunity, and these persons and entities will not have any duty to communicate or offer such corporate opportunity to us and may pursue or acquire such corporate opportunity for itself or direct such opportunity to another person. These potential conflicts of interest could have a material adverse effect on our business, financial condition, results of operations or prospects if, among other things, attractive corporate opportunities are allocated by the sponsors to themselves or their other affiliates. The terms of our certificate of incorporation are more fully described in “Description of Capital Stock—Corporate Opportunities and Transactions with Lone Star Fund.”
Certain of our executive officers will have personal interests in the Offering.
Certain of our executive officers may receive payments in connection with this offering. Specifically, we expect that Mr. Mednansky, our Chief Executive Officer, and Mr. Pennison, our Chief Financial Officer, will be paid a transaction bonus of approximately $ and $ , respectively (or $ and $ , respectively, if the underwriters fully exercise their option to purchase additional shares), by our parent company in connection with this offering, as discussed in greater detail under “Executive Compensation—Payments in Connection with Our Initial Public Offering and this Offering—Transaction Bonuses.”
We are a “controlled company” within the meaning of the NASDAQ rules and, as a result, qualify for, and rely on, exemptions from certain corporate governance requirements.
Because Lone Star Fund currently beneficially owns a majority of our voting power, we are a “controlled company” within the meaning of the NASDAQ corporate governance rules. This status means that we need not comply with certain requirements, including the requirement that a majority of the board of directors consist of independent directors and the requirements that our compensation and nominating and corporate governance committees be comprised entirely of independent directors. We currently utilize these exemptions, and as a result, we do not have a majority of independent directors nor do our nominating and compensation committees consist entirely of independent directors.
Immediately after this offering, Lone Star Fund will beneficially own less than a majority of our voting power, which means we will no longer qualify as a “controlled company” within the meaning of the NASDAQ corporate governance rules. Therefore, we will no longer be eligible to utilize the exemptions described above, and we intend to comply with the applicable transition requirements, including the requirement to have a majority of independent directors and fully-independent compensation and nominating and corporate governance committees, no later than when we are required to do so by the NASDAQ corporate governance standards. Until such time, you will not have the same protections afforded to stockholders of companies that are currently subject to all of the NASDAQ corporate governance requirements.
Future sales of our common stock in the public market could cause our stock price to fall.
If our controlling stockholder sells additional substantial amounts of our common stock in the public market following this offering, the market price of our common stock could decrease significantly. The perception in the public market that our controlling stockholder might sell additional substantial amounts of our common stock could also depress the market price of our common stock. Any such sale or perception could also impair our ability to raise capital or pay for acquisitions using our equity securities.
28
Table of Contents
Immediately after completion of this offering, we will have 23,794,667 shares of common stock outstanding, including 8,094,667 shares that will be beneficially owned by Lone Star Fund (or 7,344,667 shares if the underwriters fully exercise their option to purchase additional shares). Of our issued and outstanding shares, all of the shares sold in this offering will be freely transferable without restriction or additional registration other than shares held by our “affiliates,” as that term is defined in Rule 144 under the Securities Act of 1933, as amended, or the Securities Act. However, following completion of this offering, subject to the terms of the lock-up agreements described below, the shares of common stock still beneficially owned by Lone Star Fund may only be resold into the public markets in accordance with the requirements of Rule 144, including the volume limitations, manner of sale requirements and notice requirements thereof, unless they are registered under the Securities Act. See “Shares Eligible for Future Sale.” We, Lone Star Fund, and our officers and directors have signed lock-up agreements with the underwriters that will, subject to certain exceptions, restrict the sale of shares of our common stock held by them for 90 days following the date of this prospectus, subject to extension in the case of an earnings release or material news or a material event relating to us. Deutsche Bank Securities, Inc. and Piper Jaffray & Co. may, without notice except in certain limited circumstances, release all or any portion of the shares of common stock subject to lock-up agreements. See “Underwriting” for a description of these lock-up agreements. Upon the expiration of the lock-up agreements described above, all of such shares will be eligible for resale in the public market, subject in the case of shares held by our affiliates, to the volume, manner of sale and other limitations under Rule 144. We expect that Lone Star Fund will be considered an affiliate of us 90 days after this offering based on their expected share ownership following this offering.
After completion of this offering, Lone Star Fund will continue to have the right to demand that we file a registration statement with respect to the shares of our common stock held by it, and will have the right to include its shares in any registration statement that we file with the Securities and Exchange Commission, or SEC, subject to certain exceptions. See “Shares Eligible for Future Sale.” Any registration of the shares owned by Lone Star Fund would enable those shares to be sold in the public market, subject to certain restrictions in our registration rights agreement and the restrictions under the lock-up agreements referred to above.
The market price for shares of our common stock may drop significantly when the restrictions on resale by our controlling stockholder lapse or if those restrictions on resale are waived. A decline in the price of shares of our common stock might impede our ability to raise capital through the issuance of additional shares of our common stock or other equity securities. In addition, on August 30, 2012 we filed a registration statement on Form S-8 under the Securities Act registering 2,232,800 shares of our common stock under our stock incentive plan. Subject to the terms of the awards granting the options to purchase the shares included in this registration statement and except for shares issued upon exercise of options held by affiliates who will have certain restrictions on their ability to sell, such shares will be available for sale in the public market. See “Shares Eligible for Future Sale.”
We expect to issue options, restricted stock and other forms of stock-based compensation in the future, which have the potential to dilute stockholder value and cause the price of our common stock to decline.
We currently have options outstanding to purchase 851,500 shares of common stock under our equity incentive plan, none of which are currently vested. However, on July 26, 2013, options to purchase 174,875 of these shares will vest. In addition, we expect to offer stock options, restricted stock and other forms of stock-based compensation to our directors, officers and employees in the future. If the options that we issue are exercised, or any restricted stock
29
Table of Contents
that we may issue vests, and those shares are sold into the public market, the market price of our common stock may decline. In addition, the availability of shares of common stock for award under our equity incentive plan, or the grant of stock options, restricted stock or other forms of stock-based compensation, may adversely affect the market price of our common stock.
Our ability to raise capital in the future may be limited.
Our business and operations may consume resources faster than we anticipate. In the future, we may need to raise additional funds through the issuance of new equity securities, debt or a combination of both. Additional financing may not be available on favorable terms, or at all. If adequate funds are not available on acceptable terms, we may be unable to fund our capital requirements. If we issue new debt securities, the debt holders would have rights senior to common stockholders to make claims on our assets, and the terms of any debt could restrict our operations, including our ability to pay dividends on our common stock. If we issue additional equity securities, existing stockholders will experience dilution, and the new equity securities could have rights senior to those of our common stock. Because our decision to issue securities in any future offering will depend on market conditions and other factors beyond our control, we cannot predict or estimate the amount, timing or nature of our future offerings. Thus, our stockholders bear the risk of our future securities offerings reducing the market price of our common stock and diluting their interest.
We are a holding company and depend on the cash flow of our subsidiaries.
We are a holding company with no material assets other than the equity interests of our subsidiaries. Our subsidiaries conduct substantially all of our operations and own substantially all of our assets and intellectual property. Consequently, our cash flow and our ability to meet our obligations and pay any future dividends to our stockholders depends upon the cash flow of our subsidiaries and the payment of funds by our subsidiaries directly or indirectly to us in the form of dividends, distributions and other payments. Any inability on the part of our subsidiaries to make payments to us could have a material adverse effect on our business, financial condition and results of operations.
Provisions of our charter documents, Delaware law and other documents could discourage, delay or prevent a merger or acquisition at a premium price.
Provisions in our certificate of incorporation and bylaws may have the effect of delaying or preventing a change of control or changes in our management. For example, our certificate of incorporation and bylaws include provisions that:
| • | permit us to issue without stockholder approval preferred stock in one or more series and, with respect to each series, fix the number of shares constituting the series and the designation of the series, the voting powers, if any, of the shares of the series and the preferences and other special rights, if any, and any qualifications, limitations or restrictions, of the shares of the series; |
| • | prevent stockholders from calling special meetings; |
| • | restrict the ability of stockholders to act by written consent after such time as Lone Star Fund owns less than a majority of our common stock, which will occur upon the completion of this offering; |
| • | limit the ability of stockholders to amend our certificate of incorporation and bylaws; |
30
Table of Contents
| • | require advance notice for nominations for election to the board of directors and for stockholder proposals; |
| • | do not permit cumulative voting in the election of our directors, which means that the holders of a majority of our common stock may elect all of the directors standing for election; and |
| • | establish a classified board of directors with staggered three-year terms. |
These provisions may discourage, delay or prevent a merger or acquisition of our company, including a transaction in which the acquiror may offer a premium price for our common stock.
We are also subject to Section 203 of the Delaware General Corporation Law, or the DGCL, which, subject to certain exceptions, prohibits us from engaging in any business combination with any interested stockholder, as defined in that section, for a period of three years following the date on which that stockholder became an interested stockholder. In addition, our equity incentive plan permits vesting of stock options and restricted stock, and payments to be made to the employees thereunder in certain circumstances, in connection with a change of control of our company, which could discourage, delay or prevent a merger or acquisition at a premium price. See “Description of Capital Stock—Provisions of Our Certificate of Incorporation and Bylaws and Delaware Law That May Have an Anti-Takeover Effect.”
We are an “emerging growth company” and we cannot be certain if we will be able to maintain such status.
We are an “emerging growth company,” as defined in the Jumpstart our Business Startups Act of 2012, or JOBS Act, and we have adopted certain exemptions from various reporting requirements that are applicable to other public companies that are not “emerging growth companies.” These exemptions include, but are not limited to, not being required to comply with the auditor attestation requirements of Section 404 of the Sarbanes-Oxley Act of 2002, or the Sarbanes-Oxley Act, reduced disclosure obligations regarding executive compensation in our periodic reports, proxy statements and registration statements, and exemptions from the requirements of holding a nonbinding advisory vote on executive compensation and stockholder approval of any golden parachute payments not previously approved. We may take advantage of these reporting exemptions until we are no longer an “emerging growth company.” We may remain as an “emerging growth company” for up to five full fiscal years following our initial public offering, which occurred July 26, 2012. We would cease to be an “emerging growth company,” and therefore not be able to rely upon the above exemptions, if we have more than $1 billion in annual revenues in a fiscal year, we issue more than $1 billion of non-convertible debt over a three-year period or we have more than $700 million in market value of our common stock held by non-affiliates as of any June 30 before the end of the five full fiscal years.
Additionally, because the JOBS Act has only recently been enacted, it is not yet clear whether investors will accept the more limited disclosure requirements that we may be entitled to follow so long as we qualify as an “emerging growth company.” Therefore, we cannot predict if investors will find our common stock less attractive because we will rely on any of the exemptions discussed above. If some investors find our common stock less attractive as a result, there may be a less active trading market for our common stock and our stock price may be more volatile.
31
Table of Contents
If we are unable to implement and maintain the effectiveness of our internal control over financial reporting, our independent registered public accounting firm may not be able to provide an unqualified report on our internal controls.
Pursuant to Section 404 of the Sarbanes-Oxley Act and the related rules adopted by the SEC and the Public Company Accounting Oversight Board, starting with our Annual Report on Form 10-K for fiscal year 2013, our management will be required to report on the effectiveness of our internal control over financial reporting. In addition, once we no longer qualify as an “emerging growth company” under the JOBS Act and lose the ability to rely on the exemptions related thereto discussed above, our independent registered public accounting firm will also need to attest to the effectiveness of our internal control over financial reporting under Section 404. We may encounter problems or delays in completing the implementation of any changes necessary to our internal control over financial reporting to conclude such controls are effective. If we conclude and, once we no longer qualify as an “emerging growth company” under the JOBS Act, our independent registered public accounting firm concludes, that our internal control over financial reporting is not effective, investor confidence and our stock price could decline.
Matters impacting our internal controls may cause us to be unable to report our financial information on a timely basis and thereby subject us to adverse regulatory consequences, including sanctions by the SEC or violations of NASDAQ listing rules, and result in a breach of the covenants under our financing arrangements. There also could be a negative reaction in the financial markets due to a loss of investor confidence in us and the reliability of our financial statements. Confidence in the reliability of our financial statements also could suffer if we or our independent registered public accounting firm were to report a material weakness in our internal controls over financial reporting. This could materially adversely affect us and lead to a decline in the price of our common stock.
Because we do not anticipate paying any dividends for the foreseeable future, you may not receive any return on your investment unless you sell your common stock for a price greater than that which you paid for it.
Although the agreements governing our indebtedness do not directly restrict our ability to do so, we do not anticipate paying any dividends to our stockholders for the foreseeable future. Accordingly, you may have to sell some or all of your common stock in order to generate cash flow from your investment. You may not receive a gain on your investment when you sell our common stock and may lose some or the entire amount of your investment. Any determination to pay dividends in the future will be at the discretion of our board of directors and will depend upon our financial condition, operating results, contractual restrictions, restrictions imposed by applicable law and other factors our board of directors deems relevant.
As a public company, we incur significant costs and face demands on our management to comply with the SEC and NASDAQ requirements.
We are required as a public company to comply with an extensive body of regulations, including provisions of the Sarbanes-Oxley Act as well as rules and regulations promulgated by the SEC and NASDAQ. These rules and regulations could result in substantial legal and financial compliance costs and make some activities more time-consuming and costly, and these costs and demands may increase after we are no longer an “emerging growth company.” In addition, we incur costs associated with our public company reporting requirements and maintaining directors’ and officers’ liability insurance. Furthermore, our management has increased demands on its time in order to ensure we comply with public company reporting requirements and the compliance requirements of the Sarbanes-Oxley Act, as well as any rules and requirements subsequently implemented by the SEC and NASDAQ.
32
Table of Contents
Our reported financial results may be adversely affected by changes in accounting principles applicable to us.
Generally accepted accounting principles in the U.S. are subject to interpretation by the Financial Accounting Standards Board, or FASB, the American Institute of Certified Public Accountants, the SEC and various bodies formed to promulgate and interpret appropriate accounting principles. A change in these principles or interpretations could have a significant effect on our reported financial results, and could affect the reporting of transactions completed before the announcement of a change. In addition, the SEC has announced a multi-year plan that could ultimately lead to the use of International Financial Reporting Standards by U.S. issuers in their SEC filings. Any such change could have a significant effect on our reported financial results.
33
Table of Contents
CAUTIONARY STATEMENT REGARDING FORWARD-LOOKING STATEMENTS
This prospectus includes “forward-looking statements” within the meaning of Section 27A of the Securities Act and Section 21E of the Exchange Act, and such statements are subject to the safe harbors created thereby. Forward-looking statements are those that do not relate solely to historical fact. They include, but are not limited to, any statement that may predict, forecast, indicate or imply future results, performance, achievements or events. They may contain words such as “believe,” “expect,” “anticipate,” “estimate,” “intend,” “plan,” “target,” “project,” “likely,” “will,” “would,” “could” and words or phrases of similar meaning. Forward-looking statements may relate to, among other things:
| • | our ability to successfully adjust to changes in consumer preferences, discretionary spending patterns and general economic conditions, including recent economic events; |
| • | our restaurants’ ability to successfully compete; |
| • | our expectations regarding future growth, including our ability to open new restaurants and operate them profitably; |
| • | our ability to continue to develop the Grille and any other new concepts; |
| • | our ability to maintain and grow our reputation and the acceptance of our brands; |
| • | our expectations regarding higher operating costs, including labor costs; |
| • | our ability to obtain our principal food products and manage related costs; |
| • | our expectations regarding the seasonality of our business; |
| • | our expectations regarding litigation or other legal proceedings; |
| • | the impact of federal, state or local government statutes, rules and regulations; |
| • | our expectations regarding the loss of key members of our management team or employees; |
| • | our expectations regarding our liquidity and capital resources, including our ability to meet our lease obligations; |
| • | our expectations regarding the amount and terms of our existing or future indebtedness; |
| • | our ability to maintain adequate protection of our intellectual property; and |
| • | the other matters described in “Risk Factors,” “Management’s Discussion and Analysis of Financial Condition and Results of Operations,” and “Business.” |
Given these risks and uncertainties, we urge you to read this prospectus completely with the understanding that actual future results may be materially different from what we plan or expect. These factors and the other risk factors described in this prospectus are not necessarily all of the important factors that could cause actual results or developments to differ materially from those expressed in any of our forward-looking statements. Consequently, there can be no assurance that actual results or developments anticipated by us will be realized or, even if substantially realized, that they will have the expected consequences to, or effects on, us. Given these uncertainties, prospective investors are cautioned not to place undue reliance on forward-looking statements.
All future written and verbal forward-looking statements attributable to us or any person acting on our behalf are expressly qualified in their entirety by the cautionary statements contained or referred to in this section. We undertake no obligation to publicly update or revise any forward-looking statements, whether as a result of new information, future events or otherwise. In light of these risks, uncertainties and assumptions, the forward-looking statements made in this prospectus may not prove to be correct.
34
Table of Contents
The selling stockholder will receive all net proceeds from the sale of the shares of common stock to be sold in this offering. We will not receive any of the proceeds from the sale of our common stock by the selling stockholder.
35
Table of Contents
PRICE RANGE OF OUR COMMON STOCK
Our common stock is listed on the Nasdaq Global Select Market under the symbol “DFRG.” The following table sets forth, for the periods indicated, the high and low sales prices per share for our common stock as quoted by the Nasdaq Global Select Market.
| High | Low | |||||||
| 2013 |
||||||||
| Third Quarter (June 12, 2013—July 15, 2013) |
$ | 23.22 | $ | 19.50 | ||||
| Second Quarter (March 20, 2013—June 11, 2013) |
$ | 20.56 | $ | 15.63 | ||||
| First Quarter (December 26, 2012—March 19, 2013) |
$ | 19.00 | $ | 13.75 | ||||
| 2012 |
||||||||
| Fourth Quarter (September 5, 2012—December 25, 2012) |
$ | 16.84 | $ | 12.67 | ||||
| Third Quarter (July 27, 2012—September 4, 2012) |
$ | 14.90 | $ | 11.73 | ||||
The closing sale price of a share of our common stock, as reported by the Nasdaq Global Select Market, on July 15, 2013, was $22.59. As of July 15, 2013, there were two holders of record of our common stock, not including beneficial owners of shares registered in nominee or street name.
36
Table of Contents
We have never declared or paid any cash dividends on our common stock and do not anticipate paying cash dividends on our common stock for the foreseeable future. We anticipate that we will retain all of our future earnings, if any, for use in the development and expansion of our business and for general corporate purposes. Any determination to pay dividends in the future will be at the discretion of our board of directors and will depend upon our financial condition, operating results and other factors our board of directors deems relevant.
Our credit facility contains, and debt instruments that we enter into in the future may contain, covenants that place limitations on the amount of dividends we may pay. In addition, under Delaware law, our board of directors may declare dividends only to the extent of our surplus, which is defined as total assets at fair market value minus total liabilities, minus statutory capital, or, if there is no surplus, out of our net profits for the then current and immediately preceding year.
37
Table of Contents
The table below sets forth our cash and cash equivalents and capitalization as of June 11, 2013. You should read this table together with the information in this prospectus under “Selected Consolidated and Combined Financial Data” and “Management’s Discussion and Analysis of Financial Condition and Results of Operations,” and with the consolidated financial statements and the related notes to those statements included elsewhere in this prospectus.
| As of June 11, 2013 |
||||
| (Unaudited) | ||||
| (in thousands) | ||||
| Cash and cash equivalents |
$ | 14,443 | ||
|
|
|
|||
| Credit facility, including current portion |
$ | — | ||
| Stockholders’ equity: |
||||
| Preferred stock, $0.001 par value, 10,000,000 shares authorized, no shares issued and outstanding at December 25, 2012 |
— | |||
| Common stock, $0.001 par value, 190,000,000 shares authorized, 23,794,667 shares issued and outstanding at December 25, 2012 |
24 | |||
| Additional paid in capital |
121,855 | |||
| Retained earnings |
66,267 | |||
|
|
|
|||
| Total stockholders’ equity |
188,146 | |||
|
|
|
|||
| Total capitalization |
$ | 188,146 | ||
|
|
|
|||
38
Table of Contents
SELECTED CONSOLIDATED AND COMBINED FINANCIAL DATA
We have derived the selected consolidated financial data as of December 27, 2011 and December 25, 2012 and for the fiscal years ended December 28, 2010, December 27, 2011 and December 25, 2012 from our audited consolidated financial statements appearing elsewhere in this prospectus. We have derived the consolidated financial data as of December 30, 2008, December 29, 2009, and December 28, 2010 and for the fiscal years ended December 30, 2008 and December 29, 2009 from our audited historical financial statements not included elsewhere in this prospectus. We have derived the summary income statement data for each of the 24 weeks ended June 12, 2012 and June 11, 2013 and the summary balance sheet data as of June 11, 2013 from our unaudited interim consolidated financial statements appearing elsewhere in this prospectus. In the opinion of management, these unaudited interim consolidated financial statements include all adjustments, consisting of normal recurring adjustments, necessary for a fair presentation of our financial position and operating results for these periods. Results from interim periods are not necessarily indicative of results that may be expected for the entire year.
The selected consolidated financial data below represent portions of our financial statements and are not complete. You should read this information together with “Management’s Discussion and Analysis of Financial Condition and Results of Operations” and our consolidated financial statements and the related notes to those statements included elsewhere in this prospectus. Historical results are not necessarily indicative of future performance.
| Fiscal Year Ended(1) | 24 Weeks Ended | |||||||||||||||||||||||||||
| December 30, 2008 |
December 29, 2009 |
December 28, 2010 |
December 27, 2011 |
December 25, 2012 |
June 12, 2012 |
June 11, 2013 |
||||||||||||||||||||||
| (in thousands, except per share amounts) | ||||||||||||||||||||||||||||
| Income Statement Data: |
||||||||||||||||||||||||||||
| Revenues |
$ | 174,919 | $ | 157,408 | $ | 162,855 | $ | 198,625 | $ | 232,435 | $ | 103,678 | $ | 120,162 | ||||||||||||||
| Costs and expenses: |
||||||||||||||||||||||||||||
| Costs of sales |
57,392 | 46,753 | 49,481 | 60,743 | 71,093 | 31,963 | 36,533 | |||||||||||||||||||||
| Restaurant operating expenses |
71,567 | 67,537 | 71,917 | 86,311 | 100,143 | 43,778 | 53,454 | |||||||||||||||||||||
| Marketing and advertising costs |
3,378 | 3,435 | 2,744 | 4,246 | 4,682 | 2,006 | 2,256 | |||||||||||||||||||||
| Pre-opening costs |
2,469 | 493 | 798 | 3,018 | 4,058 | 902 | 919 | |||||||||||||||||||||
| General and administrative |
6,354 | 8,236 | 7,512 | 10,640 | 13,449 | 5,400 | 7,938 | |||||||||||||||||||||
| Costs associated with strategic alternatives |
2,379 | — | — | — | — | — | — | |||||||||||||||||||||
| Management and accounting fees paid to related party |
2,104 | 2,878 | 3,345 | 3,399 | 1,252 | 1,196 | — | |||||||||||||||||||||
| Asset advisory agreement termination fee |
— | — | — | — | 3,000 | — | — | |||||||||||||||||||||
| Secondary public offering costs |
— | — | — | — | — | — | 412 | |||||||||||||||||||||
| Public offering transaction bonuses |
— | — | — | — | 1,462 | — | 1,805 | |||||||||||||||||||||
| Depreciation and amortization |
4,409 | 6,268 | 6,459 | 6,998 | 8,675 | 3,570 | 5,006 | |||||||||||||||||||||
|
|
|
|
|
|
|
|
|
|
|
|
|
|
|
|||||||||||||||
| Operating income |
24,867 | 21,808 | 20,599 | 23,270 | 24,621 | 14,863 | 11,839 | |||||||||||||||||||||
| Other income (expense), net: |
||||||||||||||||||||||||||||
| Interest expense-affiliates |
(2,295 | ) | (2,281 | ) | (1,775 | ) | — | — | — | — | ||||||||||||||||||
| Interest expense-other |
(10,147 | ) | (5,942 | ) | (9,906 | ) | (6,355 | ) | (2,920 | ) | (2,228 | ) | (48 | ) | ||||||||||||||
| Write-off of debt issuance costs |
— | — | — | (2,501 | ) | (1,649 | ) | — | — | |||||||||||||||||||
| Dissenting shareholders expense |
— | (1,583 | ) | — | — | — | — | — | ||||||||||||||||||||
| Other, net |
(182 | ) | 36 | (249 | ) | (114 | ) | 113 | 65 | — | ||||||||||||||||||
|
|
|
|
|
|
|
|
|
|
|
|
|
|
|
|||||||||||||||
| Income from continuing operations before income taxes |
12,243 | 12,038 | 8,669 | 14,300 | 20,165 | 12,700 | 11,791 | |||||||||||||||||||||
| Income tax expense (benefit) |
5,136 | 3,454 | (88 | ) | 4,653 | 5,592 | 4,172 | 3,791 | ||||||||||||||||||||
|
|
|
|
|
|
|
|
|
|
|
|
|
|
|
|||||||||||||||
| Income from continuing operations |
$ | 7,107 | $ | 8,584 | $ | 8,757 | $ | 9,647 | $ | 14,573 | $ | 8,528 | $ | 8,000 | ||||||||||||||
|
|
|
|
|
|
|
|
|
|
|
|
|
|
|
|||||||||||||||
| Discontinued operations, net of income tax benefit |
(163 | ) | 28 | (27 | ) | (674 | ) | (819 | ) | 84 | — | |||||||||||||||||
|
|
|
|
|
|
|
|
|
|
|
|
|
|
|
|||||||||||||||
| Net income |
$ | 6,944 | $ | 8,612 | $ | 8,730 | $ | 8,973 | $ | 13,754 | $ | 8,612 | $ | 8,000 | ||||||||||||||
|
|
|
|
|
|
|
|
|
|
|
|
|
|
|
|||||||||||||||
39
Table of Contents
| Fiscal Year Ended(1) | 24 Weeks Ended | |||||||||||||||||||||||||||
| December 30, 2008 |
December 29, 2009 |
December 28, 2010 |
December 27, 2011 |
December 25, 2012 |
June 12, 2012 |
June 11, 2013 |
||||||||||||||||||||||
| (in thousands, except per share amounts) | ||||||||||||||||||||||||||||
| Basic net income (loss) per common share(2): |
||||||||||||||||||||||||||||
| Continuing operations |
$ | 0.40 | $ | 0.48 | $ | 0.49 | $ | 0.54 | $ | 0.71 | $ | 0.47 | $ | 0.34 | ||||||||||||||
| Discontinued operations |
(0.01 | ) | 0.00 | (0.00 | ) | (0.04 | ) | (0.04 | ) | 0.01 | 0.00 | |||||||||||||||||
|
|
|
|
|
|
|
|
|
|
|
|
|
|
|
|||||||||||||||
| Basic net income per share |
$ | 0.39 | $ | 0.48 | $ | 0.49 | $ | 0.50 | $ | 0.67 | $ | 0.48 | $ | 0.34 | ||||||||||||||
|
|
|
|
|
|
|
|
|
|
|
|
|
|
|
|||||||||||||||
| Diluted net income (loss) per common share(2): |
||||||||||||||||||||||||||||
| Continuing operations |
$ | 0.40 | $ | 0.48 | $ | 0.49 | $ | 0.54 | $ | 0.71 | $ | 0.47 | $ | 0.34 | ||||||||||||||
| Discontinued operations |
(0.01 | ) | 0.00 | (0.00 | ) | (0.04 | ) | (0.04 | ) | 0.01 | 0.00 | |||||||||||||||||
|
|
|
|
|
|
|
|
|
|
|
|
|
|
|
|||||||||||||||
| Diluted net income per share |
$ | 0.39 | $ | 0.48 | $ | 0.49 | $ | 0.50 | $ | 0.67 | $ | 0.48 | $ | 0.34 | ||||||||||||||
|
|
|
|
|
|
|
|
|
|
|
|
|
|
|
|||||||||||||||
| Weighted average shares used in computing net income per common share(2): |
||||||||||||||||||||||||||||
| Basic |
17,994,667 | 17,994,667 | 17,994,667 | 17,994,667 | 20,432,579 | 17,994,667 | 23,794,667 | |||||||||||||||||||||
|
|
|
|
|
|
|
|
|
|
|
|
|
|
|
|||||||||||||||
| Diluted |
17,994,667 | 17,994,667 | 17,994,667 | 17,994,667 | 20,432,579 | 17,994,667 | 23,794,869 | |||||||||||||||||||||
|
|
|
|
|
|
|
|
|
|
|
|
|
|
|
|||||||||||||||
| December 30, 2008 |
December 29, 2009 |
December 28, 2010 |
December 27, 2011 |
December 25, 2012 |
June 11, 2013 |
|||||||||||||||||||
| (in thousands) | ||||||||||||||||||||||||
| Balance Sheet Data (at end of period): |
||||||||||||||||||||||||
| Cash and cash equivalents |
$ | 7,292 | $ | 13,257 | $ | 4,157 | $ | 14,119 | $ | 10,763 | $ | 14,443 | ||||||||||||
| Working capital (deficit)(3) |
(34,177 | ) | 1,061 | (232 | ) | 2,940 | (755 | ) | 8,038 | |||||||||||||||
| Total assets |
225,170 | 236,424 | 217,725 | 234,274 | 258,385 | 266,244 | ||||||||||||||||||
| Total debt |
151,706 | 150,544 | 78,922 | 70,000 | — | — | ||||||||||||||||||
| Total stockholders’ equity |
(10,579 | ) | 32,741 | 87,155 | 95,872 | 177,901 | 188,146 | |||||||||||||||||
| Fiscal Year Ended(1) | 24 Weeks Ended | |||||||||||||||||||||||||||
| December 30, 2008 |
December 29, 2009 |
December 28, 2010 |
December 27, 2011 |
December 25, 2012 |
June 12, 2012 |
June 11, 2013 |
||||||||||||||||||||||
| (in thousands, except restaurant and percentage amounts) | ||||||||||||||||||||||||||||
| Other Financial Data: |
||||||||||||||||||||||||||||
| Net cash provided by operating activities |
$ | 16,003 | $ | 18,916 | $ | 11,999 | $ | 28,503 | $ | 30,968 | $ | 12,691 | $ | 12,151 | ||||||||||||||
| Net cash used in investing activities |
(16,947 | ) | (28,538 | ) | (1,210 | ) | (7,151 | ) | (32,173 | ) | (12,545 | ) | (10,250 | ) | ||||||||||||||
| Net cash provided by (used in) financing activities |
75 | 15,587 | (19,889 | ) | (11,390 | ) | (2,151 | ) | (8,500 | ) | 1,779 | |||||||||||||||||
| Capital Expenditures |
21,422 | 7,755 | 5,550 | 20,063 | 33,635 | 12,429 | 10,230 | |||||||||||||||||||||
| Adjusted EBITDA(4) |
34,255 | 30,204 | 29,926 | 36,415 | 43,005 | 20,531 | 19,981 | |||||||||||||||||||||
| Adjusted EBITDA |
19.6 | % | 19.2 | % | 18.4 | % | 18.3 | % | 18.5 | % | 19.8 | % | 16.6 | % | ||||||||||||||
| Restaurant-level |
42,230 | 39,683 | 38,713 | 47,325 | 56,454 | 25,931 | 27,919 | |||||||||||||||||||||
| Restaurant-level EBITDA Margin(6) |
24.1 | % | 25.2 | % | 23.8 | % | 23.8 | % | 24.3 | % | 25.0 | % | 23.2 | % | ||||||||||||||
| Operating Data: |
||||||||||||||||||||||||||||
| Total Restaurants (at end of period) |
25 | 26 | 27 | 30 | 34 | 32 | 35 | |||||||||||||||||||||
| Total comparable restaurants (at end of period)(7) |
20 | 22 | 26 | 26 | 28 | 28 | 29 | |||||||||||||||||||||
| Average sales per comparable restaurant |
$ | 7,724 | $ | 6,199 | $ | 6,237 | $ | 6,802 | $ | 7,457 | $ | 3,451 | $ | 3,479 | ||||||||||||||
| Percentage change in comparable restaurant sales(7) |
(2.2 | )% | (18.6 | )% | 4.4 | % | 11.2 | % | 4.2 | % | 5.4 | % | 1.0 | % | ||||||||||||||
| (1) | We utilize a 52- or 53-week accounting period which ends on the last Tuesday of December. The fiscal year ended December 30, 2008 had 53 weeks. The fiscal years ended December 29, 2009, December 28, 2010, December 27, 2011 and December 25, 2012 each had 52 weeks. |
40
Table of Contents
| (2) | Basic and diluted income per share is computed by dividing net income for each period by the shares of common stock issued following our conversion from a limited liability company to a corporation immediately prior to the effectiveness of our initial public offering. Such shares are assumed to be outstanding for all periods presented. |
| (3) | Defined as total current assets minus total current liabilities. |
| (4) | Adjusted EBITDA and restaurant-level EBITDA are metrics used by management to measure operating performance. Adjusted EBITDA represents net income before interest, taxes, and depreciation and amortization, plus the sum of certain non-operating expenses, including pre-opening costs, management fees and expenses, asset advisory agreement termination fees, public offering transaction bonuses and secondary public offering costs. Restaurant-level EBITDA represents net income before interest, taxes and depreciation and amortization, plus the sum of certain non-operating expenses, including pre-opening costs, management fees and expenses, asset advisory agreement termination fees, public offering transaction bonuses, secondary public offering costs and general and administrative expenses. |
The following table presents a reconciliation of adjusted EBITDA and restaurant-level EBITDA to net income:
| Fiscal Year Ended(1) | 24 Weeks Ended | |||||||||||||||||||||||||||
| December 30, 2008 |
December 29, 2009 |
December 28, 2010 |
December 27, 2011 |
December 25, 2012 |
June 12, 2012 |
June 11, 2013 |
||||||||||||||||||||||
| (in thousands) | ||||||||||||||||||||||||||||
| Income from continuing operations |
$ | 7,107 | $ | 8,584 | $ | 8,757 | $ | 9,647 | $ | 14,573 | $ | 8,528 | $ | 8,000 | ||||||||||||||
| Income tax expense (benefit) |
5,136 | 3,454 | (88 | ) | 4,653 | 5,592 | 4,172 | 3,791 | ||||||||||||||||||||
| Interest income |
(170 | ) | (36 | ) | (75 | ) | (16 | ) | (9 | ) | (6 | ) | — | |||||||||||||||
| Interest expense-other |
10,147 | 5,942 | 9,906 | 6,355 | 2,920 | 2,228 | 48 | |||||||||||||||||||||
| Interest expense-affiliate |
2,295 | 2,281 | 1,775 | — | — | — | — | |||||||||||||||||||||
| Write-off of debt issuance costs |
— | — | — | 2,501 | 1,649 | — | — | |||||||||||||||||||||
| Depreciation and amortization |
4,409 | 6,268 | 6,459 | 6,998 | 8,675 | 3,570 | 5,006 | |||||||||||||||||||||
| Pre-opening costs |
2,469 | 493 | 798 | 3,018 | 4,058 | 902 | 919 | |||||||||||||||||||||
| Lease guarantee payments and other |
— | — | 324 | 130 | (167 | ) | (59 | ) | — | |||||||||||||||||||
| Dissenting shareholders expense |
— | 1,583 | — | — | — | — | — | |||||||||||||||||||||
| Costs associated with strategic alternatives |
2,379 | — | — | — | — | — | — | |||||||||||||||||||||
| Management fees and expenses(a) |
483 | 1,635 | 2,070 | 3,129 | 1,252 | 1,196 | — | |||||||||||||||||||||
| Asset advisory agreement termination fee |
— | — | — | — | 3,000 | — | — | |||||||||||||||||||||
| Public offering transaction bonuses |
— | — | — | — | 1,462 | — | 1,805 | |||||||||||||||||||||
| Secondary public offering costs |
— | — | — | — | — | — | 412 | |||||||||||||||||||||
|
|
|
|
|
|
|
|
|
|
|
|
|
|
|
|||||||||||||||
| Adjusted EBITDA |
$ | 34,255 | $ | 30,204 | $ | 29,926 | $ | 36,415 | $ | 43,005 | $ | 20,531 | $ | 19,981 | ||||||||||||||
| General and administrative |
6,354 | 8,236 | 7,512 | 10,640 | 13,449 | 5,400 | 7,938 | |||||||||||||||||||||
| Related party shared services fees |
1,621 | 1,243 | 1,275 | 270 | — | — | — | |||||||||||||||||||||
|
|
|
|
|
|
|
|
|
|
|
|
|
|
|
|||||||||||||||
| Restaurant-level EBITDA |
$ | 42,230 | $ | 39,683 | $ | 38,713 | $ | 47,325 | $ | 56,454 | $ | 25,931 | $ | 27,919 | ||||||||||||||
|
|
|
|
|
|
|
|
|
|
|
|
|
|
|
|||||||||||||||
| (a) | Includes asset management fees and expenses paid to an affiliate of Lone Star Fund pursuant to our asset advisory agreement, but excludes amounts paid to another affiliate of Lone Star Fund for accounting, administrative and management services under our shared services agreement, which is referred to as the related party shared services fee. See “Management’s Discussion and Analysis of Financial Condition and Results of Operations—Key Financial Definitions—Management and Accounting Fees Paid to Related Party.” |
We present adjusted EBITDA and restaurant-level EBITDA as supplemental performance measures because we believe they facilitate a comparative assessment of our operating performance relative to our performance based
41
Table of Contents
on our results under generally accepted accounting principles in the United States, or GAAP, while isolating the effects of some items that vary from period to period without any correlation to core operating performance. Specifically, adjusted EBITDA allows for an assessment of our operating performance without the effect of non-cash depreciation and amortization expenses or our ability to service or incur indebtedness. Restaurant-level EBITDA allows for further assessment of our operating performance by eliminating the effect of general and administrative expenses incurred at the corporate level. These measures also function as a benchmark to evaluate our operating performance or compare our performance to that of our competitors because companies within our industry exhibit significant variations with respect to capital structures and cost of capital (which affect interest expense and tax rates) and differences in book depreciation of facilities and equipment (which affect relative depreciation expense), including significant differences in the depreciable lives of similar assets among various companies.
This prospectus also includes information concerning adjusted EBITDA margin, which is defined as the ratio of adjusted EBITDA to revenues, and restaurant-level EBITDA margin, which is defined as the ratio of restaurant-level EBITDA to revenues. We present adjusted EBITDA margin and restaurant-level EBITDA margin because they are used by management as a performance measurement to judge the level of adjusted EBITDA and restaurant-level EBITDA, respectively, generated from revenues. We believe their inclusion is appropriate to provide additional information to investors and other external users of our financial statements.
Adjusted EBITDA, restaurant-level EBITDA, adjusted EBITDA margin and restaurant-level EBITDA margin are not measurements of our financial performance under GAAP and should not be considered in isolation or as an alternative to net income, net cash provided by operating, investing or financing activities or any other financial statement data presented as indicators of financial performance or liquidity, each as presented in accordance with GAAP. We understand that although adjusted EBITDA is frequently used by securities analysts, lenders and others in their evaluation of companies, it and restaurant-level EBITDA have limitations as analytical tools, and you should not consider them in isolation, or as substitutes for analysis of our results as reported under GAAP, as adjusted EBITDA and restaurant-level EBITDA do not reflect:
| • | discretionary cash available to us to invest in the growth of our business; |
| • | changes in, or cash requirements for, our working capital needs; |
| • | our capital expenditures or future requirements for capital expenditures; |
| • | the interest expense, or the cash requirements necessary to service interest or principal payments, associated with our indebtedness; or |
| • | depreciation and amortization, which are non-cash charges, although the assets being depreciated and amortized will likely have to be replaced in the future, and adjusted EBITDA does not reflect any cash requirements for such replacements. |
| (5) | Adjusted EBITDA margin is the ratio of adjusted EBITDA to revenues. |
| (6) | Restaurant-level EBITDA margin is the ratio of restaurant-level EBITDA to revenues. |
| (7) | We consider a restaurant to be comparable in the first full fiscal period following the eighteenth month of operations. Changes in comparable restaurant sales reflect changes in sales for the comparable group of restaurants over a specified period of time. |
42
Table of Contents
MANAGEMENT’S DISCUSSION AND ANALYSIS OF
FINANCIAL CONDITION AND RESULTS OF OPERATIONS
The following discussion and analysis of our consolidated financial condition and results of operations for the 24 weeks ended June 11, 2013 and June 12, 2012 and for the fiscal years ended December 25, 2012, December 27, 2011 and December 28, 2010 should be read in conjunction with “Selected Consolidated and Combined Financial Data” and the consolidated and combined financial statements and related notes to those statements included elsewhere in this prospectus. Some of the information contained in this discussion and analysis or set forth elsewhere in this prospectus, including information with respect to our plans and strategies for our business, includes forward-looking statements that involve risks and uncertainties. You should review the section entitled “Risk Factors” for a discussion of important factors that could cause actual results to differ materially from the results described in, or implied by, the forward-looking statements contained in this prospectus.
Overview
We develop, own and operate three contemporary, high-end, complementary restaurants: Del Frisco’s Double Eagle Steak House, Sullivan’s Steakhouse, and Del Frisco’s Grille. We are a leader in the full-service steakhouse industry based on average unit volume, or AUV, EBITDA margin and comparable restaurant sales growth. We currently operate 36 restaurants in 19 states. Each of our three restaurant concepts offers steaks as well as other menu selections, such as chops and fresh seafood. Our Grille concept is designed to appeal to both business as well as upscale casual diners and features relatively less expensive entrées, such as flatbread pizzas, sandwiches and salads. These menu selections are complemented by an extensive, award-winning wine list. Del Frisco’s, Sullivan’s and the Grille are positioned within the fine dining segment and are designed to appeal to both business and local dining customers. Our Del Frisco’s restaurants are sited in urban locations to target customers seeking a “destination dining” experience while our Sullivan’s and Grille restaurants are intended to appeal to a broader demographic, allowing them to be located either in urban areas or in close proximity to affluent residential neighborhoods. We believe our success reflects consistent execution across all aspects of the dining experience, from the formulation of proprietary recipes to the procurement and presentation of high quality menu items and delivery of a positive customer experience.
We believe we have an attractive unit economic model that enables us to generate our AUV and adjusted EBITDA margins. We generated revenues of $232.4 million for the fiscal year ended December 25, 2012, representing 17.0% total revenue growth and 4.2% comparable restaurant sales growth over 2011. We recorded net income of $13.8 million and adjusted EBITDA of $43.0 million for 2012, representing 53.3% net income growth and 18.1% adjusted EBITDA growth over 2011. Our 2012 operating income and adjusted EBITDA margins were 10.7% and 18.5%, respectively. We generated revenues of $120.2 million for the 24 weeks ended June 11, 2013, representing 15.9% total revenue growth and 1.0% comparable restaurant sales growth over the 24 weeks ended June 12, 2012. We recorded net income of $8.0 million and adjusted EBITDA of $20.0 million for the 24 weeks ended June 11, 2013, representing a 7.1% and 2.7% decrease in net income and adjusted EBITDA, respectively, as compared to the 24 weeks ended June 12, 2012. Our operating income and adjusted EBITDA margins for the 24 weeks ended June 11, 2013 were 9.9% and 16.6%, respectively. For a reconciliation of adjusted EBITDA and adjusted EBITDA margin and a discussion of why we consider them useful, see “Selected Consolidated and Combined Financial Data.”
We operate our Del Frisco’s, Sullivan’s and Grille concepts as operating segments. Each concept operates domestically within the same industry and offers similar food and beverage
43
Table of Contents
choices to similar customers without relying on any major customer as a source of revenue. The concepts also possess similar economic characteristics, which result in similar expectations regarding the characteristics of their long-term financial performance. However, the Del Frisco’s and Sullivan’s operating segments have different margins because the Del Frisco’s segment can leverage its higher revenues, driven primarily by its larger restaurants and higher average check, on certain fixed operating costs, such as labor, rent, utilities and maintenance. Our segment reporting is discussed in greater detail in the notes to the consolidated financial statements included elsewhere in this prospectus.
Our Growth Strategies and Outlook
Our growth model is comprised of the following three primary drivers:
| • | Pursue Disciplined Restaurant Growth. We believe that there are significant opportunities to grow our concepts on a nationwide basis in both existing and new markets where we believe we can generate attractive unit-level economics. We are presented with many development opportunities and we carefully evaluate each opportunity to determine that sites selected for development have a high probability of meeting our return on investment targets. Our disciplined growth strategy includes accepting only those sites that we believe present attractive rent and tenant allowance structures as well as reasonable construction costs given the sales potential of the site. We believe our concepts’ complementary market positioning and ability to coexist in the same markets, coupled with our flexible unit models, will allow us to expand each of our three concepts into a greater number of locations. |
| • | Grow Existing Revenue. We will continue to pursue opportunities to increase the sales and average check at our existing restaurants, pursue targeted local marketing efforts and evaluate operational initiatives, including growth in private dining, designed to increase restaurant unit volumes. |
| • | Maintain Margins Throughout Our Growth. We will continue to aggressively protect our margins using economies of scale, including marketing and purchasing synergies between our concepts and leveraging our corporate infrastructure as we continue to open new restaurants. |
We believe there are opportunities to open four to six restaurants annually, generally composed of one Del Frisco’s and three to five Sullivan’s and/or Grilles, with new openings of our Grille concept likely serving as the primary driver of new unit growth in the near term. In 2013, we have to date opened Grilles in Houston, Texas and Santa Monica, California and expect to open three to four additional Grilles by the end of the year. See “Business—Site Selection and Development” for a discussion of our targeted average cash investment for each concept and other information regarding the opening of a new location.
Performance Indicators
We use the following key metrics in evaluating the performance of our restaurants:
| • | Comparable Restaurant Sales. We consider a restaurant to be comparable during the first full fiscal period following the eighteenth month of operations. Changes in comparable restaurant sales reflect changes in sales for the comparable group of restaurants over a specified period of time. Changes in comparable sales reflect changes in customer count trends as well as changes in average check. Our comparable restaurant base consisted of 26, 26, 28 and 29 restaurants at December 28, 2010, December 27, 2011 and December 25, 2012 and June 11, 2013, respectively. |
44
Table of Contents
| • | Average Check. Average check is calculated by dividing total restaurant sales by customer counts for a given time period. Average check is influenced by menu prices and menu mix. Management uses this indicator to analyze trends in customers’ preferences, the effectiveness of menu changes and price increases and per customer expenditures. |
| • | Average Unit Volume. Average unit volume, or AUV, consists of the average sales of our restaurants over a certain period of time. This measure is calculated by dividing total restaurant sales within a period by the number of restaurants operating during the relevant period. This indicator assists management in measuring changes in customer traffic, pricing and development of our concepts. |
| • | Customer Counts. Customer counts are measured by the number of entrées ordered at our restaurants over a given time period. |
| • | Adjusted EBITDA Margin. Adjusted EBITDA margin represents net income before interest, taxes and depreciation and amortization plus the sum of certain non-operating expenses, including pre-opening costs, management fees and expenses, asset advisory agreement termination fees, public offering transaction bonuses and secondary public offering costs as a percentage of our revenues. By monitoring and controlling our adjusted EBITDA margins, we can gauge the overall profitability of our company. |
| • | Restaurant-Level EBITDA Margin. Restaurant-level EBITDA margin represents net income before interest, taxes and depreciation and amortization plus the sum of certain non-operating expenses, including pre-opening costs, management fees and expenses, asset advisory agreement termination fees, public offering transaction bonuses, secondary public offering costs and general and administrative expenses, as a percentage of our revenues. By monitoring and controlling our restaurant-level EBITDA margins, we can gauge the overall profitability of our core restaurant operations. |
Our business is subject to seasonal fluctuations. Historically, the percentage of our annual revenues earned during the first and fourth fiscal quarters has been higher due, in part, to increased gift card redemptions and increased private dining during the year-end holiday season, respectively. In addition, we operate on a 52 or 53 week fiscal year ending the last Tuesday of each December, and our first, second and third quarters each contain 12 operating weeks with the fourth quarter containing 16 or 17 operating weeks. As many of our operating expenses have a fixed component, our operating income and operating income margin have historically varied significantly from quarter to quarter. Accordingly, results for any one quarter are not necessarily indicative of results to be expected for any other quarter or for any year.
Key Financial Definitions
Revenues. Revenues consist primarily of food and beverage sales at our restaurants, net of any discounts, such as management meals and employee meals, associated with each sale. Additionally, revenues are net of the cost of rewards associated with our loyalty program. In 2012, food comprised 66% of food and beverage sales with beverage comprising the remaining 34%. Revenues are directly influenced by the number of operating weeks in the relevant period and comparable restaurant sales growth. Comparable restaurant sales growth reflects the change in year-over-year sales for the comparable restaurant base. Comparable restaurant sales growth is primarily influenced by the number of customers eating in our restaurants, which is influenced by the popularity of our menu items, competition with other restaurants in each market, our customer mix and our ability to deliver a high quality dining experience, and the average check, which is driven by menu mix and pricing.
45
Table of Contents
Cost of Sales. Cost of sales is comprised primarily of food and beverage expenses. We measure food and beverage expenses by tracking cost of sales as a percentage of revenues. Food and beverage expenses are generally influenced by the cost of food and beverage items, distribution costs and menu mix. The components of cost of sales are variable in nature, increase with revenues, are subject to increases or decreases based on fluctuations in commodity costs, including beef prices, and depend in part on the controls we have in place to manage costs of sales at our restaurants.
Restaurant Operating Expenses. We measure restaurant operating expenses as a percentage of revenue. Restaurant operating expenses include the following:
| • | Labor expenses, which comprise restaurant management salaries, hourly staff payroll and other payroll-related expenses, including management bonus expenses, vacation pay, payroll taxes, fringe benefits and health insurance expenses and are measured by tracking hourly and total labor as a percentage of revenues; |
| • | Occupancy expenses, which comprise all occupancy costs, consisting of both fixed and variable portions of rent, common area maintenance charges, real estate property taxes and other related occupancy costs and are measured by tracking occupancy as a percentage of revenues; and |
| • | Other operating expenses, which comprise repairs and maintenance, utilities, operating supplies and other restaurant-level related operating expenses and are measured by tracking other operating expenses as a percentage of revenues. |
Marketing and Advertising Costs. Marketing and advertising costs include all media, production and related costs for both local restaurant advertising and national marketing. We measure the efficiency of our marketing and advertising expenditures by tracking these costs as a percentage of total revenues. We have historically spent approximately 1.5% to 2.5% of total revenues on marketing and advertising and expect to maintain this level in the near term.
Pre-opening Costs. Pre-opening costs are costs incurred prior to opening a restaurant, and primarily consist of manager salaries, relocation costs, recruiting expenses, employee payroll and related training costs for new employees, including rehearsal of service activities, as well as non-cash lease costs incurred prior to opening. In addition, pre-opening expenses include marketing costs incurred prior to opening as well as meal expenses for entertaining local dignitaries, families and friends. We currently target pre-opening costs per restaurant at $0.8 million for a Del Frisco’s and a Grille and $0.6 million for a Sullivan’s.
General and Administrative Expenses. General and administrative expenses are comprised of costs related to certain corporate and administrative functions that support development and restaurant operations and provide an infrastructure to support future company growth. These expenses reflect management, supervisory and staff salaries and employee benefits, travel, information systems, training, corporate rent, professional and consulting fees, technology and market research. We measure general and administrative costs by tracking general and administrative expenses as a percentage of revenues. These expenses are expected to increase as a result of costs associated with being a public company as well as costs related to our anticipated growth, including substantial training costs and significant investments in infrastructure. As we are able to leverage these investments made in our people and systems, we expect these expenses to decrease as a percentage of total revenues over time.
Management and Accounting Fees Paid to Related Party. In December 2006, Lone Star Fund acquired Lone Star Steakhouse & Saloon, Inc., which owned the Del Frisco’s and Sullivan’s concepts. We refer to this transaction in this prospectus as the Acquisition. Following
46
Table of Contents
the Acquisition, our principal stockholder restructured the company to separate certain other Lone Star Steakhouse & Saloon concepts by, among other things, spinning off the subsidiaries that owned and operated those concepts. The entities which were spun-off, which along with their affiliate companies we refer to as the Casual Dining Companies, are wholly-owned by Lone Star Fund and are therefore considered related parties of us. We do not have any ownership interest in them and they do not have any ownership interest in us.
From December 13, 2006 to December 28, 2010, we were provided with certain accounting, administrative and management services by one of the Casual Dining Companies, which we refer to as the Shared Services Provider, under a shared services agreement, or the Shared Services Agreement. The Shared Services Provider provided similar services to each of the other Casual Dining Companies. We paid the Shared Services Provider $1.3 million and $0.3 million in 2010 and 2011, respectively, for these services. Effective January 1, 2011, we ended this relationship and InfoSync Services, LLC, a business process outsourcing provider focused exclusively on the restaurant industry, began providing similar services under a three-year agreement. We incurred expenses from InfoSync of $0.6 million, $0.7 million and $0.4 million for services provided during 2011, 2012 and the 24 weeks ended June 11, 2013, respectively, which is included in general and administrative expenses.
Additionally, from December 13, 2006 to August 1, 2012, we incurred an asset management fee from an affiliate of Lone Star Fund. This fee was billed monthly based upon the actual direct costs incurred by this affiliate in providing support to us. In 2010, 2011 and 2012, we paid this affiliate of Lone Star Fund approximately $2.1 million, $3.1 million and $1.3 million, respectively, for these services. Concurrent with our initial public offering, this arrangement was terminated in exchange for a lump sum payment to Lone Star Fund of $3.0 million. As a result, we entered into a transition services agreement with affiliates of Lone Star Fund pursuant to which we are provided certain insurance management, legal and benefits administration services. In 2012 and the 24 weeks ended June 11, 2013, we paid an aggregate of approximately $0.1 million and $25,000, respectively, to an affiliate of Lone Star Fund under the transition services agreement. We expect to terminate this transition services agreement upon completion of this offering. See “Certain Relationships and Related Party Transactions—Relationships with Lone Star Fund and its Affiliates—Termination of Asset Advisory Agreement.” Lone Star Fund will beneficially own 34.0% of our outstanding common stock immediately after this offering (or 30.9% if the underwriters fully exercise their option to purchase additional shares). Therefore, Lone Star Fund will continue to exert significant influence over the Company.
We measure management and accounting fees paid as a percentage of revenue.
Depreciation and Amortization. Depreciation and amortization includes depreciation of fixed assets and certain definite life intangible assets. We depreciate capitalized leasehold improvements over the shorter of the total expected lease term or their estimated useful life. As we accelerate our restaurant openings, depreciation and amortization is expected to increase as a result of our increased capital expenditures.
Discontinued Operations. On June 30, 2012, we closed our Dallas Sullivan’s location and on July 2, 2012, we completed the sale of the real property to a third party. We determined that this closure met the criteria for classification as discontinued operations. See note 16 in the notes to our consolidated financial statements.
47
Table of Contents
Results of Operations
The following table sets forth certain statements of income data for the periods indicated:
| Fiscal Year Ended | 24 Weeks Ended | |||||||||||||||||||||||||||||||||||||||
| December 28, 2010 |
December 27, 2011 |
December 25, 2012 |
June 12, 2012 |
June 12, 2013 |
||||||||||||||||||||||||||||||||||||
| (dollars in thousands) | ||||||||||||||||||||||||||||||||||||||||
| Revenues |
$ | 162,855 | 100.0 | % | $ | 198,625 | 100.0 | % | $ | 232,435 | 100.0 | % | $ | 103,678 | 100.0 | % | $ | 120,162 | 100.0 | % | ||||||||||||||||||||
| Costs and expenses: |
||||||||||||||||||||||||||||||||||||||||
| Costs of sales |
49,481 | 30.4 | % | 60,743 | 30.6 | % | 71,093 | 30.6 | % | 31,963 | 30.8 | % | 36,533 | 30.4 | % | |||||||||||||||||||||||||
| Restaurant operating expenses |
71,917 | 44.2 | % | 86,311 | 43.5 | % | 100,143 | 43.1 | % | 43,778 | 42.2 | % | 53,454 | 44.5 | % | |||||||||||||||||||||||||
| Marketing and advertising costs |
2,744 | 1.7 | % | 4,246 | 2.1 | % | 4,682 | 2.0 | % | 2,006 | 2.0 | % | 2,256 | 1.9 | % | |||||||||||||||||||||||||
| Pre-opening costs |
798 | 0.5 | % | 3,018 | 1.5 | % | 4,058 | 1.7 | % | 902 | 0.9 | % | 919 | 0.8 | % | |||||||||||||||||||||||||
| General and administrative costs |
7,512 | 4.6 | % | 10,640 | 5.4 | % | 13,449 | 5.8 | % | 5,400 | 5.2 | % | 7,938 | 6.6 | % | |||||||||||||||||||||||||
| Management and accounting fees paid to related party |
3,345 | 2.0 | % | 3,399 | 1.7 | % | 1,252 | 0.5 | % | 1,196 | 1.2 | % | — | — | ||||||||||||||||||||||||||
| Asset advisory agreement termination fee |
— | — | — | — | 3,000 | 1.3 | % | — | — | — | — | |||||||||||||||||||||||||||||
| Secondary public offering costs |
— | — | — | — | — | — | — | — | 412 | 0.3 | % | |||||||||||||||||||||||||||||
| Public offering transaction bonuses |
— | — | — | — | 1,462 | 0.6 | % | — | — | 1,805 | 1.5 | % | ||||||||||||||||||||||||||||
| Depreciation and amortization |
6,459 | 4.0 | % | 6,998 | 3.5 | % | 8,675 | 3.7 | % | 3,570 | 3.4 | % | 5,006 | 4.1 | % | |||||||||||||||||||||||||
|
|
|
|
|
|
|
|
|
|
|
|||||||||||||||||||||||||||||||
| Operating income |
20,599 | 12.6 | % | 23,270 | 11.7 | % | 24,621 | 10.7 | % | 14,863 | 14.3 | % | 11,839 | 9.9 | % | |||||||||||||||||||||||||
| Other income (expense), net: |
||||||||||||||||||||||||||||||||||||||||
| Interest expense-affiliates |
(1,775 | ) | (1.1 | %) | — | — | — | — | — | — | — | — | ||||||||||||||||||||||||||||
| Interest expense-other |
(9,906 | ) | (6.0 | %) | (6,355 | ) | (3.2 | %) | (2,920 | ) | (1.3 | %) | (2,228 | ) | (2.2 | %) | (48 | ) | (0.1 | %) | ||||||||||||||||||||
| Write-off of debt issuance costs |
— | — | (2,501 | ) | (1.2 | %) | (1,649 | ) | (0.7 | %) | — | — | — | — | ||||||||||||||||||||||||||
| Other, net |
(249 | ) | (0.2 | %) | (114 | ) | (0.1 | %) | 113 | — | 65 | 0.1 | % | — | — | |||||||||||||||||||||||||
|
|
|
|
|
|
|
|
|
|
|
|||||||||||||||||||||||||||||||
| Income from continuing operations before income taxes |
8,669 | 5.3 | % | 14,300 | 7.2 | % | 20,165 | 8.7 | % | 12,700 | 12.2 | % | 11,791 | 9.8 | % | |||||||||||||||||||||||||
| Income tax expense (benefit) |
(88 | ) | (0.1 | %) | 4,653 | 2.3 | % | 5,592 | 2.4 | % | 4,172 | 4.0 | % | 3,791 | 3.1 | % | ||||||||||||||||||||||||
|
|
|
|
|
|
|
|
|
|
|
|||||||||||||||||||||||||||||||
| Income from continuing operations |
$ | 8,757 | 5.4 | % | $ | 9,647 | 4.9 | % | $ | 14,573 | 6.3 | % | $ | 8,528 | 8.2 | % | $ | 8,000 | 6.7 | % | ||||||||||||||||||||
|
|
|
|
|
|
|
|
|
|
|
|||||||||||||||||||||||||||||||
48
Table of Contents
Twenty-Four Weeks Ended June 11, 2013 Compared to Twenty-Four Weeks Ended June 12, 2012
The following tables show our operating results by operating segment, as well as our operating results as a percentage of revenues, for the 24 weeks ended June 11, 2013 and June 12, 2012.
| 24 Weeks Ended June 11, 2013 | ||||||||||||||||||||||||||||||||
| Del Frisco’s | Sullivan’s | Grille | Consolidated | |||||||||||||||||||||||||||||
| (dollars in thousands) | ||||||||||||||||||||||||||||||||
| Revenues |
$ | 64,900 | 100.0 | % | $ | 38,084 | 100.0 | % | $ | 17,178 | 100.0 | % | $ | 120,162 | 100.0 | % | ||||||||||||||||
| Costs and expenses: |
||||||||||||||||||||||||||||||||
| Cost of sales |
19,938 | 30.7 | % | 11,783 | 30.9 | % | 4,812 | 28.0 | % | 36,533 | 30.4 | % | ||||||||||||||||||||
| Restaurant operating expenses |
25,649 | 39.5 | % | 19,126 | 50.2 | % | 8,679 | 50.5 | % | 53,454 | 44.5 | % | ||||||||||||||||||||
| Marketing and advertising costs |
979 | 1.5 | % | 962 | 2.6 | % | 315 | 1.9 | % | 2,256 | 1.9 | % | ||||||||||||||||||||
|
|
|
|
|
|
|
|
|
|
|
|
|
|
|
|
|
|||||||||||||||||
| Restaurant-level EBITDA |
18,334 | 28.3 | % | 6,213 | 16.3 | % | 3,372 | 19.6 | % | 27,919 | 23.2 | % | ||||||||||||||||||||
|
|
|
|
|
|
|
|
|
|
|
|
|
|
|
|
|
|||||||||||||||||
| Pre-opening costs |
919 | 0.8 | % | |||||||||||||||||||||||||||||
| General and administrative |
7,938 | 6.6 | % | |||||||||||||||||||||||||||||
| Secondary public offering costs |
412 | 0.3 | % | |||||||||||||||||||||||||||||
| Initial public offering transaction bonuses |
1,805 | 1.5 | % | |||||||||||||||||||||||||||||
| Depreciation and amortization |
5,006 | 4.1 | % | |||||||||||||||||||||||||||||
|
|
|
|
|
|||||||||||||||||||||||||||||
| Operating Income |
$ | 11,839 | 9.9 | % | ||||||||||||||||||||||||||||
|
|
|
|
|
|||||||||||||||||||||||||||||
| Restaurant operating weeks |
240 | 456 | 133 | 829 | ||||||||||||||||||||||||||||
| Average unit volume |
$ | 6,490 | $ | 2,004 | $ | 3,100 | $ | 3,479 | ||||||||||||||||||||||||
| 24 Weeks Ended June 12, 2012 | ||||||||||||||||||||||||||||||||
| Del Frisco’s | Sullivan’s | Grille | Consolidated | |||||||||||||||||||||||||||||
| (dollars in thousands) | ||||||||||||||||||||||||||||||||
| Revenues |
$ | 56,100 | 100.0 | % | $ | 39,294 | 100.0 | % | $ | 8,284 | 100.0 | % | $ | 103,678 | 100.0 | % | ||||||||||||||||
| Costs and expenses: |
||||||||||||||||||||||||||||||||
| Cost of sales |
17,749 | 31.6 | % | 11,981 | 30.5 | % | 2,233 | 27.0 | % | 31,963 | 30.8 | % | ||||||||||||||||||||
| Restaurant operating expenses |
21,365 | 38.1 | % | 18,502 | 47.1 | % | 3,911 | 47.2 | % | 43,778 | 42.2 | % | ||||||||||||||||||||
| Marketing and advertising costs |
896 | 1.6 | % | 1,008 | 2.5 | % | 102 | 1.2 | % | 2,006 | 2.0 | % | ||||||||||||||||||||
|
|
|
|
|
|
|
|
|
|
|
|
|
|
|
|
|
|||||||||||||||||
| Restaurant-level EBITDA |
16,090 | 28.7 | % | 7,803 | 19.9 | % | 2,038 | 24.6 | % | 25,931 | 25.0 | % | ||||||||||||||||||||
|
|
|
|
|
|
|
|
|
|
|
|
|
|
|
|
|
|||||||||||||||||
| Pre-opening costs |
902 | 0.9 | % | |||||||||||||||||||||||||||||
| General and administrative |
5,400 | 5.2 | % | |||||||||||||||||||||||||||||
| Management and accounting fees paid to related party |
1,196 | 1.2 | % | |||||||||||||||||||||||||||||
| Depreciation and amortization |
3,570 | 3.4 | % | |||||||||||||||||||||||||||||
|
|
|
|
|
|||||||||||||||||||||||||||||
| Operating Income |
$ | 14,863 | 14.3 | % | ||||||||||||||||||||||||||||
|
|
|
|
|
|||||||||||||||||||||||||||||
| Restaurant operating weeks |
216 | 456 | 49 | 721 | ||||||||||||||||||||||||||||
| Average unit volume |
$ | 6,233 | $ | 2,068 | $ | 4,057 | $ | 3,451 | ||||||||||||||||||||||||
49
Table of Contents
Revenues. Consolidated revenues increased $16.5 million, or 15.9%, to $120.2 million in the first two quarters of fiscal 2013 from $103.7 million in the first two quarters of fiscal 2012. This increase was due to an additional 108 operating weeks provided by the opening of five restaurants subsequent to the second quarter of 2012, which provided an additional $16.3 million in revenues, as well as a 1.0% increase in total comparable restaurant sales comprised of a 1.2% increase in customer counts, partially offset by a 0.2% decrease in average check.
Del Frisco’s revenues increased $8.8 million, or 15.7%, to $64.9 million in the first two quarters of fiscal 2013 from $56.1 million in the first two quarters of fiscal 2012. This increase was primarily due to an additional 24 operating weeks provided by the opening of one restaurant in December 2012, as well as a 3.9% increase in total comparable restaurant sales comprised of a 3.5% increase in customer counts and a 0.4% increase in average check.
Sullivan’s revenues decreased $1.2 million, or 3.1%, to $38.1 million in the first two quarters of fiscal 2013 from $39.3 million in the first two quarters of fiscal 2012. This decrease was due to a 3.4% decrease in total comparable restaurant sales comprised of a 2.7% decrease in average check and a 0.7% decrease in customer counts.
Grille revenues increased $8.9 million, or 107.4%, to $17.2 million in the first two quarters of fiscal 2013 from $8.3 million in the first two quarters of fiscal 2012. This increase was primarily due to an additional 84 operating weeks provided by the opening of four restaurants subsequent to the second quarter of 2012.
Cost of Sales. Consolidated cost of sales increased $4.5 million, or 14.3%, to $36.5 million in the first two quarters of fiscal 2013 from $32.0 million in the first two quarters of fiscal 2012. This increase was primarily due to an additional 108 operating weeks in the first two quarters of fiscal 2013 as compared to the first two quarters of fiscal 2012 from the five restaurants opened subsequent to the second quarter of 2012. As a percentage of consolidated revenues, consolidated cost of sales decreased to 30.4% during the first two quarters of fiscal 2013 from 30.8% in the first two quarters of fiscal 2012.
As a percentage of revenues, Del Frisco’s cost of sales decreased to 30.7% during the first two quarters of fiscal 2013 from 31.6% in the first two quarters of fiscal 2012. This decrease in cost of sales, as a percentage of revenues, was primarily due to lower protein costs, primarily for our prime beef and seafood, accounting for approximately 95% of the decrease, which was partially offset by unfavorable non-protein food and alcoholic beverage costs.
As a percentage of revenues, Sullivan’s cost of sales increased to 30.9% during the first two quarters of fiscal 2013 from 30.5% in the first two quarters of fiscal 2012. This increase in cost of sales, as a percentage of revenues, was primarily due to higher non-protein food costs, accounting for approximately 55% of the increase, and beef costs, accounting for approximately 35% of the increase, which were partially offset by favorable seafood and alcoholic beverage costs. These costs were also impacted by a shift in sales mix to menu items with higher costs.
As a percentage of revenues, Grille cost of sales increased to 28.0% during the first two quarters of fiscal 2013 from 27.0% in the first two quarters of fiscal 2012. This increase in cost of sales, as a percentage of revenues, was primarily due to a shift in sales mix to menu items with higher costs as well as expected new opening-inefficiencies at our new restaurant locations.
Restaurant Operating Expenses. Consolidated restaurant operating expenses increased $9.7 million, or 22.1%, to $53.5 million in the first two quarters of fiscal 2013 from $43.8 million in the first two quarters of fiscal 2012. This increase was primarily due to an additional 108
50
Table of Contents
operating weeks in the first two quarters of fiscal 2013 as compared to the first two quarters of fiscal 2012 from the five restaurants opened subsequent to the second quarter of 2012. As a percentage of consolidated revenues, consolidated restaurant operating expenses increased to 44.5% in the first two quarters of fiscal 2013 from 42.2% in the first two quarters of fiscal 2012.
As a percentage of revenues, Del Frisco’s restaurant operating expenses increased to 39.5% during the first two quarters of fiscal 2013 from 38.1% in the first two quarters of fiscal 2012. This increase in restaurant operating expenses, as a percentage of revenues, was due to higher direct and indirect labor costs, accounting for approximately 60% of the increase, and higher other restaurant operating costs, accounting for approximately 25% of the increase. These increases were due primarily to the expected new-opening inefficiencies of our Del Frisco’s that opened in December 2012, as well as higher utilities and credit card fees.
As a percentage of revenues, Sullivan’s restaurant operating expenses increased to 50.2% during the first two quarters of fiscal 2013 from 47.1% in the first two quarters of fiscal 2012. This increase in restaurant operating expenses, as a percentage of revenues, was due to higher direct and indirect labor costs, accounting for approximately 45% of the increase, and higher other restaurant operating costs, accounting for approximately 45% of the increase. These increases were due in part to the deleveraging of certain fixed and semi-variable costs, such as utilities and building and equipment maintenance, on lower revenues.
As a percentage of revenues, Grille restaurant operating expenses increased to 50.5% during the first two quarters of fiscal 2013 from 47.2% in the first two quarters of fiscal 2012. This increase in restaurant operating expenses, as a percentage of revenues, was due to higher labor and restaurant operating costs due primarily to new opening inefficiencies.
Marketing and Advertising Costs. Consolidated marketing and advertising costs increased $0.3 million, or 12.5%, to $2.3 million in the first two quarters of fiscal 2013 from $2.0 million in the first two quarters of fiscal 2012. As a percentage of consolidated revenues, consolidated marketing and advertising costs slightly decreased to 1.9% during the first two quarters of fiscal 2013 from 2.0% in the first two quarters of 2012.
As a percentage of revenues, Del Frisco’s marketing and advertising costs decreased to 1.5% during the first two quarters of fiscal 2013 from 1.6% in the first two quarters of fiscal 2012. The decrease in marketing and advertising costs, as a percentage of revenues, was primarily due to lower in-restaurant advertising expenses, partially offset by higher print media and public relations spending. This decrease, as a percentage of revenues, was also impacted by our ability to leverage increased marketing and advertising costs against increased comparable sales.
As a percentage of revenues, Sullivan’s marketing and advertising costs increased to 2.6% during the first two quarters of fiscal 2013 from 2.5% in the first two quarters of fiscal 2012, which was the result of higher outside promotion costs partially offset by lower spending for in-restaurant advertising expenses.
As a percentage of revenues, Grille marketing and advertising costs increased to 1.9% during the first two quarters of fiscal 2013 from 1.2% in the first two quarters of fiscal 2012. The increase in marketing and advertising costs, as a percentage of revenues, was primarily due to higher public relations and print media spending, partially offset by lower print production expense.
Pre-opening Costs. Pre-opening costs remained consistent at $0.9 million in the first two quarters of fiscal 2013and 2012 due to similar pre-opening costs incurred during the first two quarters of fiscal 2013 related to the opening of one Grille restaurant during March 2013 and
51
Table of Contents
pre-opening expenses from one additional restaurant expected to open during the summer of 2013, compared to two Grille openings during the summer of fiscal 2012. Pre-opening costs include non-cash straight line rent, which is incurred during construction and can precede a restaurant opening by four to six months.
General and Administrative Costs. General and administrative costs increased $2.5 million, or 47.0%, to $7.9 million in the first two quarters of fiscal 2013 from $5.4 million in the first two quarters of fiscal 2012. This increase was primarily related to additional compensation costs related to growth in the number of corporate and regional management-level personnel to support recent and anticipated growth, as well as increased restaurant management training expenses. In addition, we incurred approximately $0.9 million in additional public company related expenses in the first two quarters of fiscal 2013 over the first two quarters of fiscal 2012, including $0.4 million in non-cash stock compensation expense. As a percentage of revenues, general and administrative costs increased to 6.6% in the first two quarters of fiscal 2013 from 5.2% in the first two quarters of fiscal 2012. General and administrative costs are expected to continue to increase as a result of costs associated with being a public company as well as costs related to our anticipated growth, including further investments in our infrastructure. As we are able to leverage these investments made in our people and systems, we expect these expenses to decrease as a percentage of total revenues over time.
Management and Accounting Fees Paid to Related Party. Management and accounting fees paid to related party were $1.2 million in the first two quarters of fiscal 2012 and consisted of asset management fees paid to an affiliate of Lone Star Fund under an asset advisory agreement. This agreement was terminated in the third quarter of fiscal 2012, and there were no such expenses in 2013.
Secondary Public Offering Costs. In conjunction with the secondary public offering in the first quarter of fiscal 2013, we incurred $0.4 million in legal, accounting, printing, and registration expenses related to the offering.
Public Offering Transaction Bonuses. Under letter agreements, as amended, with LSF5 Wagon Holdings, LLC, an affiliate of Lone Star Fund, or Wagon, certain of our executives were eligible to receive a transaction bonus upon the occurrence of an eligible transaction. Wagon is responsible to fund the transaction bonuses. As these bonuses were contingent upon employment with us, we are required to record the expense of these bonuses and recognize the funding by Wagon as additional paid in capital. Associated with the completion of the secondary public offering in the first quarter of fiscal 2013, we recorded $1.8 million in transaction bonuses expense under the transaction bonus agreements. See “Executive Compensation—Payments in Connection with Our Initial Public Offering and this Offering—Transaction Bonuses.”
Depreciation and Amortization. Depreciation and amortization increased $1.4 million, or 40.2%, to $5.0 million in the first two quarters of fiscal 2013 from $3.6 million in the first two quarters of fiscal 2012. The increase in depreciation and amortization expense primarily resulted from new assets placed in service during 2012 and 2013 upon the opening of the five new restaurants as well as for existing restaurants that were remodeled during 2012 and the first two quarters of fiscal 2013.
Interest Expense. Interest expense decreased $2.2 million to $48,000 in the first two quarters of fiscal 2013 from $2.2 million in the first two quarters of fiscal 2012. This decrease is attributable to the payoff of previously outstanding debt with the proceeds from the initial public offering and there being no outstanding borrowings during the first two quarters of 2013 under our revolving credit facility that we entered into in October 2012.
52
Table of Contents
Income Tax Expense. The effective income tax rate from continuing operations for the 24 weeks ended June 11, 2013 was 32.2%, compared to an effective income tax rate from continuing operations of 32.9% for the 24 weeks ended June 12, 2012. The factors that cause the effective tax rates to vary from the federal statutory rate of 35% include the impact of FICA tip and other credits, partially offset by state income taxes and certain non-deductible expenses. The decrease in the effective tax rate for the 24 weeks ended June 11, 2013 is primarily attributable to a decrease in our unrecognized tax benefits of approximately $0.3 million related to the release of exposure items due to the expiration of the statute of limitations, as well as the impact of certain discrete permanent differences between book and tax income, particularly higher non-taxable income on deferred compensation plan investments. These decreases were partially offset by the adjustment described below.
In the second quarter of fiscal 2013, we determined that a deferred tax asset and associated tax benefit of $0.5 million recorded in the fourth quarter of fiscal 2012 relating to local income tax net operating loss carryforwards was not realizable and should not have been recognized, as the related net operating losses originated in years from which the carryforward period had expired. We corrected the deferred tax asset account resulting in a non-cash $0.5 million cumulative adjustment to record additional income tax expense in the second quarter of fiscal 2013. The adjustment did not impact historical cash flows and will not impact the timing of future income tax payments. Prior years’ financial statements were not restated as the impact of these issues was immaterial to previously reported results for any individual prior year and 2012.
Fiscal Year Ended December 25, 2012 (52 weeks) Compared to Fiscal Year Ended December 27, 2011 (52 weeks)
The following tables show our operating results by operating segment, as well as our operating results as a percentage of revenues, for the fiscal years ended December 25, 2012 and December 27, 2011.
| Fiscal Year Ended December 25, 2012 | ||||||||||||||||||||||||||||||||
| Del Frisco’s | Sullivan’s | Grille | Consolidated | |||||||||||||||||||||||||||||
| (dollars in thousands) | ||||||||||||||||||||||||||||||||
| Revenues |
$ | 124,692 | 100.0 | % | $ | 83,767 | 100.0 | % | $ | 23,976 | 100.0 | % | $ | 232,435 | 100.0 | % | ||||||||||||||||
| Costs and expenses: |
||||||||||||||||||||||||||||||||
| Cost of sales |
38,914 | 31.2 | % | 25,519 | 30.5 | % | 6,660 | 27.8 | % | 71,093 | 30.6 | % | ||||||||||||||||||||
| Restaurant operating expenses |
47,783 | 38.3 | % | 40,240 | 48.0 | % | 12,120 | 50.6 | % | 100,143 | 43.1 | % | ||||||||||||||||||||
| Marketing and advertising costs |
2,002 | 1.6 | % | 2,287 | 2.7 | % | 393 | 1.6 | % | 4,682 | 2.0 | % | ||||||||||||||||||||
|
|
|
|
|
|
|
|
|
|
|
|
|
|
|
|
|
|||||||||||||||||
| Restaurant-level EBITDA |
35,993 | 28.9 | % | 15,721 | 18.8 | % | 4,803 | 20.0 | % | 56,517 | 24.3 | % | ||||||||||||||||||||
|
|
|
|
|
|
|
|
|
|
|
|
|
|
|
|
|
|||||||||||||||||
| Pre-opening costs |
4,058 | 1.7 | % | |||||||||||||||||||||||||||||
| General and administrative |
13,449 | 5.8 | % | |||||||||||||||||||||||||||||
| Management and accounting fees paid to related party |
1,252 | 0.5 | % | |||||||||||||||||||||||||||||
| Asset advisory agreement termination fee |
3,000 | 1.3 | % | |||||||||||||||||||||||||||||
| Public offering transaction bonuses |
1,462 | 0.6 | % | |||||||||||||||||||||||||||||
| Depreciation and amortization |
8,675 | 3.7 | % | |||||||||||||||||||||||||||||
|
|
|
|
|
|||||||||||||||||||||||||||||
| Operating income |
$ | 24,621 | 10.7 | % | ||||||||||||||||||||||||||||
|
|
|
|
|
|||||||||||||||||||||||||||||
53
Table of Contents
| Fiscal Year Ended December 27, 2011 | ||||||||||||||||||||||||||||||||
| Del Frisco’s | Sullivan’s | Grille | Consolidated | |||||||||||||||||||||||||||||
| (dollars in thousands) | ||||||||||||||||||||||||||||||||
| Revenues |
$ | 111,387 | 100.0 | % | $ | 82,777 | 100.0 | % | $ | 4,461 | 100.0 | % | $ | 198,625 | 100.0 | % | ||||||||||||||||
| Costs and expenses: |
||||||||||||||||||||||||||||||||
| Cost of sales |
34,316 | 30.8 | % | 25,200 | 30.4 | % | 1,227 | 27.5 | % | 60,743 | 30.6 | % | ||||||||||||||||||||
| Restaurant operating expenses |
43,864 | 39.4 | % | 39,758 | 48.0 | % | 2,689 | 60.3 | % | 86,311 | 43.5 | % | ||||||||||||||||||||
| Marketing and advertising costs |
1,930 | 1.7 | % | 2,208 | 2.7 | % | 108 | 2.4 | % | 4,246 | 2.1 | % | ||||||||||||||||||||
|
|
|
|
|
|
|
|
|
|
|
|
|
|
|
|
|
|||||||||||||||||
| Restaurant-level EBITDA |
31,277 | 28.1 | % | 15,611 | 18.9 | % | 437 | 9.8 | % | 47,325 | 23.8 | % | ||||||||||||||||||||
|
|
|
|
|
|
|
|
|
|
|
|
|
|
|
|
|
|||||||||||||||||
| Pre-opening costs |
3,018 | 1.5 | % | |||||||||||||||||||||||||||||
| General and administrative |
10,640 | 5.4 | % | |||||||||||||||||||||||||||||
| Management and accounting fees paid to related party |
3,399 | 1.7 | % | |||||||||||||||||||||||||||||
| Depreciation and amortization |
6,998 | 3.5 | % | |||||||||||||||||||||||||||||
|
|
|
|
|
|||||||||||||||||||||||||||||
| Operating income |
$ | 23,270 | 11.7 | % | ||||||||||||||||||||||||||||
|
|
|
|
|
|||||||||||||||||||||||||||||
Revenues. Consolidated revenues increased $33.8 million, or 17.0%, to $232.4 million in 2012 from $198.6 million in 2011. This increase was due in part to a 4.2% increase in total comparable restaurant sales comprised of a 0.2% increase in customer counts and a 4.0% increase in average check. An additional $26.6 million was provided by 164 additional operating weeks resulting from one Del Frisco’s opening in April 2011, two Grille openings in August and November 2011, three Grille openings in June, July and October 2012 and one Del Frisco’s opening in December 2012.
Del Frisco’s revenues increased $13.3 million, or 11.9%, to $124.7 million in 2012 from $111.4 million in 2011. This increase was primarily due to a 6.6% increase in total comparable restaurant sales comprised of a 2.4% increase in customer counts and a 4.2% increase in average check. The increase in average check was impacted by combined menu price increases of approximately 1.2% implemented in December 2011 and March 2012 as well as the menu mix shifting to higher priced items and special offerings. The remainder of the increase was provided by 20 additional operating weeks resulting from Del Frisco’s openings in April 2011 and December 2012.
Sullivan’s revenues increased $1.0 million, or 1.2%, to $83.8 million in 2012 from $82.8 million in 2011. This increase was primarily due to a 1.2% increase in total comparable restaurant sales comprised of a 2.5% increase in average check partially offset by a 1.3% decrease in customer counts. The increase in average check was impacted by menu price increases of approximately 2.0% implemented in April 2011 and 1.5% implemented in April 2012 as well as the menu mix shifting to higher priced items and special offerings.
The Grille’s revenue increased $19.5 million to $24.0 million in 2012 from $4.5 million in 2011. This increase was provided by 144 additional operating weeks resulting from two Grille openings in August and November 2011 and three Grille openings in June, July and October 2012.
54
Table of Contents
Cost of Sales. Consolidated cost of sales increased $10.4 million, or 17.1%, to $71.1 million in 2012 from $60.7 million in 2011. This increase was primarily due to an additional 164 operating weeks in 2012 as compared to 2011 from three restaurants opened in 2011 and four restaurants opened in 2012. As a percentage of consolidated revenues, consolidated cost of sales was consistent at 30.6% during 2012 and 2011.
As a percentage of revenues, Del Frisco’s cost of sales increased to 31.2% during 2012 from 30.8% in 2011. This increase in cost of sales, as a percentage of revenues, was primarily due to higher protein costs, primarily for our prime beef, accounting for approximately 80% of the increase, and wine, accounting for approximately 20% of the increase, which were partially offset by favorable seafood and non-protein food costs.
As a percentage of revenues, Sullivan’s cost of sales increased slightly to 30.5% during 2012 from 30.4% in 2011. This increase in cost of sales, as a percentage of revenues, was due to higher beef costs which were almost fully offset by lower non-protein food costs, accounting for approximately 46% of the offset, lower seafood costs, accounting for 26% of the offset, and wine and beverage costs, accounting for approximately 23% of the offset.
As a percentage of revenues, the Grille’s cost of sales increased to 27.8% during 2012 from 27.5% in 2011. The increase in cost of sales, as a percentage of revenues, was due primarily to new opening inefficiencies at three Grille openings in June, July and October 2012.
Restaurant Operating Expenses. Consolidated restaurant operating expenses increased $13.8 million, or 16.0%, to $100.1 million in 2012 from $86.3 million in 2011. This increase was primarily due to an additional 164 operating weeks in 2012 as compared to 2011 from three restaurants opened in 2011 and four restaurants opened in 2012. As a percentage of consolidated revenues, consolidated restaurant operating expenses decreased to 43.1% in 2012 from 43.5% in 2011.
As a percentage of revenues, Del Frisco’s restaurant operating expenses decreased to 38.3% during 2012 from 39.4% in 2011. This decrease in restaurant operating expenses, as a percentage of revenues, was due to lower labor costs, accounting for approximately 60% of the decrease, and the leveraging of increased comparable restaurant revenues on certain fixed operating costs, accounting for approximately 40% of the decrease. In addition, the second quarter of fiscal 2011 included certain expected operating expense inefficiencies from the new restaurant opening in April 2011.
As a percentage of revenues, Sullivan’s restaurant operating expenses were consistent at 48.0% during 2012 and 2011. Labor costs were higher in 2012 than 2011, which was fully offset by decreases in other restaurant operating expenses driven by the leveraging of increased comparable restaurant revenues on certain fixed operating costs.
As a percentage of revenues, the Grille’s restaurant operating expenses decreased to 50.6% during 2012 from 60.3% in 2011. This decrease in restaurant operating expenses, as a percentage of revenues, was due to significant new opening inefficiencies at the two Grille openings in August and November 2011, which were the first two locations of this new concept.
Marketing and Advertising Costs. Consolidated marketing and advertising costs increased $0.5 million, or 11.9%, to $4.7 million in 2012 from $4.2 million in 2011. As a percentage of consolidated revenues, consolidated marketing and advertising costs decreased slightly to 2.0% in 2012 from 2.1% in fiscal 2011.
55
Table of Contents
As a percentage of revenues, Del Frisco’s marketing and advertising costs decreased slightly to 1.6% in 2012 from 1.7% in 2011. In-restaurant advertising, outside promotions, and marketing research costs were higher in 2012 than 2011, which were fully offset by decreased costs for print and broadcast advertising and public relations fees.
As a percentage of revenues, Sullivan’s marketing and advertising costs were consistent at 2.7% during 2012 and 2011. Outside promotions and broadcast media advertising were higher in 2012 than 2011, which were fully offset by lower market research costs and print advertising costs.
As a percentage of revenues, the Grille’s marketing and advertising costs decreased to 1.6% in 2012 from 2.4% in 2011. This decrease in marketing and advertising costs, as a percentage of revenues, was due to the initial media development during the prior year for the two Grille openings in August and November 2011, which were the first two locations of this new concept.
Pre-opening Costs. Pre-opening costs increased by $1.1 million to $4.1 million in 2012 from $3.0 million in 2011 due to higher pre-opening costs incurred during 2012 related to the opening of one Del Frisco’s and three Del Frisco’s Grilles compared to one Del Frisco’s and two Del Frisco’s Grille openings during fiscal 2011.
General and Administrative Expenses. General and administrative expenses increased $2.8 million, or 26.4%, to $13.4 million in 2012 from $10.6 million in 2011. Of this increase, $1.5 million was due to compensation costs related to growth in the number of corporate and regional management-level personnel to support recent and anticipated growth and $0.4 million was due to higher professional fees. In addition, we incurred approximately $0.8 million in public company related expenses, including $0.3 million in non-cash stock compensation expense. This increase was partially offset by $0.3 million in one-time employee severance costs incurred in the second quarter of fiscal 2011. As a percentage of revenues, general and administrative expenses increased to 5.8% in 2012 from 5.4% in 2011.
Management and Accounting Fees Paid to Related Party. Management and accounting fees paid to related party decreased $2.1 million, or 61.8%, to $1.3 million in 2012 from $3.4 million in 2011. The decrease was due to a $1.8 million decrease in asset management fees paid to an affiliate of Lone Star Fund, due in part to the termination of the asset advisory agreement in the third quarter of fiscal 2012, and a $0.3 million decrease in fees paid to an affiliate of Lone Star Fund who provided certain shared services to us and other unaffiliated companies owned by Lone Star Fund, to which a transition fee was paid in the first quarter of fiscal 2011.
Asset Advisory Agreement Termination Fee. In conjunction with our initial public offering, we terminated our asset advisory agreement with Lone Star Fund. Related to this termination, we incurred a one-time $3.0 million asset advisory agreement termination fee in the third quarter of fiscal 2012.
Public Offering Transaction Bonuses. Under a letter agreement, as amended, with LSF5 Wagon Holdings, LLC, or Wagon, our controlling stockholder and an affiliate of Lone Star Fund, certain of our executives were eligible to receive a transaction bonus upon the occurrence of an eligible transaction. Wagon was responsible to fund the transaction bonus. As this bonus was contingent upon employment with us, we are required to record the expense of these bonuses and recognized the funding by Wagon as additional paid in capital. Associated with the completion of our initial public offering, we recorded $1.5 million in transaction bonuses under these transaction bonus agreements.
56
Table of Contents
Depreciation and Amortization. Depreciation and amortization increased $1.7 million, or 24.3%, to $8.7 million in 2012 from $7.0 million in 2011. The increase in depreciation and amortization expense primarily resulted from new assets placed in service during 2011 and 2012 upon the opening of seven new restaurants as well as for existing restaurants that were remodeled during 2011 and 2012.
Interest Expense. Interest expense decreased $3.5 million to $2.9 million in 2012 from $6.4 million in 2011. This decrease was due primarily to a lower average credit facility balance and a lower average interest rate under the new credit facilities entered into in July 2011 and in October 2012 as compared to the immediately prior credit facility.
Write-off of Debt Issuance Costs. Write-off of debt issuance costs decreased $0.9 million, or 36.0%, to $1.6 million in 2012 from $2.5 million in 2011.
Provision for Income Taxes. The effective income tax rate was 27.7% and 32.5% in 2012 and 2011, respectively. The factors that cause the effective tax rates to vary from the federal statutory rate of 35% include the impact of FICA tip and other credits, state income taxes and certain non-deductible expenses. The decrease in the effective tax rate is primarily attributable to the impact of certain discrete transactions during fiscal 2012, including the asset advisory agreement termination fee and our public offering transaction bonus deductions, which reduced income before income taxes and increased the impacts of the FICA tip and other credits.
Fiscal Year Ended December 27, 2011 (52 weeks) Compared to Fiscal Year Ended December 28, 2010 (52 weeks)
The following tables show our operating results by operating segment, as well as our operating results as a percentage of revenues, for the fiscal years ended December 27, 2011 and December 28, 2010. During 2011 we opened the first two locations of our new Grille concept. This new concept was not material to our results during 2011, and as such, a detailed discussion is not included below.
| Fiscal Year Ended December 27, 2011 | ||||||||||||||||||||||||||||||||
| Del Frisco’s | Sullivan’s | Grille | Consolidated | |||||||||||||||||||||||||||||
| (dollars in thousands) | ||||||||||||||||||||||||||||||||
| Revenues |
$ | 111,387 | 100.0 | % | $ | 82,777 | 100.0 | % | $ | 4,461 | 100.0 | % | $ | 198,625 | 100.0 | % | ||||||||||||||||
| Costs and expenses: |
||||||||||||||||||||||||||||||||
| Cost of sales |
34,316 | 30.8 | % | 25,200 | 30.4 | % | 1,227 | 27.5 | % | 60,743 | 30.6 | % | ||||||||||||||||||||
| Restaurant operating expenses |
43,864 | 39.4 | % | 39,758 | 48.0 | % | 2,689 | 60.3 | % | 86,311 | 43.5 | % | ||||||||||||||||||||
| Marketing and advertising costs |
1,930 | 1.7 | % | 2,208 | 2.7 | % | 108 | 2.4 | % | 4,246 | 2.1 | % | ||||||||||||||||||||
|
|
|
|
|
|
|
|
|
|
|
|
|
|
|
|
|
|||||||||||||||||
| Restaurant-level EBITDA |
31,277 | 28.1 | % | 15,611 | 18.9 | % | 437 | 9.8 | % | 47,325 | 23.8 | % | ||||||||||||||||||||
|
|
|
|
|
|
|
|
|
|
|
|
|
|
|
|
|
|||||||||||||||||
| Pre-opening costs |
3,018 | 1.5 | % | |||||||||||||||||||||||||||||
| General and administrative |
10,640 | 5.4 | % | |||||||||||||||||||||||||||||
| Management and accounting fees paid to related party |
3,399 | 1.7 | % | |||||||||||||||||||||||||||||
| Depreciation and amortization |
6,998 | 3.5 | % | |||||||||||||||||||||||||||||
|
|
|
|
|
|||||||||||||||||||||||||||||
| Operating income |
$ | 23,270 | 11.7 | % | ||||||||||||||||||||||||||||
|
|
|
|
|
|||||||||||||||||||||||||||||
57
Table of Contents
| Fiscal Year Ended December 28, 2010 | ||||||||||||||||||||||||
| Del Frisco’s | Sullivan’s | Consolidated | ||||||||||||||||||||||
| (dollars in thousands) | ||||||||||||||||||||||||
| Revenues |
$ | 88,292 | 100.0 | % | $ | 74,563 | 100.0 | % | $ | 162,855 | 100.0 | % | ||||||||||||
| Costs and expenses: |
||||||||||||||||||||||||
| Cost of sales |
26,495 | 30.0 | % | 22,986 | 30.8 | % | 49,481 | 30.4 | % | |||||||||||||||
| Restaurant operating expenses |
35,181 | 39.8 | % | 36,736 | 49.3 | % | 71,917 | 44.1 | % | |||||||||||||||
| Marketing and advertising costs |
1,298 | 1.5 | % | 1,446 | 1.9 | % | 2,744 | 1.7 | % | |||||||||||||||
|
|
|
|
|
|
|
|
|
|
|
|
|
|||||||||||||
| Restaurant-level EBITDA |
25,318 | 28.7 | % | 13,395 | 18.0 | % | 38,713 | 23.8 | % | |||||||||||||||
|
|
|
|
|
|
|
|
|
|
|
|
|
|||||||||||||
| Pre-opening costs |
798 | 0.5 | % | |||||||||||||||||||||
| General and administrative |
7,512 | 4.6 | % | |||||||||||||||||||||
| Management and accounting fees paid to related party |
3,345 | 2.1 | % | |||||||||||||||||||||
| Depreciation and amortization |
6,459 | 4.0 | % | |||||||||||||||||||||
|
|
|
|
|
|||||||||||||||||||||
| Operating income |
$ | 20,599 | 12.6 | % | ||||||||||||||||||||
|
|
|
|
|
|||||||||||||||||||||
Revenues. Consolidated revenues increased $35.7 million, or 21.9%, to $198.6 million in 2011 from $162.9 million in 2010. This increase was due primarily to an 11.2% increase in total comparable restaurant sales comprised of a 5.1% increase in customer counts and a 6.1% increase in average check. The increase in average check was impacted by combined menu price increases of approximately 2% implemented in April and December 2011, with the remainder the result of the menu mix shifting to higher priced items and special offerings. An additional $17.5 million was provided by 84 additional operating weeks resulting from one Del Frisco’s and two Grille openings during 2011 and the full-year impact of one Sullivan’s that opened in the second quarter of 2010.
Del Frisco’s revenues increased $23.1 million, or 26.2%, to $111.4 million in 2011 from $88.3 million in 2010. This increase was primarily due to a 13.3% increase in comparable restaurant sales comprised of a 7.6% increase in customer counts and a 5.7% increase in average check. The increase in average check was impacted by menu price increases of approximately 1.2% implemented in April 2011 and 1.2% implemented in December 2011. The remainder of the increase was provided by 36 additional operating weeks resulting from one Del Frisco’s opening in April 2011.
Sullivan’s revenues increased $8.2 million, or 11.0%, to $82.8 million in 2011 from $74.6 million in the 2010. This increase was due to an 8.7% increase in comparable restaurant sales comprised of a 3.3% increase in customer counts and a 5.4% increase in average check. The increase in average check was impacted by menu price increases of approximately 2% implemented in April and December 2011. The remainder of the increase was provided by 24 additional operating weeks resulting from one Sullivan’s opening in June 2010.
Cost of Sales. Consolidated cost of sales increased $11.2 million, or 22.6%, to $60.7 million in 2011 from $49.5 million in 2010. The increase in consolidated costs of sales was primarily related to the growth in comparable restaurant sales and to additional restaurants opened during 2010 and 2011. As a percentage of consolidated revenues, consolidated cost of sales increased to 30.6% during 2011 from 30.4% in 2010.
As a percentage of revenues, Del Frisco’s cost of sales increased to 30.8% during 2011 from 30.0% in 2010. This increase in cost of sales, as a percentage of revenues, was due to higher protein costs, primarily for our prime beef, accounting for approximately 45% of the increase,
58
Table of Contents
and seafood, accounting for approximately 40% of the increase, which were partially offset by favorable wine, beverage, and non-protein food costs.
As a percentage of revenues, Sullivan’s cost of sales decreased to 30.4% during 2011 from 30.8% in 2010. This decrease in cost of sales, as a percentage of revenues, was due to lower wine and beverage costs, accounting for approximately 65% of the decrease, and non-protein food costs, accounting for approximately 20% of the decrease, which were partially offset by unfavorable beef and seafood costs.
Restaurant Operating Expenses. Consolidated restaurant operating expenses increased $14.4 million, or 20.0%, to $86.3 million in 2011 from $71.9 million in 2010. This increase was primarily due to an additional 84 operating weeks in 2011 as compared to 2010 from one restaurant opened in 2010 and three restaurants opened in 2011. As a percentage of consolidated revenues, consolidated restaurant operating expenses decreased to 43.5% in 2011 from 44.1% in 2010.
As a percentage of revenues, Del Frisco’s restaurant operating expenses decreased to 39.4% during 2011 from 39.8% in 2010. This decrease in restaurant operating expenses, as a percentage of revenues, was due to the leveraging of increased comparable restaurant revenues on certain fixed operating costs, partially offset by higher occupancy costs due to the sale-leaseback of two restaurants during 2011.
As a percentage of revenues, Sullivan’s restaurant operating expenses decreased to 48.0% during 2011 from 49.3% in 2010. This decrease in restaurant operating expenses, as a percentage of revenues, was primarily due to the leveraging of increased comparable restaurant revenues on certain fixed operating costs, accounting for approximately 55% of the decrease, as well as lower labor costs, accounting for approximately 45% of the decrease.
Marketing and Advertising Costs. Consolidated marketing and advertising costs increased $1.5 million, or 55.6%, to $4.2 million in 2011 from $2.7 million in 2010. As a percentage of consolidated revenues, consolidated marketing and advertising costs increased to 2.1% in 2011 from 1.7% in 2010.
As a percentage of revenues, Del Frisco’s marketing and advertising costs increased to 1.7% during 2011 from 1.5% in 2010. The increase in marketing and advertising costs, as a percentage of revenues, was primarily due to higher in-restaurant advertising expenses, accounting for approximately 65% of the increase, and higher print and broadcast media advertising, accounting for approximately 20% of the increase.
As a percentage of revenues, Sullivan’s marketing and advertising costs increased to 2.7% during 2011 from 1.9% in 2010. The increase in marketing and advertising costs, as a percentage of revenues, was primarily due to higher public relations and marketing research expenses, accounting for approximately 50% of the increase, higher in-restaurant advertising expenses, accounting for approximately 35% of the increase, and higher print advertising, accounting for approximately 15% of the increase.
Pre-opening Costs. Consolidated pre-opening costs increased by $2.2 million to $3.0 million in 2011 from $0.8 million in 2010. This change related to the opening of one Del Frisco’s restaurant and two Grille restaurants during 2011 versus the opening of one Sullivan’s during 2010.
General and Administrative Expenses. General and administrative expenses increased by $3.1 million, or 41.3%, to $10.6 million in 2011 from $7.5 million in 2010. Approximately 20%, or
59
Table of Contents
$0.6 million, of this increase relates to accounting services provided by a third-party service provider. These services, along with certain administrative and management services were performed by the Shared Services Provider in 2010 and reflected in management fees to the related party, as described above under “—Key Financial Definitions—Management and Accounting Fees Paid to Related Party.” Additionally, 35%, or $1.1 million, of this increase relates to compensation costs related to growth in the number of corporate and regional management-level personnel to support recent and anticipated growth, 25%, or $0.8 million, of this increase relates to other corporate infrastructure costs to support growth, and 20%, or $0.6 million, of this increase relates to higher costs associated with training restaurant management. As a percentage of revenues, general and administrative expenses increased to 5.4% in 2011 from 4.6% in 2010.
Management and Accounting Fees Paid to Related Party. Management and accounting fees paid to related party increased by $0.1 million, or 3.0%, to $3.4 million in 2011 from $3.3 million in 2010. The increase was due to increased asset management fees paid to an affiliate of Lone Star Fund, partially offset by the elimination in 2011 of fees paid to the Shared Services Provider for certain accounting, administrative, and management services in 2010. On December 29, 2010, these accounting, administrative, and management services were transferred to a third-party outsourcing firm or performed by Company personnel, and therefore these costs are reflected in general and administrative expenses in 2011. See “Certain Relationships and Related Party Transactions—Relationships with Lone Star Fund and its Affiliates—Termination of Asset Advisory Agreement” and “—Key Financial Definitions—Management and Accounting Fees Paid to Related Party.”
Depreciation and Amortization. Depreciation and amortization increased $0.5 million, or 7.7%, to $7.0 million in 2011 from $6.5 million in 2010. The increase in depreciation and amortization expense primarily resulted from new assets placed in service during 2011 upon the opening of the three new restaurants, partially offset by a decrease in depreciable assets related to the sale-leaseback of two restaurants in the first quarter of 2011.
Interest Expense. Interest expense-affiliates was zero in 2011 compared to $1.8 million in 2010 due to the payoff of the advances due to affiliates in November 2010. See “Certain Relationships and Related Party Transactions—Relationships with the Casual Dining Companies—Note Payable to Casual Dining Company.” Interest expense-other decreased $3.5 million to $6.4 million in 2011 from $9.9 million in 2010. This decrease was due to a lower average credit facility balance and a lower average interest rate.
Write-off of Debt Issuance Costs. Write-off of debt issuance costs increased due to the write-off of approximately $2.5 million of deferred loan costs relating to the prior credit facility, which was terminated in July 2011 as discussed below under “—Liquidity and Capital Resources—Credit Facility.”
Provision for Income Taxes. The effective income tax rate was 32.5% and -1.0% in 2011 and 2010, respectively. The factors that cause the effective tax rates to vary from the federal statutory rate of 35% include the impact of FICA tip and other credits, partially offset by state income taxes and certain non-deductible expenses. The change in the effective tax rate from 2010 to 2011 primarily relates to a 2010 tax benefit for the reversal of previously unrecognized tax benefits of approximately $3.7 million resulting primarily from the expiration of the statute of limitations in 2010 relating to various uncertain tax positions, partially offset by an additional provision of $1.5 million resulting from income tax accruals provided for various uncertain state tax positions.
60
Table of Contents
Liquidity and Capital Resources
Our principal liquidity requirements are our lease obligations and our working capital and capital expenditure needs and any principal and interest obligations on our debt. Subject to our operating performance, which, if significantly adversely affected, would adversely affect the availability of funds, we expect to finance our operations for at least the next several years, including costs of opening currently planned new restaurants, through cash provided by operations and existing borrowings available under our credit facility discussed below. We cannot be sure that these sources will be sufficient to finance our operations, however, and we may seek additional financing in the future. As of June 11, 2013, we had cash and cash equivalents of approximately $14.4 million.
Our operations have not required significant working capital and, like many restaurant companies, we may at times have negative working capital. Revenues are received primarily in cash or by credit card, and restaurant operations do not require significant receivables or inventories, other than our wine inventory. In addition, we receive trade credit for the purchase of food, beverages and supplies, thereby reducing the need for incremental working capital to support growth.
Cash Flows
The following table summarizes the statement of cash flows for the 24 weeks ended June 12, 2012 and June 11, 2013:
| 24 Weeks Ended | ||||||||
| June 12, 2012 |
June 11, 2013 |
|||||||
| (in thousands) | ||||||||
| Net cash provided by (used in): |
||||||||
| Operating activities |
$ | 12,691 | $ | 12,151 | ||||
| Investing activities |
(12,545 | ) | (10,250 | ) | ||||
| Financing activities |
(8,500 | ) | 1,779 | |||||
|
|
|
|
|
|||||
| Net increase (decrease) in cash and cash equivalents |
$ | (8,354 | ) | $ | 3,680 | |||
|
|
|
|
|
|||||
Operating Activities. Cash flows provided by operating activities was $12.2 million for the 24 weeks ended June 11, 2013, consisting primarily of net income of $8.0 million, adjustments for depreciation, amortization and other non-cash charges totaling $5.3 million, a net increase of $2.8 million resulting from a decrease in other current assets and the collection of lease incentives receivable, a $3.0 million increase in net deferred income tax liability and a $0.6 million increase in deferred rent obligations. These cash inflows were partially offset by decreases in accounts payable, accrued liabilities and income taxes payable totaling $7.3 million and $0.1 million related to an increase in inventories. Cash flows provided by operating activities was $12.7 million for the 24 weeks ended June 12, 2012, consisting primarily of net income of $8.6 million, adjustments for depreciation, amortization and other non-cash charges totaling $3.9 million, a net increase in cash of $3.0 million from an increase in income taxes payable, accounts payable and deferred rent obligations and a net increase in cash of $0.4 million resulting from a decrease in inventories and lease incentives receivable. These cash inflows were partially offset by decreases in other liabilities of $3.1 million and an increase in other assets of $0.1 million.
Investing Activities. Net cash used in investing activities for the 24 weeks ended June 11, 2013 was $10.3 million, consisting primarily of purchases of property and equipment. These
61
Table of Contents
purchases primarily related to construction of one Grille restaurant opened during the first quarter of fiscal 2013, one Grille restaurant in progress and scheduled to open in the summer of 2013, and remodel activity of existing restaurants. Net cash used in investing activities for the 24 weeks ended June 12, 2012 was $12.5 million, consisting primarily of purchases of property and equipment. These purchased primarily related to construction of new Grille restaurants opened during the summer of 2012, and remodel activity of existing restaurants.
Financing Activities. Net cash provided by financing activities for the 24 weeks ended June 11, 2013 was $1.8 million, which was comprised solely of the contribution by Wagon to pay the transaction bonuses related to the secondary public offering that occurred in March 2013. Net cash used in financing activities for the 24 weeks ended June 12, 2012 was $8.5 million consisting of principal payments made on our prior credit facility.
The following table summarizes the statement of cash flows for the fiscal years December 28, 2010, December 27, 2011 and December 25, 2012:
| Fiscal Year Ended | ||||||||||||
| December 28, 2010 |
December 27, 2011 |
December 25, 2012 |
||||||||||
| (in thousands) | ||||||||||||
| Net cash provided by (used in): |
||||||||||||
| Operating activities |
$ | 11,999 | $ | 28,503 | $ | 30,968 | ||||||
| Investing activities |
(1,210 | ) | (7,151 | ) | (32,173 | ) | ||||||
| Financing activities |
(19,889 | ) | (11,390 | ) | (2,151 | ) | ||||||
|
|
|
|
|
|
|
|||||||
| Net increase (decrease) in cash and cash equivalents |
$ | (9,100 | ) | $ | 9,962 | $ | (3,356 | ) | ||||
|
|
|
|
|
|
|
|||||||
Operating Activities. Cash flows provided by operating activities was $31.0 million in 2012 consisting primarily of net income of $13.8 million, adjustments for depreciation, amortization and other non-cash charges totaling $11.6 million, a net increase in cash of $8.4 million resulting from a decrease in restricted cash and an increase in other liabilities and deferred rent obligations, and $3.2 million resulting from increases in accounts payable and income taxes payable. These cash inflows were partially offset by increases in inventories and other current assets of $4.4 million and deferred income taxes of $1.6 million. Cash flows provided by operating activities was $28.5 million in 2011, consisting primarily of net income of $9.0 million, adjustments for depreciation, amortization and other non-cash charges of $11.6 million, a $9.8 million increase in accounts payable, deferred rent obligations, and other liabilities and a $2.5 million increase in income taxes payable. These cash inflows were partially offset by an increase of $1.0 million in restricted cash, an increase in other assets and inventories of $1.8 million and a decrease of $1.6 million in net deferred income taxes. Cash flows provided by operating activities was $12.0 million in 2010, consisting primarily of net income of $8.7 million, adjustments for depreciation, amortization and other non-cash charges of $9.3 million and a $4.6 million increase in income taxes payable, deferred rent obligations, and other liabilities. These cash inflows were partially offset by $6.5 million in payments attributable to accrued interest associated with the payoff of advances due to one of the Casual Dining Companies, as discussed in note 4 in the Notes to Consolidated Financial Statements, as well as a decrease in accounts payable of $2.4 million, an increase in other assets and inventories of $1.5 million and a decrease of $0.3 million in net deferred income taxes.
Investing Activities. Net cash used in investing activities in 2012 was $32.2 million, consisting primarily of purchases of property and equipment of $33.6 million, partially offset by proceeds from the sale of the Dallas Sullivan’s restaurant property. These purchases primarily
62
Table of Contents
related to construction of three Grille restaurants and one Del Frisco’s opened during the year, two Grille restaurants in progress and scheduled to open in the first half of fiscal 2013, and remodel activity of existing restaurants. As a component of the remodel activity, during 2012, we completed refreshes, with varying scopes of work, of five Del Frisco’s and six Sullivan’s at an average cost of $0.3 million per location. Net cash used in investing activities in 2011 was $7.2 million, consisting primarily of purchases of property and equipment of $20.1 million, primarily related to the construction of the new Del Frisco’s and Grille restaurants during the period, partially offset by net proceeds of $13.2 million received from the sale and leaseback of two restaurant properties during the year. Net cash used in investing activities in 2010 was $1.2 million, consisting primarily of net proceeds of $4.3 million received from the sale and leaseback of one restaurant property during the period, partially offset by purchases of property and equipment of $5.6 million, primarily related to the construction of a Del Frisco’s and a Sullivan’s restaurant during the period.
Financing Activities. Net cash used in financing activities in 2012 was $2.2 million, consisting primarily of net proceeds from the issuance of common stock in our initial public offering, net of underwriter fees and issuance costs, of $66.5 million and a $1.4 million majority shareholder contribution made to fund the payment of public offering transaction bonuses, offset by principal payments of $70.0 million made on our credit facility. Net cash used in financing activities in 2011 was $11.4 million, consisting primarily of $11.9 million in principal payments made on our previous credit facility prior to its termination in July 2011, in addition to the payment of $2.0 million in loan costs associated with entering into the new credit facility. See “—Credit Facility” below. These payments were partially offset by $3.0 million in incremental financing under the new credit facility over the prior credit facility. Net cash used in financing activities in 2010 was $19.9 million, consisting primarily of $26.4 million in principal payments made on our previous credit facility and $40.7 million in payments made to pay off advances due to one of the Casual Dining Companies, as discussed in note 4 in the Notes to Consolidated Financial Statements. These cash outflows were partially offset by a $47.1 million member contribution made to fund the principal and accrued interest due to one of the Casual Dining Companies.
Capital Expenditures
We typically target an average cash investment of approximately $7.0 million to $9.0 million per restaurant for a Del Frisco’s restaurant and $3.0 million to $4.5 million for a Sullivan’s or a Grille, in each case net of landlord contributions and equipment financing and including pre-opening costs. In addition, we are currently “refreshing” a number of our Sullivan’s and Del Frisco’s locations to, among other things, add additional seating, private dining space and patio seating. During 2012, we completed refreshes, with varying scopes of work, of five Del Frisco’s and six Sullivan’s at an average cost of $0.3 million per location. Thereafter, we expect to complete one to two refreshes each year at an approximate cost of $0.5 million per location. These capital expenditures will primarily be funded by cash flows from operations and, if necessary, by the use of our credit facility, depending upon the timing of expenditures.
Credit Facility
We entered into the 2011 credit facility in July 2011 and terminated our prior credit facility that consisted of a seven-year $110 million term loan and six-year revolving credit facility of up to $20.0 million. The 2011 credit facility provided for a five-year term loan of $70.0 million and a five-year revolving credit facility of up to $10.0 million. We used the net proceeds of the borrowings under the 2011 credit facility to retire our prior credit facility, which at the time had a balance of approximately $67.0 million. The remaining proceeds were used to pay related fees
63
Table of Contents
and expenses and for working capital. We repaid $61.0 million under the 2011 credit facility on August 1, 2012 with proceeds from our initial public offering, and on September 4, 2012 we repaid the remaining $500,000 outstanding under the 2011 credit facility. We expensed approximately $1.6 million of deferred loan costs in connection with the repayment during the third quarter of fiscal 2012. As discussed below, we replaced the 2011 credit facility in the fourth quarter of fiscal 2012 with a new credit facility.
Borrowings under the 2011 credit facility accrued interest at a rate between LIBOR plus 4.75% and LIBOR plus 5.75%, depending on our leverage ratio. Our obligations under the 2011 credit facility were guaranteed by each of our existing and future subsidiaries and were secured by substantially all of our assets and the capital stock of our subsidiaries.
The 2011 credit facility contained various financial covenants, including a maximum ratio of total indebtedness to EBITDA, a minimum amount of EBITDA plus corporate general and administrative expenses, a minimum ratio of EBITDA plus certain non-recurring items to fixed charges (including consolidated capital expenses) and a minimum level of liquidity. Specifically, these covenants required that we have a fixed charge coverage ratio of greater than 1.50, a leverage ratio of less than 3.25, consolidated liquidity of greater than or equal to $3.0 million and adjusted restaurant-level EBITDA (as defined in the 2011 credit facility on a rolling four fiscal quarter basis) of greater than or equal to $30.0 million. During 2012, we were in compliance with each of these tests. The 2011 credit facility also contained customary events of default.
On October 15, 2012, we entered into a new credit facility that provides for a three-year unsecured revolving credit facility of up to $25.0 million. Borrowings under the 2012 credit facility bear interest at a rate of LIBOR plus 1.50%. We are required to pay a commitment fee equal to 0.25% per annum on the available but unused revolving loan facility. The credit facility is guaranteed by certain of our subsidiaries. The credit facility contains various financial covenants, including a maximum ratio of total indebtedness to EBITDA (as defined in the credit facility), and minimum fixed charge coverage. Specifically, we are required to have a leverage ratio of less than 1.00 and a fixed charge coverage ratio of greater than 2.00. As of June 11, 2013, we were in compliance with each of these tests. The credit facility also contains covenants restricting certain corporate actions, including asset dispositions, acquisitions, the payment of dividends, the incurrence of indebtedness and providing financing or other transactions with affiliates. As of June 11, 2013, there were no outstanding borrowings under this facility.
We believe that net cash provided by operating activities and available borrowings under our credit facility will be sufficient to fund currently anticipated working capital, planned capital expenditures and debt service requirements for the next 24 months. We regularly review acquisitions and other strategic opportunities, which may require additional debt or equity financing. We currently do not have any pending agreements or understandings with respect to any acquisition or other strategic opportunities.
Contractual Obligations
The following table summarizes our contractual obligations as of December 25, 2012:
| Total | Less than 1 year |
1-3 years | 3-5 years | More than 5 years |
||||||||||||||||
| (in thousands) | ||||||||||||||||||||
| Long-term debt |
$ | — | $ | — | $ | — | $ | — | $ | — | ||||||||||
| Operating leases |
204,074 | 11,936 | 25,093 | 25,095 | 141,950 | |||||||||||||||
|
|
|
|
|
|
|
|
|
|
|
|||||||||||
| Total |
$ | 204,074 | $ | 11,936 | $ | 25,093 | $ | 25,095 | $ | 141,950 | ||||||||||
|
|
|
|
|
|
|
|
|
|
|
|||||||||||
64
Table of Contents
Initial Public Offering
On July 26, 2012, we priced a $75.4 million initial public offering of 5.8 million shares of common stock at $13.00 per share. Upon the August 1, 2012 closing of our initial public offering, we received net proceeds of approximately $70.1 million, reflecting approximately $5.3 million of underwriting discounts and commissions. Additionally, we incurred approximately $3.7 million in offering costs that reduced the net proceeds available to additional paid in capital. At the completion of our initial public offering, an entity controlled by Lone Star Fund owned approximately 18.0 million shares of common stock, or approximately 76% of our outstanding shares.
Prior to the closing of our initial public offering, we converted from a limited liability company to a corporation and in connection therewith, our then-outstanding membership interests were converted into approximately 18.0 million shares of common stock. At August 1, 2012, the closing date of our initial public offering, we had a total of approximately 23.8 million shares of common stock issued and outstanding.
We used a portion of the net proceeds from our initial public offering to repay $61.0 million of amounts outstanding under our credit facility on August 1, 2012, as discussed above. In addition, as discussed above, we used $3.0 million of the net proceeds to make a one-time payment to Lone Star Fund in consideration for the termination of an asset advisory agreement upon consummation of our initial public offering. We will use the remainder of the net proceeds for working capital and other general corporate purposes. In conjunction with the repayment of amounts outstanding under the credit facility, we wrote-off approximately $1.6 million in unamortized debt issuance costs in the third quarter of fiscal 2012.
In connection with our initial public offering, we adopted the 2012 Long-Term Incentive Plan, which provides for the issuance of up to 2,232,800 shares of common stock. We granted options to purchase 745,000 shares to our officers, employees and certain director nominees under this plan at the time of the pricing of the offering with an exercise price equal to $13.00, the initial public offering price.
Off-Balance Sheet Arrangements
Prior to the acquisition of Lone Star Steakhouse & Saloon, Inc. by Lone Star Fund, the predecessor guaranteed certain lease payments of certain of the Casual Dining Companies in connection with the leasing of real estate for restaurant locations. As of June 11, 2013, we continue to be a guarantor for five of these leases. The leases expire at various times through 2016. These guarantees would require payment by us only in an event of default by the Casual Dining Company tenant where it failed to make the required lease payments or perform other obligations under a lease. We believe that the likelihood is remote that material payments will be required under these guarantees. At June 11, 2013, the maximum potential amount of future lease payments we could be required to make as a result of the guarantees was $1.8 million.
Inflation
Over the past five years, inflation has not significantly affected our operations. However, the impact of inflation on labor, food and occupancy costs could, in the future, significantly affect our operations. We pay many of our employees hourly rates related to the applicable federal or state minimum wage. Food costs as a percentage of revenues have been somewhat stable due to procurement efficiencies and menu price adjustments, although no assurance can be made that our procurement will continue to be efficient or that we will be able to raise menu prices in
65
Table of Contents
the future. Costs for construction, taxes, repairs, maintenance and insurance all impact our occupancy costs. We believe that our current strategy, which is to seek to maintain operating margins through a combination of menu price increases, cost controls, careful evaluation of property and equipment needs, and efficient purchasing practices, has been an effective tool for dealing with inflation. There can be no assurance, however, that future inflationary or other cost pressure will be effectively offset by this strategy.
Transaction Bonuses
We expect that Mr. Mednansky, our Chief Executive Officer, and Mr. Pennison, our Chief Financial Officer, will be paid a transaction bonus of approximately $ and $ , respectively (or $ and $ , respectively, if the underwriters fully exercise their option to purchase additional shares), by our parent company in connection with this offering, as discussed in greater detail under “Executive Compensation—Payments in Connection with Our Initial Public Offering and this Offering—Transaction Bonuses.” Although these transaction bonuses will be paid by our parent company, they will result in an expense recognized to our consolidated statement of income and a deemed capital contribution.
Critical Accounting Policies and Estimates
Our discussion and analysis of results of operations and financial condition are based upon our audited consolidated financial statements, which have been prepared in accordance with accounting principles generally accepted in the United States. The preparation of these financial statements is based on our critical accounting policies that require us to make estimates and judgments that affect the amounts reported in those financial statements. Our significant accounting policies, which may be affected by our estimates and assumptions, are more fully described in the notes to the consolidated financial statements included elsewhere in this prospectus. Critical accounting policies are those that we believe are most important to portraying our financial condition and results of operations and also require the greatest amount of subjective or complex judgments by management. Judgments or uncertainties regarding the application of these policies may result in materially different amounts being reported under different conditions or using different assumptions. We consider the following policies to be the most critical in understanding the judgments that are involved in preparing the consolidated financial statements.
Goodwill and Other Intangible Assets
We account for our goodwill and intangible assets in accordance with Accounting Standards Codification, or ASC, Topic 350, Intangibles—Goodwill and Other. In accordance with ASC 350, goodwill and intangible assets, primarily trade names, which have indefinite useful lives, are not being amortized. However, both goodwill and trade names are subject to annual impairment testing in accordance with ASC Topic 350.
The impairment evaluation for goodwill is conducted annually using a two-step process. In the first step, the fair value of each reporting unit is compared with the carrying amount of the reporting unit, including goodwill. The estimated fair value of the reporting unit is generally determined on the basis of discounted future cash flows. If the estimated fair value of the reporting unit is less than the carrying amount of the reporting unit, then a second step must be completed in order to determine the amount of the goodwill impairment that should be recorded. In the second step, the implied fair value of the reporting unit’s goodwill is determined by allocating the reporting unit’s fair value to all of its assets and liabilities other than goodwill in a manner similar to a purchase price allocation. The resulting implied fair value
66
Table of Contents
of the goodwill that results from the application of this second step is then compared to the carrying amount of the goodwill and an impairment charge is recorded for the difference.
The evaluation of the carrying amount of other intangible assets with indefinite lives is made annually by comparing the carrying amount of these assets to their estimated fair value. The estimated fair value is generally determined on the basis of discounted future cash flows of the restaurant concepts. We make assumptions regarding future profits and cash flows, expected growth rates, terminal value, and other factors which could significantly impact the fair value calculations. If the estimated fair value is less than the carrying amount of the other intangible assets with indefinite lives, then an impairment charge is recorded to reduce the asset to its estimated fair value.
The assumptions used in the estimate of fair value are generally consistent with the past performance of each reporting unit and other intangible assets and are also consistent with the projections and assumptions that are used in current operating plans. These assumptions are subject to change as a result of changing economic and competitive conditions.
The fair value of our restaurant concepts were substantially in excess of the carrying value as of our 2012 goodwill impairment test that was performed at year-end.
Property and Equipment
We assess recoverability of property and equipment in accordance with ASC Topic 360, Property, Plant and Equipment. Our assessment of recoverability of property and equipment is performed on a restaurant-by-restaurant basis. Certain events or changes in circumstances may indicate that the recoverability of the carrying amount of property and equipment should be assessed. These events or changes may include a significant decrease in market value, a significant change in the business climate in a particular market, or a current-period operating or cash flow loss combined with historical losses or projected future losses. If an event occurs or changes in circumstances are present, we estimate the future cash flows expected to result from the use of the asset and its eventual disposition. If the sum of the expected future cash flows (undiscounted and without interest charges) is less than the carrying amount, we recognize an impairment loss. The impairment loss recognized is the amount by which the carrying amount exceeds the fair value. Additionally, we periodically review assets for changes in circumstances which may impact their useful lives.
Our assessments of cash flows represent our best estimate as of the time of the impairment review and are consistent with our internal planning. If different cash flows had been estimated in the current period, the property and equipment balances could have been materially impacted. Furthermore, our accounting estimates may change from period to period as conditions change, and this could materially impact our results in future periods. Factors that we must estimate when performing impairment tests include sales volume, prices, inflation, marketing expense, and capital expenses.
We recognized non-cash impairment charges of long-lived assets of $1.4 million in 2011 which is included in discontinued operations. This impairment charge was related to our determination that the carrying amount of long-lived assets at one Sullivan’s exceeded its estimated future cash flows. The estimated fair value was based on an estimated sales price for this location.
67
Table of Contents
Leases
We currently lease all but one of our restaurant locations. We evaluate each lease to determine its appropriate classification as an operating or capital lease for financial reporting purposes. All of our leases are classified as operating leases. We record the minimum lease payments for our operating leases on a straight-line basis over the lease term, including option periods which in the judgment of management are reasonably assured of renewal. The lease term commences on the date that the lessee obtains control of the property, which is normally when the property is ready for tenant improvements. Contingent rent expense is recognized as incurred and is usually based on either a percentage of restaurant sales or as a percentage of restaurant sales in excess of a defined amount. Our lease costs will change based on the lease terms of our lease renewals as well as leases that we enter into with respect to our new restaurants.
Leasehold improvements financed by the landlord through tenant improvement allowances are capitalized as leasehold improvements with the tenant improvement allowances recorded as deferred lease incentives. Deferred lease incentives are amortized on a straight-line basis over the lesser of the life of the asset or the lease term, including option periods which in the judgment of management are reasonably assured of renewal (same term that is used for related leasehold improvements) and are recorded as a reduction of occupancy expense. As part of the initial lease terms, we negotiate with our landlords to secure these tenant improvement allowances. There is no guarantee that we will receive tenant improvement allowances for any of our future locations, which would result in additional occupancy expenses.
Income Taxes
We have accounted for, and currently account for, income taxes in accordance with ASC Topic 740, Accounting for Income Taxes. This statement requires an asset and liability approach for financial accounting and reporting of income taxes. Under ASC Topic 740, income taxes are accounted for based upon the future tax consequences attributable to differences between the financial statement carrying amounts of existing assets and liabilities and their respective tax basis and operating loss and tax credit carry-forwards. Income taxes are one of our critical accounting policies and estimates and therefore involve a certain degree of judgment. We use an estimate of our annual effective tax rate at each interim period based on the facts and circumstances available at that time while the actual effective tax rate is calculated at year-end.
The realization of tax benefits of deductible temporary differences will depend on whether we will have sufficient taxable income of an appropriate character to allow for utilization of the deductible amounts.
We record a liability for unrecognized tax benefits resulting from tax positions taken, or expected to be taken, in an income tax return. We recognize any interest and penalties related to unrecognized tax benefits in income tax expense. Significant judgment is required in assessing, among other things, the timing and amounts of deductible and taxable items. Tax reserves are evaluated and adjusted as appropriate, while taking into account the progress of audits of various taxing jurisdictions.
Self-Insurance Reserves
We maintain various insurance policies including workers’ compensation and general liability. Pursuant to those policies, we are responsible for losses up to certain limits and are required to estimate a liability that represents our ultimate exposure for aggregate losses below
68
Table of Contents
those limits. This liability is based on management’s estimates of the ultimate costs to be incurred to settle known claims and claims not reported as of the balance sheet date. Our estimated liability is not discounted and is based on a number of assumptions and factors, including historical trends, actuarial assumptions, and economic conditions. If actual trends, including the severity or frequency of claims, differ from our estimates, our financial results could be impacted.
Recent Accounting Pronouncements
In May 2011, the FASB issued Accounting Standards Update, or ASU, 2011-04, Fair value Measurement (Topic 820), Amendments to Achieve Common Fair Value Measurement and Disclosure Requirements in U.S. GAAP and IFRS. Many of the amendments in this update change the wording used in the existing guidance to better align GAAP with International Financial Reporting Standards and to clarify the FASB’s intent on various aspects of the fair value guidance. The update also requires increased disclosure of quantitative information about unobservable inputs used in a fair value measurement that is categorized within Level 3 of the fair value hierarchy. The update is effective for us beginning in fiscal 2012 and should be applied prospectively. Other than requiring additional disclosures, the new guidance did not have a significant impact on our consolidated financial statements upon adoption in the interim period ending September 4, 2012.
In June 2011, the FASB issued ASU 2011-05, Comprehensive Income (Topic 220), Presentation of Comprehensive Income, which requires us to present the total of comprehensive income, the components of net income, and the components of other comprehensive income either in a single continuous statement of comprehensive income or in two separate but consecutive statements. The update eliminates the option to present the components of other comprehensive income as part of the statement of equity. In December 2011, the FASB issued ASU 2011-12, Comprehensive Income (Topic 220), Deferral of Effective Date for Amendments to the Presentation of Reclassifications of Items Out of Accumulated Other Comprehensive Income in ASU 2011-05, to defer the effective date of the specific requirement to present items that are reclassified out of accumulated other comprehensive income to net income alongside their respective components of net income and other comprehensive income. All other provisions of the update are effective for us in fiscal 2012 and have been applied retrospectively.
In September 2011, the FASB issued ASU 2011-08, Intangible-Goodwill and Other (Topic 350), Testing Goodwill for Impairment, which permits an entity to make a qualitative assessment of whether it is more likely than not that a reporting unit’s fair value is less than its carrying value before applying the two-step goodwill impairment model that is currently in place. If it is determined through qualitative assessment that a reporting unit’s fair value is more likely than not greater than its carrying value, the remaining impairment steps would be unnecessary. The qualitative assessment is optional, allowing us to go directly to the quantitative assessment. The update was effective in fiscal years beginning after December 15, 2011. We do not believe the new guidance had a significant impact on our consolidated financial statements.
In July 2012, the FASB issued ASU 2012-02, Intangibles—Goodwill and Other (Topic 350), Testing Indefinite Lived Intangible Assets for Impairment. This ASU simplifies the guidance for impairment testing of indefinite-lived intangible assets other than goodwill and gives companies the option to assess qualitative factors to determine whether it is necessary to perform a quantitative impairment test. Companies electing to perform a qualitative assessment are no longer required to calculate the fair value of an indefinite-lived intangible asset unless
69
Table of Contents
the company determines, based on a qualitative assessment, that it is “more likely than not” that the asset is impaired. This update is effective for annual and interim impairment tests performed in fiscal years beginning after September 15, 2012; however, early adoption is permitted. We do not believe adoption of this new guidance will have a significant impact on our consolidated financial statements.
New and Revised Financial Accounting Standards
We qualify as an “emerging growth company” pursuant to the provisions of the JOBS Act. Section 102 of the JOBS Act provides that an “emerging growth company” can take advantage of the extended transition period provided in Section 7(a)(2)(B) of the Securities Act for complying with new or revised accounting standards. However, we chose to “opt out” of this extended transition period, and as a result, we will comply with new or revised accounting standards on the relevant dates on which adoption of such standards is required for non-“emerging growth companies.” Our decision to opt out of the extended transition period is irrevocable.
Quantitative and Qualitative Disclosures About Market Risk
Interest Rate Risk
The inherent risk in market risk sensitive instruments and positions primarily relates to potential losses arising from adverse changes in interest rates.
We are exposed to market risk from fluctuations in interest rates. For fixed rate debt, interest rate changes affect the fair market value of the debt but do not impact earnings or cash flows. Conversely for variable rate debt, including borrowings under our credit facility, interest rate changes generally do not affect the fair market value of the debt, but do impact future earnings and cash flows, assuming other factors are held constant. At June 11, 2013, we had no outstanding debt. Assuming a full drawdown on the revolving credit facility, and holding other variables constant, such as foreign exchange rates and debt levels, a hypothetical immediate one percentage point change in interest rates would be expected to have an impact on pre-tax earnings and cash flows of approximately $0.3 million over the course of 12 months.
Commodity Price Risk
We are exposed to market price fluctuations in beef, seafood, produce and other food product prices. Given the historical volatility of beef, seafood, produce and other food product prices, these fluctuations can materially impact our food and beverage costs. While we have taken steps to qualify multiple suppliers who meet our standards as suppliers for our restaurants and enter into agreements with suppliers for some of the commodities used in our restaurant operations, there can be no assurance that future supplies and costs for such commodities will not fluctuate due to weather and other market conditions outside of our control. We currently do not contract for some of our commodities, such as fresh seafood and certain produce, for periods longer than one week. Consequently, such commodities can be subject to unforeseen supply and cost fluctuations. Dairy costs can also fluctuate due to government regulation. Because we typically set our menu prices in advance of our food product prices, our menu prices cannot immediately take into account changing costs of food items. To the extent that we are unable to pass the increased costs on to our customers through price increases, our results of operations would be adversely affected. We do not use financial instruments to hedge our risk to market price fluctuations in beef, seafood, produce and other food product prices at this time.
70
Table of Contents
Our Company
We develop, own and operate three contemporary, high-end, complementary restaurants: Del Frisco’s Double Eagle Steak House, or Del Frisco’s, Sullivan’s Steakhouse, or Sullivan’s, and Del Frisco’s Grille, or the Grille. We are a leader in the full-service steakhouse industry based on average unit volume, or AUV, EBITDA margin and comparable restaurant sales growth. We currently operate 36 restaurants in 19 states. Each of our three restaurant concepts offers steaks as well as other menu selections, such as chops and fresh seafood. Our Grille concept is designed to appeal to both business as well as upscale casual diners and features relatively less expensive entrées, such as flatbread pizzas, sandwiches and salads. These menu selections are complemented by an extensive, award-winning wine list. Del Frisco’s, Sullivan’s and the Grille are positioned within the fine dining segment and are designed to appeal to both business and local dining customers. Our Del Frisco’s restaurants are sited in urban locations to target customers seeking a “destination dining” experience while our Sullivan’s and Grille restaurants are intended to appeal to a broader demographic, allowing them to be located either in urban areas or in close proximity to affluent residential neighborhoods. We believe our success reflects consistent execution across all aspects of the dining experience, from the formulation of proprietary recipes to the procurement and presentation of high quality menu items and delivery of a positive customer experience.
We believe we have an attractive unit economic model that enables us to generate our AUV and adjusted EBITDA margins. We generated revenues of $232.4 million for the fiscal year ended December 25, 2012, representing 17.0% total revenue growth and 4.2% comparable restaurant sales growth over 2011. We recorded net income of $13.8 million and adjusted EBITDA of $43.0 million for 2012, representing 53.3% net income growth and 18.1% adjusted EBITDA growth over 2011. Our 2012 operating income and adjusted EBITDA margins were 10.7% and 18.5%, respectively. We generated revenues of $120.2 million for the 24 weeks ended June 11, 2013, representing 15.9% total revenue growth and 1.0% comparable restaurant sales growth over the 24 weeks ended June 12, 2012. We recorded net income of $8.0 million and adjusted EBITDA of $20.0 million for the 24 weeks ended June 11, 2013, representing a 7.1% and 2.7% decrease in net income and adjusted EBITDA, respectively, as compared to the 24 weeks ended June 12, 2012. Our operating income and adjusted EBITDA margins for the 24 weeks ended June 11, 2013 were 9.9% and 16.6%, respectively. For a reconciliation of adjusted EBITDA and adjusted EBITDA margin and a discussion of why we consider them useful, see “Selected Consolidated and Combined Financial Data.”
Del Frisco’s Double Eagle Steak House
We believe Del Frisco’s is one of the premier steakhouse concepts in the United States. The Del Frisco’s brand is defined by its menu, which includes USDA Prime grade, wet-aged steaks hand-cut at the time of order and a range of other high-quality offerings, including prime lamb, fresh seafood, and signature side dishes and desserts. It is also distinguished by its “swarming service,” whereby customers are served simultaneously by multiple servers. Each restaurant has a sommelier to guide diners through an extensive, award-winning wine list and our bartenders specialize in hand-shaken martinis and crafted cocktails. Del Frisco’s restaurants target customers seeking a full-service, fine dining steakhouse experience. We believe the décor and ambiance, with both contemporary and classic designs, enhance our customers’ experience and differentiate Del Frisco’s from other upscale steakhouse concepts. We currently operate ten Del Frisco’s steakhouses in eight states. These restaurants range in size from 11,000 to 24,000 square feet with seating capacity for at least 300 people. Annual AUVs per Del Frisco’s restaurant were $13.8 million for the fiscal year ended December 25, 2012. During the same period, the average check at Del Frisco’s was $104.
71
Table of Contents
Sullivan’s Steakhouse
Sullivan’s was created in the mid-1990’s as a complementary concept to Del Frisco’s. The Sullivan’s brand is defined by a fine dining experience at a more accessible price point, along with a vibrant atmosphere created by an open kitchen, live music and a bar area designed to be a center for social gathering and entertainment. Each Sullivan’s features fine hand-selected aged steaks, fresh seafood and a broad list of custom cocktails, along with an extensive selection of award-winning wines. We currently operate 19 Sullivan’s steakhouses in 15 states. These restaurants range in size from 7,000 to 11,000 square feet with seating capacity for at least 250 people. Annual AUVs per current Sullivan’s restaurant were $4.4 million for the fiscal year ended December 25, 2012. During the same period, the average check at Sullivan’s was $59.
Del Frisco’s Grille
We developed the Grille, our newest concept, to take advantage of the positioning of the Del Frisco’s brand and to provide greater potential for expansion due to its smaller size, lower build out cost and more diverse menu. The Grille is an upscale casual concept with a menu designed to appeal more broadly to both business and casual diners that features a variety of Del Frisco’s prime aged steaks, top selling signature menu items and a broad selection of the same quality wines. The Grille also offers an assortment of relatively less expensive entrées, such as flatbread pizzas, sandwiches and salads, all prepared with the same signature flavors, high quality ingredients and presentation associated with the Del Frisco’s brand. We believe the ambiance of the concept appeals to a wide range of customers seeking a less formal atmosphere for their dining occasions. We currently operate seven Grilles in five states and the District of Columbia. Additional Grille openings are planned over the next year and we anticipate they will, like existing Grille locations, range in size from 6,500 to 8,500 square feet with seating capacity for at least 200 people. We are targeting annual AUVs per Grille restaurant of between $4.5 million and $6.0 million with an average check of between $45 and $55.
Our Business Strengths
We believe the following are key strengths of our business and serve to differentiate us from our competitors:
Multiple Top Performing Concepts with an Expanding National Platform. We are one of the nation’s leading fine dining restaurant operators. We currently have 36 restaurants in 29 cities in 19 states in a wide variety of geographic and demographic markets. Our current locations that were operating throughout the fiscal year ended December 25, 2012 had AUVs of $7.5 million per location across all concepts, $13.8 million at our Del Frisco’s locations ($10.9 million excluding our New York location) and $4.4 million at our Sullivan’s locations. Further, we believe we appeal to landlords with desirable locations by offering three complementary concepts adaptable to a variety of areas and venues. In 2011, we expanded our national platform by opening a Del Frisco’s in Boston, Massachusetts and our first two Grille restaurants in New York City and Dallas, Texas. In 2012, we opened Grilles in Phoenix, Arizona, Washington D.C. and Atlanta, Georgia, and a Del Frisco’s in Chicago, Illinois. In 2013, we have to date opened Grilles in Houston, Texas and Santa Monica, California and expect to open three to four additional Grilles by the end of the year.
Operating Model Driving Higher Margins. Our AUVs and high average check per person, combined with our operating efficiencies, enable us to achieve industry-leading operating margins based on 2012 public company data for U.S. based full-service dining restaurants that generate a majority of their revenues from restaurant operations and excluding companies with a majority of franchised operations. We believe that our success is driven by our consistent
72
Table of Contents
execution across all aspects of the dining experience, from the formulation of proprietary recipes to the procurement and presentation of high quality menu items and our focus on providing a positive customer experience. Our entrepreneurial culture and bonus incentives empower and motivate the general manager at each restaurant to act as the owner of his or her restaurant. These general managers meet weekly as a group with senior management to share best practices. Chefs and kitchen staff at each restaurant are responsible for maintaining and ordering their own food inventory, thereby increasing efficiency and reducing waste and the need for additional headcount at the corporate level. We believe we achieve significant cost, quality and availability advantages through centralized sourcing from our primary suppliers of beef, wine and other products. In fiscal 2012, our revenues were comprised 66% of food and 34% of alcohol. We had operating income and restaurant-level EBITDA margins of 10.7% and 24.3% in fiscal 2012 and 9.9% and 23.2% for the 24 weeks ended June 11, 2013, respectively.
Fine Dining Concepts with Complementary Market Positions. Del Frisco’s, Sullivan’s and the Grille are fine dining concepts that share a focus on high quality food, individualized interior design and attentive service. The concepts were designed to coexist with one another, each maintaining its own identity and price point. Average checks at Del Frisco’s and Sullivan’s were $104 and $59, respectively, for the fiscal year ended December 25, 2012, and the targeted average check at the Grille is between $45 and $55. Currently, we operate multiple concepts in close proximity to each other in six of our markets. We believe our complementary positioning will continue to allow us to develop our concepts in a single metropolitan area without competing for customers. We have secured prominent locations for our restaurants and a number of unique sites not typically used for steakhouse locations, including a historic bank building, a redeveloped wharf, a landmark theater building and a former retail space in Rockefeller Center. We believe the locations of our restaurants distinguish us from our competitors, add to the strength of our brands and help drive our AUVs. Furthermore, we believe many landlords and developers seek out our concepts to be restaurant anchors for their developments as our concepts are complementary to upscale national retailers with similar target demographics.
Focus on Innovation. We have developed and created three full-service restaurant concepts. As we have grown our concepts, we have evolved each to incorporate proprietary recipes with bold and flavorful seasonings that reflect our heritage in the Southern United States, extensive wine lists, prominent bar scenes and our “swarming service.” We have positioned the Del Frisco’s brand as a contemporary alternative to the traditional fine dining steakhouse dining concept. We developed Sullivan’s in the mid-1990’s, featuring lower price points and live music to attract a broader clientele. The Grille, introduced in 2011, leverages and broadens Del Frisco’s appeal in a less formal and smaller format. The Grille has been recognized in the industry as an innovative and exciting new concept, including being honored with Nation’s Restaurant News’ 2012 Hot Concepts Award. We remain committed to evolving our existing concepts to remain relevant to a range of customers.
High Quality Menu Offerings with a Focus on Social Experience and Customer Service. We believe our concepts provide our customers with a true fine dining steakhouse and upscale grille experience by combining high quality food, atmosphere and service. We offer high quality cuisine across all menu items, with an emphasis on aged beef, fresh seafood and locally sourced ingredients. These offerings are complemented by an extensive, award-winning wine list and a broad cocktail selection. The dining experience is enhanced by our commitment to providing a social atmosphere and décor that includes carefully-selected artwork, private dining rooms and separate bar areas. To further enhance our customers’ dining experience we have a staff of highly-trained employees who undergo an extensive training program and are evaluated regularly by management. These employees provide our “swarming service,” which creates frequent interactions with our customers.
73
Table of Contents
Experienced Executive and Restaurant Management Teams. Our executive team has extensive experience with an average of over 20 years in the restaurant industry, including significant tenure with our company as well as other high-end restaurant concepts. Our restaurant-level managers are also very experienced, with average tenure at Del Frisco’s and Sullivan’s of ten and four years, respectively, and additional experience at other fine dining establishments. Our management team, which includes senior management, regional managers and general managers, meets on a weekly basis to review financial and operating results as well as receive feedback from both senior management and their peers to collaborate on best practices. We believe this management process fosters a commitment to operational excellence focused on producing a positive customer experience and strong financial performance.
Our Growth Strategy
We believe there are significant opportunities to grow our business, strengthen our competitive position and enhance our concepts through the continued implementation of the following strategies:
Pursue Disciplined New Unit Expansion. We believe our concepts have significant room to grow. We have an established growth pipeline and a disciplined strategy for opening new restaurants. Our growth strategy includes entering new markets and expanding our presence in existing markets. We believe our concepts’ market positioning, broad range of average checks and menu offerings, coupled with the flexibility of our restaurant models across a range of trade areas and square footage will allow us to expand each of our three concepts into a greater number of locations. We have successfully opened new restaurants in a number of diverse markets. We target a cash-on-cash return beginning in the third operating year of at least 25% for new restaurants across all of our concepts. We believe there are opportunities to open four to six restaurants annually, generally composed of one Del Frisco’s and three to five Sullivan’s and/or Grilles, with new openings of our Grille concept likely serving as the primary driver of new unit growth in the near term. In 2012, we opened Grilles in Phoenix, Arizona, Washington D.C. and Atlanta, Georgia, and a Del Frisco’s in Chicago, Illinois. In 2013, we have to date opened Grilles in Houston, Texas and Santa Monica, California and expect to open three to four additional Grilles by the end of the year. Beyond domestic new unit growth, although we have no current intention to do so, we believe our concepts have the potential for expansion in select international markets through franchising, licensing, Company-owned restaurants or a combination of the foregoing. While we do not have a specific global expansion strategy and we have no current intention to expand into international markets, we believe there is a long-term opportunity for our concepts beyond the U.S. market.
Grow Our Existing Restaurant Sales. Our concepts achieve strong sales and customer count growth. We have increased comparable restaurant sales in twelve out of the last thirteen quarters, including fourteen consecutive quarterly increases for our Del Frisco’s concept. We believe there are opportunities to continue to increase our sales and average check through maintaining our focus on tableside up-selling and salesmanship by our servers and by strategically adjusting menu prices and enhancing our concepts’ brand awareness through increased marketing efforts. In addition, we are adding seating to select locations, which we believe will increase sales at these restaurants.
Further Grow Our Private Dining Business. We believe we are well-positioned to grow our private dining business due to our commitment to our customers’ dining experience, our unique locations and our plans to invest in improving our private dining facilities at select locations. All of our restaurants can serve large and small groups for private dining events, including corporate events, sales meetings, presentations, charity events and private parties. We are
74
Table of Contents
focused on growing our private dining business as it typically has a higher average check per customer and higher overall margins than regular dining room business. Private dining, excluding the Grille, represented approximately 15.3% of our total sales in the fiscal year ended December 25, 2012 as compared to 14.1% in the fiscal year ended December 27, 2011. We intend to drive growth by enhancing our private dining capacity and increasing awareness of our private dining services. To help drive this growth, we are creating additional private dining space at select locations by expanding or reconfiguring existing space. In addition, each location currently dedicates a staff member to increasing its private dining business. At the beginning of 2011, we hired a corporate-wide private dining executive who meets weekly with each restaurant’s private dining coordinator regarding upcoming events and sales initiatives, and during 2012, we hired a national private dining sales coordinator who coordinates private dining for national accounts for all restaurant locations.
Restaurant Industry Overview
According to the National Restaurant Association, U.S. restaurant industry sales in 2012 were $636 billion, an increase of 4.2% over 2011 sales of $611 billion, and were projected to grow to $661 billion in 2013, representing approximately 4.1% of the U.S. gross domestic product. We compete in the full-service steak industry, or the FSR Steak category as defined by Technomic, Inc., a research and consulting firm serving the food and foodservice industries. Each of our concepts falls into the FSR Steak category, which includes fine dining, and is defined as establishments with a relatively broad menu along with table, counter, and/or booth service and a waitstaff. At the conclusion of 2012, the FSR Steak category included 8,203 units as compared to 7,356 units at the end of 2011. The FSR Steak category achieved $15.8 billion in sales in 2012, representing a 7.0% growth rate over 2011, which saw sales of $14.8 billion, representing an 8.4% growth rate over 2010. Restaurants within the FSR Steak category within Technomic’s ranking of the top 500 restaurant chains (as ranked by U.S. system-wide sales) reported sales growth of 5.9% in 2012 and out-performed the Full Service Restaurant category, which reported sales growth of 2.9% in 2012. Restaurants within the FSR Steak category reported sales growth of 5.1% in 2011 and out-performed the Full Service Restaurant category, which reported sales growth of 1.8% in 2011.
Site Selection and Development
We believe site selection is critical for the potential success of our restaurants. We carefully consider growth opportunities for each of our restaurant concepts and utilize a customized approach for each concept when selecting and prioritizing markets for expansion. We perform comprehensive demographic and customer profile studies to evaluate and rationalize the trade areas and sites within each desired market. We leverage a significant number of sources to produce extensive research and analysis on the dynamics of the local area, the specific attributes of each site considered and the unit economics we believe we can realize.
For the Del Frisco’s brand, we focus on sites in urban locations that allow us to easily access business clientele and customers seeking a premium dining experience. Many of our Del Frisco’s restaurants are in marquee locations, including waterfront property, popular shopping districts and active business centers. We believe the broader appeal of the Sullivan’s and Grille concepts allows us to target sites in both urban locations as well as more suburban locations in close proximity to affluent residential areas. Our site assessment analysis includes three primary components: customer profiling (demographics, lifestyle segmentation, spend metrics), trade area and site evaluation (physical inspection, competitive benchmarking, analysis of business generators/traffic patterns), and financial modeling (square footage and seat count analysis, predictive sales and margin evaluations, investment cost and return metrics).
75
Table of Contents
Understanding our customers is an essential element of our market planning and site selection processes. We’ve developed a customer profile for each of our concepts to help guide our development efforts and educate our development partners. We look for the following minimum criteria in our site trade areas:
| Population(a) | Daytime Population(a) |
Average HH Income |
Median Age |
Priority Age Blocks(b) |
Traffic Counts(c) |
|||||||||||||||||||
|
|
100,000+ | 150,000+ | $ | 100,000+ | 40+ |
|
35-44; 45-54; 55-64 |
|
40,000+ | |||||||||||||||
|
|
|
|
|
|
|
|
|
|
|
|
|
|||||||||||||
|
|
75,000+ | 100,000+ | $ | 75,000+ | 35+ | 35-44; 45-54 | 25,000+ | |||||||||||||||||
|
|
|
|
|
|
|
|
|
|
|
|
|
|||||||||||||
|
|
75,000+ | 100,000+ | $ | 75,000+ | 35+ |
|
25-34; 35-44; 45-54 |
|
25,000+ | |||||||||||||||


| (a) | Represents the population within a customized target area generally with less than a 20-minute drive time. |
| (b) | Represents the targeted age demographics for a prospective site. |
| (c) | Represents the targeted average daily vehicle traffic for a prospective site. |
We expect the size of new Del Frisco’s restaurants to range from 12,000 to 16,000 square feet, new Sullivan’s restaurants to range from 8,000 to 9,000 square feet and new Grille restaurants to range from 6,500 to 8,500 square feet. For the opening of a new restaurant, we measure our cash investment costs net of landlord contributions and equipment financing, but including pre-opening costs. We target average cash investment costs of $7.0 million to $9.0 million for a new Del Frisco’s and $3.0 million to $4.5 million for a new Sullivan’s or Grille. We target a cash-on-cash return of at least 25% beginning in the third operating year across our concepts, consistent with the average of restaurant openings in recent years. To achieve this return we target a ratio of third year restaurant revenues to net development costs in the range of approximately 1.25:1 to 1.50:1. We target restaurant-level EBITDA margins of between 20% and 25% for each of our three concepts.
We believe there are opportunities to open four to six new restaurants annually, generally composed of one Del Frisco’s and three to five Sullivan’s and/or Grilles, with new openings of our Grille concept likely serving as the primary driver of new unit growth in the near term. It generally takes nine to 12 months after the signing of a lease or the closing of a purchase to complete construction and open a new restaurant. Additional time is sometimes required to obtain certain government approvals, permits and licenses, such as liquor licenses.
Properties
We currently operate 36 restaurants across 19 states. We currently lease all of our restaurants, except for one Del Frisco’s restaurant. The majority of our leases provide for minimum annual rents with some containing percentage-of-sales rent provisions, against which the minimum rent may be applied. Typically, our lease terms are five to 15 years at initiation, with two to four five-year extension options. None of our restaurant leases can be terminated
76
Table of Contents
early by the landlord other than as is customary in the context of a breach or default under the applicable lease.
| Opening Date |
City | State | Lease/Own | |||
| Del Frisco’s Double Eagle Steak House |
||||||
| September 1995 |
Dallas | Texas | Own | |||
| April 1996 |
Ft. Worth | Texas | Lease | |||
| January 1997 |
Denver | Colorado | Lease | |||
| March 2000 |
New York | New York | Lease | |||
| July 2000 |
Las Vegas | Nevada | Lease(1) | |||
| May 2007 |
Charlotte | North Carolina | Lease | |||
| November 2007 |
Houston | Texas | Lease | |||
| November 2008 |
Philadelphia | Pennsylvania | Lease | |||
| April 2011 |
Boston | Massachusetts | Lease | |||
| December 2012 |
Chicago | Illinois | Lease | |||
| Del Frisco’s Grille |
||||||
| August 2011 |
New York | New York | Lease | |||
| November 2011 |
Dallas | Texas | Lease | |||
| June 2012 |
Phoenix | Arizona | Lease | |||
| July 2012 |
Washington D.C. | Lease | ||||
| October 2012 |
Atlanta | Georgia | Lease | |||
| March 2013 |
Houston | Texas | Lease | |||
| July 2013 |
Santa Monica | California | Lease | |||
| Sullivan’s Steakhouse |
||||||
| May 1996 |
Austin | Texas | Lease | |||
| November 1996 |
Indianapolis | Indiana | Lease | |||
| October 1997 |
Baton Rouge | Louisiana | Lease | |||
| December 1997 |
Wilmington | Delaware | Lease | |||
| January 1998 |
Charlotte | North Carolina | Lease | |||
| July 1998 |
Houston | Texas | Lease | |||
| September 1998 |
Anchorage | Alaska | Lease(1) | |||
| September 1998 |
King of Prussia | Pennsylvania | Lease | |||
| December 1998 |
Naperville | Illinois | Lease(2) | |||
| January 1999 |
Palm Desert | California | Lease(3) | |||
| January 1999 |
Denver | Colorado | Lease(3) | |||
| June 1999 |
Chicago | Illinois | Lease | |||
| August 1999 |
Raleigh | North Carolina | Lease(4) | |||
| December 2000 |
Tucson | Arizona | Lease | |||
| July 2007 |
Omaha | Nebraska | Lease | |||
| July 2008 |
Leawood | Kansas | Lease | |||
| November 2008 |
Lincolnshire | Illinois | Lease | |||
| February 2009 |
Baltimore | Maryland | Lease | |||
| June 2010 |
Seattle | Washington | Lease | |||
| (1) | Current lease term expires September 30, 2013, but can be renewed at our election for an additional five year term with advance written notice. |
| (2) | Current lease term expires October 31, 2013, but can be renewed at our election for an additional five year term with advance written notice. |
| (3) | Current lease term expires November 30, 2013, but can be renewed at our election for an additional five year term with advance written notice. |
| (4) | Current lease term expires August 31, 2014, but can be renewed at our election for an additional five year term with advance written notice. |
77
Table of Contents
Restaurant Operations and Management
Our restaurants have a distinctive combination of food, atmosphere and service in an upscale environment. We believe that our success reflects the consistency of our execution across all aspects of the dining experience, from the formulation of proprietary recipes, to the procurement and presentation of high quality menu items and the delivery of a positive customer experience. We strive to provide quality through a carefully controlled and established supply chain and proven preparation techniques.
Depending on the volume of each restaurant, our typical restaurant-level management team consists of one general manager, two to four assistant managers, one executive chef and two sous chefs. We also have an experienced team of regional managers to oversee operations at multiple restaurants. Each of our regional and general managers is broadly trained across Del Frisco’s, Sullivan’s and the Grille allowing us the flexibility to move appropriate managers into various positions within the organization. To ensure that each restaurant and its employees meet our demanding performance requirements, we have developed a set of strict operational standards that are followed in all facets of our operations. For example, these standards are used to develop corporate recipes, many of which are proprietary, that are adhered to across all of our restaurants. These standards also mandate a quality control process for the menu items in each of our restaurants our chefs and managers oversee before each shift. This quality control process includes the full preparation of each item on our menu, other than our steaks, and the testing of each of these items for presentation, taste, portion size and temperature before they are prepared for our customers. Items that do not meet our rigorous standards are re-made until they do. We believe this process of full preparation for testing differentiates us from our competition.
The consistent execution at our restaurants is a result of the extensive training and supervision of our employees. Our general managers are required to undergo eight to 10 weeks of initial training in food quality, customer service, alcohol beverage service, liquor liability avoidance and employee retention programs. Each of our new hourly employees also typically participates in a training program during which the employee works under the close supervision of his or her general manager. Our chefs and their assistants receive extensive training in food quality, food supply management and kitchen maintenance. All of our employees are trained to uphold each concept’s distinct characteristics and our overall values and operating philosophy.
Our training programs are administered by the general manager at each restaurant and supervised by our vice president of people and education, director of new restaurant openings and a dedicated training director for each concept. This training team ensures that all new general managers have developed a comprehensive set of tools that they can use to manage their restaurant, including employee selection, performance management and wage and hourly compliance. We also require each general manager to obtain a mandatory internal certification in areas of the kitchen, dining room and bar area. Our training team also supports new restaurant openings. Del Frisco’s, Sullivan’s and the Grille have developed a streamlined training program that ensures employees opening a new restaurant function as a cohesive team and maintain our high operational and food preparation standards. As a result our corporate and concept-level infrastructure supports our growth strategy, allowing us to successfully replicate our standards in new restaurants.
Sourcing and Supply Chain
Our ability to maintain the consistent quality of our restaurants depends in part on our ability to procure food and other supplies from reliable sources in accordance with the specifications for all food products established by our corporate executive chef. We continually
78
Table of Contents
research and evaluate products and supplies to ensure high quality meat, seafood and other menu ingredients. Our executive corporate chef works with U.S. Foodservice, our beef distributor, for all beef purchases on a national level. We have also engaged a corporate purchasing consultant who negotiates directly with suppliers of meat, seafood and certain other food and beverage products to ensure consistent quality and freshness and to obtain competitive prices for items purchased nationally for each concept. Our strong relationships with national and regional foodservice distributors ensure that our restaurants receive a constant supply of products. Products are shipped directly to the restaurants, although invoices are sent to corporate headquarters for payment. We do not maintain a central product warehouse or commissary.
Our corporate chef and our purchasing consultant also establish strict product specifications for those items purchased at the local level. We ensure competitive pricing for such supplies by requiring each restaurant’s chef to obtain at least three prices for each locally sourced product from suppliers approved by the corporate purchasing consultant and submit these bids to their regional chef on a weekly basis. Pricing is then compared weekly on a national basis to ensure management for each restaurant has the most up-to-date information to help with procurement. Purchasing at each restaurant is directed primarily by each restaurant’s chef, who is trained in our purchasing philosophy and specifications, and who works with regional and corporate managers to ensure consistent products. Each of our restaurants also has an in-house sommelier responsible for purchasing wines based on customer preferences, market availability and menu content.
We have not experienced any significant delays in receiving restaurant supplies and equipment. Although we currently do not engage in futures contracts or other financial risk management strategies with respect to potential price fluctuations, from time to time, we may opportunistically enter into fixed price beef supply contracts or contracts for other food products or consider other risk management strategies with regard to our meat and other food costs to minimize the impact of potential price fluctuations. This practice could help stabilize our food costs during times of fluctuating prices, although there can be no assurances that this will occur.
Marketing and Advertising
We believe that our commitment to providing quality food, hospitality, service and a high level of value for each price point is an effective approach to attracting customers and maintaining their loyalty. We use a variety of national, regional and local marketing and public relations techniques intended to maintain and build our customer traffic, maintain and enhance our concepts’ images and continually improve and refine our upscale experience. For example, in 2010, we initiated a loyalty program that provides credit and other rewards to our customers based on dollars spent at our restaurants. In addition, local restaurant marketing is important to the success of our concepts. For example, each restaurant’s general manager cultivates relationships with local businesses and luxury hotels that drive the restaurant’s business, in particular its private dining business. We also work with a national public relations firm that coordinates local firms in connection with new restaurant openings.
Del Frisco’s, Sullivan’s and the Grille each use specific marketing and advertising initiatives to position the concepts in the applicable segment of our industry, including ad placement in magazines targeting the affluent segment of the population. We are currently reviewing our marketing and advertising strategy, and in the future anticipate focusing our advertising expenditures on travel-related magazines while continuing to advertise in specialty magazines that appeal to our target demographics and in select local publications.
79
Table of Contents
Competition
The full-service steak industry and general upscale restaurant businesses are highly competitive and fragmented, and the number, size and strength of competitors vary widely by region, especially within the general upscale restaurant segment. We believe restaurant competition is based on quality of food products, customer service, reputation, restaurant décor, location, name recognition and price. Depending on the specific concept, our restaurants compete with a number of restaurants within their markets, both locally-owned restaurants and restaurants that are part of regional or national chains. The principal competitors for our Del Frisco’s and Sullivan’s concepts are other upscale steakhouse chains such as Fleming’s Prime Steakhouse and Wine Bar, The Capital Grille, Smith & Wollensky, The Palm, Ruth’s Chris Steak House and Morton’s The Steakhouse. The principal competitors for our Grille concept also include other upscale chains such as Hillstone and Seasons 52. Our concepts also compete with additional restaurants in the broader upscale dining segment.
Seasonality
Our business is subject to seasonal fluctuations comparable to most restaurants. Historically, like other restaurants in our segment, the percentage of our annual revenues earned during the first and fourth fiscal quarters has been typically higher due to holiday traffic, increased gift card purchases and redemptions and increased private dining during the year-end holiday season. There is also an extra period in our fourth quarter.
Intellectual Property
We have registered the names Del Frisco’s, Double Eagle Steak House, Sullivan’s, and Del Frisco’s Grille and have applications pending to register certain other names and logos as trade names, trademarks or service marks with the United States Patent and Trademark Office and in certain foreign countries. We have the exclusive right for use of these trademarks throughout the United States, other than with respect to the following. An unrelated third party that operates a restaurant in Louisville, Kentucky has an indefinite right to use a specific registration of the Del Frisco’s name in Jefferson and Fayette Counties in Kentucky, Marion County in Indiana and Hamilton County in Ohio pursuant to a concurrent use agreement. We also agreed not to use the specific registration of the Del Frisco’s name or grant others the right to use it within 50 miles of any restaurant operated by the third party in the territory. The third party has paid us aggregate fees of $52,500. A separate, unrelated third party that operates a restaurant in Orlando, Florida had an exclusive license to use the Del Frisco’s name in Orange, Seminole and Ocala Counties through June 1, 2013 pursuant to a license agreement with no option to renew. We also agreed not to open a Del Frisco’s, Sullivan’s or Grille before January 1, 2015 in Orange, Seminole and Ocala Counties. The licensee paid us a one-time fee of $38,000 upon the execution of the agreement in 1993 and a monthly fee of 3% of its total gross sales less any sales tax through December 31, 2011. We do not have any right to any future or recurring payments from or have any affirmative payment obligations to either third party. Each third party is responsible for all costs associated with running its respective location, including all commodity and labor costs and any risks related thereto. We are also aware of names similar to those of our restaurants used by various third parties in certain limited geographical areas. We believe that our trade names, trademarks and service marks are valuable to the operation of our restaurants and are important to our marketing strategy.
80
Table of Contents
Employees
As of June 11, 2013, we had 3,550 employees. Many of our hourly employees are employed on a part-time basis to provide services necessary during peak periods of restaurant operations. None of our employees is covered by a collective bargaining agreement. We believe that we have good relations with our employees.
Government Regulation
Our restaurants are subject to licensing and regulation by state and local health, safety, fire and other authorities, including licensing and regulation requirements for the sale of alcoholic beverages and food. We maintain the necessary restaurant, alcoholic beverage and retail licenses, permits and approvals. The development and construction of additional restaurants will also be subject to compliance with applicable zoning, land use and environmental regulations. Federal and state labor laws govern our relationship with our employees and affect operating costs. These laws regulate, among other things, minimum wage, overtime, tips, tip credits, unemployment tax rates, workers’ compensation rates, citizenship requirements and other working conditions. Our restaurants are subject in each state in which we operate to “dram shop” laws, which allow, in general, a person to sue us if that person was injured by an intoxicated person who was wrongfully served alcoholic beverages at one of our restaurants. A judgment against us under a dram shop law could exceed our liability insurance coverage policy limits and could result in substantial liability for us and have a material adverse effect on our results of operations. Our inability to continue to obtain such insurance coverage at reasonable costs also could have a material adverse effect on us. We are also subject to the Federal Americans with Disabilities Act, which prohibits discrimination on the basis of disability in public accommodations and employment.
Legal Proceedings
We are subject to various claims and legal actions, including class actions, arising in the ordinary course of business from time to time, including claims related to food quality, personal injury, contract matters, health, wage and employment and other issues. While it is impossible at this time to determine with certainty the ultimate outcome of these proceedings, lawsuits and claims, management believes that adequate provisions have been made and that the ultimate outcomes will not have a material adverse effect on our financial position.
81
Table of Contents
Executive Officers and Directors
The following table sets forth certain information regarding our board of directors, our executive officers and certain of our key employees, as of the date of this prospectus.
| Name |
Age | Position | ||||
| Mark S. Mednansky |
56 | Chief Executive Officer; Director | ||||
| Thomas J. Pennison, Jr. |
45 | Chief Financial Officer | ||||
| Jeffrey F. Carcara |
43 | Chief Operating Officer | ||||
| Thomas G. Dritsas |
42 | Vice President of Culinary & Corporate Executive Chef | ||||
| James W. Kirkpatrick |
59 | Vice President of Real Estate | ||||
| Lisa H. Kislak |
54 | Vice President of Brand Marketing | ||||
| William S. Martens |
41 | Vice President of Development & Construction | ||||
| April L. Scopa |
46 | Vice President of People and Education | ||||
| Norman J. Abdallah |
50 | Director | ||||
| David B. Barr |
50 | Director | ||||
| Bradley P. Boggess |
40 | Director | ||||
| Jodi L. Cason |
39 | Director | ||||
| Richard L. Davis |
60 | Director | ||||
| John R. Kinzer |
45 | Director | ||||
| Jeffrey B. Ulmer |
50 | Director | ||||
| Samuel D. Loughlin |
41 | Chairman of the Board; Director | ||||
Executive Officers and Key Employees
Mark S. Mednansky has served as Chief Executive Officer since March 2007 and has served as a member of our board of directors since July 2012. Prior to becoming our Chief Executive Officer in connection with the Acquisition, Mr. Mednansky served in senior management roles with Lone Star Steakhouse & Saloon, Inc. From 2005 until March 2007, Mr. Mednansky was the Chief Operating Officer of several Lone Star Steakhouse & Saloon restaurant concepts, including Del Frisco’s and Sullivan’s. Mr. Mednansky also served as Vice President of Operations of the Del Frisco’s and Sullivan’s concepts from 2000 to 2005 and President of the Texas Land & Cattle concept from 2003 to 2006. Mr. Mednansky has over 35 years of restaurant industry experience and 25 years of experience as a senior operations manager. Prior to joining Lone Star Steakhouse & Saloon, Inc., he was Director of Operations for Big Four Restaurants from 1997 to 1998, Director of Culinary Services for Dial Corp. from 1990 to 1997 and Area Manager for Big Four Restaurants from 1985 to 1990.
As our Chief Executive Officer, Mr. Mednansky brings a deep understanding of the Company’s business, industry, operations and strategic plan to the board of directors. Mr. Mednansky also has extensive institutional knowledge gained through his more than 12 years of experience with the Del Frisco’s and Sullivan’s concepts. In addition, Mr. Mednansky’s other senior leadership and restaurant experience enables him to provide valuable insight and guidance to the board on our industry as a whole. Mr. Mednansky’s board service also provides a direct open channel of communication between the board and senior management.
Thomas J. Pennison, Jr. has served as Chief Financial Officer since November 2011. Prior to joining our company Mr. Pennison served as Chief Financial Officer for iSeatz Inc., a customized software technology company primarily serving the travel and leisure industry, from 2009 to 2011. Mr. Pennison also operated his own financial consulting firm in Louisiana from 2008 to
82
Table of Contents
2009 where he provided financial and business consulting services to clients in the hospitality and other consumer and retail related industries. Prior to that, Mr. Pennison spent 12 years at Ruth’s Hospitality Group, Inc., a restaurant company focused exclusively on the upscale dining segment, formerly known as Ruth’s Chris Steak House, Inc., from 1996 to 2008 serving in various capacities, including Senior Vice President and Chief Financial Officer. Additionally, from 1994 to 1996, Mr. Pennison served as Assistant Corporate Controller of Casino Magic Corp., with primary responsibilities for corporate finance and SEC reporting, and from 1991 to 1994, Mr. Pennison was at the public accounting firm KPMG LLP. Mr. Pennison is a member of the Financial Executive Institute and the Louisiana Society of Certified Public Accountants.
Jeffrey F. Carcara has served as Chief Operating Officer since November 2012. Prior to joining our company, Mr. Carcara served as senior director of operations for Seasons 52, a restaurant concept within Darden’s Specialty Restaurant Group, from 2004 to November 2012. While at Darden, Mr. Carcara was responsible for the operations and financial results of the Seasons 52 concept, led a team of direct reports including five regional directors, designed an opening and training process, and created a talent management program. From 2003 to 2004, Mr. Carcara served as corporate director of food and beverage for the Kessler Collection Hotels where he led implementation of department upgrades, re-branded and created several hotel restaurants, and implemented a nationwide purchasing program. Earlier in his career, Mr. Carcara served in various positions with Houston’s, part of the Hillstone Restaurant Group, and Darden’s Bahama Breeze restaurant concept.
Thomas G. Dritsas has served as Vice President of Culinary & Corporate Executive Chef since December 2006 and oversees the day to day culinary operations of Del Frisco’s, Sullivan’s and the Grille. From 2003 to 2006, Mr. Dritsas served as Corporate Executive Chef for Lone Star Steakhouse & Saloon, Inc., during which time he oversaw the daily culinary operations for each of its concepts. Mr. Dritsas joined Lone Star Steakhouse & Saloon, Inc. in 1999 and served in various culinary capacities, including as part of new opening teams. Prior to joining Lone Star Steakhouse & Saloon, Mr. Dritsas assisted in the opening of numerous independent restaurants and operated his own restaurant.
James W. Kirkpatrick has served as Vice President of Real Estate since February 2012 and oversees real estate matters for our three concepts, including strategic development and lease administration. Prior to joining our company, Mr. Kirkpatrick served as the Senior Vice President of Development for Morton’s Restaurant Group, Inc., an operator of company-owned upscale steakhouses, from 2006 to 2012, where he managed all aspects of development including real-estate strategic development to lease administration. Prior to Morton’s, Mr. Kirkpatrick worked in several leadership roles with Applebee’s International, Inc. from 1999 to 2006, including Senior Director of Real Estate and Vice President of Real Estate & Construction. Mr. Kirkpatrick has also held a variety of other positions focused on real estate development with a number of other companies in the restaurant industry including Houlihan’s Restaurants, Inc., TGI Friday’s and Pizza Hut, Inc.
Lisa H. Kislak has served as Vice President of Brand Marketing since February 2012 and is responsible for all aspects of marketing for Del Frisco’s, Sullivan’s and the Grille. Prior to joining our company, Ms. Kislak was the Vice President of Marketing for The Picture People, a privately held company with more than 170 company-owned portrait studios in 34 states, where she managed the company’s marketing activities. Before that, Ms. Kislak served as a Principal for Premium Knowledge Group, a firm specializing in luxury lifestyle marketing, from 2007 to 2010. Ms. Kislak started her career with Four Seasons Hotels and Resorts where she held various marketing roles over a 13-year period, including Vice President of Brand and Relationship Marketing with Wyndham Hotels, Vice President of Sales and Marketing for Rosewood Hotels & Resorts and Senior Vice President of Marketing for ClubCorp.
83
Table of Contents
William S. Martens has served as Vice President of Development & Construction since 2011 and is responsible for market planning, site selection, site acquisition and construction for our three concepts. Mr. Martens also oversees concept design, portfolio management and facilities operations. Mr. Martens has been with us since 2008, previously serving as our Director of Development where he managed all facets of new unit development and established the infrastructure to support our growth in new and existing markets. Before joining our company, Mr. Martens served as Vice President of Portfolio Management with Hudson Americas, LLC, an affiliate of ours and Lone Star Fund, from 2007 to 2008. Prior to Hudson Americas, Mr. Martens spent nine years with Yum! Brands, where he held multiple leadership roles in Finance and Development, including the position of Senior Manager of Development. In this role, he worked with senior brand leadership teams to develop market plans, define asset strategies and make capital appropriations decisions for approximately 350 new restaurants annually.
April L. Scopa has served as Vice President of People and Education since June 2011 and is responsible for recruiting, human resources, talent development and training strategy. Prior to joining our company, Ms. Scopa worked with Landmark Leisure Group, a national leader in entertainment development since June 2010 and served as VP of People & Development, beginning in January 2011, where she led the HR, recruiting, new store opening development, employee relations, talent management and personnel development strategy. Prior to Landmark, Ms. Scopa spent eight years with The Capital Grille, an upscale steakhouse division of Darden Restaurants, as Director of Operations and Senior Director of Training, where her responsibilities most recently included quality of operations, people and P&L results for six locations. Prior to The Capital Grille, Ms. Scopa also worked for C.A. Muer Corporation and LongHorn Steakhouse, both in a training and operations capacity.
Directors
Norman J. Abdallah has served as a member of our board of directors since July 2012. Mr. Abdallah served as a member of our Advisory Board from March 2011 to July 2012. Mr. Abdallah has served as the Chief Executive Officer of Dinosaur Bar-B-Que, a privately-held restaurant concept, since March 2013. Mr. Abdallah also served as the Chief Executive Officer of Romano’s Macaroni Grill, a privately-held restaurant concept, from 2010 to 2013. Mr. Abdallah has also served as a member of the Board of Directors of California Pizza Kitchen, Inc. and Dinosaur Bar-B-Que since 2011 and March 2013, respectively. Prior to joining Romano’s Macaroni Grill, Mr. Abdallah served as Chief Executive Officer of Restaurants Unlimited Inc., a privately-held multi-concept restaurant company, from 2009 to 2010. Prior to joining Restaurants Unlimited, Mr. Abdallah served as the Chief Executive Officer and Co-Founder of Fired Up, Inc., the parent company of U.S.-based casual dining concept Carino’s Italian, from 1997 to 2008.
Mr. Abdallah brings extensive knowledge of the restaurant industry to the board of directors from his experience with a number of national restaurant concepts. In addition, Mr. Abdallah’s service as a chief executive officer of various other restaurant holding companies contributes valuable management experience to the board’s collective knowledge. His prior service on the Company’s Advisory Board also provides Mr. Abdallah with a working knowledge of the Company’s business and operations.
David B. Barr has served as a member of our board of directors since July 2012. Mr. Barr served as a member of our Advisory Board from 2008 to July 2012. Mr. Barr has been the Chairman of the board of directors of PMTD Restaurants LLC and its affiliates, a franchisee of KFC since 1998. Mr. Barr has also been Chairman of the board of directors of Rita Restaurant Corp., the owner and operator of Don Pablo’s Mexican Restaurants and Hops Grill and Brewery
84
Table of Contents
since 2008, in addition to having served on the board of the prior owner. Mr. Barr also serves on the boards of directors of Mrs. Fields Original Cookies, Inc. (owner of the Ms. Fields and TCBY brands), and Charles & Colvard Ltd., and was previously the Chairman of the board of directors of Samuels Jewelers, Inc. from 2000 to 2006. From 1994 to 2008, Mr. Barr served as the Chief Financial Officer and then Chief Executive Officer of the Great American Cookie Company, a franchisor and operator of cookie stores. Mr. Barr began his career with Price Waterhouse in 1986 where he worked until 1991 when he left to join the finance department of Pizza Hut, Inc. Mr. Barr was a licensed certified public accountant in the State of Georgia and a member of the American Institute of Certified Public Accountants from 1991 to 2003. Mr. Barr currently sits on the board of directors of International Franchise Association and the advisory board of the McIntire School of Commerce at the University of Virginia.
Mr. Barr brings extensive knowledge of the restaurant industry to the board of directors from his experience with a number of restaurant and retail concepts. His board service for various companies, including as chairman, provides valuable insight to the board regarding the dynamics and interactions of a board of directors. Mr. Barr’s financial background assists the board in understanding their responsibilities for our public company reporting of financial information. His prior service on the Company’s Advisory Board also provides Mr. Barr with working knowledge of the Company’s business and operations.
Bradley P. Boggess has served as a member of our board of directors since December 2012. Mr. Boggess has been a Director of Hudson Americas, LLC, an affiliate of ours, and Lone Star Fund since June 2011. His responsibilities include identifying investment opportunities, managing acquisition processes, and driving portfolio company performance. Mr. Boggess’s asset management responsibilities include Lone Star’s grocery and restaurant assets. Prior to joining Hudson Americas, Mr. Boggess worked as a turnaround and restructuring advisor with AlixPartners, a leading management consulting and turnaround services firm, from May 2007 to June 2011. Mr. Boggess is a former Armor Officer in the United States Army.
Mr. Boggess’ background as a management consultant, turnaround advisor and private equity executive in a wide range of industries, including the retail industry, allows him to assist the board in understanding and addressing the wide variety of issues it faces. His responsibilities for Lone Star Fund’s restaurant companies, including our company, also provide Mr. Boggess with a working knowledge of our business and operations.
Jodi L. Cason has served as a member of our board of directors since July 2012. Ms. Cason is the Senior Vice President of Corporate Finance and Investor Reporting for Hudson Advisors, LLC, an affiliate of ours and Lone Star Fund. Ms. Cason has worked for Hudson Advisors since 2000. Her responsibilities include the oversight of, and global coordination for, the financial reporting requirements of the Limited Partners, General Partner and Co-investment Partners of Lone Star Fund, including Hudson Advisors and its subsidiaries. Prior to 2000, Ms. Cason worked in the Investor Relations group of Lone Star Fund, focusing on the analysis of, and reporting on, the trends and projections of cash flows impacting both the Limited Partners and General Partner of Lone Star Fund. She began her career at KPMG in the Assurance Services group.
Ms. Cason’s background and extensive expertise in financial markets, financing and other funding operations provides the board of directors with insight regarding investing, accounting and other financial reporting matters. Her tenure at KPMG assists the board in taking responsibility for our public company reporting of financial information.
Richard L. Davis has served as a member of our board of directors since July 2012. Mr. Davis served as a member of our Advisory Board from 2011 to July 2012. Mr. Davis has also
85
Table of Contents
served as a member of the board of directors of Bi-Lo Holdings, LLC, a 207-unit grocery company also controlled by Lone Star Fund, since 2011. Mr. Davis’ 40 year business career has been devoted to managing and developing various businesses in retail, printing services and the restaurant and entertainment industries. Mr. Davis was the founder and owner of Main Street Crossing, a restaurant and live entertainment venue, JoeAuto, a chain of auto repair shops, Extreme Logic, a software training company and Night-Rider Overnight Copy Service, a printing business. Mr. Davis was the CEO of CCG Venture Partners from 1992 to 2010 and served in an advisory board capacity in 2011 for Del Frisco’s.
Mr. Davis’ extensive experience in business development across a wide range of industries allows him to provide insight to the board of directors regarding developing and implementing strategies for growing our business. His prior service on the Company’s Advisory Board also provides Mr. Davis with working knowledge of the Company’s business and operations.
John R. Kinzer has served as a member of our board of directors since July 2012. Mr. Kinzer has been a Director of Hudson Americas, LLC, an affiliate of ours, and Lone Star Fund since October 2008. Mr. Kinzer is responsible for a number of real estate and growth initiatives across Lone Star Fund’s investments. Prior to joining Hudson, Mr. Kinzer served as Chief Investment Officer for Provident Realty Advisors, a privately-held owner, developer and manager of a broad range of real estate assets, from December 2006 to October 2008 and was responsible for operations, capital markets and finance for both the real estate and the oil and gas platforms. Prior to joining Provident, Mr. Kinzer served as the Director of Acquisitions for Milestone Group, a real estate investment advisor, from March 2005 to December 2006, where he had responsibility for acquisitions and capital markets activities. From 2000 to 2004, Mr. Kinzer was a Partner with TriVest Residential and acted as the company’s Chief Investment Officer. Prior to his tenure with TriVest, Mr. Kinzer was a Senior Acquisition Manager for the Archon Group in Dallas, Texas. Prior to Archon, Mr. Kinzer also served in various capacities for the Archon Group, JPI Development and the J.E. Robert Companies.
Mr. Kinzer brings broad experience in both finance and asset management to the board of directors. His involvement with Lone Star Fund’s restaurant companies, including our company, also provides Mr. Kinzer with a working knowledge of our business and operations. Mr. Kinzer also has extensive experience in real estate matters, which are a significant aspect of our business and growth prospects for the future.
Jeffrey B. Ulmer has served as a member of our board of directors since December 2012. Mr. Ulmer has served as a Managing Director of Hudson Advisors, LLC, an affiliate of ours, and Lone Star Fund since February 2012. His responsibilities include portfolio management for the Corporate investment platform. Prior to joining Hudson, from April 2006 to February 2012, Mr. Ulmer was associated with CIT Group Inc., where he established a global centralized workout group in response to federal regulatory demands to address over $4 billion of stressed investments. Prior to working with CIT, Mr. Ulmer was employed by GE Capital, where he held a variety of senior capital markets, risk, and credit roles, from 2000 to 2005.
Mr. Ulmer brings more than 25 years of experience in corporate valuation, underwriting and asset management, and brings specific expertise in retail and franchise finance. His extensive capital markets experience also allows him to make valuable contributions with respect to our capital structure and financing and investing activities. This experience is also helpful in forming and maintaining relationships with investors.
Samuel D. Loughlin has served as a director and Chairman of the Board since July 2012. Mr. Loughlin is currently a Managing Director of Lone Star U.S. Acquisitions, LLC, an affiliate of
86
Table of Contents
ours and Lone Star Fund, where he focuses on originations initiatives. Previously, from 2008 to 2011, he served in various capacities at Hudson Americas, LLC, an affiliate of ours and Lone Star Fund, with responsibility for its retail and restaurant operating companies, in addition to leading teams in special originations initiatives. Mr. Loughlin joined Hudson Americas in 2008 and focused on asset management, origination and monetization strategies of a number of assets. Mr. Loughlin has more than 13 years of finance and legal experience, including mergers and acquisitions, financing, private equity investment, originations and asset management transactions. Prior to joining Hudson Americas, Mr. Loughlin was a Partner of CCG Venture Partners, a private equity firm with real estate, operating company and securities holdings, where he was responsible for legal oversight, deal structuring, asset evaluation, acquisitions and sales. Previously, Mr. Loughlin was an attorney in the Business and Corporate Securities Group at Vinson & Elkins LLP, where he supported clients in venture capital and mezzanine financing transactions, private and public securities offerings, mergers and acquisitions, management buyouts and debt financing transactions.
Mr. Loughlin has significant experience with the strategic, financial and operational requirements facing companies in the restaurant and related industries, allowing him to guide the board in analyzing, shaping, and overseeing our execution of important operational and policy issues. His responsibilities for Lone Star Fund’s restaurant companies, including our company, also provide Mr. Loughlin with a working knowledge of our business and operations.
There are no family relationships among any of our directors or executive officers.
Management Compensation
Equity-Based Arrangements. In connection with our initial public offering, we adopted the Del Frisco Restaurant Group 2012 Long-Term Incentive Plan, or the 2012 Plan, which is a long-term equity incentive plan for employees, officers, non-employee directors and other service providers. The 2012 Plan is designed to promote our interests by providing eligible persons with the opportunity to share in appreciation of our stock resulting from our performance. We have reserved 2,232,800 shares of our common stock for issuance under the equity incentive plan. Of these 2,232,800 shares reserved for issuance, we granted options for the issuance of 745,000 shares at the time of the pricing of our initial public offering with an exercise price of $13.00 per share, the initial public offering price. Subsequent to the grants made in connection with our initial public offering, we have granted options to purchase an additional 152,000 shares of common stock under the 2012 Plan. Certain of our executive officers also hold Class B and Class C interests in our direct parent, LSF5 Wagon Holdings, LLC, or Wagon, which are described below under “Narrative to Summary Compensation Table—Payments in Connection with Our Initial Public Offering and this Offering.”
Incentive-Based Arrangements. We currently maintain the Del Frisco’s Restaurant Group Management Bonus Plan, which provides general managers, salaried managers, sous chefs, and executive chefs with bonus payments based on actual restaurant-level financial results.
We also currently maintain an annual cash incentive bonus program for certain corporate-level employees of the Company and its subsidiaries, including our named executive officers (as defined under “Executive Compensation” below). Under this policy, all participants are potentially eligible to receive an annual performance-based bonus equal to a target percentage of their annual salary, based upon their corresponding level of individual responsibility within the organization. Whether an individual’s target is achieved depends upon whether various financial performance metrics tied to each individual’s responsibilities (such as EBITDA, revenue, food costs, etc.) are satisfied. Our compensation committee approves the performance
87
Table of Contents
criteria and level of achievement versus these criteria that will determine the amount payable under any incentive bonus. Our Chief Executive Officer, Mark S. Mednansky, may then recommend a discretionary upward or downward adjustment to each individual’s target bonus (other than his own) based upon such individual’s overall performance and contributions for the year. Mr. Mednansky’s recommendations are reviewed by our compensation committee, who retains final discretion in determining the amount of any bonuses actually paid. For additional information on our bonus program, see “Narrative to Summary Compensation Table—Equity Incentive Plan Awards” below.
Director Compensation
Following the completion of our initial public offering, we began to pay an annual retainer of $15,000 per year to each independent director for his or her services, with an additional $15,000 annual fee for service as the chairperson of the board or any of the board’s committees. For 2012, these fees were pro-rated from July 26, 2012, the date of our initial public offering, to the end of our 2012 fiscal year. We also pay our independent directors an additional fee of $1,500 for each meeting attended in person and $250 for each meeting attended telephonically. Upon the consummation of our initial public offering, each of our independent directors also received an option to purchase 18,000 shares of our common stock, vesting in four equal installments from the first anniversary of the date of grant.
Our non-independent directors, other than Mr. Mednansky, did not receive any compensation for their services to the Company. Mr. Mednansky did not receive any compensation for his services as a director. However, his compensation for services rendered as our Chief Executive Officer is disclosed in the Summary Compensation table below.
Director Compensation Table
The following table sets forth information concerning the compensation of our independent directors for the fiscal year ended December 25, 2012.
| Name |
Fees earned or paid in cash ($)(1) |
Option Awards ($)(2) |
All other Compensation($)(3) |
Total($) | ||||||||||||
| Norman J. Abdallah |
12,000 | 86,760 | 1,500 | 100,260 | ||||||||||||
| David B. Barr |
19,500 | 86,760 | 48,750 | 155,010 | ||||||||||||
| Richard L. Davis |
12,250 | 86,760 | 23,000 | 122,010 | ||||||||||||
| (1) | These amounts represent all meeting attendance fees and the pro-rated annual retainer earned by each director after our initial public offering as well as Mr. Barr’s pro-rated annual fee for his service as the chairman of our audit committee, |
| (2) | These amounts represent the aggregate grant date fair value, calculated in accordance with FASB ASC Topic 718, for options awarded in 2012 to our independent directors. See note 15 in the notes to our consolidated financial statements for the year ended December 25, 2012 included in our Annual Report on form 10-K filed with the Securities and Exchange Commission on February 26, 2013. Each independent director was granted an option to purchase 18,000 shares at an exercise price of $13 per share, vesting in four equal installments on each of July 26, 2013, July 26, 2014, July 26, 2015 and July 26, 2016. As of December 25, 2012, all of these grants remained unvested and outstanding. |
| (3) | These amounts reflect the aggregate fees earned for services on our Advisory Board prior to the date of our initial public offering. |
Board of Directors
Our certificate of incorporation provides that our board of directors is divided into three classes of directors, with the classes to be as nearly equal in number as possible. The members of each class serve for a three-year term. As a result, one-third of our board of directors are
elected each year. Messrs. Boggess, Ulmer and Loughlin are class I directors, up for election in
88
Table of Contents
2016, Ms. Cason and Messrs. Barr and Kinzer are class II directors, up for election in 2014, and Messrs. Abdallah, Davis and Mednansky are class III directors, up for election in 2015.
Our board of directors has established an audit committee, a compensation committee and a nominating and corporate governance committee, each of which operates pursuant to a charter that was adopted by our board of directors. The composition and functioning of all of our committees comply with all applicable requirements of the Sarbanes-Oxley Act of 2002, the SEC rules and regulations and the NASDAQ rules.
Because Lone Star Fund beneficially owns a majority of our voting power, we are currently a “controlled company” within the meaning of the NASDAQ corporate governance rules. Accordingly, we have availed ourselves of the “controlled company” exception available under the NASDAQ rules which eliminates certain requirements, such as the requirements that a company have a majority of independent directors on its board of directors, that compensation of the executive officers be determined, or recommended to the board of directors for determination, by a majority of the independent directors or a compensation committee comprised solely of independent directors, and that director nominees be selected, or recommended for the board of directors’ selection, by a majority of the independent directors or a nominations committee comprised solely of independent directors. These exemptions do not modify the independence requirements for our audit committee, and we are in compliance with the applicable requirements of the SEC and the NASDAQ rules with respect to our audit committee.
Immediately after this offering, Lone Star Fund will beneficially own 34.0% (or 30.9% if the underwriters fully exercise their option to purchase additional shares) of our voting power and we will no longer qualify as a “controlled company” within the meaning of the NASDAQ corporate governance rules. Therefore, intend to comply with the applicable transition requirements, including the requirement to have a majority of independent directors and fully-independent compensation and nominating and corporate governance committees within one year of the completion of this offering.
Audit Committee
The primary responsibilities of our audit committee are to oversee the accounting and financial reporting processes of our company as well as our subsidiary companies, and to oversee the internal and external audit processes. The audit committee also assists the board of directors in fulfilling its oversight responsibilities by reviewing the financial information provided to stockholders and others, and the system of internal controls established by management and the board of directors. The audit committee oversees the independent auditors, including their independence and objectivity. However, the committee members do not act as professional accountants or auditors, and their functions are not intended to duplicate or substitute for the activities of management and the independent auditors. The audit committee is empowered to retain independent legal counsel and other advisors as it deems necessary or appropriate to assist it in fulfilling its responsibilities, and to approve the fees and other retention terms of the advisors.
The audit committee is comprised of three members, Messrs. Abdallah, Barr and Davis, with Mr. Barr serving as chair. Our board of directors has determined that each member of the audit committee is independent, as defined under and required by the federal securities laws and the NASDAQ rules. Our board of directors has determined that Mr. Barr qualifies as an audit committee financial expert under the federal securities laws and that each member of the audit committee has the financial sophistication required under NASDAQ rules.
89
Table of Contents
Compensation Committee
The primary responsibilities of our compensation committee are to periodically review and approve the compensation and other benefits for our employees, officers and independent directors. This includes reviewing and approving corporate goals and objectives relevant to the compensation of our executive officers in light of those goals and objectives, and setting compensation for these officers based on those evaluations. Our compensation committee also administers and has discretionary authority over the issuance of stock awards under the 2012 Plan.
The compensation committee may delegate authority to review and approve the compensation of our employees to certain of our executive officers, including with respect to awards made under the 2012 Plan. Even where the compensation committee does not delegate authority, our executive officers will typically make recommendations to the compensation committee regarding compensation to be paid to our employees and the size of grants of stock option, restricted stock and other forms of stock-based compensation.
The compensation committee is comprised of three members, Messrs. Abdallah, Boggess and Ulmer, with Mr. Boggess serving as chair. For so long as we are a controlled company, we are not required to have a compensation committee comprised of independent directors under NASDAQ rules. The board has nonetheless determined that Mr. Abdallah is independent under NASDAQ rules. As required by the NASDAQ transition rules, a majority of the members of our compensation committee will be independent directors within 90 days of the completion of this offering and our compensation committee will be comprised entirely of independent directors within one year of the completion of this offering.
Nominating and Corporate Governance Committee
Our nominating and corporate governance committee oversees all aspects of our corporate governance functions. The committee makes recommendations to our board of directors regarding director candidates and assists our board of directors in determining the composition of our board of directors and its committees. The nominating and corporate governance committee is comprised of three members, Messrs. Davis, Kinzer and Loughlin, with Mr. Loughlin serving as chair. For so long as we are a controlled company, we are not required to have a nominating and governance committee comprised of independent directors under NASDAQ rules. The board has nonetheless determined that Mr. Davis is independent under NASDAQ rules. As required by the NASDAQ transition rules, a majority of the members of our nominating and corporate governance committee will be independent directors within 90 days of the completion of this offering and our nominating and corporate governance committee will be comprised entirely of independent directors within one year of the completion of this offering.
Code of Conduct and Ethics
Our board of directors adopted a code of conduct and ethics that establishes the standards of ethical conduct applicable to all directors, officers and employees of our company. The code addresses, among other things, conflicts of interest, compliance with disclosure controls and procedures and internal control over financial reporting, corporate opportunities and confidentiality requirements. The audit committee is responsible for applying and interpreting our code of conduct and ethics in situations where questions are presented to it.
Any amendment to, or waiver from, a provision of our code of conduct and ethics requiring disclosure under applicable rules with respect to our principal executive officer, principal
90
Table of Contents
financial officer, principal accounting officer or controller will be posted on our website at www.dfrg.com.
Compensation Committee Interlocks and Insider Participation
Our compensation committee is comprised of Messrs. Abdallah, Boggess and Ulmer. None of our executive officers currently serves or has served during the last completed fiscal year, as a member of the board of directors, or as a member of the compensation or similar committee, of any entity that has one or more executive officers who served on our board of directors. For a description of the transactions between us and members of the compensation committee, and entities affiliated with such members, see the transactions described under the section entitled “Certain Relationships and Related Party Transactions.”
91
Table of Contents
Overview
The compensation provided to our chief executive officer and our two other most highly compensated executive officers during fiscal 2012, or collectively, the named executive officers, is set forth in detail in the tables and narratives that follow this section.
Our named executive officers for fiscal 2012 were:
| • | Mark S. Mednansky, Chief Executive Officer; |
| • | Thomas J. Pennison, Jr., Chief Financial Officer; and |
| • | Thomas G. Dritsas, Corporate Executive Chef. |
The Company does not directly employ any individuals. All of our corporate-level employees, including our named executive officers are employed and compensated by Center Cut Hospitality, Inc., or CCH, a direct, wholly-owned subsidiary of the Company. Nevertheless, our board of directors has retained final oversight and responsibility with respect to the compensation provided to the employees of CCH. The compensation of our executive officers is determined by our compensation committee and approved by the board of directors.
Summary Compensation Table
The following table sets forth information regarding compensation earned by our named executive officers and paid by CCH during the fiscal years ended December 27, 2011 and December 25, 2012:
| Name and Principal Position |
Year | Salary ($) |
Bonus ($)(1) |
Option Awards ($)(2) |
Non-Equity Incentive Plan Compensation ($)(3) |
All Other Compensation ($)(4) |
Total ($) | |||||||||||||||||||||
| Mark S. Mednansky |
2012 | 400,000 | — | 918,210 | 200,000 | 997,486 | 2,515,696 | |||||||||||||||||||||
| Chief Executive Officer |
2011 | 400,000 | 200,000 | — | 200,000 | 80,840 | 880,840 | |||||||||||||||||||||
| Thomas J. Pennison, Jr. |
2012 | 250,000 | — | 409,700 | 125,000 | 516,027 | 1,300,727 | |||||||||||||||||||||
| Chief Financial Officer |
2011 | 35,577 | — | — | 17,170 | 7,210 | 59,957 | |||||||||||||||||||||
| Thomas G. Dritsas |
2012 | 202,448 | 15,426 | 72,300 | 79,574 | 70,759 | 440,507 | |||||||||||||||||||||
| Corporate Executive Chef |
2011 | 191,077 | 9,900 | — | 79,200 | 46,302 | 326,479 | |||||||||||||||||||||
| (1) | Amounts represent discretionary adjustments to the executive’s annual cash incentive bonus program payouts. |
| (2) | Amount represents the aggregate grant date fair value, calculated in accordance with Financial Accounting Standards Board Accounting Standards Codification Topic 718 (“FASB ASC Topic 718”), for awards of options. See note 15 in the notes to our consolidated financial statements for the year ended December 25, 2012 included in our Annual Report on form 10-K filed with the Securities and Exchange Commission on February 26, 2013. |
| (3) | Amount represents payments made under the Company’s annual cash incentive bonus program described in greater detail under “Narrative to Summary Compensation Table—Non-Equity Incentive Plan Awards.” |
| (4) | Individual breakdowns of amounts included in “All Other Compensation” for the fiscal year ended December 25, 2012 are as follows: |
| Name |
Company Matching Contributions to Deferred Compensation Plan ($) |
Health and Life Insurance Premiums ($) |
Car Benefits ($) |
Relocation Allowance ($) |
Transaction Bonus ($)(A) |
Total All Other Compensation ($) |
||||||||||||||||||
| Mark S. Mednansky |
59,231 | 17,991 | — | — | 920,264 | 997,486 | ||||||||||||||||||
| Thomas J. Pennison, Jr. |
12,287 | 11,146 | 12,462 | — | 480,132 | 516,027 | ||||||||||||||||||
| Thomas G. Dritsas |
28,748 | 11,196 | — | 30,815 | — | 70,759 | ||||||||||||||||||
| (A) | Amount represents transaction bonus payments made to Messrs. Mednansky and Pennison by Wagon, our controlling stockholder. See “Narrative to Summary Compensation Table—Payments in Connection with Our Initial Public Offering and this Offering.” |
92
Table of Contents
Narrative to Summary Compensation Table
Employee Agreements
All of our named executive officers have either an employment agreement or a letter agreement.
Mr. Mednansky
Pursuant to a February 7, 2011 employment agreement entered into between CCH and Mr. Mednansky, Mr. Mednansky’s annual base salary is set at $400,000. This salary is subject to review by the board of directors annually in the first quarter of each year and may be increased at the board’s discretion. In addition, pursuant to this employment agreement, Mr. Mednansky is entitled to participate in all bonus compensation plans, in accordance with the terms of such plans. The target level for his annual bonus is to be set at least 50% of his annual salary, but entitlement to any such bonus and the amount of any bonus actually paid to Mr. Mednansky is to be determined by the board in its good faith discretion. For each of 2011 and 2012, Mr. Mednansky’s target bonus level was set at 50% of his annual base salary. Mr. Mednansky’s ’s employment agreement also provides for certain perquisites, including an automobile allowance of up to $1,000 per month or use of a Company car, Company-paid medical and life insurance and reimbursement of relocation costs incurred in connection with his transfer to the Company’s headquarters in Southlake, Texas. In addition, Mr. Mednansky participates in the Company’s Transaction Bonus Plan, as further discussed below under “Payments in Connection with our Initial Public Offering and this Offering—Transaction Bonuses.”
Mr. Pennison
On October 17, 2011, Mr. Pennison entered into an employment agreement to serve as the Company’s Chief Financial Officer. Pursuant to the employment agreement, Mr. Pennison is entitled to a base salary of $250,000 and participation in the Company’s annual incentive plan, with a potential target bonus level set at 50% of his annual base salary, subject to achievement of various performance criteria, and further subject to the board’s discretion. Pursuant to his employment agreement, Mr. Pennison is entitled to certain other benefits, including Company-paid medical insurance, Company-paid life insurance in the amount of $1,000,000, an automobile allowance not to exceed $1,000 per month and reimbursement for up to $50,000 of relocation and temporary living expenses in connection with his relocation to Southlake, Texas. In addition, Mr. Pennison is entitled to participate in the Company’s Transaction Bonus Plan, as further discussed below under “—Payments in Connection with Our Initial Public Offering and this Offering—Transaction Bonuses.”
Mr. Dritsas
Effective January 4, 2012, Mr. Dritsas and CCH entered into an employment agreement. Under this agreement, Mr. Dritsas is entitled to an annual base salary of $198,000 per year. Following his year-end review, Mr. Mednansky recommended an increase in Mr. Dritsas’ base salary to $208,000, which the compensation committee approved effective November 21, 2012. He is also entitled to participate in all bonus compensation and stock plans which are specifically applicable to the Corporate Executive Chef. Accordingly, Mr. Dritsas participates in the Company’s annual bonus plan described below. For 2011 and 2012, Mr. Dritsas’ potential performance bonus targets were set at 40% of his annual salary. Although not provided pursuant to his written employment agreement, Mr. Dritsas is also entitled to an automobile allowance and Company-paid life and health insurance benefits similar to those provided to Messrs. Mednansky and Pennison. In addition, in 2012 Mr. Dritsas received $30,815 to cover relocation expenses incurred in connection with his move from North Carolina to Texas.
93
Table of Contents
Equity Incentive Plan Awards
Each of our named executive officers participated in our 2012 Plan during the fiscal year ended December 25, 2012. As described below in the Outstanding Equity Awards at 2012 Year End table, following our initial public offering, Mr. Mednansky was granted an option to purchase 190,500 shares, Mr. Pennison was granted an option to purchase 85,000 shares and Mr. Dritsas was granted an option to purchase 15,000 shares of our common stock. Each of these options has an exercise price of $13.00 per share, which is equal to the initial public offering price. Each of these grants was made on July 26, 2012 and each award will vest in four equal installments on each of the first four anniversaries of the date of grant, subject to the holders’ continued employment with the Company.
Non-Equity Incentive Plan Awards
We have an annual cash incentive bonus program in which certain corporate-level employees of the Company and its subsidiaries, including CCH, participate. Under this program, all participants, including our named executive officers, are eligible to receive an annual performance-based bonus equal to a target percentage of their annual salary, based upon their corresponding level of individual responsibility within the organization. Whether an individual’s target is achieved depends upon whether various financial performance metrics tied to each individual’s responsibilities (such as adjusted EBITDA, revenue, food costs, etc.) are satisfied. Mr. Mednansky then recommends a discretionary upward or downward adjustment to each individual’s target bonus (other than his own) based upon such individual’s overall performance and contributions over the prior year. Mr. Mednansky’s recommendations are reviewed by our compensation committee, which retains final discretion in determining the amount of any bonuses actually paid.
Pursuant to his February 7, 2011 employment agreement, Mr. Mednansky’s annual target bonus opportunity under the Company’s current bonus compensation plan is at least 50% of his annual base salary, but entitlement to any such bonus actually paid to Mr. Mednansky is to be determined by the board in its good faith discretion. Pursuant to Mr. Pennison’s October 17, 2011 employment agreement, he is eligible for a target annual incentive plan bonus of 50% of his annual base salary, subject to achievement of various performance criteria, and further subject to the board’s discretion. Messrs. Dritsas’ target bonus amount was set at 40% of his base salary for both 2011 and 2012.
We determine performance measures and their associated weightings for each executive based on such executive’s areas of primary responsibility and ability to influence the Company’s financial results.
For 2012, bonuses were determined for each of Messrs. Mednansky, Pennison and Dritsas, in whole or in part, as applicable, based on achievement of targets for both adjusted EBITDA and achievement of certain revenue targets. In addition, for Mr. Dritsas, funding was also based, in part, on the achievement of additional measures tied to his specific responsibilities, including successful development of a playbook and set of recipes for our restaurant concepts and managing our cost of food sales as a percentage of total revenues.
Our compensation committee determined that each named executive officer achieved his respective quantitative and qualitative targets under the annual incentive plan for 2012, which resulted in a payout of target bonus amounts of $200,000 for Mr. Mednansky, $125,000 for Mr. Pennison and $79,574 for Mr. Dritsas. In addition, our compensation committee made a $15,426 discretionary upward adjustment to Mr. Dritsas’ annual cash incentive bonus program payout for 2012 in recognition of his valuable contributions to our corporate performance results.
94
Table of Contents
Payments in Connection with Public Offerings
LSF5 Wagon Holdings, LLC Class B and Class C Interests
Lone Star Fund provided long-term incentives to Mr. Mednansky by allowing him to purchase Class B interests in Wagon, the Company’s controlling stockholder, and by granting equity incentive awards in the form of Class C Interests in Wagon. Mr. Mednansky acquired Class B and Class C Interests in 2007 pursuant to a subscription agreement. The Class B Interests were fully vested upon issuance and have a stated return, but do not participate in any increase in the value of our business. The Class C Interests, however, were designed to enable Mr. Mednansky to participate in any appreciation of our business by conditioning a portion of the vesting on the achievement of certain performance targets. As of December 31, 2011, Mr. Mednansky was 100% vested in his Class C interests.
Mr. Mednansky’s Class C Interests entitle him to 3.5% of Wagon’s total value in excess of amounts used to pay a 12% preferred return on Class A and Class B Interests and return of all members’ unrecovered capital contributions. However, as discussed below under “—Transaction Bonuses,” if Mr. Mednansky receives, over time, transaction bonuses with an aggregate value greater than the value of his Class C Interests at of the time of any liquidation of Wagon, then, pursuant to the Transaction Bonus Agreement, Mr. Mednansky’s Class C interests will not have any value or be entitled to any payment upon any such liquidation.
Additionally, pursuant to a February 14, 2011 letter agreement between Wagon and Mr. Mednansky, in the event of a public offering or a secondary public offering of our company after which Wagon’s direct or indirect ownership of our common equity is 50% or less, which would include this offering, or in the event of a sale of our company, Mr. Mednansky may require Wagon to purchase his Class B interests in Wagon for $ 350,000 minus all distributions of available cash paid to him on any date before the transaction is consummated. This payment is conditioned upon Mr. Mednansky’s execution of a release and that he is employed by CCH on the payment date (which may be 75 days after the relevant offering or sale is consummated).
Transaction Bonuses
Messrs. Mednansky and Pennison are also eligible pursuant transaction bonus agreements with Wagon dated October 21, 2011 and October 17, 2011, respectively, or the transaction bonus agreements, to receive transaction bonuses payable by Wagon in connection with certain change of control transactions. Specifically, Messrs. Mednansky and Pennison may receive transaction bonuses from a bonus pool in connection with this or another specified eligible transaction, provided that the executive is employed by CCH on the date the applicable transaction is consummated, or the Transaction Date.
Upon the occurrence of an eligible transaction, Mr. Mednansky is entitled to receive 45%, subject to a 5% increase in our sole and absolute discretion, of a total bonus pool calculated based on the valuation of our company, net of any borrowed money. Mr. Pennison is entitled to receive 20%, subject to a 5% increase in our sole and absolute discretion, of this bonus pool. The total bonus pool is calculated based on a formula set forth in the transaction bonus agreements. In the case of a qualified public offering, the value of the bonus pool will be reduced pro rata to reflect Wagon’s outstanding direct or indirect ownership interest in us immediately following such offering. In accordance with the terms of the transaction bonus agreements, we expect that Messrs. Mednansky and Pennison will be paid transaction bonuses of approximately $ and $ , respectively (or $ and $ , respectively, if the underwriters fully exercise their option to purchase additional shares), by Wagon in connection with this offering.
95
Table of Contents
Although entitled to a $960,264 transaction bonus in connection with our initial public offering, Mr. Mednansky agreed to accept a reduced transaction bonus amount of $920,264 from Wagon, with the understanding that the excess would be contributed to CCH, to be paid as discretionary bonuses to other employees involved in the initial public offering transaction. Mr. Pennison received a $480,132 transaction bonus in connection with the initial public offering. Although Mr. Mednansky and Mr. Pennison were entitled to receive transaction bonuses of $1,185,870 and $592,935, respectively, from Wagon in connection with our secondary public offering completed in March 2013, they agreed to reduced transaction bonus amounts of $1,145,870 and 582,935, respectively, with the understanding that the excess would be contributed to CCH to be paid as discretionary bonuses to other employees involved in the transaction.
Under the transaction bonus agreements, if Messrs. Mednansky and Pennison are entitled to bonus payments in connection with a qualified public offering and Wagon or its successors maintains any direct or indirect ownership interest in us following such offering, as occurred with respect to our initial public offering and March 2013 secondary public offering, then Messrs. Mednansky and Pennison will be eligible for additional, future transaction bonus payments from Wagon in the event of subsequent qualified secondary public offerings until Wagon no longer has any direct or indirect ownership interest in us. In order to receive these subsequent payments, Messrs. Mednansky and Pennison must (i) remain employed with CCH or any successor or acquirer of our business; (ii) not breach or violate the terms of their employment agreements or any other obligation to us; (iii) execute and deliver to us a release and award termination instrument; and (iv) have been entitled to transaction bonuses with respect to prior secondary offerings, if any.
In addition, if Messrs. Mednansky and Pennison remain actively employed by CCH at all times until April 26, 2014 (i.e., 21 months after the date of our initial public offering), do not breach their employment agreement or any other obligation to us during this 21-month period and do not terminate their employment for cause (as defined in their respective employment agreements) or voluntarily resign where cause exists, they will not forfeit their right to any transaction bonus in connection with a qualified secondary offering solely because they are not actively employed by CCH on the Transaction Date of such secondary offering.
Furthermore, if at any time Wagon’s direct or indirect interest in us is greater than zero but less than 50%, which will be the case upon completion of this offering, Wagon will have the right to pay Messrs. Mednansky and/or Pennison a bonus in lieu of the secondary offering transaction bonuses described above, according to a formula included in the transaction bonus agreement. Following the exercise of Wagon’s right, no transaction bonus will be payable with respect to any subsequent eligible transaction.
96
Table of Contents
Outstanding Equity Awards at 2012 Year-End
The following table sets forth information concerning outstanding equity awards for each of our named executive officers as of December 25, 2012.
| Option Awards | ||||||||||||
| Name |
Number of securities underlying unexercised options unexercisable(1) |
Option exercise price |
Option expiration date |
|||||||||
| Mark S. Mednansky |
190,500 | $ | 13.00 | 7/26/22 | ||||||||
| Thomas J. Pennison, Jr. |
85,000 | $ | 13.00 | 7/26/22 | ||||||||
| Thomas G. Dritsas |
15,000 | $ | 13.00 | 7/26/22 | ||||||||
| (1) | In connection with our initial public offering, each executive was granted an option to purchase the number of shares set forth in the above table. Each of these awards will vest in four equal installments on July 26, 2013, July 26, 2014, July 26, 2015, and July 26, 2016, subject to the named executive officer’s continued employment. |
Nonqualified Deferred Compensation Plan
CCH maintains the Del Frisco’s Restaurant Group Nonqualified Deferred Compensation Plan under which a select group of highly compensated management employees, generally employees who are at the level of district manager or above, may elect to defer a portion of their annual compensation, including base pay and/or bonuses. Employees who are eligible to participate in this plan are not eligible to participate in the Del Frisco’s Restaurant Group 401(k) Plan. The benefits under the deferred compensation plan are unfunded and evidenced by an account entry credited with the amount deferred each year plus earnings. However, all contributions by the employee and matching contributions by CCH are contributable to a grantor trust, which is invested in certain insurance policies. These assets, although not required by the plan, are segregated to pay benefits to the plan participants. In the event of CCH’s bankruptcy, these assets will be subject to the claims of CCH’s creditors. Each year, plan participants elect a percentage of pay they wish to defer for the following year. Additionally, CCH makes a matching contribution of 50% of a participant’s deferrals, up to the first 20% of a participant’s annual pay contributed to the plan. This matching contribution is also credited to a participant’s account under the plan. Matching contributions vest at a rate of 25% per year over four years. Participants may, consistent with applicable procedures, allocate the amount of deferral and Company contributions credited to their account to or between deemed investment alternatives offered by the plan for purposes of determining earnings on a participant’s account. The plan, however, has no obligation to actually invest any amounts in a participant’s account in these investment alternatives. Generally, a participant’s account balance will be distributed upon death, termination of employment, retirement or on a fixed date, subject to certain limitations. In addition, and in the sole discretion of the plan administration committee, a participant may receive a distribution of all or a portion of his or her account balance in the event of an unforeseen emergency. Each of our named executive officers participated in the Nonqualified Deferred Compensation Plan in 2012. Matching contributions made by CCH in 2012 for each executive officer are set forth in footnote 4 to the Summary Compensation Table.
97
Table of Contents
Severance and Change of Control Arrangements
During fiscal 2012, Messrs. Mednansky, Pennison, and Dritsas were eligible for severance benefits consisting of base salary continuation for a specified period under certain termination scenarios, as described below.
Mr. Mednansky
Under Mr. Mednansky’s February 7, 2011 employment agreement, upon a termination without cause or a resignation for good reason, not as a result of death or disability and that occurs prior to a change in control, Mr. Mednansky is entitled to continue to receive his base monthly salary for a period of 12 months and payment of his medical premiums for 12 months for the medical coverage that was in effect under CCH’s benefit plans immediately prior to such termination or resignation, provided that he receives COBRA benefits during this period. Upon a termination without cause or a resignation for good reason that occurs within 180 days following a change in control, Mr. Mednansky will be entitled to continue to receive his base monthly salary for a period of 18 months and payment of his medical premiums for 18 months for the medical coverage that was in effect under CCH’s benefit plans immediately prior to such termination or resignation, provided that he receives COBRA benefits during this period. All severance benefits payable upon a termination without cause or a resignation for good reason are conditioned upon Mr. Mednansky’s execution of a separation agreement and general release of claims in favor of CCH and its affiliates.
Upon termination due to disability, Mr. Mednansky is entitled to receive 50% of his annual salary in addition to any disability insurance benefits received under CCH’s employee benefit plans, paid semi-monthly, in 12 equal installments.
CCH’s obligation to provide any of the severance benefits payable upon a termination without cause, a resignation for good reason, or a termination due to disability will cease immediately in the event of Mr. Mednansky’s violation of the confidentiality, non-compete, or non-solicitation covenants contained in his employment agreement. In addition, Mr. Mednansky must repay CCH any such severance benefits received by him during the period of non-compliance with such confidentiality, non-compete and non-solicitation covenants, as determined by CCH in good faith.
Upon termination for any other reason, Mr. Mednansky is not entitled to any severance or other termination benefits, but only to payment of his accrued compensation through the date of termination.
For the purposes of Mr. Mednansky’s employment agreement:
| • | “Cause” is defined as (i) a failure by Mr. Mednansky to substantially perform his material duties under his employment agreement or to devote his full time and effort to his position with CCH (other than as a result of death, injury, illness, or disability), which, if curable, is not cured within 30 days after receipt of written notice of such failure; (ii) failure by Mr. Mednansky to comply materially with all policies of CCH, which, if curable, is not cured within 30 days after receipt of written notice of such failure; (iii) commission by Mr. Mednansky of an illegal act or an act not within the ordinary course of his responsibilities that exposes CCH to a significant level of undue liability (explicitly excluding a use by the Company of Mr. Mednansky’s liquor license); (iv) Mr. Mednansky’s conviction or plea of guilty or nolo contendre to any felony; or (v) breach of the confidentiality or non-compete covenants contained in Mr. Mednansky’s employment agreement. |
98
Table of Contents
| • | “Change in control” is defined as either (i) the closing of a firm commitment underwritten public offering of common equity securities for gross cash proceeds to the issuer of at least $30,000,000, where the shares of the Company or CCH are listed on a national securities exchange or are quoted on NASDAQ; or (ii) the closing of a sale or transfer of all or substantially all of the assets of CCH in one or a series of transactions, the sale, exchange, or other disposition of a majority of the equity interests in the Company or CCH, or any transaction having similar effect (including, without limitation, a merger or consolidation), excluding certain sales or transfers within the Wagon’s controlled group. This offering is expected to qualify as a change in control under Mr. Mednansky’s employment agreement. |
| • | “Good reason” is defined as, without his consent, the relocation of his place of employment to a location more than 50 miles from his current location, a reduction in his base salary (other than a general cost reduction not exceeding 10%, that affects all salaried employees of CCH proportionally), a material breach by CCH of the employment agreement, or a material diminution in his title and/or duties, responsibilities or authority. Prior to any of the above qualifying as “good reason,” Mr. Mednansky must provide CCH with notice and a 30-day period to cure any of the above. |
As of December 25, 2012, Mr. Mednansky held options to purchase 190,500 shares of common stock under the 2012 Plan. The vesting of these awards may be accelerated in connection with certain terminations following a change of control, as determined by the administrator of the 2012 Plan.
Mr. Pennison
Pursuant to his employment agreement with us, Mr. Pennison is entitled to similar severance and change in control benefits as those described above with respect to Mr. Mednansky’s employment agreement
As of December 25, 2012, Mr. Pennison held options to purchase 85,000 shares of common stock under the 2012 Plan. The vesting of these awards may be accelerated in connection with certain terminations following a change of control, as determined by the administrator of the 2012 Plan.
Mr. Dritsas
Pursuant to Mr. Dritsas’ January 4, 2012 employment agreement, he is entitled to certain payments if he is terminated without cause before January 4, 2015. Upon a termination without cause, not as a result of resignation, death or disability, and subject to his execution of a general release, Mr. Dritsas is entitled to continue to receive his base salary for a period of 12 months from the date of termination and to continued health benefits as he had enrolled and participated in prior to termination for a period of 12 months. Mr. Dritsas is not entitled to any severance or benefits other than the payment of accrued compensation through the date of termination if he is terminated for cause, due to death or disability, or he resigns.
“Cause” is defined in Mr. Dritsas’ employment agreement as (i) a material breach by Mr. Dritsas of his employment obligations; (ii) the commission of an act of fraud, embezzlement, misappropriation, willful misconduct or breach of fiduciary duty against CCH or other conduct potentially harmful to CCH’s best interests; (iii) a material breach of confidentiality, non-disclosure, non-compete, or non-solicitation provisions contained in his employment agreement; (iv) Mr. Dritsas’ conviction, plea of guilty, no contest, or nolo contendre, deferred
99
Table of Contents
adjudication, or unadjudicated probation for any felony or any crime involving moral turpitude; (v) the failure of Mr. Dritsas to carry out or comply with, in any material respect, any lawful order of CCH; or (vi) Mr. Dritsas’ unlawful use (including being under the influence) or possession of illegal drugs; (vii) Mr. Dristas’ disparagement of CCH or any of its affiliates or any employee, officer, director, member, manager, agent, or representative of CCH or any of its affiliates; or (8) CCH is temporarily or permanently enjoined from employing Mr. Dristas, or a court of competent jurisdiction otherwise orders CCH to cease employing Mr. Dristas, or the CCH determines in its reasonable discretion that it is in the best interests of CCH and/or its employees or members that Mr. Dristas’ employment with CCH should be terminated due to restrictions or covenants to which Mr. Dristas agreed with his former employer(s) and which may impact Mr. Dristas’ ability to be employed by the CCH.
As of December 25, 2012, Mr. Dritsas held options to purchase 15,000 shares of common stock under the 2012 Plan. The vesting of these awards may be accelerated in connection with certain terminations following a change of control, as determined by the administrator of the 2012 Plan.
100
Table of Contents
PRINCIPAL AND SELLING STOCKHOLDERS
The following table presents information concerning the beneficial ownership of the shares of our common stock as of July 15, 2013 by (1) each person known to us to beneficially own more than 5% of the outstanding shares of our common stock, (2) the selling stockholder, (3) each of our directors and named executive officers and (4) all of our directors and executive officers as a group. The table also contains information about beneficial ownership, as adjusted, to reflect the sale of common stock in this offering assuming:
| • | 23,794,667 shares of common stock outstanding as of July 15, 2013; and |
| • | no exercise of the underwriters’ option to purchase additional shares of common stock. |
Beneficial ownership is determined under the rules of the SEC and generally includes voting or investment power over securities. Except in cases where community property laws apply or as indicated in the footnotes to this table, we believe that each stockholder identified in the table possesses sole voting and investment power over all shares of common stock shown as beneficially owned by the stockholder. Shares of common stock subject to options and warrants that are exercisable or exercisable within 60 days of July 15, 2013 are considered outstanding and beneficially owned by the person holding the options for the purpose of computing the percentage ownership of that person but are not treated as outstanding for the purpose of computing the percentage ownership of any other person. Unless indicated below, the address of each individual listed below is c/o Del Frisco’s Restaurant Group, Inc., 930 S. Kimball Ave., Suite 100, Southlake, TX 76092.
The selling stockholder may be deemed an underwriter in connection with this offering.
| Shares Beneficially Owned Prior to this Offering |
Number of Shares of Being Sold in this Offering |
Shares Beneficially Owned After this Offering Assuming No Exercise of Underwriters’ Option |
Shares Beneficially Owned After this Offering Assuming Full Exercise of Underwriters’ Option | |||||||||||||||||||||
| Name of Beneficial Owner |
Shares of Common Stock |
Percentage of Total Outstanding Common Stock |
Shares of Common Stock |
Percentage of Total Outstanding Common Stock |
Shares of Common Stock |
Percentage of Total Outstanding Common Stock | ||||||||||||||||||
| 5% Stockholders |
||||||||||||||||||||||||
| LSF5 Wagon Holdings, LLC(1) |
13,094,667 | 55.0 | % | 5,000,000 | 8,094,667 | 34.0% | 7,344,667 | 30.9% | ||||||||||||||||
| Wellington Management Company, LLP(2) |
1,343,156 | 5.6 | % | — | 1,343,156 | 5.6% | 1,343,156 | 5.6% | ||||||||||||||||
| Named Executive Officers |
||||||||||||||||||||||||
| Mark S. Mednansky |
52,625 | (3) | * | — | 52,625 | (3) | * | 52,625 | (3) | * | ||||||||||||||
| Thomas J. Pennison, Jr. |
23,250 | (4) | * | — | 23,250 | (4) | * | 23,250 | (4) | * | ||||||||||||||
| Thomas G. Dritsas |
3,750 | (5) | * | — | 3,750 | (5) | * | 3,750 | (5) | * | ||||||||||||||
| Directors |
||||||||||||||||||||||||
| Norman J. Abdallah |
4,500 | (6) | * | — | 4,500 | (6) | * | 4,500 | (6) | * | ||||||||||||||
| David B. Barr |
4,500 | (6) | * | — | 4,500 | (6) | * | 4,500 | (6) | * | ||||||||||||||
| Bradley P. Boggess |
— | — | — | — | — | — | — | |||||||||||||||||
| Jodi L. Cason(7) |
— | — | — | — | — | — | — | |||||||||||||||||
| Richard L. Davis |
4,500 | (6) | * | — | 4,500 | (6) | * | 4,500 | (6) | * | ||||||||||||||
| John R. Kinzer |
— | — | — | — | — | — | — | |||||||||||||||||
| Jeffrey B. Ulmer |
— | — | — | — | — | — | — | |||||||||||||||||
| Samuel D. Loughlin |
— | — | — | — | — | — | — | |||||||||||||||||
| All executive officers and directors as a group (16 persons) |
93,125 | (8) | * | — | 93,125 | (8) | * | 93,125 | (8) | * | ||||||||||||||
| * | Less than one percent |
| (1) | LSF5 Wagon Holdings, LLC directly owns 13,094,667 shares of common stock. LSF5 Wagon Holdings, LLC, a Delaware limited liability company, is wholly-owned by LSF5 COI Holdings, LLC, a Delaware limited liability |
101
Table of Contents
| company, is controlled by Lone Star Fund V (U.S.) L.P., a Delaware limited partnership, which is controlled by its general partner, Lone Star Partners V, L.P., a Bermuda limited partnership, which is controlled by Lone Star Management Co. V, Ltd., a Bermuda exempted limited company, which is controlled by its sole owner John P. Grayken. The address for all of these persons, other than Lone Star Partners V, L.P. and Lone Star Management Co. V, Ltd., is 2711 North Haskell Avenue, Suite 1700, Dallas, Texas 75204. The address for Lone Star Partners V, L.P. and Lone Star Management Co. V, Ltd. is Washington Mall, Suite 304, Third Floor, 7 Reid Street, Hamilton HM11, Bermuda. |
| (2) | Based on information reported in a Schedule 13G filed with the SEC on February 14, 2013. Wellington Management Company LLP, or Wellington Management, in its capacity as investment adviser, beneficially owns 1,343,156 shares of common stock that are owned of record by its clients. Those clients have the right to receive, or the power to direct the receipt of, dividends from, or the proceeds from the sale of, such shares. No such client is known to have such right or power with respect to more than five percent of the Company’s total outstanding shares of common stock. Wellington Management’s address is 280 Congress Street, Boston, Massachusetts 02210. |
| (3) | Includes 5,000 shares of common stock owned and options to purchase 47,625 shares of common stock that have vested or will vest within 60 days of July 15, 2013. |
| (4) | Includes 2,000 shares of common stock owned and options to purchase 21,250 shares of common stock that have vested or will vest within 60 days of July 15, 2013. |
| (5) | Includes options to purchase 3,750 shares of common stock that have vested or will vest within 60 days of July 15, 2013. |
| (6) | Includes options to purchase 4,500 shares of common stock that have vested or will vest within 60 days of July 15, 2013. |
| (7) | Ms. Cason owns interests in an entity which owns non-controlling interests in Wagon’s parent company and therefore expressly disclaims any beneficial ownership of interests in Wagon or our common stock owned by Wagon. |
| (8) | Includes 7,000 shares of common stock owned and options to purchase 86,125 shares of common stock that have vested or will vest within 60 days of July 15, 2013. |
102
Table of Contents
CERTAIN RELATIONSHIPS AND RELATED PARTY TRANSACTIONS
Relationships with the Casual Dining Companies
In the Acquisition, Lone Star Fund acquired not only the Del Frisco’s and Sullivan’s concepts, but also the Texas Land & Cattle and Lone Star Steakhouse & Saloon concepts. Lone Star Fund spun-off the subsidiaries that operated the Texas Land & Cattle and Lone Star Steakhouse & Saloon concepts as part of the restructuring. These entities, which along with their affiliate companies are referred to in this prospectus as the Casual Dining Companies, are wholly-owned by Lone Star Fund and are therefore considered related parties of us. We do not have any ownership interest in them and they do not have any ownership interest in us.
Prior Shared Services Agreement
From December 13, 2006 to December 28, 2010, we were provided with certain accounting, administrative and management services by the Shared Services Provider, one of the Casual Dining Companies, under the Shared Services Agreement. In exchange for these services, we were charged an accounting fee of $1,800 per restaurant per four-week accounting period, except for the New York City Del Frisco’s, which was charged $5,400 per four-week accounting period, plus a management fee equal to 19.5% of certain agreed upon expenses, as provided for in the Shared Services Agreement, which totaled $1.2 million, $1.3 million and $0.3 million in 2009, 2010 and 2011, respectively. Effective January 1, 2011, InfoSync Services, LLC, a leading business process outsourcing provider focused exclusively on the restaurant industry, began providing these services to us.
Note Payable to Casual Dining Company
In July 2007, we converted all outstanding advances payable to one of the Casual Dining Companies into a $42.2 million note bearing interest at an annual rate of 4.65%. We made no payments on this note until the note was repaid in full in November 2010.
Lease Guarantees and Reimbursement Agreement
Prior to the Acquisition, Lone Star Steakhouse & Saloon guaranteed certain leases entered into by various operating subsidiaries of Lone Star Steakhouse & Saloon, including certain of the Casual Dining Companies. We continue to be a guarantor for five of these leases, which expire at various times through 2016. These guarantees would require payment by us only in an event of default by the Casual Dining Company tenant if it failed to make the required lease payments or perform other obligations under a lease. At June 11, 2013, the maximum potential amount of future lease payments we could be required to make as a result of the guarantees was $1.8 million.
Relationships with Lone Star Fund and its Affiliates
General
Lone Star Fund currently owns 55.0% of our common stock. Upon completion of this offering, Lone Star Fund will own 34.0% of our outstanding common stock (or 30.9% if the underwriters fully exercise their option to purchase additional shares). While Lone Star Fund will no longer beneficially own a majority of our outstanding common stock following the completion of this offering, Lone Star Fund acting on its own will continue to have sufficient voting power to significantly affect the outcome of all matters submitted to our stockholders for approval, including the election of our board of directors, determinations with respect to
103
Table of Contents
mergers or other business combinations, the acquisition or disposition of assets, the incurrence of indebtedness, the issuance of any additional common stock or other equity securities, the repurchase or redemption of common stock and the payment of dividends, and could take other actions that might be favorable to it.
Lone Star Fund is not subject to any contractual obligations to retain its interest following the completion of this offering, except that it has agreed, subject to certain exceptions, not to sell or otherwise dispose of any shares of common stock for a period of 90 days after the date of this prospectus without the prior written consent of the underwriters. Except for this brief period, there can be no assurance as to the period of time during which Lone Star Fund will maintain its beneficial ownership of our common stock following this offering. Following this brief period, Lone Star Fund will have rights to cause us to register its shares as described under “—Registration Rights Agreement” below.
Termination of Asset Advisory Agreement
In connection with Lone Star Fund’s acquisition of Lone Star Steakhouse & Saloon, Inc., we entered into arrangements with an affiliate of Lone Star Fund requiring us to reimburse the affiliate for the costs of certain services it provides us. These services included financial analysis and other financial services, real estate management, legal services and other services. In 2010, 2011 and 2012, we paid this affiliate of Lone Star Fund approximately $2.1 million, $3.1 million and $1.3 million, respectively, for these services. We have reimbursed this Lone Star Fund affiliate directly for these services.
We terminated this arrangement upon the consummation of our initial public offering and in connection therewith paid a one-time termination fee of $3.0 million to Lone Star Fund. As a result, we entered into a transition services agreement with affiliates of Lone Star Fund pursuant to which we will be provided certain insurance management, legal and benefits administration services at a cost of $200, $500, and $200 per hour, respectively, on an actual hours incurred basis. In 2012 and the 24 weeks ended June 11, 2013, we paid an aggregate of approximately $0.1 million and $25,000, respectively, to an affiliate of Lone Star Fund under the transition services agreement. We expect to terminate this transition services agreement upon completion of this offering.
Registration Rights Agreement
We entered into a registration rights agreement with Lone Star Fund in connection with our initial public offering. The terms of the registration rights agreement include provisions for demand registration rights and piggyback registration rights in favor of Lone Star Fund. The registration rights agreement does not provide for the payment of any consideration by us to Lone Star Fund if a registration statement for the resale of shares of common stock held by Lone Star Fund is not declared effective or if the effectiveness is not maintained. The registration statements (i) of which this prospectus forms a part and (ii) pursuant to which the shares of common stock sold in our March 2013 secondary public offering were registered were each filed in connection with a demand for registration by Lone Star Fund under the registration rights agreement. Currently, 13,094,667 shares of our common stock are entitled to these registration rights. Following the consummation of this offering, 8,094,667 shares of common stock will be entitled to these registration rights, assuming no exercise of the underwriters’ option to purchase additional shares of common stock. Shares registered with the SEC pursuant to these registrations rights will be eligible for sale in the public markets, subject to the lock-up agreements described in “Underwriting.” See “Shares Eligible for Future Sale—Registration Rights Agreement.”
104
Table of Contents
Secondary Offering Payments
Mr. Mark Mednansky, our Chief Executive Officer and a member of our board of directors, and Ms. Jodi Cason, a member of our board of directors, own equity interests in certain of our direct or indirect parent entities. Each of Mr. Mednansky and Ms. Cason received distributions from these entities in connection with our March 2013 secondary public offering in respect of their respective equity ownership interests. Specifically, Mr. Mednansky received aggregate distributions of $172,227 and Ms. Cason received aggregate distributions of $14,800.
Director Indemnification Agreements
Our bylaws permit us to indemnify our executive officers and directors to the fullest extent permitted by law, subject to limited exceptions. We have entered into indemnification agreements with each of our executive officers and directors that provide, in general, that we will indemnify them to the fullest extent permitted by law in connection with their service to us or on our behalf.
Review and Approval of Related Party Transactions
In connection with our initial public offering we implemented a written policy pursuant to which our board of directors will review and approve transactions with our directors, officers and holders of more than 5% of our voting securities and their affiliates (each, a related party). Prior to approving any transaction with a related party, our board of directors will consider the material facts as to the related party’s relationship with the company or interest in the transaction. Related party transactions will not be approved unless the nominating and corporate governance committee has approved of the transaction. We did not have a formal review and approval policy for related party transactions at the time of any transaction described in this “Certain Relationships and Related Party Transactions” section.
105
Table of Contents
The following is a description of the material provisions of our capital stock, as well as other material terms of our certificate of incorporation and bylaws. Copies of our certificate of incorporation and bylaws are incorporated by reference as exhibits to the registration statement of which this prospectus forms a part.
General
Our authorized capital stock consists of 190,000,000 shares of common stock, $0.001 par value per share, and 10,000,000 shares of preferred stock, $0.001 par value per share.
Common Stock
All outstanding shares of common stock, including the shares of stock to be sold in this offering, are validly issued, fully paid and nonassessable.
The holders of our common stock are entitled to one vote per share on all matters submitted to a vote of stockholders and our certificate of incorporation does not provide for cumulative voting in the election of directors. Subject to preferences that may be applicable to any outstanding series of preferred stock, the holders of our common stock will receive ratably any dividends declared by our board of directors out of funds legally available for the payment of dividends. In the event of our liquidation, dissolution or winding-up, the holders of our common stock are entitled to share ratably in all assets remaining after payment of or provision for any liabilities, subject to prior distribution rights of preferred stock, if any, then outstanding.
Preferred Stock
Our certificate of incorporation provides that our board of directors has the authority, without further action by the stockholders, to issue up to 10,000,000 shares of preferred stock. Our board of directors will be able to issue preferred stock in one or more series and determine the rights, preferences, privileges, qualifications and restrictions granted to or imposed upon our preferred stock, including dividend rights, conversion rights, voting rights, rights and terms of redemption, liquidation preferences and sinking fund terms, any or all of which may be greater than the rights of our common stock. Issuances of preferred stock could adversely affect the voting power of holders of our common stock and reduce the likelihood that holders of our common stock will receive dividend payments and payments upon liquidation. Any issuance of preferred stock also could have the effect of decreasing the market price of our common stock and could delay, deter or prevent a change in control of our company. Our board of directors does not presently have any plans to issue shares of preferred stock.
Limitations on Directors’ Liability
Our bylaws limit the liability of, and provide for us to indemnify, our directors to the fullest extent permitted by the DGCL. The DGCL permits a corporation to limit or eliminate a director’s personal liability to the corporation or the holders of its capital stock for breach of fiduciary duty. This limitation is generally unavailable for acts or omissions by a director which (a) were in bad faith, (b) were the result of intentional misconduct or a knowing violation of law, (c) the director derived an improper personal benefit from (such as a financial profit or other advantage to which the director was not legally entitled) or (d) breached the director’s duty of loyalty. The DGCL also prohibits limitations on director liability under Section 174 of the DGCL, which relates to certain unlawful dividend declarations and stock repurchases. The limitation of
106
Table of Contents
liability and indemnification provisions in our certificate of incorporation and bylaws may discourage stockholders from bringing a lawsuit against directors for breach of their fiduciary duty. These provisions may also have the effect of reducing the likelihood of derivative litigation against directors and officers, even though such an action, if successful, might otherwise benefit us and our stockholders. In addition, your investment may be adversely affected to the extent we pay the costs of settlement and damage awards against directors and officers pursuant to these indemnification provisions.
We maintain insurance that insures our directors and officers against certain losses and which insures us against our obligations to indemnify the directors and officers. We have also entered into indemnification agreements with our directors and executive officers.
Forum Selection Clause
Unless we consent in writing to the selection of an alternative forum, the Court of Chancery of the State of Delaware will be the sole and exclusive forum for (i) any derivative action or proceeding brought on our behalf, (ii) any action asserting a claim of breach of a fiduciary duty owed by any of our directors, officers, employees or agents or our stockholders, (iii) any action asserting a claim arising pursuant to any provision of the DGCL or (iv) any action asserting a claim governed by the internal affairs doctrine, in each such case subject to said Court of Chancery having personal jurisdiction over the indispensable parties named as defendants therein. Any person or entity purchasing or otherwise acquiring any interest in shares of our capital stock will be deemed to have notice of and consented to the forum selection clause.
Provisions of Our Certificate of Incorporation and Bylaws and Delaware Law that May Have an Anti-Takeover Effect
Provisions of the DGCL and our certificate of incorporation and bylaws could make it more difficult to acquire us by means of a tender offer, a proxy contest or otherwise, or to remove incumbent officers and directors. These provisions, summarized below, are expected to discourage types of coercive takeover practices and inadequate takeover bids and to encourage persons seeking to acquire control of us to first negotiate with us. We believe that the benefits of increased protection of our potential ability to negotiate with the proponent of an unfriendly or unsolicited proposal to acquire or restructure us outweigh the disadvantages of discouraging takeover or acquisition proposals because, among other things, negotiation of these proposals could result in an improvement of their terms.
Delaware Anti-Takeover Statute
We are subject to Section 203 of the DGCL, an anti-takeover statute. In general, Section 203 prohibits a publicly held Delaware corporation from engaging in a “business combination” with an “interested stockholder” for a period of three years following the time the person became an interested stockholder, unless (with certain exceptions) the business combination or the transaction in which the person became an interested stockholder is approved in a prescribed manner. Generally, a “business combination” includes a merger, asset or stock sale, or other transaction resulting in a financial benefit to the interested stockholder. Generally, an “interested stockholder” is a person who, together with affiliates and associates, owns (or within three years prior to the determination of interested stockholder status, did own) 15% or more of a corporation’s voting stock. The existence of this provision would be expected to have an anti-takeover effect with respect to transactions not approved in advance by the board of directors, including discouraging attempts that might result in a premium over the market price for the shares of common stock held by stockholders.
107
Table of Contents
Requirements for Advance Notification of Stockholder Meetings, Nominations and Proposals
Our bylaws provide that special meetings of the stockholders may be called only by or at the direction of the board of directors, the chairman of our board or the chief executive officer with the concurrence of a majority of the board of directors. Our bylaws prohibit the conduct of any business at a special meeting other than as specified in the notice for such meeting. These provisions may have the effect of deferring, delaying or discouraging hostile takeovers, or changes in control or management of our company.
Our bylaws establish advance notice procedures with respect to stockholder proposals and the nomination of candidates for election as directors. In order for any matter to be “properly brought” before a meeting, a stockholder will have to comply with advance notice requirements and provide us with certain information. Our bylaws allow the presiding officer at a meeting of the stockholders to adopt rules and regulations for the conduct of meetings which may have the effect of precluding the conduct of certain business at a meeting if the rules and regulations are not followed. These provisions may also defer, delay or discourage a potential acquirer from conducting a solicitation of proxies to elect the acquirer’s own slate of directors or otherwise attempting to obtain control of our company.
Any amendment to our certificate of incorporation requires the affirmative vote of at least 66 2/3% of the voting power of all shares of our common stock then outstanding. Our certificate of incorporation provides that the board of directors is expressly authorized to adopt, amend or repeal our bylaws and that our stockholders may only amend our bylaws with the approval of at least 66 2/3% of the voting power of all shares of our common stock then outstanding.
No Cumulative Voting
The DGCL provides that stockholders are denied the right to cumulate votes in the election of directors unless our certificate of incorporation provides otherwise. Our certificate of incorporation does not provide for cumulative voting.
Classified Board of Directors
Our certificate of incorporation provides that our board of directors will be divided into three classes of directors, with the classes to be as nearly equal in number as possible. The members of each class serve for a three-year term. As a result, approximately one-third of our board of directors will be elected each year. The classification of directors will have the effect of making it more difficult for stockholders to change the composition of our board of directors. Our certificate of incorporation provides that the number of directors will be fixed from time to time pursuant to a resolution adopted by the board of directors, but must consist of not less than three or more than 13 directors.
Removal of Directors
Our certificate of incorporation and bylaws provide that (i) prior to the date on which Lone Star Fund and its affiliates cease to beneficially own, in aggregate, at least a majority of the voting power of all outstanding shares entitled to vote generally in the election of directors, directors may be removed with or without cause upon the affirmative vote of holders of at least a majority of the voting power of all the then outstanding shares of stock entitled to vote generally in the election of directors, voting together as a single class and (ii) on and after the date Lone Star Fund and its affiliates cease to beneficially own, in aggregate, at least a majority of the voting power of all outstanding shares entitled to vote generally in the election of
108
Table of Contents
directors, directors may be removed only for cause and only upon the affirmative vote of holders of at least 66 2/3% of the voting power of all the then outstanding shares of stock entitled to vote generally in the election of directors, voting together as a single class. It is expected that, following the completion of this offering, Lone Star Fund and its affiliates will cease to beneficially own, in aggregate, at least a majority of the voting power of all outstanding shares entitled to vote generally in the election of directors, and a supermajority will therefore be required to remove directors. In addition, our certificate of incorporation and bylaws also provide that any newly created directorships and any vacancies on our board of directors will be filled only by the affirmative vote of the majority of remaining directors; provided that so long as affiliates of Lone Star Fund own at least 25% of the total voting power of our capital stock, the positions can only be filled by our stockholders.
Stockholder Action by Written Consent
The DGCL permits any action required to be taken at any annual or special meeting of the stockholders may be taken without a meeting, without prior notice and without a vote if a consent or consents in writing, setting forth the action so taken, is signed by the holders of outstanding stock having not less than the minimum number of votes that would be necessary to authorize or take such action at a meeting at which all shares of stock entitled to vote thereon were present and voted, unless the certificate of incorporation provides otherwise. Our certificate of incorporation and bylaws preclude stockholder action by written consent after the date on which Lone Star Fund and its affiliates cease to beneficially own, in the aggregate, at least a majority of the voting power of all outstanding shares of our stock entitled to vote generally in the election of directors. It is expected that, following the completion of this offering, Lone Star Fund and its affiliates will cease to beneficially own, in aggregate, at least a majority of the voting power of all outstanding shares entitled to vote generally in the election of directors, and stockholder action by written consent will therefore be precluded by our certificate of incorporation and bylaws.
Limitations on Liability and Indemnification of Officers and Directors
The DGCL authorizes corporations to limit or eliminate the personal liability of directors to corporations and their stockholders for monetary damages for breaches of directors’ fiduciary duties as directors. Our organizational documents include provisions that eliminate, to the extent allowable under the DGCL, the personal liability of directors or officers for monetary damages for actions taken as a director or officer, as the case may be. Our organizational documents also provide that we must indemnify and advance reasonable expenses to our directors and officers to the fullest extent authorized by the DGCL. We are also expressly authorized to carry directors’ and officers’ insurance for our directors, officers and certain employees for some liabilities.
The limitation of liability and indemnification provisions in our certificate of incorporation and bylaws may discourage stockholders from bringing a lawsuit against directors for breach of their fiduciary duty. These provisions may also have the effect of reducing the likelihood of derivative litigation against directors and officers, even though such an action, if successful, might otherwise benefit us and our stockholders. In addition, your investment may be adversely affected to the extent that, in a class action or direct suit, we pay the costs of settlement and damage awards against directors and officers pursuant to these indemnification provisions.
There is currently no pending material litigation or proceeding involving any of our directors, officers or employees for which indemnification is sought.
109
Table of Contents
Authorized but Unissued Shares
Our authorized but unissued shares of common stock and preferred stock are available for future issuance without your approval. The DGCL does not require stockholder approval for any issuance of authorized shares. However, the NASDAQ listing requirements require stockholder approval of certain issuances equal to or exceeding 20% of the then-outstanding voting power or the then-outstanding number of shares of common stock. No assurances can be given that our shares will remain so listed. We may use additional shares for a variety of corporate purposes, including future public offerings to raise additional capital, corporate acquisitions and employee benefit plans. The existence of authorized but unissued shares of common stock and preferred stock could render more difficult or discourage an attempt to obtain control of us by means of a proxy contest, tender offer, merger or otherwise.
Corporate Opportunities and Transactions with Lone Star Fund
In recognition that principals, members, directors, managers, partners, stockholders, officers, employees and other representatives of Lone Star Fund and its affiliates and affiliated investment funds, referred to as the Lone Star entities, may serve as our directors or officers, and that the Lone Star entities may engage in similar activities or lines of business that we do, our certificate of incorporation provides for the allocation of certain corporate opportunities between us and the Lone Star entities. Specifically, none of the Lone Star entities or any principal, member, director, manager, partner, stockholder, officer, employee or other representative of the Lone Star entities has any duty to refrain from engaging directly or indirectly in the same or similar business activities or lines of business that we do. In the event that any Lone Star entity acquires knowledge of a potential transaction or matter which may be a corporate opportunity for itself and us, we will not have any expectancy in the corporate opportunity, and the Lone Star entity will not have any duty to communicate or offer the corporate opportunity to us and may pursue or acquire such corporate opportunity for itself or direct such opportunity to another person. In addition, if a director or officer of our company who is also a principal, member, director, manager, partner, stockholder, officer, employee or other representative of any Lone Star entity acquires knowledge of a potential transaction or matter which may be a corporate opportunity for us and a Lone Star entity, we will not have any expectancy in the corporate opportunity unless the corporate opportunity is expressly offered to the person solely in his or her capacity as a director or officer of our company.
In recognition that we may engage in material business transactions with the Lone Star entities, from which we are expected to benefit, our certificate of incorporation provides that any of our directors or officers who are also principals, members, directors, managers, partners, stockholders, officers, employees and other representatives of any Lone Star entity will have fully satisfied and fulfilled his or her fiduciary duty to us and our stockholders with respect to such transaction, if:
| • | the transaction was approved, after being made aware of the material facts of the relationship between each of Del Frisco’s Restaurant Group, Inc. or a subsidiary thereof and the Lone Star entity and the material terms and facts of the transaction, by (1) an affirmative vote of a majority of the members of our board of directors who do not have a material financial interest in the transaction, known as disinterested persons, or (2) an affirmative vote of a majority of the members of a committee of our board of directors consisting of members who are disinterested persons; or |
| • | the transaction was fair to us at the time we entered into the transaction; or |
| • | the transaction was approved by an affirmative vote of the holders of a majority of shares of our common stock entitled to vote, excluding the Lone Star entities and any holder who has a material financial interest in the transaction. |
110
Table of Contents
By becoming a stockholder in our company, you will be deemed to have received notice of and consented to these provisions of our certificate of incorporation.
Transfer Agent and Registrar
The Transfer Agent and Registrar for our common stock is American Stock Transfer & Trust Company, LLC.
Listing
Our common stock is traded on the Nasdaq Global Select Market under the symbol “DFRG.”
111
Table of Contents
SHARES ELIGIBLE FOR FUTURE SALE
Our common stock has been traded on the Nasdaq Global Select Market under the symbol “DFRG” since July 26, 2012. Prior to that date there was no public market for our common stock. As of July 15, 2013, we have an aggregate of 23,794,667 shares of common stock outstanding, assuming no exercise of outstanding options. Of the outstanding shares, the 5,000,000 shares sold in this offering (or 5,750,000 shares if the underwriters exercise their option to purchase additional shares of common stock in full) will be freely tradable without restriction or further registration under the Securities Act, except that any shares held by our affiliates, as that term is defined in Rule 144 of the Securities Act, may generally be sold only in compliance with the limitations described below. Any remaining outstanding shares of our common stock held by affiliates are also deemed restricted securities, as defined in Rule 144. We expect that Lone Star Fund will continue to be considered an affiliate 90 days after this offering based on its expected share ownership (consisting of 8,094,667 shares assuming the underwriters do not exercise their option to purchase additional shares). Certain other of our stockholders may also be considered affiliates at that time.
Lock-Up Agreements
We and our officers, directors and the selling stockholder, Lone Star Fund, that will beneficially own 34.0% (or 30.9% if the underwriters fully exercise their option to purchase additional shares) of our outstanding shares of common stock immediately after this offering have entered into lock-up agreements in connection with this offering with the underwriters that will restrict the sale of shares of our common stock held by them for 90 days after the date of this prospectus, subject to certain exceptions. See “Underwriting” for a description of the lock-up agreements entered into in connection with this offering.
Sales of Restricted Securities
The shares of common stock held by affiliates following completion of this offering, including the 8,094,667 shares (or 7,344,667 shares if the underwriters fully exercise their option to purchase additional shares) held by Lone Star fund following completion of this offering, will be available for sale, subject to the lock-up agreements described above, after the date of this prospectus in registered sales or pursuant to Rule 144 or another exemption from registration. For the purpose of the volume, manner of sale and other limitations under Rule 144 applicable to affiliates described below, we expect that Lone Star Fund will continue to be considered an affiliate 90 days after this offering based on its expected share ownership (consisting of 8,094,667 shares assuming the underwriters do not exercise their option to purchase additional shares).
Restricted shares may be sold in the public market only if registered or if they qualify for an exemption from registration including under Rule 144 or 701 promulgated under the Securities Act, each of which is summarized below.
In general, under Rule 144, beginning 90 days after the date of this prospectus, a person who is not our affiliate and has not been our affiliate at any time during the preceding three months will be entitled to sell any shares of our common stock that such person has beneficially owned for at least six months, including the holding period of any prior owner other than one of our affiliates, without regard to the volume limitations summarized below. Sales of our common stock by any such person would be subject to the availability of current public information about us if the shares to be sold were beneficially owned by such person for less than one year.
In addition, under Rule 144, a person may sell shares of our common stock acquired from us immediately after the consummation of this offering, without regard to volume limitations or
112
Table of Contents
the availability of public information about us, if: (i) the person is not our affiliate and has not been our affiliate at any time during the preceding three months; and (ii) the person has beneficially owned the shares to be sold for at least one year, including the holding period of any prior owner other than one of our affiliates.
Beginning 90 days after the date of this prospectus, our affiliates who have beneficially owned shares of our common stock for at least six months, including the holding period of any prior owner other than one of our affiliates, would be entitled to sell within any three-month period a number of shares that does not exceed the greater of: (i) 1% of the number of shares of our common stock then-outstanding, which will equal approximately 237,947 shares; and (ii) the average weekly trading volume in our common stock on the NASDAQ Global Select Market during the four calendar weeks preceding the date of filing of a Notice of Proposed Sale of Securities Pursuant to Rule 144 with respect to the sale.
Sales under Rule 144 by our affiliates are also subject to manner of sale provisions and notice requirements and to the availability of current public information about us.
Rule 701 provides that the shares of common stock acquired upon the exercise of currently outstanding options or pursuant to other rights granted under our equity incentive plan may be resold by persons, other than our affiliates, beginning 90 days after the effective date of the registration statement of which this prospectus is a part, subject only to the manner of sale provisions of Rule 144, and by our affiliates under Rule 144, without compliance with its one-year minimum holding period. As of the date of this prospectus, no options to purchase shares of our common stock were outstanding.
As a result of lock-up agreements described in “Underwriting” and the provisions of Rules 144 and 701, additional shares will be available for sale in the public market upon the expiration or, if earlier, the waiver of the lock-up period provided for in the lock-up agreements, subject, in some cases, to volume limitations.
Additional Registration Statements
In addition, 2,232,800 shares of common stock may be granted under the 2012 Plan, including 851,500 shares issuable upon the exercise of stock options that we granted to our executive officers, employees and certain director nominees at or after the time of the pricing of our initial public offering with a weighted average exercise price of $13.37 per share. We have filed a registration statement on Form S-8 under the Securities Act to register 2,232,800 shares of our common stock reserved for issuance under the 2012 Plan, which was effective upon filing. Shares covered by the S-8 registration statement will be eligible for sale in the public market, subject to any limitations on exercise under the 2012 Plan, the lock-up agreements described in “Underwriting” and Rule 144 limitations applicable to affiliates.
Registration Rights Agreement
We have entered into a registration rights agreement with Lone Star Fund. The terms of the registration rights agreement include provisions for demand registration rights and piggyback registration rights in favor of Lone Star Fund. The registration rights agreement does not provide for the payment of any consideration by us to Lone Star Fund if a registration statement for the resale of shares of common stock held by Lone Star Fund is not declared effective or if the effectiveness is not maintained. The registration statement of which this prospectus forms a part was filed in connection with a demand for registration by Lone Star Fund under the registration rights agreement. Currently, 13,094,667 shares of our common stock are entitled to
113
Table of Contents
these registration rights. Following the consummation of this offering, 8,094,667 shares of common stock will be entitled to these registration rights, assuming no exercise of the underwriters’ option to purchase additional shares of common stock. Shares registered with the SEC pursuant to these registration rights will be eligible for sale in the public markets upon effectiveness of the registration statement covering those shares, subject to the lock-up agreements described in “Underwriting” in the case of the shares sold in this offering. By exercising its registration rights and causing a large number of shares to be registered and sold in the public market, Lone Star Fund could cause the price of the common stock to fall. In addition, any demand to include these shares in our registration statements could have a material adverse effect on our ability to raise needed capital. See “Certain Relationships and Related Party Transactions—Registration Rights Agreement.”
Subject to the terms of the registration rights agreement, Lone Star Fund, the holder of 13,094,667 shares of our common stock (8,094,667 shares owned by Lone Star Fund immediately following the consummation of this offering assuming no exercise of the underwriters’ option to purchase additional shares of common stock), has the right to require that we register its shares under the Securities Act for sale to the public. We must pay all expenses, except for underwriters’ discounts and commissions, incurred in connection with the exercise of these demand registration rights, including in connection with this offering.
Lone Star Fund also has piggyback registration rights under the terms of the registration rights agreement. The registration rights agreement provides that Lone Star Fund has the right to include its shares in any registration that we effect under the Securities Act, other than a registration effected pursuant to an exercise of demand registration rights, subject to specified exceptions. We must pay all expenses, except for underwriters’ discounts and commissions, incurred in connection with these piggyback registration rights.
Effects of Sales of Shares
No predictions can be made as to the effect, if any, that sales of shares of our common stock from time to time, or the availability of shares of our common stock for future sale, may have on the market price for shares of our common stock. Sales of substantial amounts of common stock, or the perception that such sales could occur, could adversely affect prevailing market prices for our common stock and could impair our future ability to obtain capital through an offering of equity securities.
114
Table of Contents
U.S. FEDERAL TAX CONSIDERATIONS FOR NON-U.S. HOLDERS
The following is a general discussion of material U.S. federal income and estate tax consequences of the acquisition, ownership, and disposition of our common stock purchased pursuant to this offering by a non-U.S. holder. As used in this prospectus, the term “non-U.S. holder” means a beneficial owner of 5% or less of our common stock that, for U.S. federal income tax purposes, is neither a partnership nor any of the following:
| • | an individual who is a citizen or resident of the United States; |
| • | a corporation (including any entity treated as a corporation for U.S. federal income tax purposes) created or organized in the United States or under the laws of the United States or any state thereof (including the District of Columbia); |
| • | an estate the income of which is subject to U.S. federal income taxation regardless of its source; or |
| • | a trust (i) whose administration is subject to the primary supervision of a U.S. court and which has one or more U.S. persons who have the authority to control all substantial decisions of the trust, or (ii) that has a valid election in effect under applicable U.S. Treasury regulations to be treated as a U.S. person. |
An individual who is not a citizen of the United States may, subject to certain restrictions as well as limitations contained in any applicable income tax treaties, be deemed to be a resident of the United States by reason of being present in the United States for at least 31 days in the calendar year and an aggregate of at least 183 days during a three year period ending in the current calendar year (counting for such purposes all of the days present in the current year, one-third of the days present in the immediate preceding calendar year and one-sixth of the days present in the second preceding calendar year). U.S. residents are generally taxed for U.S. federal income tax purposes in the same manner as U.S. citizens.
This discussion assumes that you will hold our common stock issued pursuant to this offering as a capital asset within the meaning of the Internal Revenue Code of 1986, as amended, or the Code (i.e., generally, property held for investment). This discussion does not address all aspects of U.S. federal taxation that may be relevant to a particular non-U.S. holder in light of the holder’s individual investment or tax circumstances, or to non-U.S. holders that are subject to special tax rules. In addition, this description of U.S. tax consequences does not address:
| • | U.S. state and local or non-U.S. tax consequences; |
| • | U.S. federal gift tax consequences; |
| • | specific facts and circumstances that may be relevant to a particular non-U.S. holder’s tax position; |
| • | the tax consequences for the stockholders, partners or beneficiaries of a non-U.S. holder; |
| • | special tax rules that may apply to some non-U.S. holders, including without limitation, banks, insurance companies, financial institutions, hybrid entities, broker-dealers, tax-exempt entities, controlled foreign corporations, passive foreign investment companies or U.S. expatriates; or |
| • | special tax rules that may apply to a non-U.S. holder that holds our common stock as part of a straddle, hedge or conversion transaction or other integrated investment. |
115
Table of Contents
If a partnership is a beneficial owner of our common stock, the treatment of a partner in the partnership generally will depend upon the status of the partner and the activities of the partnership. A beneficial owner of our common stock that is a partnership and partners in such a partnership should consult their tax advisors regarding the U.S. federal income tax consequences of acquiring, owning, and disposing of our common stock.
This discussion is based on current provisions of the Code, final, temporary and proposed U.S. Treasury regulations, judicial opinions, published positions of the U.S. Internal Revenue Service, or IRS, and other applicable authorities, all as in effect on the date hereof and all of which are subject to differing interpretations or change, possibly with retroactive effect. We have not sought, and will not seek, any ruling from the IRS or any opinion of counsel with respect to the tax consequences discussed herein, and there can be no assurance that the IRS will not take a position contrary to the tax consequences discussed below or that any position taken by the IRS would not be sustained. Furthermore, this discussion does not include any discussion of any state, local or foreign tax considerations.
We urge you to consult your tax advisor regarding the U.S. federal tax consequences of acquiring, owning or disposing our common stock, as well as any tax consequences that may arise under the laws of any foreign, state, local or other taxing jurisdiction or under any applicable tax treaty.
Dividends
As described under “Dividend Policy” above, we do not anticipate paying cash dividends on our common stock in the foreseeable future. However, if distributions of cash or property (other than certain stock distributions) are made to non-U.S. holders on shares of our common stock, such distributions generally will constitute dividends for U.S. federal income tax purposes to the extent paid from our current or accumulated earnings and profits, as determined under U.S. federal income tax principles. Distributions in excess of earnings and profits will constitute a return of capital that is applied against and reduces the non-U.S. holder’s adjusted tax basis in our common stock. Any remaining excess will be treated as gain realized on the sale or other disposition of the common stock and will be treated as described under “—Gain on Sale, Exchange or Other Taxable Disposition of Common Stock” below.
Dividends paid to a non-U.S. holder that are not effectively connected with the non-U.S. holder’s conduct of a trade or business in the United States generally will be subject to withholding of U.S. federal income tax at the rate of 30% or such lower rate as may be specified by an applicable income tax treaty. Non-U.S. holders should consult their tax advisors regarding their entitlement to benefits under an applicable income tax treaty and the requirements for and manner of claiming the benefits of such treaty (including, without limitation, the need to obtain a U.S. taxpayer identification number).
If the non-U.S. holder is engaged in a trade or business in the United States, either directly or through an entity treated as a partnership for U.S. tax purposes, and the dividends are effectively connected with the conduct of such trade or business, and, if provided in an applicable income tax treaty, are dividends attributable to a permanent establishment or fixed base maintained by the non-U.S. holder in the United States, then the dividends are not subject to the U.S. withholding tax, but instead are subject to U.S. federal income tax on a net income basis at applicable graduated U.S. federal income tax rates and in a manner applicable to U.S. persons. Certain certification and disclosure requirements must be complied with for effectively connected income or income attributable to a permanent establishment to be exempt from withholding. Any effectively connected dividends or dividends attributable to a permanent
116
Table of Contents
establishment received by a non-U.S. holder that is treated as a foreign corporation for U.S. tax purposes may be subject to an additional “branch profits tax” at a 30% rate, or such lower rate as may be specified by an applicable income tax treaty.
To claim the benefit of a tax treaty or an exemption from withholding because dividends are effectively connected with the conduct of a trade or business in the United States, a non-U.S. holder must provide to the withholding agent a properly executed IRS Form W-8BEN (or successor form) for treaty benefits or IRS Form W-8ECI (or successor form) for effectively connected income, before the payment of dividends, and, if claiming the benefit of a tax treaty, must certify under penalties of perjury on the appropriate forms that such non-U.S. holder is not a U.S. person and is eligible for treaty benefits. These forms must be periodically updated. Non-U.S. holders may obtain a refund of any excess amounts withheld by timely filing an appropriate claim for refund along with the required information. However,
| • | in the case of common stock held by a foreign partnership, the certification requirement generally will be applied to the partners of the partnership and the partnership will be required to provide certain information; |
| • | in the case of common stock held by a foreign trust, the certification requirement generally will be applied to the trust or the beneficial owners of the trust depending on whether the trust is a “foreign complex trust,” “foreign simple trust,” or “foreign grantor trust” as defined in the U.S. Treasury regulations; and |
| • | look-through rules will apply for tiered partnerships, foreign simple trusts and foreign grantor trusts. |
A non-U.S. holder that is a foreign partnership or a foreign trust is urged to consult its own tax advisor regarding its status under U.S. tax law and the certification requirements applicable to it.
Gain on Sale, Exchange or Other Taxable Disposition of Common Stock
A non-U.S. holder generally will not be subject to U.S. federal income tax, including by way of withholding, on gain recognized on a sale, exchange or other taxable disposition of our common stock unless any one of the following applies:
| 1. | The non-U.S. holder is a nonresident alien individual who is present in the United States for 183 days or more in the taxable year of the sale, exchange or other taxable disposition and certain other requirements are met; |
| 2. | The gain is effectively connected with the non-U.S. holder’s conduct of a trade or business in the United States, directly or through an entity treated as a partnership for U.S. tax purposes and, if an applicable tax treaty requires, attributable to a U.S. permanent establishment or fixed base of such non-U.S. holder; or |
| 3. | We are or have been, at any time during the five-year period preceding such disposition (or the non-U.S. holder’s holding period, if shorter) a “United States real property holding corporation,” within the meaning of Section 897(c)(2) of the Code, unless our common stock is regularly traded on an established securities market and the non-U.S. holder holds no more than 5% of our outstanding common stock, directly or indirectly, during the relevant period, or the 5% exception. Generally, a United States corporation is treated as a United States real property holding corporation within the meaning of Section 897(c)(2) of the Code if the fair market value of its United States real property interests equals or exceeds 50% of the sum of the fair market value of its worldwide |
117
Table of Contents
| real property interests plus its other assets used or held for use in a trade or business. We believe that we have not been and are not currently a United States real property holding corporation, and we do not expect to become a United States real property holding corporation. However, no assurances can be made in this regard. Furthermore, no assurances can be provided that our stock will be considered to be regularly traded on an established securities market for purposes of Section 897 of the Code. |
Non-U.S. holders described in clause (1) above are taxed on their gains (including gains from sales of our common stock and net of applicable U.S. losses from sales or exchanges of other capital assets incurred during the year) at a flat rate of 30% or such lower rate as may be specified by an applicable income tax treaty. Non-U.S. holders described in clause (2) or (3) above will be subject to tax on the net gain derived from the sale under regular graduated U.S. federal income tax rates and in a manner applicable to U.S. persons, unless an applicable income tax treaty provides otherwise. If a non-U.S. holder described in clause (2) or (3) is a corporation, it may be subject to the additional branch profits tax at a rate equal to 30% of its effectively connected earnings and profits or at such lower rate as may be specified by an applicable income tax treaty. In addition, if we are determined to be a United States real property holding corporation and the 5% exception does not apply, then a purchaser may be required to withhold 10% of the proceeds payable to a non-U.S. holder from a sale or other taxable disposition of our common stock.
U.S. Federal Estate Taxes
Our common stock beneficially owned or treated as beneficially owned by an individual who at the time of death is a non-U.S. holder, and certain lifetime transfers of an interest in common stock made by such an individual, will be included in his or her gross estate for U.S. federal estate tax purposes, unless an applicable estate tax treaty provides otherwise and, therefore, may be subject to U.S. federal estate tax. Estates of non-resident alien individuals are generally allowed a statutory credit that has the effect of offsetting the U.S. federal estate tax imposed on the first $60,000 of the taxable estate.
Legislation Affecting Taxation of Common Stock Held by or Through Foreign Entities
Under legislation enacted in 2010, a 30% U.S. federal withholding tax will be imposed on dividends on stock of U.S. corporations, and on the gross proceeds from the disposition of such stock, paid to a “foreign financial institution” (as specially defined for this purpose), unless such institution enters into an agreement with the U.S. Treasury to collect and provide to the U.S. Treasury substantial information regarding its U.S. account holders and certain account holders that are foreign entities with U.S. owners. A 30% U.S. federal withholding tax will also apply to dividends paid on stock of U.S. corporations and on the gross proceeds from the disposition of such stock paid to a non-financial foreign entity unless such entity provides the withholding agent with a certification that it does not have any substantial U.S. owners or a certification identifying the direct and indirect substantial U.S. owners of the entity. The withholding taxes described above generally will apply to dividend payments made after December 31, 2013 and payments of gross proceeds made after December 31, 2016. Under certain circumstances, a non-U.S. holder may be eligible for refunds or credits of such withholding taxes. Investors are urged to consult with their own tax advisors regarding the possible application of these rules to their investment in our common stock.
118
Table of Contents
Information Reporting and Backup Withholding
Under U.S. Treasury regulations, we must report annually to the IRS and to each non-U.S. holder the amount of dividends paid to such non-U.S. holder and the tax withheld with respect to those dividends. These information reporting requirements apply even if withholding was not required because the dividends were effectively connected to the conduct of the non-U.S. holder’s trade or business within the United States or withholding was reduced or eliminated by an applicable tax treaty. Copies of the information returns reporting those dividends and withholding may also be made available to the tax authorities in the country in which the non-U.S. holder is a resident under the provisions of an applicable income tax treaty or agreement.
The gross amount of dividends paid to a non-U.S. holder that fails to certify its non-U.S. holder status in accordance with applicable U.S. Treasury regulations and fails to otherwise establish an exemption generally will be reduced by backup withholding at the applicable rate (currently 28%).
A non-U.S. holder is required to certify its non-U.S. status under penalties of perjury or otherwise establish an exemption in order to avoid information reporting and backup withholding on disposition proceeds where the transaction is effected by or through a U.S. office of a broker.
U.S. information reporting and backup withholding generally will not apply to a payment of proceeds of a disposition of common stock where the transaction is effected outside the United States through a non-U.S. office of a non-U.S. broker. However, information reporting requirements, but not backup withholding, generally will apply to such a payment if the broker is (i) a U.S. person; (ii) a foreign person that derives 50% or more of its gross income for certain periods from the conduct of a trade or business in the United States; (iii) a controlled foreign corporation as defined in the Code; (iv) a foreign partnership with certain U.S. connections, unless the broker has documentary evidence in its records that the holder is a non-U.S. holder and certain conditions are met or the holder otherwise establishes an exemption; or (v) a U.S. branch of a foreign bank or a foreign insurance company.
Backup withholding is not an additional tax. Amounts that we withhold under the backup withholding rules may be refunded or credited against the non-U.S. holder’s U.S. federal income tax liability, if any, provided that certain required information is furnished to the IRS in a timely manner. Non-U.S. holders should consult their own tax advisors regarding application of backup withholding in their particular circumstance and the availability of and procedure for obtaining an exemption from backup withholding under current U.S. Treasury regulations.
The foregoing discussion is only a summary of certain U.S. federal income and estate tax consequences of the acquisition, ownership and disposition of our common stock by non-U.S. holders. You are urged to consult your own tax advisor with respect to the particular tax consequences to you of ownership and disposition of our common stock, including the effect of any U.S., state, local, non-U.S. or other tax laws and any applicable income or estate tax treaty.
119
Table of Contents
Subject to the terms and conditions of the underwriting agreement, the underwriters named below, through their representatives Deutsche Bank Securities Inc. and Piper Jaffray & Co. have severally agreed to purchase from us the following respective number of shares of common stock at a public offering price less the underwriting discounts and commissions set forth on the cover page of this prospectus:
| Underwriters |
Number of Shares |
|||
| Deutsche Bank Securities Inc. |
||||
| Piper Jaffray & Co. |
||||
| Wells Fargo Securities, LLC |
||||
| Cowen and Company, LLC |
||||
| Raymond James & Associates, Inc. |
||||
|
|
|
|||
| Total |
5,000,000 | |||
|
|
|
|||
The underwriting agreement provides that the obligations of the several underwriters to purchase the shares of common stock offered hereby are subject to certain conditions precedent and that the underwriters will purchase all of the shares of common stock offered by this prospectus, other than those covered by the option to purchase additional shares of common stock described below, if any of these shares are purchased.
We have been advised by the representatives of the underwriters that the underwriters propose to offer the shares of common stock to the public at the public offering price set forth on the cover of this prospectus and to dealers at a price that represents a concession not in excess of $ per share under the public offering price. After the public offering, representatives of the underwriters may change the offering price and other selling terms.
The selling stockholder has granted to the underwriters an option, exercisable not later than 30 days after the date of this prospectus, to purchase up to 750,000 additional shares of common stock at the public offering price less the underwriting discounts and commissions set forth on the cover page of this prospectus. To the extent that the underwriters exercise this option, each of the underwriters will become obligated, subject to conditions, to purchase approximately the same percentage of these additional shares of common stock as the number of shares of common stock to be purchased by it in the above table bears to the total number of shares of common stock offered by this prospectus. The selling stockholder will be obligated, pursuant to the option, to sell these additional shares of common stock to the underwriters to the extent the option is exercised. If any additional shares of common stock are purchased, the underwriters will offer the additional shares on the same terms as those on which the 5,000,000 shares are being offered.
The underwriting discounts and commissions per share are equal to the public offering price per share of common stock less the amount paid by the underwriters to us per share of common stock. The underwriting discounts and commissions are % of the public offering price. We have agreed to pay the underwriters the following discounts and commissions, assuming either no exercise or full exercise by the underwriters of the underwriters’ option to purchase additional shares of common stock:
| Total Fees | ||||||||||||
| Fee Per Share |
Without Exercise of Option to Purchase Additional Shares |
With Full Exercise of Option to Purchase Additional Shares |
||||||||||
| Discounts and commissions paid by the selling stockholder |
$ | $ | $ | |||||||||
120
Table of Contents
In addition, we estimate the total expenses of this offering payable by us, excluding underwriting discounts and commissions, will be approximately $ million, which includes an amount not to exceed $15,000 that we have agreed to reimburse the underwriters for certain expenses incurred by them in connection with this offering.
We and the selling stockholder have agreed to indemnify the underwriters against some specified types of liabilities, including liabilities under the Securities Act, and to contribute to payments the underwriters may be required to make in respect of any of these liabilities.
Each of our officers and directors, and the selling stockholder, Lone Star Fund, which will beneficially own 34.0% (or 30.9% if the underwriters fully exercise their option to purchase additional shares) of our outstanding shares of common stock immediately after this offering, have agreed not to offer, sell, contract to sell or otherwise dispose of, or enter into any transaction that is designed to, or could be expected to, result in the disposition of any shares of our common stock or other securities convertible into or exchangeable or exercisable for shares of our common stock or derivatives of our common stock owned by these persons prior to this offering or common stock issuable upon exercise of options held by these persons for a period of 90 days after the effective date of the registration statement of which this prospectus is a part without the prior written consent of Deutsche Bank Securities Inc. and Piper Jaffray & Co. This consent may be given at any time without public notice except in limited circumstances. Transfers or dispositions can be made during the lock-up period in the case of gifts or for estate planning purposes and other limited circumstances where the transferee signs a lock-up agreement. We have entered into a similar agreement with the representatives of the underwriters. There are no agreements between the representatives and any of our stockholders or affiliates releasing them from these lock-up agreements prior to the expiration of the 90-day period.
The representatives of the underwriters have advised us that the underwriters do not intend to confirm sales to any account over which they exercise discretionary authority.
In connection with the offering, the underwriters may purchase and sell shares of our common stock in the open market. These transactions may include short sales, purchases to cover positions created by short sales and stabilizing transactions.
Short sales involve the sale by the underwriters of a greater number of shares than they are required to purchase in the offering. Covered short sales are sales made in an amount not greater than the underwriters’ option to purchase additional shares of common stock from us in the offering. The underwriters may close out any covered short position by either exercising their option to purchase additional shares or purchasing shares in the open market. In determining the source of shares to close out the covered short position, the underwriters will consider, among other things, the price of shares available for purchase in the open market as compared to the price at which they may purchase shares through the option to purchase additional shares of common stock.
Naked short sales are any sales in excess of the option to purchase additional shares of common stock. The underwriters must close out any naked short position by purchasing shares in the open market. A naked short position is more likely to be created if underwriters are concerned that there may be downward pressure on the price of the shares in the open market prior to the completion of the offering.
Stabilizing transactions consist of various bids for or purchases of our common stock made by the underwriters in the open market prior to the completion of the offering.
121
Table of Contents
The underwriters may impose a penalty bid. This occurs when a particular underwriter repays to the other underwriters a portion of the underwriting discount received by it because the representatives of the underwriters have repurchased shares sold by or for the account of that underwriter in stabilizing or short covering transactions.
Purchases to cover a short position and stabilizing transactions may have the effect of preventing or slowing a decline in the market price of our common stock. Additionally, these purchases, along with the imposition of the penalty bid, may stabilize, maintain or otherwise affect the market price of our common stock. As a result, the price of our common stock may be higher than the price that might otherwise exist in the open market. These transactions may be effected on the NASDAQ Global Select Market, in the over-the-counter market or otherwise.
A prospectus in electronic format is being made available on Internet web sites maintained by one or more of the lead underwriters of this offering and may be made available on web sites maintained by other underwriters. Other than the prospectus in electronic format, the information on any underwriter’s web site and any information contained in any other web site maintained by an underwriter is not part of the prospectus or the registration statement of which the prospectus forms a part.
Some of the underwriters or their affiliates have provided investment banking services to us in the past and may do so in the future. They receive customary fees and commissions for these services. In addition, the selling stockholder may be deemed an underwriter in connection with this offering.
Notice to Investors in the European Economic Area
In relation to each Member State of the European Economic Area which has implemented the Prospectus Directive (each, a Relevant Member State) an offer to the public of any shares which are the subject of the offering contemplated by this prospectus may not be made in that Relevant Member State other than the offers contemplated in the prospectus once the prospectus has been approved by the competent authority in such Member State and published and passported in accordance with the Prospectus Directive as implemented in the Relevant Member State except that an offer to the public in that Relevant Member State of any shares may be made at any time under the following exemptions under the Prospectus Directive, if they have been implemented in that Relevant Member State:
| • | to legal entities which are authorized or regulated to operate in the financial markets or, if not so authorized or regulated, whose corporate purpose is solely to invest in securities; |
| • | to any legal entity which has two or more of (1) an average of at least 250 employees during the last financial year; (2) a total balance sheet of more than €43,000,000 and (3) an annual net turnover of more than €50,000,000, as shown in its last annual or consolidated accounts; |
| • | by the underwriters to fewer than 100 natural or legal persons (other than qualified investors as defined in the Prospectus Directive) subject to obtaining the prior consent of the underwriters for any such offer; or |
| • | in any other circumstances falling within Article 3(2) of the Prospectus Directive, |
provided that no such offer of shares shall result in a requirement for the publication by the Issuer or any underwriter of a prospectus pursuant to Article 3 of the Prospectus Directive.
122
Table of Contents
For the purposes of this provision, the expression an “offer to the public” in relation to any shares in any Relevant Member State means the communication in any form and by any means of sufficient information on the terms of the offer and any shares to be offered so as to enable an investor to decide to purchase any shares, as the same may be varied in that member state by any measure implementing the Prospectus Directive in that member state and the expression “Prospectus Directive” means Directive 2003/71/EC and includes any relevant implementing measure in each Relevant Member State.
Notice to Investors in the United Kingdom
Each underwriter has represented and agreed that (a) it has only communicated and will only communicate or cause to be communicated an invitation or inducement to engage in investment activity (within the meaning of Section 21 of the Financial Services and Markets Act 2000, or the FSMA, received by it in connection with the issue or sale of the shares (i) to investment professionals falling within Article 19(5) of the Financial Services and Markets Act 2000 (Financial Promotion) Order 2005, or the Order, or (ii) to high net worth entities, and other persons to whom it may lawfully be communicated, falling within Article 49(2)(a) and (d) of the Order, with all such persons together being referred to as relevant persons, and (b) it has complied and will comply with all applicable provisions of the FSMA with respect to anything done by it in relation to the shares of our common stock in, from or otherwise involving the United Kingdom. This prospectus and its contents are confidential and should not be distributed, published or reproduced (in whole or in part) or disclosed by recipients to any other persons in the United Kingdom. Any person in the United Kingdom that is not a relevant person should not act or rely on this document or any of its contents.
Notice to Prospective Investors in Hong Kong
The shares may not be offered or sold in Hong Kong by means of any document other than (i) in circumstances which do not constitute an offer to the public within the meaning of the Companies Ordinance (Cap. 32, Laws of Hong Kong), or (ii) to “professional investors” within the meaning of the Securities and Futures Ordinance (Cap. 571, Laws of Hong Kong) and any rules made thereunder, or (iii) in other circumstances which do not result in the document being a “prospectus” within the meaning of the Companies Ordinance (Cap. 32, Laws of Hong Kong) and no advertisement, invitation or document relating to the shares may be issued or may be in the possession of any person for the purpose of issue (in each case whether in Hong Kong or elsewhere), which is directed at, or the contents of which are likely to be accessed or read by, the public in Hong Kong (except if permitted to do so under the laws of Hong Kong) other than with respect to shares which are or are intended to be disposed of only to persons outside Hong Kong or only to “professional investors” within the meaning of the Securities and Futures Ordinance (Cap. 571, Laws of Hong Kong) and any rules made thereunder.
Notice to Prospective Investors in Singapore
This prospectus has not been registered as a prospectus with the Monetary Authority of Singapore. Accordingly, this prospectus and any other document or material in connection with the offer or sale, or invitation for subscription or purchase, of the shares may not be circulated or distributed, nor may the shares be offered or sold, or be made the subject of an invitation for subscription or purchase, whether directly or indirectly, to persons in Singapore other than (i) to an institutional investor under Section 274 of the Securities and Futures Act, Chapter 289 of Singapore, or the SFA, (ii) to a relevant person pursuant to Section 275(1), or any person pursuant to Section 275(1A), and in accordance with the conditions specified in Section 275 of
123
Table of Contents
the SFA or (iii) otherwise pursuant to, and in accordance with the conditions of, any other applicable provision of the SFA, in each case subject to compliance with conditions set forth in the SFA.
Where the shares are subscribed or purchased under Section 275 of the SFA by a relevant person which is:
| • | a corporation (which is not an accredited investor (as defined in Section 4A of the SFA)) the sole business of which is to hold investments and the entire share capital of which is owned by one or more individuals, each of whom is an accredited investor; or |
| • | a trust (where the trustee is not an accredited investor) whose sole purpose is to hold investments and each beneficiary of the trust is an individual who is an accredited investor, |
shares, debentures and units of shares and debentures of that corporation or the beneficiaries’ rights and interest (howsoever described) in that trust shall not be transferred within six months after that corporation or that trust has acquired the shares pursuant to an offer made under Section 275 of the SFA except:
| • | to an institutional investor (for corporations, under Section 274 of the SFA) or to a relevant person defined in Section 275(2) of the SFA, or to any person pursuant to an offer that is made on terms that such shares, debentures and units of shares and debentures of that corporation or such rights and interest in that trust are acquired at a consideration of not less than S$200,000 (or its equivalent in a foreign currency) for each transaction, whether such amount is to be paid for in cash or by exchange of securities or other assets, and further for corporations, in accordance with the conditions specified in Section 275 of the SFA; |
| • | where no consideration is or will be given for the transfer; or |
| • | where the transfer is by operation of law. |
Notice to Prospective Investors in Japan
The shares of common stock have not been and will not be registered under the Financial Instruments and Exchange Law, as amended (the “FIEL”). Each underwriter has represented and agreed that the shares which it purchases will be purchased by it as principal and that, in connection with the offering, it will not, directly or indirectly, offer or sell any shares in Japan or to, or for the benefit of, any resident of Japan (which term as used herein means any person resident in Japan, including any corporation or entity organized under the laws of Japan) or to others for reoffer or resale, directly or indirectly, in Japan or to, or for the benefit of, any resident of Japan, except pursuant to an exemption from the registration requirements under the FIEL and otherwise in compliance with such law and any other applicable laws, regulations and ministerial guidelines of Japan.
Notice to Prospective Investors in Switzerland
The prospectus does not constitute an issue prospectus pursuant to Article 652a or Article 1156 of the Swiss Code of Obligations, and the shares will not be listed on the SIX Swiss Exchange. Therefore, the prospectus may not comply with the disclosure standards of the Swiss Code of Obligations and/or the listing rules (including any prospectus schemes) of the SIX Swiss Exchange. Accordingly, the shares may not be offered to the public in or from Switzerland, but only to a selected and limited circle of investors, which do not subscribe to the shares with a view to distribution.
124
Table of Contents
Notice to Prospective Investors in Qatar
The shares described in this prospectus have not been, and will not be, offered, sold or delivered, at any time, directly or indirectly in the State of Qatar in a manner that would constitute a public offering. This prospectus has not been, and will not be, registered with or approved by the Qatar Financial Markets Authority or Qatar Central Bank and may not be publicly distributed. This prospectus is intended for the original recipient only and must not be provided to any other person. It is not for general circulation in the State of Qatar and may not be reproduced or used for any other purpose.
Notice to Prospective Investors in Saudi Arabia
No offering, whether directly or indirectly, will be made to an investor in the Kingdom of Saudi Arabia unless such offering is in accordance with the applicable laws of the Kingdom of Saudi Arabia and the rules and regulations of the Capital Market Authority, including the Capital Market Law of the Kingdom of Saudi Arabia. The shares will not be marketed or sold in the Kingdom of Saudi Arabia by us or the underwriters.
This prospectus may not be distributed in the Kingdom of Saudi Arabia except to such persons as are permitted under the Office of Securities Regulation issued by the Capital Market Authority. The Saudi Arabian Capital Market Authority does not make any representation as to the accuracy or completeness of this prospectus and expressly disclaims any liability whatsoever for any loss arising from, or incurred in reliance upon, any part of this prospectus. Prospective purchasers of the shares offered hereby should conduct their own due diligence on the accuracy of the information relating to the shares. If you do not understand the contents of this prospectus, you should consult an authorized financial advisor.
Notice to Prospective Investors in the United Arab Emirates
This offering has not been approved or licensed by the Central Bank of the United Arab Emirates (UAE), Securities and Commodities Authority of the UAE and/or any other relevant licensing authority in the UAE including any licensing authority incorporated under the laws and regulations of any of the free zones established and operating in the territory of the UAE, in particular the Dubai Financial Services Authority (DFSA), a regulatory authority of the Dubai International Financial Centre (DIFC). The offering does not constitute a public offer of securities in the UAE, DIFC and/or any other free zone in accordance with the Commercial Companies Law, Federal Law No 8 of 1984 (as amended), DFSA Offered Securities Rules and NASDAQ Dubai Listing Rules, accordingly, or otherwise. The shares may not be offered to the public in the UAE and/or any of the free zones.
The shares may be offered and issued only to a limited number of investors in the UAE or any of its free zones who qualify as sophisticated investors under the relevant laws and regulations of the UAE or the free zone concerned.
125
Table of Contents
The validity of the shares of common stock offered hereby will be passed upon for us by Gibson, Dunn & Crutcher LLP. Certain legal matters in connection with this offering will be passed upon for the underwriters by White & Case LLP.
The consolidated financial statements of the Company at December 27, 2011 and December 25, 2012 and for each of the three fiscal years in the period ended December 25, 2012 appearing in this prospectus and registration statement have been audited by Ernst & Young LLP, independent registered public accounting firm, as set forth in their report thereon appearing elsewhere herein, and are included in reliance upon such report, given on the authority of such firm as experts in accounting and auditing.
WHERE YOU CAN FIND MORE INFORMATION
We have filed with the SEC a registration statement on Form S-1, including exhibits, of which this prospectus is a part, under the Securities Act with respect to the shares of common stock to be sold in this offering. This prospectus does not contain all of the information set forth in the registration statement and exhibits and schedules to the registration statement. For further information with respect to our company and the shares of common stock to be sold in this offering, reference is made to the registration statement, including the exhibits and schedules to the registration statement. This prospectus summarizes material provisions of contracts and other documents to which we refer you. Since the prospectus may not contain all of the information that you may find important, you should review the full text of these contracts and other documents. We have included or incorporated by reference copies of these documents as exhibits to our registration statement.
We file annual, quarterly and current reports and other information with the SEC. Those filings and the registration statement, including the exhibits thereto, are, and will continue to be, available to the public on the SEC’s website at www.sec.gov. Those filings also are, and will continue to be, available to the public on, or accessible through, our corporate web site at www.dfrg.com. The information contained on or accessible through our corporate web site is not part of this prospectus or the registration statement of which this prospectus forms a part. You may also examine any document we file with the SEC, including the registration statement of which this prospectus forms a part, including the exhibits thereto, without charge at the public reference room of the SEC, 100 F Street, N.E., Washington, DC 20549. Information about the operation of the public reference room may be obtained by calling the SEC at 1-800-SEC-0330. Copies of all or a portion of the registration statement can be obtained from the public reference room of the SEC upon payment of prescribed fees.
126
Table of Contents
INDEX TO CONSOLIDATED FINANCIAL STATEMENTS
| F-2 | ||||
| Consolidated Financial Statements—December 28, 2010, December 27, 2011, and December 25, 2012: |
||||
| F-3 | ||||
| F-4 | ||||
| F-5 | ||||
| F-6 | ||||
| F-7 | ||||
| Unaudited Interim Condensed Consolidated Financial Statements—June 11, 2013 and June 12, 2012: |
||||
| F-32 | ||||
| F-33 | ||||
| F-34 | ||||
| F-35 | ||||
| F-36 | ||||
F-1
Table of Contents
REPORT OF INDEPENDENT REGISTERED PUBLIC ACCOUNTING FIRM
The Board of Directors
Del Frisco’s Restaurant Group, Inc.
We have audited the accompanying consolidated balance sheets of Del Frisco’s Restaurant Group, Inc. (the Company) as of December 25, 2012 and December 27, 2011, and the related consolidated statements of income and comprehensive income, changes in stockholders’ equity, and cash flows for each of the three fiscal years in the period ended December 25, 2012. These financial statements are the responsibility of the Company’s management. Our responsibility is to express an opinion on these financial statements based on our audits.
We conducted our audits in accordance with the standards of the Public Company Accounting Oversight Board (United States). Those standards require that we plan and perform the audit to obtain reasonable assurance about whether the financial statements are free of material misstatement. We were not engaged to perform an audit of the Company’s internal control over financial reporting. Our audit included consideration of internal control over financial reporting as a basis for designing audit procedures that are appropriate in the circumstances, but not for the purpose of expressing an opinion on the effectiveness of the Company’s internal control over financial reporting. Accordingly, we express no such opinion. An audit also includes examining, on a test basis, evidence supporting the amounts and disclosures in the financial statements, assessing the accounting principles used and significant estimates made by management, and evaluating the overall financial statement presentation. We believe that our audits provide a reasonable basis for our opinion.
In our opinion, the financial statements referred to above present fairly, in all material respects, the consolidated financial position of the Company at December 25, 2012 and December 27, 2011, and the consolidated results of its operations and its cash flows for each of the three fiscal years in the period ended December 25, 2012, in conformity with U.S. generally accepted accounting principles.
/s/ Ernst & Young LLP
Dallas, Texas
February 26, 2013
F-2
Table of Contents
DEL FRISCO’S RESTAURANT GROUP, INC. AND SUBSIDIARIES
(Dollars in thousands)
| December 27, 2011 |
December 25, 2012 |
|||||||
| Assets |
||||||||
| Current assets: |
||||||||
| Cash and cash equivalents |
$ | 14,119 | $ | 10,763 | ||||
| Restricted cash |
976 | 215 | ||||||
| Inventory |
9,891 | 12,103 | ||||||
| Deferred income taxes |
1,748 | 2,067 | ||||||
| Lease incentives receivable |
241 | 3,092 | ||||||
| Prepaid expenses and other |
4,255 | 4,758 | ||||||
|
|
|
|
|
|||||
| Total current assets |
31,230 | 32,998 | ||||||
| Property and equipment: |
||||||||
| Land and land improvements |
1,963 | 2,120 | ||||||
| Buildings |
1,418 | 1,455 | ||||||
| Leasehold improvements |
81,579 | 105,976 | ||||||
| Furniture, fixtures, and equipment |
21,276 | 30,253 | ||||||
|
|
|
|
|
|||||
| 106,236 | 139,804 | |||||||
| Less accumulated depreciation |
(25,728 | ) | (34,236 | ) | ||||
|
|
|
|
|
|||||
| 80,508 | 105,568 | |||||||
| Assets held for sale |
1,850 | — | ||||||
| Deferred compensation plan investments |
6,159 | 7,802 | ||||||
| Other assets: |
||||||||
| Goodwill |
76,103 | 75,365 | ||||||
| Intangible assets, net |
36,493 | 36,391 | ||||||
| Loan costs, net of accumulated amortization of $168 in 2011 and $4 in 2012 |
1,868 | 45 | ||||||
| Other |
63 | 216 | ||||||
|
|
|
|
|
|||||
| 114,527 | 112,017 | |||||||
|
|
|
|
|
|||||
| Total assets |
$ | 234,274 | $ | 258,385 | ||||
|
|
|
|
|
|||||
| Liabilities and Stockholders’ Equity |
||||||||
| Current liabilities: |
||||||||
| Accounts payable |
$ | 7,491 | $ | 8,804 | ||||
| Sales tax payable |
1,299 | 1,687 | ||||||
| Accrued payroll |
5,913 | 6,262 | ||||||
| Real estate taxes |
417 | 331 | ||||||
| Accrued self-insurance |
1,581 | 1,662 | ||||||
| Deferred revenue |
8,074 | 10,314 | ||||||
| Income taxes payable |
60 | 1,768 | ||||||
| Deferred rent obligations, current |
833 | 1,314 | ||||||
| Other |
2,622 | 1,611 | ||||||
|
|
|
|
|
|||||
| Total current liabilities |
28,290 | 33,753 | ||||||
| Long-term debt, less current maturities |
70,000 | — | ||||||
| Other noncurrent liabilities |
4,748 | 4,880 | ||||||
| Deferred compensation plan liabilities |
6,969 | 8,415 | ||||||
| Deferred rent obligations |
16,314 | 22,644 | ||||||
| Deferred tax liabilities |
12,081 | 10,792 | ||||||
|
|
|
|
|
|||||
| Total liabilities |
138,402 | 80,484 | ||||||
| Commitments and contingencies |
||||||||
| Stockholders’ equity: |
||||||||
| Preferred stock, $0.001 par value , 10,000,000 shares authorized, no shares issued and outstanding at December 27, 2011 or December 25, 2012 |
— | — | ||||||
| Common stock, $0.001 par value , 190,000,000 shares authorized, 17,994,667 shares issued and outstanding at December 27, 2011 and 23,794,667 shares issued and outstanding at December 25, 2012 |
18 | 24 | ||||||
| Additional paid in capital |
51,341 | 119,610 | ||||||
| Retained earnings |
44,513 | 58,267 | ||||||
| Accumulated other comprehensive income |
— | — | ||||||
|
|
|
|
|
|||||
| Total stockholders’ equity |
95,872 | 177,901 | ||||||
|
|
|
|
|
|||||
| Total liabilities and stockholders’ equity |
$ | 234,274 | $ | 258,385 | ||||
|
|
|
|
|
|||||
See accompanying notes.
F-3
Table of Contents
DEL FRISCO’S RESTAURANT GROUP, INC. AND SUBSIDIARIES
CONSOLIDATED STATEMENTS OF INCOME AND COMPREHENSIVE INCOME
(Dollars in thousands, except share and per share data)
| Fiscal Year Ended | ||||||||||||
| December 28, 2010 |
December 27, 2011 |
December 25, 2012 |
||||||||||
| Revenues |
$ | 162,855 | $ | 198,625 | $ | 232,435 | ||||||
| Costs and expenses: |
||||||||||||
| Costs of sales |
49,481 | 60,743 | 71,093 | |||||||||
| Restaurant operating expenses |
71,917 | 86,311 | 100,143 | |||||||||
| Marketing and advertising costs |
2,744 | 4,246 | 4,682 | |||||||||
| Pre-opening costs |
798 | 3,018 | 4,058 | |||||||||
| General and administrative costs |
7,512 | 10,640 | 13,449 | |||||||||
| Management and accounting fees paid to related party |
3,345 | 3,399 | 1,252 | |||||||||
| Asset advisory agreement termination fee |
— | — | 3,000 | |||||||||
| Public offering transaction bonuses |
— | — | 1,462 | |||||||||
| Depreciation and amortization |
6,459 | 6,998 | 8,675 | |||||||||
|
|
|
|
|
|
|
|||||||
| Operating income |
20,599 | 23,270 | 24,621 | |||||||||
| Other income (expense), net: |
||||||||||||
| Interest expense-affiliates |
(1,775 | ) | — | — | ||||||||
| Interest expense-other |
(9,906 | ) | (6,355 | ) | (2,920 | ) | ||||||
| Write-off of debt issuance costs |
— | (2,501 | ) | (1,649 | ) | |||||||
| Other, net |
(249 | ) | (114 | ) | 113 | |||||||
|
|
|
|
|
|
|
|||||||
| Income from continuing operations before income taxes |
8,669 | 14,300 | 20,165 | |||||||||
| Income tax expense (benefit) |
(88 | ) | 4,653 | 5,592 | ||||||||
|
|
|
|
|
|
|
|||||||
| Income from continuing operations |
$ | 8,757 | $ | 9,647 | $ | 14,573 | ||||||
|
|
|
|
|
|
|
|||||||
| Discontinued operations, net of income tax benefit |
(27 | ) | (674 | ) | (819 | ) | ||||||
|
|
|
|
|
|
|
|||||||
| Net income |
$ | 8,730 | $ | 8,973 | $ | 13,754 | ||||||
|
|
|
|
|
|
|
|||||||
| Basic and diluted income (loss) per common share: |
||||||||||||
| Continuing operations |
$ | 0.49 | $ | 0.54 | $ | 0.71 | ||||||
| Discontinued operations |
(0.00 | ) | (0.04 | ) | (0.04 | ) | ||||||
|
|
|
|
|
|
|
|||||||
| Basic and diluted income per share |
$ | 0.49 | $ | 0.50 | $ | 0.67 | ||||||
|
|
|
|
|
|
|
|||||||
| Shares used in computing net income (loss) per common share: |
||||||||||||
| Basic and diluted |
17,994,667 | 17,994,667 | 20,432,579 | |||||||||
|
|
|
|
|
|
|
|||||||
| Comprehensive income (loss): |
||||||||||||
| Realized loss on cash flow hedge |
367 | — | — | |||||||||
|
|
|
|
|
|
|
|||||||
| Other comprehensive income before tax |
367 | — | — | |||||||||
| Income tax benefit related to other comprehensive income |
(147 | ) | — | — | ||||||||
|
|
|
|
|
|
|
|||||||
| Other comprehensive income, net of tax |
220 | — | — | |||||||||
|
|
|
|
|
|
|
|||||||
| Comprehensive income |
$ | 8,950 | $ | 8,973 | $ | 13,754 | ||||||
|
|
|
|
|
|
|
|||||||
See accompanying notes.
F-4
Table of Contents
DEL FRISCO’S RESTAURANT GROUP, INC. AND SUBSIDIARIES
CONSOLIDATED STATEMENT OF CHANGES IN STOCKHOLDERS’ EQUITY
(Dollars in thousands)
| Common Stock | Additional Paid |
Retained | Accumulated Other Comprehensive |
|||||||||||||||||||||
| Shares | Par Value | In Capital | Earnings | Income | Total | |||||||||||||||||||
| Balance at December 29, 2009 |
17,994,667 | $ | 18 | $ | 4,300 | $ | 26,810 | $ | (220 | ) | $ | 30,908 | ||||||||||||
| Comprehensive income |
— | — | — | 8,730 | 220 | 8,950 | ||||||||||||||||||
| Contribution by majority shareholder |
— | — | 47,127 | — | 47,127 | |||||||||||||||||||
| Equity-based compensation |
— | — | 170 | — | — | 170 | ||||||||||||||||||
|
|
|
|
|
|
|
|
|
|
|
|
|
|||||||||||||
| Balance at December 28, 2010 |
17,994,667 | $ | 18 | $ | 51,597 | $ | 35,540 | $ | — | $ | 87,155 | |||||||||||||
| Comprehensive income |
— | — | — | 8,973 | — | 8,973 | ||||||||||||||||||
| Cash distribution |
— | — | (357 | ) | — | (357 | ) | |||||||||||||||||
| Equity-based compensation |
— | — | 101 | — | — | 101 | ||||||||||||||||||
|
|
|
|
|
|
|
|
|
|
|
|
|
|||||||||||||
| Balance at December 27, 2011 |
17,994,667 | $ | 18 | $ | 51,341 | $ | 44,513 | $ | — | $ | 95,872 | |||||||||||||
|
|
|
|
|
|
|
|
|
|
|
|
|
|||||||||||||
| Comprehensive income |
— | — | — | 13,754 | — | 13,754 | ||||||||||||||||||
| Share-based compensation costs |
— | — | 378 | — | — | 378 | ||||||||||||||||||
| Issuance of common stock for initial public offering, net of fees and issuance costs |
5,800,000 | 6 | 66,451 | 66,457 | ||||||||||||||||||||
| Contribution by majority shareholder (see Note 4) |
— | — | 1,440 | — | — | 1,440 | ||||||||||||||||||
|
|
|
|
|
|
|
|
|
|
|
|
|
|||||||||||||
| Balance at December 25, 2012 |
23,794,667 | $ | 24 | $ | 119,610 | $ | 58,267 | $ | — | $ | 177,901 | |||||||||||||
|
|
|
|
|
|
|
|
|
|
|
|
|
|||||||||||||
See accompanying notes.
F-5
Table of Contents
DEL FRISCO’S RESTAURANT GROUP, INC. AND SUBSIDIARIES
CONSOLIDATED STATEMENTS OF CASH FLOWS
(In Thousands)
| Fiscal Year Ended | ||||||||||||
| December 28, 2010 |
December 27, 2011 |
December 25, 2012 |
||||||||||
| Cash flows from operating activities: |
||||||||||||
| Net income |
$ | 8,730 | $ | 8,973 | $ | 13,754 | ||||||
| Adjustments to reconcile net income to net cash provided by operating activities: |
||||||||||||
| Depreciation and amortization |
6,624 | 7,146 | 8,809 | |||||||||
| Loss on disposal of restaurant property |
— | — | 103 | |||||||||
| Write-off of goodwill associated with disposed restaurant property |
— | — | 738 | |||||||||
| Write-off of deferred debt issuance costs |
— | 2,501 | 1,649 | |||||||||
| Loan cost amortization |
872 | 627 | 222 | |||||||||
| Non-cash interest charge—affiliate |
1,775 | — | — | |||||||||
| Non-cash equity based compensation |
170 | 101 | 378 | |||||||||
| Non-cash impairment charges |
— | 1,400 | — | |||||||||
| Deferred income taxes |
(317 | ) | (1,623 | ) | (1,608 | ) | ||||||
| Amortization of deferred lease incentives |
(100 | ) | (172 | ) | (285 | ) | ||||||
| Changes in operating assets and liabilities: |
||||||||||||
| Restricted cash |
— | (976 | ) | 761 | ||||||||
| Inventories |
(155 | ) | (1,230 | ) | (2,212 | ) | ||||||
| Other assets |
(1,392 | ) | (550 | ) | (2,146 | ) | ||||||
| Accounts payable |
(2,366 | ) | 4,358 | 1,313 | ||||||||
| Income taxes |
2,127 | 2,492 | 1,840 | |||||||||
| Deferred rent obligations |
2,452 | 829 | 4,245 | |||||||||
| Other liabilities |
43 | 4,627 | 3,407 | |||||||||
| Payments attributable to accrued interest included in advances due affiliate |
(6,464 | ) | — | — | ||||||||
|
|
|
|
|
|
|
|||||||
| Net cash provided by operating activities |
11,999 | 28,503 | 30,968 | |||||||||
| Cash flows from investing activities: |
||||||||||||
| Proceeds from sale-leaseback transaction |
4,345 | 13,235 | — | |||||||||
| Proceeds from sale of property and equipment |
— | — | 1,682 | |||||||||
| Purchases of property and equipment |
(5,550 | ) | (20,063 | ) | (33,635 | ) | ||||||
| Other |
(5 | ) | (323 | ) | (220 | ) | ||||||
|
|
|
|
|
|
|
|||||||
| Net cash used in investing activities |
(1,210 | ) | (7,151 | ) | (32,173 | ) | ||||||
| Cash flows from financing activities: |
||||||||||||
| Proceeds from issuance of common stock, net of underwriter fees and issuance costs |
— | — | 66,457 | |||||||||
| Proceeds from long-term debt |
— | 71,800 | — | |||||||||
| Payments of long-term debt |
(26,353 | ) | (80,722 | ) | (70,000 | ) | ||||||
| Deferred debt issuance costs |
— | (2,111 | ) | (48 | ) | |||||||
| Advances due to affiliate |
(40,663 | ) | — | — | ||||||||
| Contribution from (distribution to) majority shareholder |
47,127 | (357 | ) | 1,440 | ||||||||
|
|
|
|
|
|
|
|||||||
| Net cash provided by (used in) financing activities |
(19,889 | ) | (11,390 | ) | (2,151 | ) | ||||||
| Net increase (decrease) in cash and cash equivalents |
(9,100 | ) | 9,962 | (3,356 | ) | |||||||
| Cash and cash equivalents at beginning of period |
13,257 | 4,157 | 14,119 | |||||||||
|
|
|
|
|
|
|
|||||||
| Cash and cash equivalents at end of period |
$ | 4,157 | $ | 14,119 | $ | 10,763 | ||||||
|
|
|
|
|
|
|
|||||||
| Supplemental disclosures of cash flow information: |
||||||||||||
| Cash paid for interest |
$ | 10,109 | $ | 5,567 | $ | 3,127 | ||||||
|
|
|
|
|
|
|
|||||||
| Cash paid for income taxes |
$ | (1,939 | ) | $ | 3,279 | $ | 5,283 | |||||
|
|
|
|
|
|
|
|||||||
| Noncash investing and financing activities: |
||||||||||||
| Deemed distribution to parent |
$ | — | $ | 477 | $ | — | ||||||
|
|
|
|
|
|
|
|||||||
See accompanying notes.
F-6
Table of Contents
DEL FRISCO’S RESTAURANT GROUP, INC. AND SUBSIDIARIES
NOTES TO CONSOLIDATED FINANCIAL STATEMENTS
(Dollars in thousands)
(1) Organization and Basis of Presentation
Background
Del Frisco’s Restaurant Group, Inc. (the Company) is incorporated in Delaware as a corporation. Prior to its initial public offering (“IPO”) in 2012, the Company was a wholly owned subsidiary of LSF5 Wagon Holdings, LLC (Wagon), which is a wholly owned subsidiary of LSF5 COI Holdings, LLC (Holdings), which is majority owned by Lone Star Fund V (U.S.), L.P. (the Fund), which is a private investment fund.
Effective December 13, 2006, the Fund, through Holdings, acquired all of the outstanding capital stock of Lone Star Steakhouse & Saloon, Inc. (Star), through a series of transactions pursuant to an Agreement and Plan of Merger (the Acquisition). Prior to the Acquisition, Star was a public company that owned and operated steakhouse restaurants under four different restaurant brands, which included Lone Star Steakhouse & Saloon (Lone Star), Texas Land & Cattle Steak House (TXLC), Sullivan’s Steakhouse (Sullivan’s), and Del Frisco’s Double Eagle Steak House (Del Frisco’s).
In connection with the Acquisition, Holdings contributed all of the assets, restaurant operations, trade names, and other intangible assets of its Lone Star and TXLC restaurants to LSF5 Cowboy Holdings, LLC (Casual Dining Companies), which is a wholly owned subsidiary of Holdings. In addition, LS Management, Inc. (LSM), which was previously a wholly owned subsidiary of Star that provided all of the accounting, legal, and other administrative support to all of Star’s restaurants, was contributed to the Casual Dining Companies. Concurrently, the remaining assets and restaurant operations of Star, which primarily included the Del Frisco’s and Sullivan’s restaurants as well as LS Finance, LLC which was previously a wholly owned subsidiary of Star that provided all of the cash management and treasury support to all of Star’s restaurants, were contributed to the Company.
On July 26, 2012, the Company priced a $75,400 IPO of 5.8 million shares of common stock at $13.00 per share. On July 27, 2012, the Company’s common stock began trading on the NASDAQ Global Select Market under the ticker symbol “DFRG.” Upon the August 1, 2012 closing of the IPO, the Company received net proceeds of $70,122, reflecting $5,278 of underwriting discounts and commissions. Additionally, the Company incurred $3,666 in offering costs that reduced the net proceeds available to additional paid in capital. At the completion of the IPO, an entity controlled by the Fund (together with its affiliates, but excluding the Company and other companies that it or they own or control as a result of their investment activities) owned approximately 18.0 million shares of common stock, or approximately 75.6% of the Company’s outstanding shares.
Prior to the IPO closing, the Company converted from a limited liability company to a corporation and in connection therewith, the Company’s then-outstanding membership interests were converted into approximately 18.0 million shares of Company common stock (the “Conversion”). All issued and outstanding common stock and per share amounts contained in the financial statements have been retroactively adjusted to reflect the Conversion. As part of the IPO, the Company established its authorized shares at 10,000,000 shares of preferred stock, $0.001 par value per share, and 190,000,000 shares of common stock, $0.001 par value per share. At August 1, 2012, the closing date of the IPO, the Company had a total of approximately 23.8 million common shares issued and outstanding.
F-7
Table of Contents
The Company used a portion of the net proceeds from the IPO to repay $61,000 of amounts outstanding under its credit facility on August 1, 2012. In addition, the Company used $3,000 of the net proceeds to make a one-time payment an affiliate of the Fund in consideration for the termination of an asset advisory agreement upon consummation of the IPO, which is reflected as an operating expense in the consolidated statements of income and comprehensive income. The remainder of the net proceeds will be used for working capital and other general corporate purposes. In conjunction with the repayment of amounts outstanding under the credit facility, the Company wrote-off $1,649 in unamortized debt issuance costs in the third quarter of fiscal 2012.
Description of Business
The Company owns and operates restaurants in the upscale steakhouse market under the brand names of Del Frisco’s Double Eagle Steak House (“Del Frisco’s”), Sullivan’s Steakhouse (“Sullivan’s”), and Del Frisco’s Grille (“Grille”). As of December 25, 2012 the Company owned and operated 10 Del Frisco’s, 19 Sullivan’s and five Del Frisco’s Grille restaurants. During 2010, the Company opened a Sullivan’s restaurant in Seattle, Washington. During fiscal 2011, the Company opened a Del Frisco’s in Boston, Massachusetts and Del Frisco’s Grilles in New York City and Dallas, Texas. During fiscal 2012, the Company opened Del Frisco’s Grilles in Phoenix, Arizona, Washington, D.C., and Atlanta, Georgia as well as a Del Frisco’s in Chicago, Illinois.
(2) Summary of Significant Accounting Policies
Principles of Consolidation
The consolidated financial statements include the accounts of the Company and its wholly owned subsidiaries. All significant intercompany accounts and transactions have been eliminated.
Fiscal Year
The Company operates on a 52- or 53-week fiscal year ending the last Tuesday in December. Fiscal 2010, 2011 and 2012 included 52 weeks of operations.
Concentrations
The Company has certain financial instruments exposed to a concentration of credit risk, which consist primarily of cash and cash equivalents. The Company places cash with high-credit-quality financial institutions, and, at times, such cash may be in excess of the federal depository insurance limit. The Company has cash equivalents of approximately $575 and $0 at December 27, 2011 and December 25, 2012, respectively, in money market mutual funds.
Additionally, the Company purchased 100% of total beef purchases from four suppliers during fiscal 2010, 2011, and 2012, respectively. Due to the nature of the beef purchases, there are alternative sources of supply available; however, a change in suppliers could potentially cause increased costs.
Use of Estimates
The preparation of the consolidated financial statements in conformity with accounting principles generally accepted in the United States requires management to make estimates and assumptions that affect the amounts reported in the consolidated financial statements and accompanying notes. Actual results could differ from those estimates.
F-8
Table of Contents
Cash and Cash Equivalents
Cash and cash equivalents include currency on hand, demand deposits with banks or other financial institutions, credit card receivables, and short-term investments with maturities of three months or less when purchased. Cash and cash equivalents are carried at cost, which approximates fair value.
Financial Instruments
The Company considers the carrying amounts of cash and cash equivalents, short-term investments, receivables, advances due to affiliate, and accounts payable to approximate fair value based on the short-term nature of these items. Borrowings available under the credit facility at December 25, 2012 have variable interest rates that reflect currently available terms and conditions for similar debt.
Derivative Instruments and Hedging Activities
The Company records all derivatives on the consolidated balance sheets at fair value. Derivatives qualify for treatment as hedges when there is a high correlation between the change in fair value of the derivative instrument and the related change in value of the underlying hedged item. Derivatives that are not accounted for as hedges or the ineffective portions of qualifying hedges must be adjusted to fair value through earnings. For qualifying hedges, the effective portion of the derivative’s gain or loss is initially reported as a component of other comprehensive income (OCI) and subsequently reclassified into income when the hedged exposure affects income.
Cash flow hedges related to anticipated transactions are designated and documented at the inception of each hedge by matching the terms of the contract to the underlying transaction as well as its risk management objective and strategy for undertaking the hedge. The Company classifies the cash flows from hedging transactions in the same categories on the statements of income and comprehensive income as the cash flows from the respective hedged items. Once established, cash flow hedges are generally not removed until maturity unless an anticipated transaction is no longer likely to occur. The Company does not engage in trading activities with its financial instruments.
The only derivative instruments used by the Company were settled during the 2010 fiscal year. The realized loss upon settlement was $200, net of income tax.
Inventories
Inventories, which primarily consist of food and beverages, are valued at the lower of cost, using the first-in, first-out (FIFO) method, or market.
Property and Equipment
Property and equipment are stated at cost. Maintenance, repairs, and renewals that do not enhance the value of or increase the lives of the assets are expensed as incurred. Buildings are depreciated using the straight-line method over their estimated useful lives of 20 to 25 years. Leasehold improvements are amortized using the straight-line method over the lesser of the estimated useful lives of the assets of 20 years or the expected term of the lease, including cancelable optional renewal periods when failure to exercise such renewal options would result in an economic penalty to the Company. Furniture, fixtures, and equipment are depreciated using the straight-line method over three to seven years, which are the estimated useful lives of the assets.
F-9
Table of Contents
Interest is capitalized in connection with the construction of restaurant facilities. The capitalized interest is recorded as part of the asset to which it relates and is amortized over the asset’s estimated useful life. Capitalized interest was $0, $204 and $104 for the years ended December 28, 2010, December 27, 2011 and December 25, 2012, respectively.
Operating Leases
The Company leases restaurants under operating leases. The majority of the Company’s leases provide for rent escalation clauses, contingent rental expense, and/or tenant improvement allowances.
Rent expense is recognized on a straight-line basis over the expected term of the lease, which includes cancelable optional renewal periods that are reasonably assured to be exercised and where failure to exercise such renewal options would result in an economic penalty to the Company.
Certain of the Company’s operating leases contain clauses that provide additional contingent rent based on a percentage of sales greater than certain specified target amounts. The Company recognizes contingent rent expense prior to the achievement of the specified target that triggers the contingent rent, provided achievement of that target is considered probable.
The Company records tenant improvement allowances and other landlord incentives as a component of deferred rent which is amortized on a straight-line basis over the expected term of the lease.
Preopening Costs
Preopening costs, including labor costs, costs of hiring and training personnel, and certain other costs related to opening new restaurants, are expensed when the costs are incurred.
Deferred Offering Costs
Other current assets at December 27, 2011 include deferred offering costs of $820, which reflects the costs incurred by the Company during 2011 in connection with the initial public offering of common stock. Such costs were charged to additional paid-in-capital at the time the IPO was completed in 2012.
Goodwill and Other Intangible Assets
The Company’s intangible assets primarily include goodwill, trade names, and licensing agreements. The Company’s trade names include “Del Frisco’s Double Eagle Steak House” and “Sullivan’s Steakhouse,” both of which have indefinite lives and, accordingly, are not subject to amortization. The trade names are used in the advertising and marketing of the restaurants and are widely recognized and accepted by consumers in their respective markets for providing its customers an enjoyable fine-dining experience. Goodwill represents the excess of costs over the fair value of the net assets acquired.
Goodwill and intangible assets that have indefinite useful lives are not amortized. However, both goodwill and trade names are subject to annual impairment testing. The Company amortizes its finite-lived intangible assets on a straight-line basis over the estimated period of benefit, generally seven to 17 years. See Note 3 for additional information.
F-10
Table of Contents
The impairment evaluation for goodwill is conducted annually using a two-step process. In the first step, the fair value of each reporting unit is compared to the carrying amount of the reporting unit, including goodwill. The estimated fair value of the reporting unit is determined using discounted cash flows and a market-based approach. If the estimated fair value of the reporting unit is less than the carrying amount of the reporting unit, then a second step must be completed in order to determine the amount of the goodwill impairment that should be recorded. In the second step, the implied fair value of the reporting unit’s goodwill is determined by allocating the reporting unit’s fair value to all of its assets and liabilities, other than goodwill, in a manner similar to a purchase price allocation. If the resulting implied fair value of the goodwill that results from the application of this second step is less than the carrying amount of the goodwill, an impairment charge is recorded for the difference. Currently, the Company defines the reporting units to be Del Frisco’s and Sullivan’s concepts. The Company performs its annual impairment test as of its year-end.
The evaluation of the carrying amount of other intangible assets with indefinite lives is made annually by comparing the carrying amount of these assets to their estimated fair value. The estimated fair value is determined on the basis of existing market-based conditions as well as discounted future cash flow or the royalty-relief method for trade names. If the estimated fair value is less than the carrying amount, an impairment charge is recorded to reduce the asset to its estimated fair value.
The valuation approaches used to determine fair value of each reporting unit and other intangible assets are subject to key judgments and assumptions about revenue growth rates, operating margins, weighted average cost of capital and comparable company and acquisition market multiples. When developing these key judgments and assumptions, which are sensitive to change, management considers economic, operational and market conditions that could impact the fair value. The judgments and assumptions used are consistent with what management believes hypothetical market participants would use. However, estimates are inherently uncertain and represent only reasonable expectations regarding future developments.
Loan Costs
Loan costs are stated at cost and amortized using the effective interest method over the life of the related loan.
Deferred Compensation Plan
In connection with the Company’s deferred-compensation plan, the Company has created a grantor trust to which it contributes amounts equal to employee participants’ qualified deferrals and the Company’s matching portion. The plan is informally funded using life insurance policies and mutual funds held by the grantor trust. All assets held by the grantor trust remain the property of the Company; however, the Company does not currently intend to use such assets for any purpose other than to fund payments to the participants pursuant to the terms of the deferred-compensation plan. The assets of the plan consist principally of cash surrender values of the life insurance policies. Because the investment assets of the deferred-compensation plan are assets of the Company and would be subject to general claims by creditors in the event of the Company’s insolvency, the accompanying consolidated balance sheets reflect such investments as assets, with a liability for deferred compensation reflected in long-term liabilities for amounts owed to employees. Subsequent to the end of fiscal 2012, the mutual fund investments were sold and the proceeds were used to purchase additional life insurance policies.
F-11
Table of Contents
Impairment of Long-Lived Assets
Property and equipment and finite-life intangibles are reviewed for impairment whenever events or changes in circumstances indicate the carrying amount of an asset may not be recoverable. The Company reviews applicable finite-lived intangible assets and long-lived assets related to each restaurant on a periodic basis. The Company’s assessment of recoverability of property and equipment and finite-lived intangible assets is performed at the component level, which is generally an individual restaurant. When events or changes in circumstances indicate an asset may not be recoverable, the Company estimates the future cash flows expected to result from the use of the asset. If the sum of the expected undiscounted future cash flows is less than the carrying value of the asset, an impairment loss is recognized. The impairment loss is recognized by measuring the difference between the carrying value of the assets and the estimated fair value of the assets. The Company’s estimates of fair values are based on the best information available and require the use of estimates, judgments, and projections. The actual results may vary significantly from the estimates.
During fiscal 2011, the Company determined that the carrying amount of one of its Sullivan’s restaurants was most likely not recoverable. Therefore, the Company recorded a non-cash impairment charge of $1,400, which represents the difference between the carrying value of the restaurant assets and their estimated fair value, which was based on an estimated sales price. As this restaurant was closed and sold in fiscal 2012 (see Note 16), this amount is included in loss from discontinued operations in the consolidated statements of income and comprehensive income.
Self-Insurance Reserves
The Company maintains self-insurance programs for its workers’ compensation and general liability insurance programs. In order to minimize the exposure under the self-insurance programs, the Company has purchased stop-loss coverage both on a per-occurrence and on an aggregate basis. The self-insured losses under the programs are accrued based on the Company’s estimate of the ultimate expected liability for both claims incurred and on an incurred but not reported basis. The establishment of such accruals for self-insurance involves certain management judgments and assumptions regarding the frequency or severity of claims, the historical patterns of claim development, and the Company’s experience with claim-reserve management and settlement practices. To the extent actual results differ from the assumptions used to develop the accruals, such unanticipated changes may produce significantly different amounts of expense than those estimated under the self-insurance programs.
Income Taxes
The Company uses the asset and liability method of accounting for income taxes. Under this method, deferred tax assets and liabilities are determined based on differences between financial reporting and tax basis of assets and liabilities and are measured using the enacted tax rates and laws that will be in effect when the differences are expected to reverse. The Company regularly evaluates the likelihood of realization of tax benefits derived from positions it has taken in various federal and state filings after consideration of all relevant facts, circumstances, and available information. For those tax benefits deemed more likely than not that will be sustained, the Company recognizes the benefit it believes is cumulatively greater than 50% likely to be realized. To the extent the Company were to prevail in matters for which accruals have been established or be required to pay amounts in excess of recorded reserves, the effective tax rate in a given financial statement period could be materially impacted.
F-12
Table of Contents
Advertising Costs
Advertising costs are expensed as incurred. Advertising expense for the fiscal years ended December 28, 2010, December 27, 2011, and December 25, 2012 was $2,744, $4,246 and $4,682, respectively.
Revenue Recognition
Revenue from restaurant sales is recognized when food and beverage products are sold. Proceeds from the sale of gift cards are recorded as deferred revenue at the time of sale and recognized as income when the gift card is redeemed by the holder or the likelihood of redemption becomes remote (gift card breakage) and the Company determines there is no legal obligation to remit the value of the unredeemed gift cards to governmental agencies. The Company determines the gift card breakage rate based upon historical redemption patterns. Certain of the Company’s gift cards are sold on a discount and the net value (face value to be redeemed less the discount offered) is deferred until redeemed or breakage is deemed appropriate. The Company has deemed gift card breakage income immaterial for fiscal years 2010, 2011 and 2012, and it is included in revenues in the consolidated statements of income and comprehensive income. The Company excludes from revenue any taxes assessed by governmental agencies that are directly imposed on revenue-producing transactions between the Company and a customer.
Stock-Based Compensation
In connection with the IPO, the Company adopted the Del Frisco’s Restaurant Group, Inc. 2012 Long-Term Equity Incentive Plan (the “2012 Plan”), which allows the Company’s Board of Directors to grant stock options, restricted stock, restricted stock units, deferred stock units and other equity-based awards to directors, officers, key employees and other key individuals performing services for the Company. The Company recognizes stock-based compensation in accordance with “Compensation—Stock Compensation,” FASB ASC Topic 718 (Topic 718). Stock-based compensation cost includes compensation cost for all share-based payments granted based on the grant date fair value estimated in accordance with the provisions of Topic 718. Compensation cost is recognized on a straight-line basis, net of estimated forfeitures, over the requisite service period of each award.
Reclassifications
Certain amounts from the prior years have been reclassified to conform with the fiscal 2012 presentation.
Recently Issued Accounting Standards
In May 2011, the Financial Accounting Standards Board (FASB) issued Accounting Standards Update (ASU) 2011-04, Fair value Measurement (Topic 820), Amendments to Achieve Common Fair Value Measurement and Disclosure Requirements in U.S. GAAP and IFRS. Many of the amendments in this update change the wording used in the existing guidance to better align generally accepted accounting principles in the United States with International Financial Reporting Standards and to clarify the FASB’s intent on various aspects of the fair value guidance. The update also requires increased disclosure of quantitative information about unobservable inputs used in a fair value measurement that is categorized within Level 3 of the fair value hierarchy. The update is effective for the Company beginning in fiscal 2012 and should be applied prospectively. Other than requiring additional disclosures, the new guidance did not have a significant impact on the Company’s consolidated financial statements upon adoption.
F-13
Table of Contents
In June 2011, the FASB issued ASU 2011-05, Comprehensive Income (Topic 220), Presentation of Comprehensive Income, which requires the Company to present the total of comprehensive income, the components of net income, and the components of other comprehensive income either in a single continuous statement of comprehensive income or in two separate but consecutive statements. The update eliminates the option to present the components of other comprehensive income as part of the statement of equity. In December 2011, the FASB issued ASU 2011-12, Comprehensive Income (Topic 220), Deferral of Effective Date for Amendments to the Presentation of Reclassifications of Items Out of Accumulated Other Comprehensive Income in ASU 2011-05, to defer the effective date of the specific requirement to present items that are reclassified out of accumulated other comprehensive income to net income alongside their respective components of net income and other comprehensive income. All other provisions of the update are effective for the Company in fiscal 2012 and have been applied retrospectively.
In September 2011, the FASB issued ASU 2011-08, Intangible-Goodwill and Other (Topic 350), Testing Goodwill for Impairment, which permits an entity to make a qualitative assessment of whether it is more likely than not that a reporting unit’s fair value is less than its carrying value before applying the two-step goodwill impairment model that is currently in place. If it is determined through qualitative assessment that a reporting unit’s fair value is more likely than not greater than its carrying value, the remaining impairment steps would be unnecessary. The qualitative assessment is optional, allowing the Company to go directly to the quantitative assessment. All provisions of the update are effective for the Company in fiscal 2012. The Company does not believe the new guidance had a significant impact on its consolidated financial statements.
In July 2012, the Financial Accounting Standards Board issued Accounting Standards Update (“ASU”) 2012-02, Intangibles—Goodwill and Other (Topic 350), Testing Indefinite Lived Intangible Assets for Impairment. This ASU simplifies the guidance for impairment testing of indefinite-lived intangible assets other than goodwill and gives companies the option to assess qualitative factors to determine whether it is necessary to perform a quantitative impairment test. Companies electing to perform a qualitative assessment are no longer required to calculate the fair value of an indefinite-lived intangible asset unless the company determines, based on a qualitative assessment, that it is “more likely than not” that the asset is impaired. This update is effective for annual and interim impairment tests performed in fiscal years beginning after September 15, 2012; however, early adoption is permitted. The Company does not believe adoption of this new guidance will have a significant impact on our consolidated financial statements.
F-14
Table of Contents
(3) Intangible Assets and Goodwill
| December 27, 2011 |
December 25, 2012 |
|||||||
| (In Thousands) | ||||||||
| Amortized intangible assets: |
||||||||
| Gross carrying amount: |
||||||||
| Favorable leasehold interests |
$ | 848 | $ | 848 | ||||
| Licensing and development rights |
1,077 | 1,077 | ||||||
| Other |
198 | 265 | ||||||
|
|
|
|
|
|||||
| 2,123 | 2,190 | |||||||
| Accumulated amortization: |
||||||||
| Favorable leasehold interests |
(549 | ) | (639 | ) | ||||
| Licensing and development rights |
(333 | ) | (399 | ) | ||||
| Other |
(26 | ) | (39 | ) | ||||
|
|
|
|
|
|||||
| (908 | ) | (1,077 | ) | |||||
|
|
|
|
|
|||||
| Net amortized intangible assets |
$ | 1,215 | $ | 1,113 | ||||
|
|
|
|
|
|||||
| Unamortized intangible assets: |
||||||||
| Goodwill |
$ | 76,103 | $ | 75,365 | ||||
| Trade names |
34,893 | 34,893 | ||||||
| Liquor license permits |
385 | 385 | ||||||
|
|
|
|
|
|||||
| $ | 111,381 | $ | 110,643 | |||||
|
|
|
|
|
|||||
Licensing contract rights and favorable lease rights are being amortized using the straight-line method over the estimated lives of the related contracts and agreements, which are seven to nine years for favorable leasehold interest and 17 years for licensing contract rights. Liquor licenses that are transferable are carried at cost. Such licenses are reviewed for impairment on an annual basis.
Goodwill is allocated to the Del Frisco’s and Sullivan’s reporting units, respectively, as follows: $43,928 and $32,175 at December 27, 2011 and $43,928 and $31,437 at December 25, 2012 . A portion of the goodwill allocated to the Sullivan’s location that was sold in fiscal 2012 was written off in fiscal 2012. See Note 16 for further discussion of discontinued operations.
The Company has estimated that annual amortization expense will amount to approximately $167 for 2013, $153 for 2014, $126 for 2015, $90 for 2016, and $82 for 2017.
Amortization expense was $175, $166 and $169 for the years ended December 28, 2010, December 27, 2011, and December 25, 2012, respectively.
During fiscal 2010, the Company’s remaining tax deductible goodwill was fully amortized. The Company performed the annual test for impairment of goodwill and intangible assets and concluded that no impairment existed as of December 28, 2010, December 27, 2011 or December 25, 2012; accordingly, no impairment losses were recorded.
On February 1, 2012, the Company entered into an agreement to terminate a license agreement with the licensee operating a Del Frisco’s in Orlando, Florida effective June 1, 2013. The original licensing agreement has been amortized over the expected term of the agreement, and has a remaining book value of $678 as of December 25, 2012. Under the agreement, in exchange for the Company surrendering its right to receive licensing fees from January 1, 2012
F-15
Table of Contents
through June 1, 2013 and making a one-time $25 payment to the licensee, the Company will have the rights to open and operate any of its restaurants in the three counties that make up the Orlando metropolitan area no earlier than January 1, 2015. The Company accounted for this as an exchange of non-monetary assets, for which the Company has concluded that the fair value of the asset surrendered approximates its book value and therefore no gain or loss has been recorded on the exchange. To determine the fair value of the asset surrendered, the Company utilized a discounted cash flow method that applied a discount rate of 10.5%, the Company’s weighted-average cost of capital, to the future estimated cash flows to be received over the remaining term, including expected renewal, of the license agreement.
(4) Related Party Transactions
Management and Accounting Fees Paid to Related Party
Management and accounting fees paid to related party include charges from LSM, which is an indirect wholly owned subsidiary of the Fund. These charges totaled $1,275, $269, and $0 for the years ended December 28, 2010, December 27, 2011 and December 25, 2012, respectively. The charges were primarily for accounting, risk management, human resources and benefits administration, legal, management information services, and other shared support services. The amounts that are included in management fees to related party in the accompanying consolidated statements of income and comprehensive income were charged pursuant to a shared service agreement formerly between the Company and LSM, which was terminated at the beginning of fiscal 2011. The Company cannot estimate with reasonable certainty what the charges for similar services would have been on a stand-alone basis. However, the Company believes that the charges are indicative of what it would have incurred on a stand-alone basis.
At the date of Acquisition, the Company entered into an agreement with Hudson Advisors, L.L.C. (Hudson), an affiliate of certain entities that holds an indirect investment interest in the Company. Pursuant to the agreement, Hudson provides certain asset management and advisory services to the Company. During the years ended December 28, 2010, December 27, 2011, and December 25, 2012, the Company incurred charges for such services of $2,070, $3,129, and $1,252, respectively. This agreement was terminated upon consummation of the IPO, as discussed in Note 1.
Transaction Bonuses
In connection with the IPO, certain executives of the Company earned transaction bonuses of $1,462. These bonuses were earned under a letter agreement, as amended, with Wagon, in which certain executives of the Company are eligible to receive a transaction bonus upon the occurrence of an eligible transaction. Wagon is responsible to fund the transaction bonus. As this bonus is contingent upon employment with the Company, the Company is required to record the expense of these bonuses and recognize the funding by Wagon as additional paid in capital. $1,462 was recorded as an expense to the Company and $1,440 was recorded as a capital contribution by Wagon in fiscal 2012, which was used by the Company to pay these bonuses. A similar transaction bonus will be recognized on any future eligible transactions in which Wagon sells, in whole or part, its interest in the Company.
General and Administrative Expenses
Upon completion of the IPO, the Company entered into a Transition Services Agreement with an affiliate of the Fund to provide certain limited support services, including legal and risk management, until the Company can complete transition of these functions to internal or
F-16
Table of Contents
third-party resources. General and administrative expenses include charges of approximately $73 for these services in fiscal 2012.
Advances Due to Affiliates
During the year ended December 28, 2010, the Company incurred interest expense of $1,775 under the advances due to affiliate. These advances were in the form of an unsecured promissory note bearing interest at 4.65%, for which the principal and interest were due December 31, 2014. During fiscal 2010, the Casual Dining Companies transferred their interest in the advances due from the Company to the Company’s Parent. In November 2010, the Company paid the advances in full from proceeds of a cash capital contribution from its Parent in the amount of $47,127.
The average balance of the advances due to affiliates was approximately $39,124 for the year ended December 28, 2010. Transactions during the periods presented consisted of the following items:
| December 28, 2010 |
||||
| (In Thousands) | ||||
| Beginning balance |
$ | 45,269 | ||
| Interest accrued on advances due to affiliates |
1,775 | |||
| Other |
83 | |||
| Payments |
(47,127 | ) | ||
|
|
|
|||
| Ending balance |
$ | — | ||
|
|
|
|||
For cash flow presentation purposes, the Company accounts for the interest accrued on advances due to affiliates as a noncash charge to income as the accrued interest is added to the principal of the debt as payment in kind. The in-kind amounts paid in 2010 are presented as an operating activity as such amounts were settled in cash.
(5) Leases
The Company leases certain facilities under noncancelable operating leases with terms expiring between 2013 and 2034. The leases have renewal options ranging from five to 20 years, which are exercisable at the Company’s option. In addition, certain leases contain escalation clauses based on a fixed percentage increase and provisions for contingent rentals based on a percentage of gross revenues, as defined. Total rental expense amounted to $8,228, $11,170, and $13,065 including contingent rentals of approximately $1,751, $2,682, and $3,240 for the years ended December 28, 2010, December 27, 2011, and December 25, 2012, respectively.
Future minimum lease payments under noncancelable operating leases include renewal option periods for certain leases when such option periods are included for purposes of calculating straight-line rents. At December 25, 2012, future minimum rentals for each of the next five years and in total are as follows:
| 2013 |
$ | 11,936 | ||
| 2014 |
12,571 | |||
| 2015 |
12,522 | |||
| 2016 |
12,660 | |||
| 2017 |
12,435 | |||
| Thereafter |
141,950 | |||
|
|
|
|||
| Total minimum lease payments |
$ | 204,074 | ||
|
|
|
F-17
Table of Contents
During 2010, the Company entered into a sale-leaseback arrangement with a private investor group. Under the arrangement, the Company sold the land and building of its Sullivan’s restaurant located in Chicago, Illinois and leased a portion of the facility back for a term of 10 years with options to renew. The sale-leaseback transaction did not provide for any continuing involvement by the Company other than a normal lease where the Company uses the property during the lease term. The lease was accounted for as an operating lease. The net proceeds from the transaction of approximately $3,853 were used to reduce the Company’s indebtedness under its credit facility. The Company realized a gain of approximately $743 which has been deferred and is being amortized over the life of the lease as a reduction in rent expense.
During 2011, the Company entered into a sale-leaseback arrangement with a private investor group. Under the arrangement, the Company sold the land and building of two of its Del Frisco’s restaurants located in Denver, Colorado and Ft. Worth, Texas and leased them back for a term of 15 years with options to renew. The sale-leaseback transactions do not provide for any continuing involvement by the Company other than a normal lease where the Company intends to use the property during the lease term. The leases were accounted for as operating leases. The aggregate annual lease obligation for the first year of the arrangement is approximately $1,151 with lease rental escalating every five years thereafter. The net proceeds from the transaction were approximately $13,235. Approximately $10,405 of the net proceeds were used to pay down the Company’s indebtedness under its credit facility. The Company realized a gain of approximately $8,699 which has been deferred as a component of deferred rent obligations and is being amortized over the life of the leases as a reduction in rent expense.
(6) Income Taxes
Total income tax expense (benefit) for fiscal years 2010, 2011, and 2012 was allocated as follows (in thousands):
| Year Ended | ||||||||||||
| December 28, 2010 |
December 27, 2011 |
December 25, 2012 |
||||||||||
| Income tax expense (benefit) from continuing operations |
$ | (88 | ) | $ | 4,653 | $ | 5,592 | |||||
| Income tax expense (benefit) from discontinued operations |
(41 | ) | (504 | ) | (2 | ) | ||||||
|
|
|
|
|
|
|
|||||||
| Total income tax expense (benefit) |
$ | (129 | ) | $ | 4,149 | $ | 5,590 | |||||
|
|
|
|
|
|
|
|||||||
F-18
Table of Contents
The components of income tax expense (benefit) from continuing operations consists of the following (in thousands):
| Year Ended | ||||||||||||
| December 28, 2010 |
December 27, 2011 |
December 25, 2012 |
||||||||||
| Current tax expense (benefit): |
||||||||||||
| Federal |
$ | (2,303 | ) | $ | 3,179 | $ | 5,406 | |||||
| State |
2,537 | 2,250 | 2,220 | |||||||||
|
|
|
|
|
|
|
|||||||
| Total current tax expense (benefit) |
234 | 5,429 | 7,626 | |||||||||
| Deferred tax expense (benefit): |
||||||||||||
| Federal |
(281 | ) | (287 | ) | (1,098 | ) | ||||||
| State |
(41 | ) | (489 | ) | (936 | ) | ||||||
|
|
|
|
|
|
|
|||||||
| Total deferred tax expense (benefit) |
(322 | ) | (776 | ) | (2,034 | ) | ||||||
|
|
|
|
|
|
|
|||||||
| Total income tax expense (benefit) from continuing operations |
$ | (88 | ) | $ | 4,653 | $ | 5,592 | |||||
|
|
|
|
|
|
|
|||||||
The difference between the reported income tax expense (benefit) from continuing operations and taxes determined by applying the applicable U.S. federal statutory income tax rate to income before taxes from continuing operations is reconciled as follows (dollars in thousands):
| Year Ended | ||||||||||||||||||||||||
| December 28, 2010 |
December 27, 2011 |
December 25, 2012 |
||||||||||||||||||||||
| Income tax expense at federal statutory rate |
$ | 3,034 | 35 | % | $ | 5,005 | 35 | % | $ | 7,058 | 35 | % | ||||||||||||
| State tax expense, net |
522 | 6 | % | 831 | 6 | % | 443 | 2 | % | |||||||||||||||
| FICA tip and work opportunity credits |
(1,474 | ) | -17 | % | (1,743 | ) | -12 | % | (2,200 | ) | -10 | % | ||||||||||||
| Nondeductible (nontaxable) insurance |
(237 | ) | -3 | % | 450 | 3 | % | (160 | ) | -1 | % | |||||||||||||
| Other items, net |
(1,933 | ) | -22 | % | 110 | 1 | % | 451 | 2 | % | ||||||||||||||
|
|
|
|
|
|
|
|
|
|
|
|
|
|||||||||||||
| Total income tax expense (benefit) from continuing operations |
$ | (88 | ) | -1 | % | $ | 4,653 | 33 | % | $ | 5,592 | 28 | % | |||||||||||
|
|
|
|
|
|
|
|
|
|
|
|
|
|||||||||||||
In fiscal 2010, Other items, net consisted primarily of a $3,683 tax benefit for the reversal of previously reserved unrecognized tax benefits resulting from the expiration of the statute of limitations in 2010 relating to various uncertain tax positions. The impact of the reversal was partially offset by an additional provision of $1,503 related to income tax accruals provided for various newly identified uncertain tax positions.
F-19
Table of Contents
Deferred income taxes reflect the net effects of temporary differences between the carrying amounts of assets and liabilities for financial reporting purposes and amounts used for income tax purposes. Significant components of deferred tax assets and liabilities are presented below (in thousands):
| December 27, 2011 |
December 25, 2012 |
|||||||
| (In Thousands) | ||||||||
| Deferred tax assets: |
||||||||
| Equity-based compensation |
$ | 366 | $ | 151 | ||||
| Accrued liabilities |
2,197 | 2,629 | ||||||
| Deferred compensation |
2,848 | 3,366 | ||||||
| Deferred rent liabilities |
3,198 | 6,212 | ||||||
| Other |
2,101 | 2,880 | ||||||
|
|
|
|
|
|||||
| Total deferred tax assets |
10,710 | 15,239 | ||||||
| Deferred tax liabilities: |
||||||||
| Property and equipment |
7,559 | 11,759 | ||||||
| Intangible assets |
13,384 | 11,960 | ||||||
| Other |
100 | 245 | ||||||
|
|
|
|
|
|||||
| Total deferred tax liabilities |
21,043 | 23,964 | ||||||
|
|
|
|
|
|||||
| Net deferred tax liabilities |
$ | (10,333 | ) | $ | (8,725 | ) | ||
|
|
|
|
|
|||||
The Company accounts for unrecognized tax benefits in accordance with the provisions of FASB guidance which, among other directives, requires uncertain tax positions to be recognized only if they are more likely than not to be upheld based on their technical merits. The measurement of the uncertain tax position is based on the largest benefit amount that is more likely than not (determined on a cumulative probability basis) to be realized upon settlement.
The Company may, from time to time, be assessed interest or penalties by major tax jurisdictions, although any such assessments historically have been minimal and immaterial to the Company’s financial results. In the event the Company receives an assessment for interest and penalties, it has been classified in the consolidated financial statements as income tax expense. Generally, the Company’s federal, state, and local tax returns for years subsequent to 2008 remain open to examination by the major taxing jurisdictions to which the Company is subject.
At December 27, 2011 and December 25, 2012, the Company’s unrecognized tax benefits totaled approximately $1,631, related primarily to acquisitions and state tax issues. In 2010, the change in the unrecognized tax benefits, as reflected in the Other, net line of the effective tax rate reconciliation above, primarily relates to the release of exposure items due to the expiration of the statute of limitations, offset by additions for positions taken in prior years. The Company does not believe its uncertain tax positions will change materially during the next 12 months. A
F-20
Table of Contents
reconciliation of the beginning and ending amount of unrecognized tax benefits is as follows (in thousands):
| Year Ended | ||||||||||||
| December 28, 2010 |
December 27, 2011 |
December 25, 2012 |
||||||||||
| Balance at beginning of year |
$ | 4,133 | $ | 1,691 | $ | 1,631 | ||||||
| Additions resulting from current year positions |
— | — | — | |||||||||
| Additions for positions taken in prior years |
804 | — | — | |||||||||
| Expiration of statute of limitations |
(3,246 | ) | (60 | ) | — | |||||||
|
|
|
|
|
|
|
|||||||
| Balance at end of year |
$ | 1,691 | $ | 1,631 | $ | 1,631 | ||||||
|
|
|
|
|
|
|
|||||||
The Company accrues interest and penalties in its tax provision. As of December 27, 2011 and December 25, 2012, accrued interest and penalties included in the consolidated balance sheets totaled $2,245 and $2,457, respectively. The change in interest and penalties associated with the Company’s unrecognized tax benefits is included as a component of the Other, net line of the effective tax rate reconciliation.
(7) Long-Term Debt
On September 26, 2012, the Company terminated its 2011 credit facility and on October 15, 2012 entered into a new credit facility that provides for a three-year unsecured revolving credit facility of up to $25,000. Borrowings under the new credit facility bear interest at a rate of LIBOR plus 1.50%. The Company is required to pay a commitment fee equal to 0.25% per annum on the available but unused revolving loan facility. The credit facility is guaranteed by certain subsidiaries of the Company. The new credit facility contains various financial covenants, including a maximum ratio of total indebtedness to EBITDA, as defined in the credit agreement, and minimum fixed charge coverage, as defined in the credit agreement. The new credit facility also contains covenants restricting certain corporate actions, including asset dispositions, acquisitions, the payment of dividends, changes of control, the incurrence of indebtedness and providing financing or other transactions with affiliates. The Company was in compliance with all of the debt covenants as of December 25, 2012. As of December 25, 2012, there were no outstanding borrowings under the new credit facility.
As of December 25, 2012, the outstanding balance on the Company’s revolving credit facility was $0. Under the revolving loan commitment, the Company had approximately $25,000 of borrowings available under its revolving credit facility, less $761 in letter of credit commitments.
On July 29, 2011, the Company terminated its amended 2007 credit facility and replaced it with the 2011 credit facility that provides for a five-year term loan of $70,000 and a five-year revolving credit facility of up to $10,000. Borrowings under the 2011 credit facility bore interest at a rate between LIBOR plus 4.75% and LIBOR plus 5.75%, depending on the Company’s leverage ratio. Interest was payable quarterly. Principal payments were due in quarterly payments of $875 commencing September 30, 2013 with the balance due July 29, 2016. The Company was required to pay a commitment fee equal to 0.5% per annum on the available but unused revolving loan facility. The 2011 credit facility was secured by substantially all of the Company’s assets. The 2011 credit facility contained various financial covenants, including a maximum ratio of total indebtedness to EBITDA, as defined in the credit agreement, a minimum
F-21
Table of Contents
amount of EBITDA plus corporate general and administrative expenses, a minimum ratio of EBITDA plus certain non-recurring items to fixed charges (including consolidated capital expenses) and a minimum level of liquidity, as defined in the credit agreement. The 2011 credit facility also contained covenants restricting certain corporate actions, including asset dispositions, acquisitions, the payment of dividends, changes of control, the incurrence of indebtedness and providing financing or other transactions with affiliates. The Company was in compliance with all of the debt covenants as of December 27, 2011. During 2012 the Company repaid all remaining balances outstanding on the 2011 credit facility with proceeds from the IPO. Under the terms of the facility, the full payoff of both the term loan and the revolving credit facility effectively terminated the 2011 facility as of September 4, 2012.
On October 5, 2009, the Company amended its 2007 credit facility. The amended facility provided for term loans of $106,025 and up to an aggregate of $16,000 in revolving commitments, which could be used as lines of credit or letters of credit. In connection with the amendment, the Company was required to make an additional $1,500 principal payment in October 2009. Principal was payable in quarterly installments of $750 beginning December 29, 2009, with a final balloon payment due in July 2014. In addition, the Company was required to make additional principal payments of up to 100% of excess cash flows, as defined in the amended credit facility agreement, until the outstanding combined principal balance is less than or equal to $75,000, at which time the Company was required to make additional principal payments of up to 80% of excess cash flows. The additional principal payment required for 2009 pursuant to the excess cash flow calculation was $6,000 and was paid in March 2010. There were no additional principal payments required for 2010 due to voluntary principal payments made during 2010. Amounts available under the revolving commitments were permanently reduced in consecutive quarterly installments of $250, commencing March 23, 2010. The amendment also increased the interest rates payable by the Company. Interest was payable at a rate that is determinable by the Company to equal either (i) a Base Rate, or (ii) a Eurodollar Rate as defined in the agreement, plus an additional 5.5% to 8.0% depending on the senior debt rating of the Company and the outstanding combined principal balance of the loans (9.25% at December 28, 2010). In addition, the Company was required to pay a commitment fee equal to 0.75% per annum on the available but unused revolving loan facility. The amendment reduced the existing financial covenant requirements to three, including an interest coverage ratio, an adjusted debt leverage ratio and a minimum EBITDAR requirement. The amendment also placed additional limitations on the amount of new restaurant capital expenditures the Company could invest.
(8) Retirement Plans
The Company provides two retirement benefit plans to participants. The salary-reduction plans are provided through a qualified 401(k) plan and a nonqualified deferred compensation plan (the Plans). Under the Plans, employees who meet minimum service requirements and elect to participate may make contributions of up to 15% of their annual salaries under the 401(k) plan and up to 80% under the deferred-compensation plan. The Company may make additional contributions at the discretion of the Board of Directors. Expenses related to the Plans for the years ended, December 28, 2010, December 27, 2011 and December 25, 2012, totaled $909, $1,006, and $1,256, respectively.
(9) Litigation
The Company is involved, from time to time, in litigation arising in the ordinary course of business. The Company believes the outcome of such matters will not have a material adverse effect on its consolidated financial position or results of operations.
F-22
Table of Contents
(10) Stockholders’ Equity
In November 2010, the Company received a cash equity contribution from its Parent in the amount of $47,127. The proceeds from the equity contribution were used to retire in full certain advances due affiliate (see Note 4 for additional information).
(11) Commitments and Contingencies
Prior to the Acquisition, the Company guaranteed certain lease payments of Star’s subsidiaries in connection with the leasing of real estate for restaurant locations. As of December 25, 2012, the Company was responsible as guarantor for five of the leases of its affiliates. The leases expire at various times through 2016. These guarantees will require payment by the Company only in an event of default by the affiliate where it is unable to make the required lease payments. During 2010 and 2011, the Company incurred expenses of $280 and $130 in connection with certain of these guarantees in return for releases from such guarantees which are included in other expenses. Management believes that any future payments required under these guarantees will not be significant. At December 25, 2012 the maximum potential amount of future payments the Company could be required to make as a result of the guarantees was $1,997.
At December 25, 2012 the Company had outstanding letters of credit of $976, of which $215 were collateralized by restricted cash and $761 were outstanding on the Company’s revolving credit facility. The letters of credit typically act as guarantee of payment to certain third parties in accordance with specified terms and conditions.
(12) Fair Value Measurement
Under generally accepted accounting principles in the United States, the Company is required to measure certain assets and liabilities at fair value, or to disclose the fair value of certain assets and liabilities recorded at cost. Pursuant to these fair value measurement and disclosure requirements, fair value is defined as the price that would be received upon sale of an asset or paid upon transfer of a liability in an orderly transaction between market participants at the measurement date and in the principal or most advantageous market for that asset or liability. The fair value is calculated based on assumptions that market participants would use in pricing the asset or liability, not on assumptions specific to the entity. In addition, the fair value of liabilities includes consideration of non-performance risk, including the Company’s own credit risk. Each fair value measurement is reported in one of the following three levels:
| • | Level 1—valuation inputs are based upon unadjusted quoted prices for identical instruments traded in active markets. |
| • | Level 2—valuation inputs are based upon quoted prices for similar instruments in active markets, quoted prices for identical or similar instruments in markets that are not active, and model-based valuation techniques for which all significant assumptions are observable in the market or can be corroborated by observable market data for substantially the full term of the assets or liabilities. |
| • | Level 3—valuation inputs are unobservable and typically reflect management’s estimates of assumptions that market participants would use in pricing the asset or liability. The fair values are therefore determined using model-based techniques that include option pricing models, discounted cash flow models, and similar techniques. |
F-23
Table of Contents
The following tables present our financial assets and liabilities measured at fair value on a recurring basis at December 27, 2011 and December 25, 2012 (in thousands):
| Fair Value Measurements | ||||||||||||
| Level | December 27, 2011 |
December 25, 2012 |
||||||||||
| Deferred compensation plan investments (life insurance policies) |
2 | $ | 6,159 | $ | 5,586 | |||||||
| Deferred compensation plan investments (mutual funds) |
1 | $ | — | $ | 2,216 | |||||||
| Deferred compensation plan liabilities |
2 | $ | (7,023 | ) | $ | (8,415 | ) | |||||
There were no transfers among levels within the fair value hierarchy during the years ended December 27, 2011 or December 25, 2012.
The Company has no derivative instruments at December 27, 2011 or December 25, 2012.
The following table presents our non-financial assets measured at fair value on a non- recurring basis at December 27, 2011 and December 25, 2012 (in thousands):
| Fair Value Measurements | ||||||||||||
| Level | December 27, 2011 |
December 25, 2012 |
||||||||||
| Long-lived assets held for sale |
2 | $ | 1,850 | $ | — | |||||||
During fiscal 2011, the Company determined that the carrying amount of one of its Sullivan’s restaurants was most likely not recoverable. Therefore, the Company recorded a non-cash impairment charge of $1,400, which represented the difference between the carrying value of the restaurant assets and their estimated fair value, which was based on an estimated sales price. These assets were sold during the 2012 and the restaurant was closed. See Note 16 for further discussion of discontinued operations associated with this sale.
(13) Segment Reporting
The Company operates the Del Frisco’s, Sullivan’s, and Del Frisco’s Grille brands as operating segments. The concepts operate solely in the U.S. within the full-service dining industry, providing similar products to similar customers. Sales from external customers are derived principally from food and beverage sales, and the Company does not rely on any major customers as a source of sales. The concepts also possess similar economic characteristics, resulting in similar long-term expected financial performance characteristics. However, as Del Frisco’s restaurants typically have higher revenues, driven by their larger physical presence and higher check average, the Del Frisco’s, Sullivan’s, and Del Frisco’s Grille operating segments have varying operating income and restaurant-level EBITDA margins due to the leveraging of higher revenues on certain fixed operating costs such as management labor, rent, utilities, and building maintenance.
F-24
Table of Contents
The following table presents information about reportable segments for fiscal years 2010, 2011, and 2012 (in thousands):
| Fiscal Year Ended December 25, 2012 | ||||||||||||||||||||
| Del Frisco’s | Sullivan’s | Grille | Corporate | Consolidated | ||||||||||||||||
| Revenues |
$ | 124,692 | $ | 83,767 | $ | 23,976 | $ | — | $ | 232,435 | ||||||||||
| Restaurant-level EBITDA |
35,993 | 15,721 | 4,803 | — | 56,517 | |||||||||||||||
| Capital expenditures |
13,922 | 3,521 | 15,857 | 335 | 33,635 | |||||||||||||||
| Property and equipment |
70,342 | 42,217 | 25,828 | 1,417 | 139,804 | |||||||||||||||
| Fiscal Year Ended December 27, 2011 | ||||||||||||||||||||
| Del Frisco’s | Sullivan’s | Grille | Corporate | Consolidated | ||||||||||||||||
| Revenues |
$ | 111,387 | $ | 82,777 | $ | 4,461 | $ | — | $ | 198,625 | ||||||||||
| Restaurant-level EBITDA |
31,277 | 15,611 | 437 | — | 47,325 | |||||||||||||||
| Capital expenditures |
6,777 | 2,924 | 9,928 | 434 | 20,063 | |||||||||||||||
| Property and equipment |
56,419 | 38,776 | 9,972 | 1,069 | 106,236 | |||||||||||||||
| Fiscal Year Ended December 28, 2010 | ||||||||||||||||||||
| Del Frisco’s | Sullivan’s | Grille | Corporate | Consolidated | ||||||||||||||||
| Revenues |
$ | 88,292 | $ | 74,563 | $ | — | $ | — | $ | 162,855 | ||||||||||
| Restaurant-level EBITDA |
25,318 | 13,395 | — | — | 38,713 | |||||||||||||||
| Capital expenditures |
718 | 4,572 | 43 | 217 | 5,550 | |||||||||||||||
| Property and equipment |
54,655 | 35,900 | 43 | 636 | 91,234 | |||||||||||||||
In addition to using consolidated results in evaluating the Company’s performance and allocating its resources, the Company’s chief operating decision maker uses restaurant-level EBITDA, which is not a measure defined by generally accepted accounting principles. Restaurant-level EBITDA is defined as operating income before pre-opening costs, general and administrative expenses, management and accounting fees paid to related party, impairment charges, and depreciation and amortization. Pre-opening costs are excluded because they vary in timing and magnitude and are not related to the health of ongoing operations. General and administrative expenses and management and accounting fees paid to related party are only included in the Company’s consolidated financial results as they are generally not specifically identifiable to individual operating segments as these costs relate to supporting all of the restaurant operations of the Company and the extension of the Company’s concepts into new markets. Depreciation and amortization is excluded because it is not an ongoing controllable cash expense and it is not related to the health of ongoing operations. Property and equipment is the only balance sheet measure used by the Company’s chief operating decision maker in
F-25
Table of Contents
allocating resources. See table below for a reconciliation of restaurant-level EBITDA to operating income.
| December 28, 2010 |
Fiscal Year Ended December 27, 2011 |
December 25, 2012 |
||||||||||
| Restaurant-level EBITDA |
$ | 38,713 | $ | 47,325 | $ | 56,517 | ||||||
| Less pre-opening costs |
798 | 3,018 | 4,058 | |||||||||
| Less general and administrative |
7,512 | 10,640 | 13,449 | |||||||||
| Less management and accounting fees paid to related party |
3,345 | 3,399 | 1,252 | |||||||||
| Less asset advisory agreement termination fee |
— | — | 3,000 | |||||||||
| Less public offering transaction bonuses |
— | — | 1,462 | |||||||||
| Less depreciation and amortization |
6,459 | 6,998 | 8,675 | |||||||||
|
|
|
|
|
|
|
|||||||
| Operating income |
$ | 20,599 | $ | 23,270 | $ | 24,621 | ||||||
|
|
|
|
|
|
|
|||||||
(14) Earnings Per Share
Basic earnings per share (“EPS”) data is computed based on the weighted average number of shares of common stock outstanding during the period. Diluted EPS data is computed based on the weighted average number of shares of common stock outstanding, including all potentially issuable shares of common stock. During fiscal 2010 and 2011, there were no outstanding stock options or other dilutive securities and therefore they were not included in the dilutive calculation. Diluted earnings per share for fiscal 2012 excludes stock options of 825,000, which were outstanding during the period but were anti-dilutive.
(dollars in thousands, except per share data)
| Year Ended | ||||||||||||
| December 28, 2010 |
December 27, 2011 |
December 25, 2012 |
||||||||||
| Income (loss) from continuing operations |
$ | 8,757 | $ | 9,647 | $ | 14,573 | ||||||
| Discontinued operations, net of income tax benefit |
(27 | ) | (674 | ) | (819 | ) | ||||||
|
|
|
|
|
|
|
|||||||
| Net income (loss) |
$ | 8,730 | $ | 8,973 | $ | 13,754 | ||||||
|
|
|
|
|
|
|
|||||||
| Shares: |
||||||||||||
| Weighted average number of common shares outstanding(1) |
17,994,667 | 17,994,667 | 20,432,579 | |||||||||
| Dilutive shares |
— | — | — | |||||||||
|
|
|
|
|
|
|
|||||||
| Total Diluted Shares |
17,994,667 | 17,994,667 | 20,432,579 | |||||||||
|
|
|
|
|
|
|
|||||||
| Basic and diluted income (loss) per common share: |
||||||||||||
| Continuing operations |
$ | 0.49 | $ | 0.54 | $ | 0.71 | ||||||
| Discontinued operations |
(0.00 | ) | (0.04 | ) | (0.04 | ) | ||||||
|
|
|
|
|
|
|
|||||||
| Basic and diluted income (loss) per share |
$ | 0.49 | $ | 0.50 | $ | 0.67 | ||||||
|
|
|
|
|
|
|
|||||||
| (1) | The weighted average number of shares of common stock outstanding reflects the effect of the Conversion. (See Note 1). |
F-26
Table of Contents
(15) Stock-Based Employee Compensation
2012 Long-Term Equity Incentive Plan
In connection with the IPO, the Company adopted the Del Frisco’s Restaurant Group, Inc. 2012 Long-Term Equity Incentive Plan (the “2012 Plan”), which allows the Company’s Board of Directors to grant stock options, restricted stock, restricted stock units, deferred stock units and other equity-based awards to directors, officers, key employees and other key individuals performing services for the Company. The 2012 Plan provides for granting of options to purchase shares of common stock at an exercise price not less than the fair value of the stock on the date of grant. Options are exercisable at various periods ranging from one to four years from date of grant. The 2012 Plan has 2,232,800 shares authorized for issuance under the plan. There are 825,000 shares of common stock issuable upon exercise of currently outstanding options at December 25, 2012, and 1,407,800 shares available for future grants.
The Company recorded $378 in total stock option compensation cost during the period ended December 25, 2012 which was expensed primarily in general and administrative costs.
The following table summarizes stock option activity during 2012:
| December 25, 2012 | ||||||||||||||||
| Shares | Weighted average exercise price |
Weighted average Remaining Contractual Term |
Aggregate Intrinsic Value ($000’s) |
|||||||||||||
| Outstanding at beginning of year |
— | — | ||||||||||||||
| Granted |
830,000 | $ | 13.09 | |||||||||||||
| Exercised |
— | — | ||||||||||||||
| Forfeited |
(5,000 | ) | 13.00 | |||||||||||||
|
|
|
|
|
|||||||||||||
| Outstanding at end of period |
825,000 | $ | 13.09 | 9.62 years | $ | 1,845 | ||||||||||
|
|
|
|
|
|
|
|
|
|||||||||
| Options exercisable at end of period |
— | $ | — | — | $ | — | ||||||||||
|
|
|
|
|
|
|
|
|
|||||||||
A summary of the status of non-vested shares as of December 25, 2012 and changes during fiscal 2012 is presented below:
| December 25, 2012 | ||||||||
| Shares | Weighted average Grant-Date Fair Value |
|||||||
| Non-vested shares at beginning of year |
— | — | ||||||
| Granted |
830,000 | $ | 4.93 | |||||
| Vested |
— | — | ||||||
| Canceled |
(5,000 | ) | 4.82 | |||||
|
|
|
|
|
|||||
| Non-vested shares at end of period |
825,000 | $ | 4.93 | |||||
|
|
|
|
|
|||||
As of December 25, 2012, there was $3,636 of total unrecognized compensation cost related to non-vested stock options. This cost is expected to be recognized over a period of approximately 3.62 years.
The grant-date per share fair value of options granted was $4.93. The fair value of each option award was estimated on the date of grant using the Black-Scholes option valuation model with the following assumptions: risk-free interest rate of 0.62%, no expected dividend
F-27
Table of Contents
yield, volatility of 40.49%, and an expected option life of 5.49 years. The Black-Scholes option valuation model requires the input of highly subjective assumptions, including the expected life of the stock-based award. The assumptions above represent management’s best estimates, but these estimates involve inherent uncertainties and the application of management’s judgment. The expected term of options granted is based on a representative peer group with similar employee groups and expected behavior. The risk-free rate for periods within the contractual life of the option is based on the U.S. Treasury constant maturities rate in effect at the time of grant. The Company utilized a weighted rate for expected volatility based on a representative peer group with a similar expected term of options granted. Outstanding options granted under the Company’s 2012 Equity Incentive Plan are subject to a four year vesting period and have a ten year maximum contractual term.
In addition, the Company is required to estimate the expected forfeiture rate and only recognizes expense for those shares expected to vest. If the actual forfeiture rate is materially different from the Company’s estimate, the share-based compensation expense could be materially different.
2007 Long-Term Equity Incentive Compensation
In April 2007, Holdings provided long-term incentives to certain of the Company’s officers through the issuance of equity incentive awards in the form of its Class C interests. In addition, these same officers acquired Class B interests in Holdings for $525, which amount was subsequently contributed to the Company by Holdings. The Class B interests of Holdings, which were purchased at their estimated fair value, were fully vested upon issuance and have a stated return but did not participate in any increase in the value of Holdings. The Class C interests of Holdings, which represented a 7% equity participation in Holdings, vested ratably over a five-year period based on both continuing employment and the achievement of performance targets from 2007 through 2011. The Class C interests vested 7.5% annually over five years if the holder was employed on December 31 of each year. The annual compensation expense related to this 7.5% was based upon the value of Class C interests calculated at April 30, 2007, the date of grant. The remaining Class C interests vested 12.5% annually in each of the five years if performance targets of each such year are achieved by December 31 of such year; however, these interests, subject to vesting upon achievement of performance targets, were forfeited and not eligible to vest at a later date if the performance targets for such year are not achieved. These awards were accounted for as variable awards, which are revalued at the end of each reporting period until such interests are either vested or forfeited. Those Class C interests that have not been previously forfeited become fully vested if there is a change of control in the ownership of the Company or Holdings, as set forth in the operating agreement of Holdings. During 2010 and 2011, both the 7.5% service-based and the 12.5% performance-based of Class C interests vested for those participants still employed by the Company at the end of each year.
A contemporaneous independent appraisal was conducted by an unrelated valuation specialist to value the Class B and Class C interests at the date of grant as well as for the Class C interests at December 30, 2008. This valuation used the option value method, as further discussed below, to determine the estimated fair value of the interests. The estimated fair value of the Class B interests approximated the purchase value by the officers and was vested upon issuance, and therefore, no compensation cost was recorded on the Class B interests.
The estimated fair value of the Class C interests was calculated based on the estimated market value of the Company with discounts applied that related to lack of marketability, restrictions on the transferability of the Class C interests, and the preferences of Class A and B interests. The Class C interests only had value after the Class A and B interests are paid the
F-28
Table of Contents
amount invested in Holdings plus the stated rate of return of 12% on such invested amounts. The estimated fair value of the Class C interests was calculated using the option value method based on a risk-free interest rate of 0.62%; an expected life of approximately 1.75 years; and expected volatility of 34%, at December 28, 2010 and December 27, 2011; and an estimated dividend yield of zero. The unrelated valuation specialist utilized the constant maturity treasury rate relative to the expected life for the expected risk-free interest rate, the volatility of comparable publicly traded companies for expected volatility, and the expected time between valuation date and a liquidity event for the expected life. This equity-based compensation totaled $170 and $101 for the years ended December 28, 2010 and December 27, 2011, respectively. The Company has recorded this equity-based compensation as a charge to earnings in its consolidated statements of income and comprehensive income with an affect to stockholders’ equity in its consolidated statements of changes in stockholders’ equity for the years ended December 28, 2010 and December 27, 2011, respectively. As of December 31, 2011, only one of the original three Class C interest holders was still employed by the Company and all interest in Class B and Class C awards were fully vested.
During 2011, the Company distributed $357 to Wagon Holdings, which was recorded as a cash distribution to parent and is reflected on the Statement of Changes in Member’s Equity. Wagon Holdings, in turn, paid a former executive of the Company $357 as consideration for his surrendering his Class B and Class C interests. The consideration paid for surrender solely related to the value of Class B interests which was the amount invested in Holdings plus the stated rate of return of 12% on such invested amounts.
(16) Discontinued Operations
On June 30, 2012, the Company closed its Dallas Sullivan’s location and on July 2, 2012, the Company completed the sale of the real property to a third party. The real property sold for $1,682, net of selling related expenses, which approximated its carrying value. In connection with the closure and sale of this restaurant, the Company allocated $739 in goodwill from the Sullivan’s reporting unit to this restaurant to determine the loss on the disposition. After this allocation, the total loss on the sale of this property was $465, net of tax. The Company previously recognized a non-cash asset impairment charge of $1,400 associated with this restaurant during fiscal 2011.
The Company determined that this closure met the criteria for classification as discontinued operations. As a result, all historical operating results of this property are reflected within discontinued operations in the consolidated statements of comprehensive income (loss) for all periods presented. Loss from discontinued operations, net of tax is comprised of the following:
| Fiscal Year Ended | ||||||||||||
| December 28, 2010 |
December 27, 2011 |
December 25, 2012 |
||||||||||
| Revenues |
$ | 2,720 | $ | 3,003 | $ | 1,505 | ||||||
| Income (loss) before income tax |
(68 | ) | (1,179 | ) | (821 | ) | ||||||
| Income tax (expense) benefit |
41 | 505 | 2 | |||||||||
|
|
|
|
|
|
|
|||||||
| Income (loss) from discontinued operations, net of income tax |
$ | (27 | ) | $ | (674 | ) | $ | (819 | ) | |||
|
|
|
|
|
|
|
|||||||
F-29
Table of Contents
(17) Quarterly Financial Information (Unaudited)
The following tables set forth certain unaudited consolidated financial information for each of the four quarters in fiscal 2012 and fiscal 2011 (in thousands, except per share data).
| Fiscal Year Ended December 25, 2012 | ||||||||||||||||||||
| First Quarter |
Second Quarter |
Third Quarter |
Fourth Quarter |
Total Year | ||||||||||||||||
| Revenues |
$ | 52,943 | $ | 50,736 | $ | 47,887 | $ | 80,869 | $ | 232,435 | ||||||||||
| Operating income |
8,253 | 6,611 | (923 | ) | 10,680 | 24,621 | ||||||||||||||
| Income from continuing operations |
4,899 | 3,628 | (1,794 | ) | 7,840 | 14,573 | ||||||||||||||
| Net income |
4,986 | 3,626 | (2,422 | ) | 7,564 | 13,754 | ||||||||||||||
| Basic income (loss) per common share: |
||||||||||||||||||||
| Continuing operations |
$ | 0.27 | $ | 0.20 | $ | (0.09 | ) | $ | 0.33 | $ | 0.71 | |||||||||
| Discontinued operations |
0.01 | — | (0.03 | ) | (0.01 | ) | (0.04 | ) | ||||||||||||
|
|
|
|
|
|
|
|
|
|
|
|||||||||||
| Basic income (loss) per share |
$ | 0.28 | $ | 0.20 | $ | (0.12 | ) | $ | 0.32 | $ | 0.67 | |||||||||
|
|
|
|
|
|
|
|
|
|
|
|||||||||||
| Basic weighted average shares outstanding |
17,995 | 17,995 | 20,826 | 23,795 | 20,443 | |||||||||||||||
| Diluted income (loss) per common share: |
||||||||||||||||||||
| Continuing operations |
$ | 0.27 | $ | 0.20 | $ | (0.09 | ) | $ | 0.33 | $ | 0.71 | |||||||||
| Discontinued operations |
0.01 | — | (0.03 | ) | (0.01 | ) | (0.04 | ) | ||||||||||||
|
|
|
|
|
|
|
|
|
|
|
|||||||||||
| Diluted income (loss) per share |
$ | 0.28 | $ | 0.20 | $ | (0.12 | ) | $ | 0.32 | $ | 0.67 | |||||||||
|
|
|
|
|
|
|
|
|
|
|
|||||||||||
| Diluted weighted average shares outstanding |
17,995 | 17,995 | 20,826 | 23,795 | 20,443 | |||||||||||||||
| Fiscal Year Ended December 27, 2011 | ||||||||||||||||||||
| First Quarter |
Second Quarter |
Third Quarter |
Fourth Quarter |
Total Year | ||||||||||||||||
| Revenues |
$ | 42,621 | $ | 42,851 | $ | 41,273 | $ | 71,880 | $ | 198,625 | ||||||||||
| Operating income |
5,681 | 3,246 | 3,195 | 11,148 | 23,270 | |||||||||||||||
| Income from continuing operations |
2,724 | 1,097 | (921 | ) | 6,747 | 9,647 | ||||||||||||||
| Net income |
2,743 | 1,034 | (1,836 | ) | 7,032 | 8,973 | ||||||||||||||
| Basic and diluted income (loss) per common share: |
||||||||||||||||||||
| Continuing operations |
$ | 0.15 | $ | 0.06 | $ | (0.05 | ) | $ | 0.38 | $ | 0.54 | |||||||||
| Discontinued operations |
— | — | (0.05 | ) | 0.01 | (0.04 | ) | |||||||||||||
|
|
|
|
|
|
|
|
|
|
|
|||||||||||
| Basic and diluted income (loss) per share |
$ | 0.15 | $ | 0.06 | $ | (0.10 | ) | $ | 0.39 | $ | 0.50 | |||||||||
|
|
|
|
|
|
|
|
|
|
|
|||||||||||
| Basic and diluted weighted average shares outstanding |
17,995 | 17,995 | 17,995 | 17,995 | 17,995 | |||||||||||||||
During the third fiscal quarter of 2012, the Company incurred an asset management termination fee of $3,000, a $1,462 public offering transaction bonus expense associated with the IPO, and $1,649 in expenses associated with the write-off of debt issuance costs.
During the third fiscal quarter of 2011, the Company incurred a $1,400 impairment charge, which is reflected in discontinued operations, related to one Sullivan’s restaurant that was subsequently closed and sold during fiscal 2012.
In management’s opinion, the unaudited quarterly information shown above has been prepared on the same basis as the audited consolidated financial statements and includes all
F-30
Table of Contents
necessary adjustments that management considers necessary for a fair presentation of the unaudited quarterly results when read in conjunction with the consolidated financial statements and the accompanying notes. The Company believes that quarter-to-quarter comparisons of its financial results are not necessarily indicative of future performance.
********
F-31
Table of Contents
DEL FRISCO’S RESTAURANT GROUP, INC. AND SUBSIDIARIES
CONDENSED CONSOLIDATED BALANCE SHEETS
As of June 11, 2013 and December 25, 2012
(Dollars in thousands)
| June 11, 2013 |
December 25, 2012 |
|||||||
| (Unaudited) | ||||||||
| Assets |
||||||||
| Current assets: |
||||||||
| Cash and cash equivalents |
$ | 14,443 | $ | 10,763 | ||||
| Restricted cash |
215 | 215 | ||||||
| Inventory |
12,200 | 12,103 | ||||||
| Deferred income taxes |
2,410 | 2,067 | ||||||
| Lease incentives receivable |
1,755 | 3,092 | ||||||
| Prepaid expenses and other |
3,139 | 4,758 | ||||||
|
|
|
|
|
|||||
| Total current assets |
34,162 | 32,998 | ||||||
| Property and equipment, net |
110,865 | 105,568 | ||||||
| Goodwill |
75,365 | 75,365 | ||||||
| Intangible assets, net |
36,329 | 36,391 | ||||||
| Deferred compensation plan investments |
9,262 | 7,802 | ||||||
| Other assets |
261 | 261 | ||||||
|
|
|
|
|
|||||
| Total assets |
$ | 266,244 | $ | 258,385 | ||||
|
|
|
|
|
|||||
| Liabilities and Stockholders’ Equity |
||||||||
| Current liabilities: |
||||||||
| Accounts payable |
$ | 4,776 | $ | 8,804 | ||||
| Accrued payroll |
4,505 | 6,262 | ||||||
| Accrued self-insurance |
1,746 | 1,662 | ||||||
| Deferred revenue |
8,268 | 10,314 | ||||||
| Income taxes payable |
2,097 | 1,768 | ||||||
| Other current liabilities |
4,732 | 4,943 | ||||||
|
|
|
|
|
|||||
| Total current liabilities |
26,124 | 33,753 | ||||||
| Deferred rent obligations |
23,700 | 22,644 | ||||||
| Deferred tax liabilities |
14,125 | 10,792 | ||||||
| Other liabilities |
14,149 | 13,295 | ||||||
|
|
|
|
|
|||||
| Total liabilities |
78,098 | 80,484 | ||||||
|
|
|
|
|
|||||
| Commitments and contingencies |
||||||||
| Stockholders’ equity: |
||||||||
| Preferred stock, $0.001 par value, 10,000,000 shares authorized, no shares issued and outstanding at December 25, 2012 or June 11, 2013 (unaudited) |
— | — | ||||||
| Common stock, $0.001 par value, 190,000,000 shares authorized, 23,794,667 shares issued and outstanding at December 25, 2012, and June 11, 2013 (unaudited) |
24 | 24 | ||||||
| Additional paid in capital |
121,855 | 119,610 | ||||||
| Retained earnings |
66,267 | 58,267 | ||||||
| Accumulated other comprehensive income |
— | — | ||||||
|
|
|
|
|
|||||
| Total stockholders’ equity |
188,146 | 177,901 | ||||||
|
|
|
|
|
|||||
| Total liabilities and stockholders’ equity |
$ | 266,244 | $ | 258,385 | ||||
|
|
|
|
|
|||||
See notes to condensed consolidated financial statements.
F-32
Table of Contents
DEL FRISCO’S RESTAURANT GROUP, INC. AND SUBSIDIARIES
CONDENSED CONSOLIDATED STATEMENTS OF INCOME AND
COMPREHENSIVE INCOME—UNAUDITED
For the Twenty-Four Weeks Ended June 11, 2013 and June 12, 2012
(Dollar amounts in thousands, except per share data)
| 24 Weeks Ended | ||||||||
| June 11, 2013 | June 12, 2012 | |||||||
| Revenues |
$ | 120,162 | $ | 103,678 | ||||
| Costs and expenses: |
||||||||
| Costs of sales |
36,533 | 31,963 | ||||||
| Restaurant operating expenses |
53,454 | 43,778 | ||||||
| Marketing and advertising costs |
2,256 | 2,006 | ||||||
| Pre-opening costs |
919 | 902 | ||||||
| General and administrative costs |
7,938 | 5,400 | ||||||
| Management and accounting fees paid to related party |
— | 1,196 | ||||||
| Secondary public offering costs |
412 | — | ||||||
| Public offering transaction bonuses |
1,805 | — | ||||||
| Depreciation and amortization |
5,006 | 3,570 | ||||||
|
|
|
|
|
|||||
| Operating income |
11,839 | 14,863 | ||||||
| Other income (expense), net: |
||||||||
| Interest expense |
(48 | ) | (2,228 | ) | ||||
| Other |
— | 65 | ||||||
|
|
|
|
|
|||||
| Income from continuing operations before income taxes |
11,791 | 12,700 | ||||||
| Income tax expense |
3,791 | 4,172 | ||||||
|
|
|
|
|
|||||
| Income from continuing operations |
$ | 8,000 | $ | 8,528 | ||||
|
|
|
|
|
|||||
| Discontinued operations, net of income tax benefit |
— | 84 | ||||||
|
|
|
|
|
|||||
| Net income |
$ | 8,000 | $ | 8,612 | ||||
|
|
|
|
|
|||||
| Basic income per common share: |
||||||||
| Continuing operations |
$ | 0.34 | $ | 0.47 | ||||
| Discontinued operations |
0.00 | 0.01 | ||||||
|
|
|
|
|
|||||
| Basic income per share |
$ | 0.34 | $ | 0.48 | ||||
|
|
|
|
|
|||||
| Diluted income per common share: |
||||||||
| Continuing operations |
$ | 0.34 | $ | 0.47 | ||||
| Discontinued operations |
0.00 | 0.01 | ||||||
|
|
|
|
|
|||||
| Diluted income per share |
$ | 0.34 | $ | 0.48 | ||||
|
|
|
|
|
|||||
| Shares used in computing net income per common share: |
||||||||
| Basic |
23,794,667 | 17,994,667 | ||||||
| Diluted |
23,794,869 | 17,994,667 | ||||||
| Comprehensive income |
$ | 8,000 | $ | 8,612 | ||||
|
|
|
|
|
|||||
See notes to condensed consolidated financial statements.
F-33
Table of Contents
DEL FRISCO’S RESTAURANT GROUP, INC. AND SUBSIDIARIES
CONDENSED CONSOLIDATED STATEMENT OF CHANGES IN
STOCKHOLDERS’ EQUITY—UNAUDITED
For the Twenty-Four Weeks Ended June 11, 2013
(Dollar amounts in thousands)
| Common Stock | Additional Paid In Capital |
Retained Earnings |
Accumulated Other Comprehensive Income |
Total | ||||||||||||||||||||
| Shares | Par Value | |||||||||||||||||||||||
| Balance at December 25, 2012 |
23,794,667 | $ | 24 | $ | 119,610 | $ | 58,267 | $ | — | $ | 177,901 | |||||||||||||
| Comprehensive income |
— | — | 8,000 | — | 8,000 | |||||||||||||||||||
| Share-based compensation costs |
— | 466 | — | — | 466 | |||||||||||||||||||
| Contribution by majority shareholder (see Note 5) |
— | 1,779 | — | — | 1,779 | |||||||||||||||||||
|
|
|
|
|
|
|
|
|
|
|
|
|
|||||||||||||
| Balance at June 11, 2013 |
23,794,667 | $ | 24 | $ | 121,855 | $ | 66,267 | $ | — | $ | 188,146 | |||||||||||||
|
|
|
|
|
|
|
|
|
|
|
|
|
|||||||||||||
See notes to condensed consolidated financial statements.
F-34
Table of Contents
DEL FRISCO’S RESTAURANT GROUP, INC. AND SUBSIDIARIES
CONDENSED CONSOLIDATED STATEMENTS OF CASH FLOWS—UNAUDITED
For the Twenty-Four Weeks Ended June 11, 2013 and June 12, 2012
(Dollars in Thousands)
| 24 Weeks Ended | ||||||||
| June 11, 2013 |
June 12, 2012 |
|||||||
| Cash flows from operating activities: |
||||||||
| Net income |
$ | 8,000 | $ | 8,612 | ||||
| Adjustments to reconcile net income to net cash provided by operating activities: |
||||||||
| Depreciation and amortization |
5,006 | 3,707 | ||||||
| Loan cost amortization |
8 | 187 | ||||||
| Non-cash equity based compensation |
466 | — | ||||||
| Deferred income taxes |
2,990 | 129 | ||||||
| Amortization of deferred lease incentives |
(222 | ) | (87 | ) | ||||
| Changes in operating assets and liablities: |
||||||||
| Inventories |
(97 | ) | 146 | |||||
| Lease incentives receivable |
1,987 | 241 | ||||||
| Other assets |
774 | (126 | ) | |||||
| Accounts payable |
(4,028 | ) | 480 | |||||
| Income taxes |
(45 | ) | 2,113 | |||||
| Deferred rent obligations |
583 | 419 | ||||||
| Other liabilities |
(3,271 | ) | (3,130 | ) | ||||
|
|
|
|
|
|||||
| Net cash provided by operating activities |
12,151 | 12,691 | ||||||
|
|
|
|
|
|||||
| Cash flows from investing activities: |
||||||||
| Proceeds from sale of property and equipment |
5 | — | ||||||
| Purchases of property and equipment |
(10,230 | ) | (12,429 | ) | ||||
| Other |
(25 | ) | (116 | ) | ||||
|
|
|
|
|
|||||
| Net cash used in investing activities |
(10,250 | ) | (12,545 | ) | ||||
|
|
|
|
|
|||||
| Cash flows from financing activities: |
||||||||
| Payments of long-term debt |
— | (8,500 | ) | |||||
| Contribution from majority shareholder |
1,779 | — | ||||||
|
|
|
|
|
|||||
| Net cash provided by (used in) financing activities |
1,779 | (8,500 | ) | |||||
|
|
|
|
|
|||||
| Net increase (decrease) in cash and cash equivalents |
3,680 | (8,354 | ) | |||||
| Cash and cash equivalents at beginning of period |
10,763 | 14,119 | ||||||
|
|
|
|
|
|||||
| Cash and cash equivalents at end of period |
$ | 14,443 | $ | 5,765 | ||||
|
|
|
|
|
|||||
| Supplemental disclosures of cash flow information: |
||||||||
| Cash paid during the year for: |
||||||||
| Interest |
$ | 45 | $ | 2,346 | ||||
| Income taxes |
$ | 840 | $ | 1,886 | ||||
See notes to condensed consolidated financial statements.
F-35
Table of Contents
DEL FRISCO’S RESTAURANT GROUP, INC. AND SUBSIDIARIES
NOTES TO CONDENSED CONSOLIDATED FINANCIAL STATEMENTS—UNAUDITED
(1) BUSINESS AND BASIS OF PRESENTATION
As of June 11, 2013, Del Frisco’s Restaurant Group, Inc. (the “Company”) owned and operated 35 restaurants under the brand names of Del Frisco’s Double Eagle Steak House (“Del Frisco’s”), Sullivan’s Steakhouse (“Sullivan’s”), and Del Frisco’s Grille (“Grille”). Of the 35 restaurants the Company operated at the end of the period covered by this report, there were ten Del Frisco’s restaurants, 19 Sullivan’s restaurants and six Grille restaurants in operation in 19 states throughout the United States of America. One new Grille location opened during the 24 weeks ended June 11, 2013 in Houston, Texas.
The accompanying unaudited condensed consolidated financial statements have been prepared in accordance with U.S. generally accepted accounting principles (“GAAP”) for interim financial information. Accordingly, they do not include all the information and disclosures required by GAAP for complete financial statements. Operating results for the 24 weeks ended June 11, 2013 are not necessarily indicative of the results that may be expected for the fiscal year ending December 31, 2013. In the opinion of management, the unaudited condensed consolidated financial statements include all adjustments, consisting of normal recurring adjustments, considered necessary for a fair presentation. Certain amounts from the prior years have been reclassified to conform with the fiscal 2013 presentation. These unaudited condensed consolidated financial statements and related notes should be read in conjunction with the consolidated financial statements and notes for the fiscal year ended December 25, 2012 included in the Company’s Annual Report filed on Form 10-K for the fiscal year ended December 25, 2012 filed with the SEC on February 26, 2013, as amended on June 14, 2013.
The Company operates on a 52- or 53-week fiscal year ending the last Tuesday in December. The fiscal quarters ended June 11, 2013 and June 12, 2012 each contained 12 weeks and are referred to herein as the second quarter of fiscal year 2013 and the second quarter of fiscal year 2012, respectively. Fiscal year 2013 will be a 53-week fiscal year and fiscal year 2012 was a 52-week fiscal year.
(2) SECONDARY PUBLIC OFFERING
On March 7, 2013, a secondary public offering of the Company’s common stock was completed by the Company’s majority shareholder (along with its affiliates and associates, excluding the Company and other companies that it or they own as a result of their investment activities, “Lone Star Fund”). The selling shareholder sold 4,750,000 previously outstanding shares. In addition, on April 10, 2013, the shareholder sold an additional 150,000 shares of common stock to cover over-allotments related to the March 7, 2013 offering. The Company did not receive any proceeds from the offering. The selling shareholder paid all of the underwriting discounts and commissions associated with the sale of the shares; however, the Company incurred $0.4 million in costs and registration expenses related to the offering during the 24 weeks ended June 11, 2013.
(3) EARNINGS PER SHARE
Basic earnings per share (“EPS”) data is computed based on the weighted average number of shares of common stock outstanding during the period. Diluted EPS data is computed based on the weighted average number of shares of common stock outstanding, including all potentially issuable shares of common stock. Diluted EPS for the 24 weeks ended June 11, 2013 excludes options to purchase 818,053 shares of common stock, respectively, which were
F-36
Table of Contents
outstanding during the period but were anti-dilutive. At June 12, 2012, there were no outstanding stock options or other dilutive securities and therefore they were not included in the dilutive calculation.
(dollars in thousands, except per share data)
| 24 Weeks Ended | ||||||||
| June 11, 2013 |
June 12, 2012 |
|||||||
| Income from continuing operations |
$ | 8,000 | $ | 8,528 | ||||
| Discontinued operations, net of income tax benefit |
— | 84 | ||||||
|
|
|
|
|
|||||
| Net income |
$ | 8,000 | $ | 8,612 | ||||
|
|
|
|
|
|||||
| Shares: |
||||||||
| Weighted average number of common shares outstanding |
23,794,667 | 17,994,667 | ||||||
| Dilutive shares |
202 | — | ||||||
|
|
|
|
|
|||||
| Total Diluted Shares |
23,794,869 | 17,994,667 | ||||||
|
|
|
|
|
|||||
| Basic income per common share: |
||||||||
| Continuing operations |
$ | 0.34 | $ | 0.47 | ||||
| Discontinued operations |
0.00 | 0.01 | ||||||
|
|
|
|
|
|||||
| Basic income per share |
$ | 0.34 | $ | 0.48 | ||||
|
|
|
|
|
|||||
| Diluted income per common share: |
||||||||
| Continuing operations |
$ | 0.34 | $ | 0.47 | ||||
| Discontinued operations |
0.00 | 0.01 | ||||||
|
|
|
|
|
|||||
| Diluted income per share |
$ | 0.34 | $ | 0.48 | ||||
|
|
|
|
|
|||||
(4) STOCK-BASED EMPLOYEE COMPENSATION
2012 Long-Term Equity Incentive Plan
On July 16, 2012, the Company adopted the Del Frisco’s Restaurant Group, Inc. 2012 Long-Term Equity Incentive Plan (the “2012 Plan”), which allows the Company to grant stock options, restricted stock, restricted stock units, deferred stock units and other equity-based awards to directors, officers, key employees and other key individuals performing services for the Company. The 2012 Plan provides for granting of options to purchase shares of common stock at an exercise price not less than the fair value of the stock on the date of grant. Options are exercisable at various periods ranging from one to four years from the date of grant. The 2012 Plan has 2,232,800 shares authorized for issuance under the plan. There were 856,500 shares of common stock issuable upon exercise of outstanding options at June 11, 2013 and 1,376,300 shares available for future grants.
The Company recorded $466,000 in total stock option compensation cost during the 24 weeks ended June 11, 2013, which was expensed primarily in general and administrative costs.
F-37
Table of Contents
The following table summarizes stock option activity during the period ended June 11, 2013:
| 24 Weeks Ended June 11, 2013 | ||||||||||||||||
| Shares | Weighted average exercise price |
Weighted average Remaining Contractual Term |
Aggregate Intrinsic Value ($000’s) |
|||||||||||||
| Outstanding at beginning of year |
825,000 | 13.09 | ||||||||||||||
| Granted |
72,000 | 16.58 | ||||||||||||||
| Exercised |
— | — | ||||||||||||||
| Forfeited |
(40,500 | ) | 13.44 | |||||||||||||
|
|
|
|
|
|||||||||||||
| Outstanding at end of period |
856,500 | $ | 13.37 | 9.2 years | $ | 5,481 | ||||||||||
|
|
|
|
|
|
|
|
|
|||||||||
| Options exercisable at end of period |
— | $ | — | — | $ | — | ||||||||||
|
|
|
|
|
|
|
|
|
|||||||||
A summary of the status of non-vested shares as of June 11, 2013 and changes during the first and second quarters of fiscal 2013 is presented below:
| 24 Weeks Ended June 11, 2013 |
||||||||
| Shares | Weighted average Grant- Date Fair Value |
|||||||
| Non-vested shares at beginning of year |
825,000 | $ | 4.93 | |||||
| Granted |
72,000 | 6.99 | ||||||
| Vested |
— | — | ||||||
| Forfeited |
(40,500 | ) | 5.09 | |||||
|
|
|
|
|
|||||
| Non-vested shares at end of period |
856,500 | $ | 5.10 | |||||
|
|
|
|
|
|||||
As of June 11, 2013, there was $3.5 million of total unrecognized compensation cost related to non-vested stock options. This cost is expected to be recognized over a period of approximately 3.2 years.
The weighted average grant-date per share fair value of options granted during the year was $6.99. The fair value of each option award was estimated on the date of grant using the Black-Scholes option valuation model with the following weighted assumptions: risk-free interest rate of 0.99%, no expected dividend yield, volatility of 42.31%, and an expected option life of 6.25 years. The Black-Scholes option valuation model requires the input of highly subjective assumptions, including the expected life of the stock-based award. The assumptions above represent management’s best estimates, but these estimates involve inherent uncertainties and the application of management’s judgment. The expected term of options granted is based on a representative peer group with similar employee groups and expected behavior. The risk-free rate for periods within the contractual life of the option is based on the U.S. Treasury constant maturities rate in effect at the time of grant. The Company utilized a weighted rate for expected volatility based on a representative peer group with a similar expected term of options granted. Outstanding options granted under the 2012 Plan are subject to a four year vesting period and have a ten year maximum contractual term.
In addition, the Company is required to estimate the expected forfeiture rate and only recognizes expense for those shares expected to vest. If the actual forfeiture rate is materially different from the Company’s estimate, the share-based compensation expense could be materially different.
F-38
Table of Contents
(5) RELATED PARTY TRANSACTIONS
In connection with the March 2013 secondary public offering, certain executives of the Company earned transaction bonuses totaling approximately $1.8 million. These bonuses were earned under letter agreements, as amended, with LSF5 Wagon Holdings, LLC, an affiliate of Lone Star Fund (“Wagon”), in which certain executives of the Company were eligible to receive a transaction bonus upon the occurrence of an eligible transaction. Wagon is responsible for funding any transaction bonuses under these agreements, including those paid in connection with the March 2013 secondary public offering. As these bonuses were contingent upon employment with the Company, the Company is required to record the expense of these bonuses and recognized the funding by Wagon as additional paid in capital. The $1.8 million was recorded as an expense to the Company and capital contribution by Wagon in the first quarter of fiscal 2013. In the second quarter of fiscal 2013, Wagon contributed approximately $1.8 million which was used by the Company to pay these bonuses.
In fiscal 2012, the Company entered into a Transition Services Agreement with an affiliate of Lone Star Fund to provide certain limited support services, including legal and risk management, until the Company can complete transition of these functions to internal or third-party resources. General and administrative expenses include charges of approximately $25,000 for these services for the 24 weeks ended June 11, 2013.
(6) LONG-TERM DEBT
On October 15, 2012 the Company entered into a new credit facility that provides for a three-year unsecured revolving credit facility of up to $25.0 million. Borrowings under the new credit facility bear interest at a rate of LIBOR plus 1.50%. The Company is required to pay a commitment fee equal to 0.25% per annum on the available but unused revolving credit facility. The credit facility is guaranteed by certain subsidiaries of the Company. The credit facility contains various financial covenants, including a maximum ratio of total indebtedness to EBITDA, as defined in the credit agreement, and minimum fixed charge coverage, as defined in the credit agreement. The credit facility also contains covenants restricting certain corporate actions, including asset dispositions, acquisitions, the payment of dividends, the incurrence of indebtedness and providing financing or other transactions with affiliates. The Company was in compliance with all of the debt covenants as of June 11, 2013 and December 25, 2012.
As of June 11, 2013 and December 25, 2012, there were no outstanding borrowings on the Company’s revolving credit facility. Under the revolving loan commitment, the Company had approximately $24.2 million of borrowings available under its revolving credit facility, with $761,000 in outstanding letters of credit commitments drawn on the facility.
(7) INCOME TAXES
The effective income tax rate from continuing operations for the 24 weeks ended June 11, 2013 was 32.2% compared to an effective income tax rate from continuing operations of 32.9% for the 24 weeks ended June 12, 2012. The factors that cause the effective tax rates to vary from the federal statutory rate of 35% include the impact of FICA tip and other credits, partially offset by state income taxes and certain non-deductible expenses. The decrease in the effective tax rate for the 24 weeks ended June 11, 2013 is primarily attributable to a decrease in the Company’s unrecognized tax benefits of approximately $0.3 million related to the release of exposure items due to the expiration of the statute of limitations, as well as the impact of certain discrete permanent differences between book and tax income, particularly higher non-taxable income on deferred compensation plan investments. These decreases were partially offset by the adjustment described below.
F-39
Table of Contents
In the second quarter of fiscal 2013, the Company determined that a deferred tax asset and associated tax benefit of $0.5 million recorded in the fourth quarter of fiscal 2012 relating to local income tax net operating loss carryforwards was not realizable and should not have been recognized, as the related net operating losses originated in years from which the carryforward period had expired. The Company corrected the deferred tax asset account resulting in a non-cash $0.5 million cumulative adjustment to record additional income tax expense in the second quarter of fiscal 2013. The adjustment did not impact historical cash flows and will not impact the timing of future income tax payments. Prior years’ financial statements were not restated as the impact of these issues was immaterial to previously reported results for any individual prior year and 2012.
(8) FAIR VALUE MEASUREMENT
Under GAAP, the Company is required to measure certain assets and liabilities at fair value, or to disclose the fair value of certain assets and liabilities recorded at cost. Pursuant to these fair value measurement and disclosure requirements, fair value is defined as the price that would be received upon sale of an asset or paid upon transfer of a liability in an orderly transaction between market participants at the measurement date and in the principal or most advantageous market for that asset or liability. The fair value is calculated based on assumptions that market participants would use in pricing the asset or liability, not on assumptions specific to the entity. In addition, the fair value of liabilities includes consideration of non-performance risk, including the Company’s own credit risk. Each fair value measurement is reported in one of the following three levels:
Level 1—valuation inputs are based upon unadjusted quoted prices for identical instruments traded in active markets.
Level 2—valuation inputs are based upon quoted prices for similar instruments in active markets, quoted prices for identical or similar instruments in markets that are not active, and model-based valuation techniques for which all significant assumptions are observable in the market or can be corroborated by observable market data for substantially the full term of the assets or liabilities.
Level 3—valuation inputs are unobservable and typically reflect management’s estimates of assumptions that market participants would use in pricing the asset or liability. The fair values are therefore determined using model-based techniques that include option pricing models, discounted cash flow models, and similar techniques.
The following table presents our financial assets and liabilities measured at fair value on a recurring basis at June 11, 2013 and December 25, 2012 (in thousands):
| Fair Value Measurements | ||||||||||||
| Level | June 11, 2013 |
December 25, 2012 |
||||||||||
| Deferred compensation plan investments (life insurance policies) |
2 | $ | 9,262 | $ | 5,586 | |||||||
| Deferred compensation plan investments (mutual funds) |
1 | $ | — | $ | 2,216 | |||||||
| Deferred compensation plan liabilities |
2 | $ | (9,643 | ) | $ | (8,415 | ) | |||||
There were no transfers among levels within the fair-value hierarchy during the first two quarters of fiscal 2013 and fiscal 2012. The carrying value of the Company’s cash and cash equivalents and restricted cash approximate fair value because of their short term nature, and are classified within Level 1 of the fair value hierarchy. The carrying value of the Company’s accounts payable approximate fair value because of their short term nature, and are classified within Level 2 of the fair value hierarchy.
F-40
Table of Contents
(9) SEGMENT REPORTING
The Company operates the Del Frisco’s, Sullivan’s, and Grille brands as operating segments. The restaurant concepts operate solely in the U.S. within the full-service dining industry, providing similar products to similar customers. Sales from external customers are derived principally from food and beverage sales, and the Company does not rely on any major customers as a source of sales. The restaurant concepts also possess similar economic characteristics, resulting in similar long-term expected financial performance characteristics. However, as Del Frisco’s restaurants typically have higher revenues, driven by their larger physical presence and higher average check, the Del Frisco’s, Sullivan’s, and Grille operating segments have varying operating income and restaurant-level EBITDA margins due to the leveraging of higher revenues on certain fixed operating costs such as management labor, rent, utilities, and building maintenance.
The following table presents information about reportable segments for the 24 weeks ended June 11, 2013 and June 12, 2012 and as of June 11, 2013 and June 12, 2012. (in thousands):
| 24 Weeks Ended June 11, 2013 | ||||||||||||||||||||
| Del Frisco’s | Sullivan’s | Other | Corporate | Consolidated | ||||||||||||||||
| Revenues |
$ | 64,900 | $ | 38,084 | $ | 17,178 | $ | — | $ | 120,162 | ||||||||||
| Restaurant-level EBITDA |
18,334 | 6,213 | 3,372 | — | 27,919 | |||||||||||||||
| Capital expenditures |
1,420 | 951 | 7,812 | 47 | 10,230 | |||||||||||||||
| Property and equipment |
71,762 | 43,168 | 33,639 | 1,445 | 150,014 | |||||||||||||||
| 24 Weeks Ended June 12, 2012 | ||||||||||||||||||||
| Del Frisco’s | Sullivan’s | Other | Corporate | Consolidated | ||||||||||||||||
| Revenues |
$ | 56,100 | $ | 39,294 | $ | 8,284 | $ | — | $ | 103,678 | ||||||||||
| Restaurant-level EBITDA |
16,090 | 7,803 | 2,038 | — | 25,931 | |||||||||||||||
| Capital expenditures |
1,341 | 2,303 | 8,641 | 144 | 12,429 | |||||||||||||||
| Property and equipment |
57,760 | 43,689 | 18,613 | 1,204 | 121,266 | |||||||||||||||
In addition to using consolidated results in evaluating the Company’s performance and allocating its resources, the Company’s chief operating decision maker uses restaurant-level EBITDA, which is not a measure defined by GAAP. The Company defines restaurant-level EBITDA as operating income before pre-opening costs, general and administrative expenses, management and accounting fees paid to related party, secondary public offering costs, public offering transaction bonuses, and depreciation and amortization. Pre-opening costs are excluded because they vary in timing and magnitude and are not related to the health of ongoing operations. General and administrative expenses and management and accounting fees paid to related party are only included in the Company’s consolidated financial results as they are generally not specifically identifiable to individual operating segments as these costs relate to supporting all of the restaurant operations of the Company and the extension of the Company’s concepts into new markets. Public offering costs, transaction bonuses, and depreciation and amortization are excluded because they are not ongoing controllable cash expenses and they are not related to the health of ongoing operations. Property and equipment is the only balance sheet measure used by the Company’s chief operating decision maker in
F-41
Table of Contents
allocating resources. See table below (in thousands) for a reconciliation of restaurant-level EBITDA to operating income from continuing operations.
| 24 Weeks Ended | ||||||||
| June 11, 2013 |
June 12 2012 |
|||||||
| Restaurant-level EBITDA |
$ | 27,919 | $ | 25,931 | ||||
| Less pre-opening costs |
919 | 902 | ||||||
| Less general and administrative |
7,938 | 5,400 | ||||||
| Less management and accounting fees paid to related party |
— | 1,196 | ||||||
| Less secondary public offering costs |
412 | — | ||||||
| Less public offering transaction bonuses |
1,805 | — | ||||||
| Less depreciation and amortization |
5,006 | 3,570 | ||||||
|
|
|
|
|
|||||
| Operating income |
$ | 11,839 | $ | 14,863 | ||||
|
|
|
|
|
|||||
(10) COMMITMENTS AND CONTINGENCIES
The Company is subject to various claims, possible legal actions, and other matters arising out of the normal course of business. While it is not possible to predict the outcome of these issues, management is of the opinion that adequate provision for potential losses has been made in the accompanying condensed consolidated financial statements and that the ultimate resolution of these matters will not have a material adverse effect on the Company’s financial position, results of operations or cash flows.
Prior to the acquisition of the Company by Lone Star Fund, the Company guaranteed certain lease payments of related parties in connection with the leasing of real estate for restaurant locations. As of December 25, 2012 and June 11, 2013, the Company was responsible as guarantor for five of these leases. The leases expire at various times through 2016. These guarantees will require payment by the Company only in an event of default by the related party where it is unable to make the required lease payments. Management believes that any future payments required under these guarantees will not be significant. At December 25, 2012 and June 11, 2013 the maximum potential amount of future lease payments the Company could be required to make as a result of the guarantees was approximately $2.0 million and $1.8 million, respectively.
At December 25, 2012 and June 11, 2013, the Company had outstanding letters of credit of $976,000, of which $761,000 were drawn on the Company’s credit facility (see Note 6, Long-Term Debt ) and $215,000 were collateralized by restricted cash. The letters of credit typically act as guarantee of payment to certain third parties in accordance with specified terms and conditions.
(11) DISCONTINUED OPERATIONS
On June 30, 2012, the Company closed its Dallas Sullivan’s location and on July 2, 2012, the Company completed the sale of the real property to a third party. The Company determined that this closure met the criteria for classification as discontinued operations. As a result, all historical operating results as well as the loss on the sale of this property are reflected within discontinued operations in the condensed consolidated statements of comprehensive income
F-42
Table of Contents
for all periods presented. Loss from discontinued operations, net of tax is comprised of the following for the 24 weeks ended June 12, 2012 (in thousands):
| 24 Weeks Ended June 12, 2012 |
||||
| Revenues |
$ | 1,323 | ||
| Income (loss) before income tax |
38 | |||
| Income tax benefit |
46 | |||
|
|
|
|||
| Income (loss) from discontinued operations, net of income tax expense |
$ | 84 | ||
|
|
|
|||
F-43
Table of Contents

Table of Contents
You should rely only on the information contained in this prospectus. We have not authorized anyone to provide information different from that contained in this prospectus. We are offering to sell, and seeking offers to buy, shares of common stock only in jurisdictions where offers and sales are permitted. The information contained in this prospectus is accurate only as of the date of this prospectus, regardless of the time of delivery of this prospectus or of any sale of our common stock.
| Page | ||||
| 1 | ||||
| 13 | ||||
| 34 | ||||
| 35 | ||||
| 37 | ||||
| 38 | ||||
| 39 | ||||
| Management’s Discussion and Analysis of Financial Condition and Results of Operations |
43 | |||
| 71 | ||||
| 82 | ||||
| 92 | ||||
| 101 | ||||
| 103 | ||||
| 106 | ||||
| 112 | ||||
| 115 | ||||
| 120 | ||||
| 126 | ||||
| 126 | ||||
| 126 | ||||
| F-1 | ||||
Del Frisco’s
Restaurant Group,
Inc.
5,000,000 Shares
Common Stock
Deutsche Bank Securities
Piper Jaffray
Wells Fargo Securities
Cowen and Company
Raymond James
Prospectus
, 2013
Table of Contents
PART II
INFORMATION NOT REQUIRED IN THE PROSPECTUS
| Item 13. | Other Expenses of Issuance and Distribution |
The following table shows the costs and expenses, other than underwriting discounts and commissions, payable in connection with the sale and distribution of the securities being registered. Except as otherwise noted, we will pay all of these amounts. All amounts except the SEC registration fee and the FINRA fee are estimated.
| Type |
Amount | |||
| SEC registration fee |
$ | 17,130 | ||
| FINRA filing fee |
19,337 | |||
| Legal fees and expenses |
* | |||
| Accounting fees and expenses |
* | |||
| Printing and engraving expenses |
* | |||
| Transfer agent and registrar fees |
* | |||
| Miscellaneous expenses |
* | |||
|
|
|
|||
| Total |
$ | * | ||
|
|
|
|||
| * | To be provided by amendment. |
| Item 14. | Indemnification of Directors and Officers |
Our bylaws provide that each person who was or is party or is threatened to be made a party to, or was or is otherwise involved in, any threatened, pending or completed proceeding by reason of the fact that he or she is or was a director or officer of our company or was serving at the request of our company as a director, officer, employee, agent or trustee of another entity shall be indemnified and held harmless by us to the full extent authorized by the Delaware General Corporation Law, or DGCL, against all expense, liability and loss actually and reasonably incurred in connection therewith, subject to certain limitations.
Section 145(a) of the DGCL authorizes a corporation to indemnify any person who was or is a party, or is threatened to be made a party, to a threatened, pending or completed action, suit or proceeding, whether civil, criminal, administrative or investigative (other than an action by or in the right of the corporation), by reason of the fact that the person is or was a director, officer, employee or agent of the corporation, or is or was serving at the request of the corporation as a director, officer, employee or agent of another corporation, partnership, joint venture, trust or other enterprise, against expenses (including attorneys’ fees), judgments, fines and amounts paid in settlement actually and reasonably incurred by the person in connection with such action, suit or proceeding, if the person acted in good faith and in a manner the person reasonably believed to be in, or not opposed to, the best interests of the corporation and, with respect to any criminal action or proceeding, had no reasonable cause to believe the person’s conduct was unlawful.
Section 145(b) of the DGCL provides in relevant part that a corporation may indemnify any person who was or is a party or is threatened to be made a party to any threatened, pending or completed action or suit by or in the right of the corporation to procure a judgment in its favor by reason of the fact that the person is or was a director, officer, employee or agent of the corporation, or is or was serving at the request of the corporation as a director, officer, employee or agent of another corporation, partnership, joint venture, trust or other enterprise
II-1
Table of Contents
against expenses (including attorneys’ fees) actually and reasonably incurred by the person in connection with the defense or settlement of such action or suit if the person acted in good faith and in a manner the person reasonably believed to be in or not opposed to the best interests of the corporation and except that no indemnification shall be made in respect of any claim, issue or matter as to which such person shall have been adjudged to be liable to the corporation unless and only to the extent that the Court of Chancery or the court in which such action or suit was brought shall determine upon application that, despite the adjudication of liability but in view of all the circumstances of the case, such person is fairly and reasonably entitled to indemnity for such expenses which the Court of Chancery or such other court shall deem proper.
The DGCL also provides that indemnification under Section 145(d) can only be made upon a determination that indemnification of the present or former director, officer or employee or agent is proper in the circumstances because such person has met the applicable standard of conduct set forth in Section 145(a) and (b). Such determination shall be made, with respect to a person who is a director or officer at the time of such determination, (1) by a majority vote of directors who are not a party to the action at issue (even though less than a quorum), or (2) by a majority vote of a designated committee of these directors (even though less than a quorum), or (3) if there are no such directors, or these directors authorize, by the written opinion of independent legal counsel, or (4) by the stockholders.
Section 145(g) of the DGCL also empowers a corporation to purchase and maintain insurance on behalf of any person who is or was a director, officer, employee or agent of the corporation, or is or was serving at the request of the corporation as a director, officer, employee or agent of another corporation, partnership, joint venture, trust or other enterprise against any liability asserted against such person and incurred by such person in any such capacity, or arising out of such person’s status as such, whether or not the corporation would have the power to indemnify such person against such liability under Section 145 of the DGCL.
Section 102(b)(7) of the DGCL permits a corporation to provide for eliminating or limiting the personal liability of one of its directors for any monetary damages related to a breach of fiduciary duty as a director, as long as the corporation does not eliminate or limit the liability of a director for acts or omissions which (1) were in bad faith, (2) were the result of active and deliberate dishonesty and were material to the cause of action so adjudicated, (3) the director derived an improper personal benefit from (such as a financial profit or other advantage to which such director was not legally entitled) or (4) breached the director’s duty of loyalty.
We have entered into indemnification agreements with each of our officers and directors that provide, in general, that we will indemnify them to the fullest extent permitted by law in connection with their service to us or on our behalf.
The proposed form of Underwriting Agreement to be filed as Exhibit 1.1 to this Registration Statement provides for indemnification of our directors and officers by the underwriters against certain liabilities.
| Item 15. | Recent Sales of Unregistered Securities |
We have not issued any securities that were not registered under the Securities Act since July 16, 2010.
| Item 16. | Exhibits and Financial Statement Schedules |
| (a) | Exhibit Index |
II-2
Table of Contents
See the Exhibit Index following the signature page.
| (b) | Financial Statement Schedule |
None. Financial statement schedules have been omitted because the information is included in our consolidated financial statements included elsewhere in this Registration Statement.
| Item 17. | Undertakings |
(a) The undersigned registrant hereby undertakes to provide to the underwriter at the closing specified in the underwriting agreements, certificates in such denominations and registered in such names as required by the underwriter to permit prompt delivery to each purchaser.
(b) Insofar as indemnification for liabilities arising under the Securities Act of 1933 may be permitted to directors, officers and controlling persons of the registrant pursuant to the foregoing provisions, or otherwise, the registrant has been advised that in the opinion of the Securities and Exchange Commission such indemnification is against public policy as expressed in the Act and is, therefore, unenforceable. In the event that a claim for indemnification against such liabilities (other than the payment by the registrant of expenses incurred or paid by a director, officer or controlling person of the registrant in the successful defense of any action, suit or proceeding) is asserted by such director, officer or controlling person in connection with the securities being registered, the registrant will, unless in the opinion of its counsel the matter has been settled by controlling precedent, submit to a court of appropriate jurisdiction the question whether such indemnification by it is against public policy as expressed in the Act and will be governed by the final adjudication of such issue.
(c) The undersigned registrant hereby undertakes that:
(i) For purposes of determining any liability under the Securities Act of 1933, the information omitted from the form of prospectus filed as part of this registration statement in reliance upon Rule 430A and contained in a form of prospectus filed by the registrant pursuant to Rule 424(b)(1) or (4) or 497(h) under the Securities Act of 1933 shall be deemed to be part of this registration statement as of the time it was declared effective.
(ii) For the purpose of determining any liability under the Securities Act of 1933, each post-effective amendment that contains a form of prospectus shall be deemed to be a new registration statement relating to the securities offered therein, and the offering of such securities at that time shall be deemed to be the initial bona fide offering thereof.
II-3
Table of Contents
SIGNATURES
Pursuant to the requirements of the Securities Act of 1933, the registrant has duly caused this Registration Statement to be signed on its behalf by the undersigned, thereunto duly authorized in the City of Southlake, State of Texas, on July 15, 2013.
| Del Frisco’s Restaurant Group, Inc. | ||
| By: | /s/ Thomas J. Pennison, Jr. | |
| Name: |
Thomas J. Pennison, Jr. | |
| Title: |
Chief Financial Officer | |
POWER OF ATTORNEY
KNOW ALL MEN BY THESE PRESENTS, that each person whose signature appears below constitutes and appoints Mark S. Mednansky and Thomas J. Pennison, Jr., and each of them, his or her true and lawful attorneys-in-fact and agents, each with full power of substitution and resubstitution, for him or her and in his or her name, place and stead, in any and all capacities, to sign any and all amendments, including post-effective amendments, to this Registration Statement, and any registration statement relating to the offering covered by this Registration Statement and filed pursuant to Rule 462 under the Securities Act of 1933, as amended, and to file the same, with exhibits thereto and other documents in connection therewith, with the Securities and Exchange Commission, granting unto said attorneys-in-fact and agents, and each of them, full power and authority to do and perform each and every act and thing requisite and necessary to be done, as fully to all intents and purposes as he or she might or could do in person, hereby ratifying and confirming all that each of said attorneys-in-fact and agents or their substitute or substitutes may lawfully so or cause to be done by virtue hereof.
Pursuant to the requirements of the Securities Act of 1933, the following persons have signed this Registration Statement in the capacities and on the date indicated.
| /s/ Mark S. Mednansky Mark S. Mednansky |
Chief Executive Officer (Principal Executive Officer) |
July 15, 2013 | ||
| /s/ Thomas J. Pennison, Jr. Thomas J. Pennison, Jr. |
Chief Financial Officer (Principal Financial and Accounting Officer) |
July 15, 2013 | ||
| /s/ Norman J. Abdallah Norman J. Abdallah |
Director |
July 15, 2013 | ||
| /s/ David B. Barr David B. Barr |
Director |
July 15, 2013 | ||
| /s/ Bradley P. Boggess Bradley P. Boggess |
Director |
July 15, 2013 | ||
| /s/ Jodi L. Cason Jodi L. Cason |
Director |
July 15, 2013 | ||
II-4
Table of Contents
| /s/ Richard L. Davis Richard L. Davis |
Director |
July 15, 2013 | ||
| /s/ John R. Kinzer John R. Kinzer |
Director |
July 15, 2013 | ||
| /s/ Jeffrey B. Ulmer Jeffrey B. Ulmer |
Director |
July 15, 2013 | ||
| /s/ Samuel D. Loughlin Samuel D. Loughlin |
Chairman of the Board; Director |
July 15, 2013 | ||
II-5
Table of Contents
EXHIBIT INDEX
| Exhibit No. |
Description |
Reference | ||||||
| 1.1 | Form of Underwriting Agreement. | |||||||
| 3.1 | Certificate of Incorporation of the Registrant. | (d | ) | |||||
| 3.2 | Bylaws of the Registrant. | (c | ) | |||||
| 4.1 | Registration Rights Agreement between Del Frisco’s Restaurant Group, Inc. and LSF5 Wagon Holdings, LLC, dated July 26, 2012. | (e | ) | |||||
| 5.1 | Opinion of Gibson, Dunn & Crutcher LLP. | * | ||||||
| 10.1 | Loan Agreement, dated as of October 15, 2012, by and among Del Frisco’s Restaurant Group, Inc., certain subsidiaries as guarantors, and JP Morgan Chase Bank N.A. | (f | ) | |||||
| 10.2# | Del Frisco’s Restaurant Group 2012 Long-Term Incentive Plan. | (d | ) | |||||
| 10.3# | Del Frisco’s Restaurant Group Nonqualified Deferred Compensation Plan, effective as Amended and Restated December 1, 2007. | (a | ) | |||||
| 10.4# | First Amendment to Del Frisco’s Restaurant Group Nonqualified Deferred Compensation Plan, dated as of December 31, 2009. | (a | ) | |||||
| 10.5# | Executive Employment Agreement, dated February 7, 2011, by and between Mark Mednansky and Center Cut Hospitality, Inc. | (a | ) | |||||
| 10.6# | Letter Agreement, dated February 14, 2011, by and between Mark Mednansky and LSF5 Wagon Holdings, LLC. | (a | ) | |||||
| 10.7# | Letter Agreement, dated October 21, 2011, by and between LSF5 Wagon Holdings, LLC, Del Frisco’s Restaurant Group, LLC and Mark S. Mednansky. | (a | ) | |||||
| 10.8# | Subscription Agreement, dated April 30, 2007, by and between Mark S. Mednansky and LSF5 Wagon Holdings, LLC. | (a | ) | |||||
| 10.9# | Executive Employment Agreement, dated October 17, 2011, by and between Thomas J. Pennison, Jr. and Center Cut Hospitality, Inc. | (a | ) | |||||
| 10.10# | Letter Agreement, dated October 17, 2011, by and between Thomas J. Pennison, Jr. and LSF5 Wagon Holdings, LLC and Del Frisco’s Restaurant Group, LLC. | (a | ) | |||||
| 10.11# | Executive Employment Agreement, dated November 12, 2012, by and between Jeff Carcara and Center Cut Hospitality, Inc. | (g | ) | |||||
| 10.12# | Employment Agreement, effective January 4, 2012, between Thomas G. Dritsas and Center Cut Hospitality, Inc. | (b | ) | |||||
| 10.13# | Employment Agreement, effective January 25, 2012, between William S. Martens, III and Center Cut Hospitality, Inc. | (b | ) | |||||
| 10.14 | Form of Indemnification Agreement for officers and directors. | (c | ) | |||||
| 10.15 | Asset Advisory Agreement, dated December 13, 2006, by and between Hudson Advisors, L.L.C. and Lone Star Steakhouse & Saloon, Inc. | (b | ) | |||||
| 10.16 | Termination Agreement between Hudson Americas LLC, Center Cut Hospitality, Inc. and Lone Star Fund V (U.S.), L.P. dated as of July 23, 2012. | (d | ) | |||||
II-6
Table of Contents
| Exhibit No. |
Description |
Reference | ||||||
| 10.17 | Transition Services Agreement between Del Frisco’s Restaurant Group, Inc., Hudson Advisors LLC and Hudson Americas LLC dated as of July 23, 2012. | (d | ) | |||||
| 21.1 | List of Subsidiaries of the Registrant. | (h | ) | |||||
| 23.1 | Consent of Ernst & Young LLP. | |||||||
| 23.2 | Consent of Gibson, Dunn & Crutcher LLP (included in Exhibit 5.1). | * | ||||||
| 24.1 | Powers of Attorney (included on the signature page hereto). | |||||||
| * | To be filed by amendment. |
| (a) | Previously filed on January 24, 2012 as an exhibit to the Company’s Registration Statement on Form S-1 (File No. 333-179141) and incorporated herein by reference. |
| (b) | Previously filed on April 16, 2012 as an exhibit to Amendment No. 1 to the Company’s Registration Statement on Form S-1 (File No. 333-179141) and incorporated herein by reference. |
| (c) | Previously filed on June 11, 2012 as an exhibit to Amendment No. 3 to the Company’s Registration Statement on Form S-1 (File No. 333-179141) and incorporated herein by reference. |
| (d) | Previously filed on July 24, 2012 as an exhibit to Amendment No. 6 to the Company’s Registration Statement on Form S-1 (File No. 333-179141) and incorporated herein by reference. |
| (e) | Previously filed on August 21, 2012 as an exhibit to the Company’s Quarterly Report on Form 10-Q for the fiscal quarter ended June 12, 2012 and incorporated herein by reference. |
| (f) | Previously filed on October 16, 2012 as an exhibit to the Company’s Quarterly Report on Form 10-Q for the fiscal quarter ended September 4, 2012 and incorporated herein by reference. |
| (g) | Previously filed on November 14, 2012 as an exhibit to the Company’s Current Report on Form 8-K and incorporated herein by reference. |
| (h) | Previously filed on February 26, 2013 as an exhibit to the Company’s Annual Report on Form 10-K for the fiscal year ended December 25, 2012 and incorporated herein by reference. |
| # | Denotes management compensatory plan or arrangement. |
II-7