Attached files
| file | filename |
|---|---|
| 8-K - CHINA FUND INC | fp0007643_8k.htm |
|
Jun 30, 2013
|
Monthly Insight
The China Fund, Inc. (CHN)
|
|
Investment Objective
|
The investment objective of the Fund is to achieve long term capital appreciation. The Fund seeks to achieve its objective through investment in the equity securities of companies and other entities with significant assets, investments, production activities, trading or other business interests in China or which derive a significant part of their revenue from China.
The Fund has an operating policy that the Fund will invest at least 80% of its assets in China companies. For this purpose, ‘China companies’ are (i) companies for which the principal securities trading market is in China; (ii) companies for which the principal securities trading market is outside of China or in companies organized outside of China, that in both cases derive at least 50% of their revenues from goods or services sold or produced, or have a least 50% of their assets in China; or (iii) companies organized in China. Under the policy, China means the People’s Republic of China, including Hong Kong, and Taiwan. The Fund will provide its stockholders with at least 60 days’ prior notice of any change to this policy.
|
Performance Overview
|
|
Performance History
|
1 month
|
3 months
|
YTD
|
1 Year
|
3 Years
|
5 Years
|
10 Years
|
Since
|
|
(p.a.)
|
(p.a.)
|
(p.a.)
|
Inception
|
|||||
|
NAV (%)
|
-6.01
|
-1.20
|
1.82
|
11.52
|
3.63
|
5.11
|
15.40
|
10.58
|
|
Market price (%)
|
8.60
|
9.42
|
7.38
|
20.97
|
7.74
|
8.09
|
14.42
|
10.15
|
|
Benchmark (%)
|
-5.15
|
-3.77
|
-5.17
|
10.96
|
5.29
|
2.53
|
11.65
|
N/A
|
|
Performance History
|
2012
|
2011
|
2010
|
2009
|
2008
|
2007
|
2006
|
2005
|
|
NAV (%)
|
12.07
|
-24.37
|
27.25
|
72.82
|
-46.95
|
86.20
|
57.10
|
6.09
|
|
Market price (%)
|
20.46
|
-27.51
|
23.60
|
72.19
|
-40.65
|
50.24
|
65.67
|
-21.51
|
|
Benchmark (%)
|
22.65
|
-18.36
|
13.60
|
67.12
|
-49.37
|
37.97
|
39.50
|
10.27
|
Source: State Street Bank and Trust Company. Source for index data: MSCI as at Jun 30, 2013.
|
Portfolio Analysis
|
|
Sector allocation (%)
|
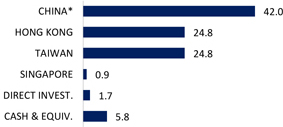
Country allocation (%)
|
 |
 |
|
Source: State Street Bank and Trust Company as at Jun 30, 2013.
|
* China includes A-shares (6.5%), A-share equity linked securities (7.4%),
B-shares (0.0%), H-shares (12.3%) and Red-chips (15.8%).
|

The China Fund, Inc. (CHN)
|
Portfolio Analysis (continued)
|
|
Top 10 Holdings
|
Sector
|
%
|
|
HAND ENTERPRISE SOLUTIONS CO., LTD.
|
I.T.
|
6.5
|
|
TAIWAN SEMICONDUCTOR MANUFACTURING CO., LTD.
|
I.T.
|
6.2
|
|
CHINA EVERBRIGHT INTERNATIONAL, LTD.
|
INDUSTRIALS
|
5.7
|
|
SUN HUNG KAI PROPERTIES, LTD.
|
FINANCIALS
|
4.5
|
|
INDUSTRIAL & COMMERCIAL BANK OF CHINA
|
FINANCIALS
|
4.3
|
|
CHINA MOBILE, LTD.
|
TELECOM
|
4.2
|
|
ENN ENERGY HOLDINGS, LTD.
|
UTILITIES
|
3.3
|
|
TENCENT HOLDINGS, LTD.
|
I.T.
|
2.9
|
|
DIGITAL CHINA HOLDINGS, LTD.
|
I.T.
|
2.4 |
|
RUENTEX DEVELOPMENT CO., LTD.
|
FINANCIALS
|
2.2
|
|
Total
|
|
42.2 |
|
Direct Investments
|
Sector
|
%
|
|
GOLDEN MEDITECH HOLDINGS, LTD. 15.0%, 11/16/13
|
OTHERS
|
1.7
|
|
Total
|
1.7
|
Source: State Street Bank and Trust Company as at Jun 30, 2013.
|
Fund Details
|
|
NAV
|
$22.99
|
|
Market price
|
$19.98
|
|
Premium/Discount
|
-13.09%
|
|
Market cap
|
US$313.3m
|
|
Shares outstanding
|
15,682,029
|
|
Exchange listed
|
NYSE
|
|
Listing date
|
July 10, 1992
|
|
Benchmark
|
MSCI Golden Dragon Index (Total Return)
|
|
Fund Manager
|
Christina Chung
|
|
Listed and direct investment manager
|
RCM Asia Pacific Limited
|
Source: State Street Bank and Trust Company as at Jun 30, 2013.
|
Dividend History (10 years)
|
|
Declaration
date |
Ex-dividend
date
|
Record
date |
Payable
date |
Dividend/
Share |
Income
|
Long-term Capital
|
Short-term Capital
|
|
10 Dec 2012
|
20 Dec 2012
|
24 Dec 2012
|
28 Dec 2012
|
3.2517
|
0.3473
|
2.9044
|
0.0000
|
|
8 Dec 2011
|
21 Dec 2011
|
23 Dec 2011
|
29 Dec 2011
|
2.9964
|
0.1742
|
2.8222
|
0.0000
|
|
8 Dec 2010
|
21 Dec 2010
|
24 Dec 2010
|
29 Dec 2010
|
2.2742
|
0.3746
|
1.8996
|
0.0000
|
|
9 Dec 2009
|
22 Dec 2009
|
24 Dec 2009
|
29 Dec 2009
|
0.2557
|
0.2557
|
0.0000
|
0.0000
|
|
8 Dec 2008
|
22 Dec 2008
|
24 Dec 2008
|
23 Jan 2009
|
5.8174
|
0.4813
|
5.3361
|
0.0000
|
|
7 Dec 2007
|
19 Dec 2007
|
21 Dec 2007
|
25 Jan 2008
|
12.1200
|
0.2800
|
9.0000
|
2.8400
|
|
8 Dec 2006
|
19 Dec 2006
|
21 Dec 2006
|
29 Dec 2006
|
4.0117
|
0.2996
|
2.7309
|
0.9812
|
|
9 Dec 2005
|
19 Dec 2005
|
21 Dec 2005
|
29 Dec 2005
|
2.5119
|
0.2172
|
2.2947
|
0.0000
|
|
13 Dec 2004
|
20 Dec 2004
|
22 Dec 2004
|
7 Jan 2005
|
3.5701
|
0.1963
|
3.2664
|
0.1074
|
|
19 Dec 2003
|
29 Dec 2003
|
31 Dec 2003
|
15 Jan 2004
|
1.7800
|
0.0700
|
0.6700
|
1.0400
|
Source : State Street Bank and Trust Company as at December 31, 2012
2
The China Fund, Inc. (CHN)
The China Fund Inc. NAV Performance of USD $10,000 since inception (with dividends reinvested at NAV price)
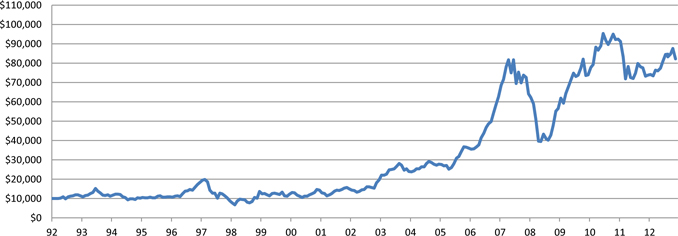
Past performance is not a guide to future returns.
Source: State Street Bank and Trust Company as at Jun 30, 2013.
The China Fund Inc. Premium / Discount
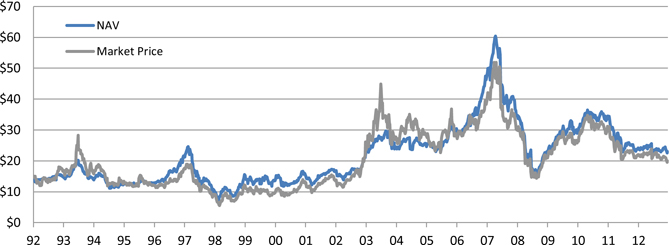
Past performance is not a guide to future returns.
Source: State Street Bank and Trust Company as at Jun 30, 2013.
3
The China Fund, Inc. (CHN)
Manager’s Commentary
Market Review
Given concerns over liquidity within the interbank system, weak China macroeconomic data, and potential Fed tapering, China equities, especially for the H-shares, suffered a sharp sell-off across the board in June. Investors remained skeptical about the Chinese economy with renewed concerns over a “hard” landing scenario after the weak Manufacturing Purchasing Managers’ Index numbers. Investors were also worried about the potential fund outflows from emerging markets and Hong Kong as a result of the potential tapering of quantitative easing in developed markets. In addition, China’s domestic short-term liquidity remained very tight after the Dragon Boat festival holiday with a spike of short term inter-bank rates to record levels. It caused a sharp sell down of Chinese banks and other cyclical sectors. Despite the central bank later reinstating its monetary stance and provision of liquidity to those financial institutions that support the real economy, equity markets remained volatile in the near term. Investors’ concerns regarding banking sector liquidity and a potential credit crunch should persist until the focus shifts to the first half earnings results and reform initiatives later on.
In Taiwan, official GDP growth was revised down to 2.4%, owing to weak first quarter 2013 numbers. The second quarter economic situation remains sluggish, due to weak consumption and recently slowed export momentum, as a result of faltering recovery in the economies of the United States and China. Corporate confidence and private investments remain the positive factors in sight, supported by corporates profitability.
Fund Review
The Fund underperformed relative to the benchmark in June, which was mainly attributable to stock selection in the information technology and materials sectors.
The top detractor for the month was Hand Enterprise Solution. There was no particular news flow on the company; its share price consolidated after the strong outperformance this year. Another detractor was Tiangong as the share price was undermined by slowing economic growth in China, and expectations that the demand for industrial goods may weaken. However, valuations remain cheap and the expansion into titanium production should still drive medium-term earnings growth. On the positive side, one of the top contributors was Tong Hsing. Its share price was supported by the strong demand for its image sensors and LED ceramic substrates.
Outlook
Market weakness is likely to continue in the near-term as upcoming corporate earnings results are not expected to provide positive surprises. In addition, the latest policy move to regulate off balance sheet lending and trade finance activities will inevitably lead to a tightening of liquidity in China in the short-term that could result in a general increase in caution across most businesses. While economic growth may be adversely affected in the short term, it is crucial to manage the risk to the financial sector at a time when the government is focusing on longer-term structural reforms. In this regard, investors may remain disappointed by the lack of pro-growth government policies and hence increasing risks of a ‘hard’ landing. We believe that investors should not be overly concerned that economic growth will not reaccelerate quickly, but rather, focus on potential reform initiatives to drive structural transformation. We would expect a positive news flow on reform initiatives to drive market recovery from an oversold position in the second half of 2013.
For the Taiwan market, we are cautious in the short-term as recent sentiment turned sour due to global market corrections. In addition, the delayed approval of an amendment to the stock capital gains taxes deterred the market rally in May. We believe weak domestic GDP growth and the noise over the continuity of US quantitative easing will suppress market performance in the third quarter, while policy clarification and strengthened exports may help the market regain momentum in the fourth quarter. Strong corporate earnings remain the major supportive factor for the Taiwan market.
Source : RCM Asia Pacific Limited as at Jun 30, 2013.
4
The China Fund, Inc. (CHN)
Portfolio Holdings
|
CUSIP
|
Security Description
|
Cost Base
|
Base MV
|
Shares
|
Percentage of
Net Assets
|
|
B3VN92906
|
HAND Enterprise Solutions Co., Ltd.
|
1,793,494.00
|
23,537,724.00
|
6,369,715
|
6.5
|
|
688910900
|
Taiwan Semiconductor Manufacturing Co., Ltd.
|
16,072,089.00
|
22,532,581.00
|
6,084,000
|
6.2
|
|
663094902
|
China Everbright International, Ltd.
|
12,183,629.00
|
20,712,248.00
|
26,730,000
|
5.7
|
|
685992000
|
Sun Hung Kai Properties, Ltd.
|
17,289,798.00
|
16,377,571.00
|
1,269,000
|
4.5
|
|
B1G1QD902
|
Industrial & Commercial Bank of China
|
16,829,554.00
|
15,377,101.00
|
24,390,000
|
4.3
|
|
607355906
|
China Mobile, Ltd.
|
15,085,051.00
|
15,133,101.00
|
1,445,500
|
4.2
|
|
633393905
|
Enn Energy Holdings, Ltd.
|
606,420.00
|
11,778,498.00
|
2,204,000
|
3.3
|
|
B01CT3905
|
Tencent Holdings, Ltd.
|
7,312,795.00
|
10,279,690.00
|
262,100
|
2.9
|
|
635186901
|
Digital China Holdings, Ltd.
|
13,205,899.00
|
8,672,230.00
|
7,256,000
|
2.4
|
|
674842901
|
Ruentex Development Co., Ltd.
|
3,423,335.00
|
8,001,239.00
|
4,416,301
|
2.2
|
|
913BMZ902
|
Ping An Insurance (Group) Company of China, Ltd.
|
9,494,980.00
|
7,977,649.00
|
1,418,047
|
2.2
|
|
Access Product (expiration 06/30/15)
|
|||||
|
644094906
|
Taiwan FamilyMart Co., Ltd.
|
1,247,038.00
|
7,743,467.00
|
1,663,652
|
2.1
|
|
B3WH02907
|
Hermes Microvision Inc.
|
7,867,215.00
|
7,718,795.00
|
269,000
|
2.1
|
|
959GRNII9
|
Taiwan Life Insurance Co., Ltd., 4.0%, 12/28/14
|
6,178,274.00
|
7,508,889.00
|
200,000,000
|
2.1
|
|
17313A533
|
Gree Electric Appliances, Inc. Access Product (expiration 01/17/14)
|
6,453,442.00
|
7,457,142.00
|
1,838,546
|
2.1
|
|
626073902
|
Delta Electronics, Inc.
|
4,550,608.00
|
7,355,360.00
|
1,615,000
|
2.0
|
|
B15456906
|
Bank of China, Ltd.
|
8,369,492.00
|
7,308,973.00
|
17,771,000
|
2.0
|
|
671815900
|
Qingling Motors Co., Ltd.
|
8,718,221.00
|
7,206,256.00
|
28,960,000
|
2.0
|
|
B00G0S903
|
CNOOC, Ltd.
|
8,859,687.00
|
7,173,724.00
|
4,228,000
|
2.0
|
|
619376908
|
China Resources Land, Ltd.
|
5,128,719.00
|
6,964,422.00
|
2,554,000
|
1.9
|
|
B1L8PB906
|
Tong Hsing Electronic Industries, Ltd.
|
5,919,469.00
|
6,630,410.00
|
1,380,000
|
1.8
|
|
637248907
|
MediaTek Inc.
|
6,194,126.00
|
6,500,000.00
|
559,000
|
1.8
|
|
B6WY99909
|
China Medical System Holdings, Ltd.
|
516,499.00
|
6,334,680.00
|
7,059,300
|
1.8
|
|
620267906
|
Advantech Co., Ltd.
|
4,104,779.00
|
6,126,322.00
|
1,284,000
|
1.7
|
|
986PLG005
|
Golden Meditech Holdings, Ltd. 15.0%, 11/16/13
|
6,001,198.00
|
6,005,299.00
|
58,222,500
|
1.7
|
|
B2R2ZC908
|
CSR Corp., Ltd.
|
7,466,211.00
|
5,812,446.00
|
9,930,000
|
1.6
|
|
658444906
|
Merida Industry Co., Ltd.
|
5,304,195.00
|
5,481,766.00
|
923,000
|
1.5
|
|
634007900
|
Kunlun Energy Co., Ltd.
|
4,298,243.00
|
4,736,561.00
|
2,666,000
|
1.3
|
|
626735906
|
Hong Kong Exchanges and Clearing, Ltd.
|
4,947,274.00
|
4,627,444.00
|
306,500
|
1.3
|
|
B3ZVDV905
|
Sinopharm Group Co., Ltd.
|
4,206,800.00
|
4,622,266.00
|
1,840,400
|
1.3
|
|
B236JB905
|
Tiangong International Co., Ltd.
|
5,449,043.00
|
4,574,641.00
|
18,480,000
|
1.3
|
|
643055908
|
Golden Meditech Holdings, Ltd.
|
4,555,715.00
|
4,201,466.00
|
35,040,000
|
1.2
|
|
613623909
|
Hengan International Group Co., Ltd.
|
3,889,897.00
|
4,066,709.00
|
375,500
|
1.1
|
|
17313X574
|
China State Construction Engineering Corp., Ltd.
(expiration 01/17/14) |
4,674,320.00
|
3,901,783.00
|
7,375,772
|
1.1
|
|
644806002
|
Hutchison Whampoa, Ltd.
|
3,303,627.00
|
3,848,211.00
|
366,000
|
1.1
|
|
B60LZR903
|
Agricultural Bank of China, Ltd.
|
4,802,654.00
|
3,842,318.00
|
9,313,000
|
1.1
|
|
670039007
|
Uni-President Enterprises Corp.
|
560,155.00
|
3,711,030.00
|
1,904,508
|
1.0
|
|
651795908
|
Natural Beauty Bio-Technology, Ltd.
|
4,906,910.00
|
3,629,236.00
|
47,710,000
|
1.0
|
|
99ZMCS903
|
Kweichow Moutai Co., Ltd. Access Product
(expiration 10/26/15)
|
4,046,181.00
|
3,508,349.00
|
112,684
|
1.0
|
|
665157905
|
Comba Telecom Systems Holdings, Ltd.
|
7,565,579.00
|
3,503,940.00
|
10,958,500
|
1.0
|
|
B6VG8G904
|
Asian Pay Television Trust
|
4,074,574.00
|
3,485,118.00
|
5,200,000
|
1.0
|
|
B16NHT900
|
Shui On Land, Ltd.
|
4,155,622.00
|
3,235,624.00
|
11,055,500
|
0.9
|
|
B633D9904
|
Zhongsheng Group Holdings, Ltd.
|
3,466,065.00
|
2,941,323.00
|
2,662,000
|
0.8
|
|
643648900
|
Shenzhen International Holdings, Ltd.
|
1,214,086.00
|
2,553,741.00
|
20,632,500
|
0.7
|
|
972ZGS900
|
Gree Electric Appliances, Inc. Access Product
(expiration 10/14/13)
|
1,898,593.00
|
1,745,090.00
|
430,249
|
0.5
|
|
B1TDQL904
|
Ping An Insurance (Group) Company of China, Ltd.
|
1,566,145.00
|
1,180,897.00
|
209,900
|
0.3
|
|
B4PTR3906
|
Access Product (expiration 01/17/14)
Fook Woo Group Holdings, Ltd.
|
7,974,083.00
|
1,119,460.00
|
25,314,000
|
0.3
|
|
972ZHB906
|
China State Construction Engineering Corp., Ltd.
(expiration 07/28/14) |
886,370.00
|
823,353.00
|
1,555,844
|
0.2
|
|
B9605Z902
|
FU JI Food & Catering Services Holdings, Ltd.
|
4,246,696.00
|
0.00
|
546,200
|
0.0
|
|
ACI0090H8
|
Zong Su Foods (acquired 09/21/10)
|
15,000,034.00
|
0.00
|
2,677
|
0.0
|
Source: State Street Bank and Trust Company as at Jun 30, 2013.
5
The China Fund, Inc. (CHN)
The information contained herein has been obtained from sources believed to be reliable but RCM and its affiliates do not warrant the information to be accurate, complete or reliable. The opinions expressed herein are subject to change at any time and without notice. Past performance is not indicative of future results. This material is not intended as an offer or solicitation for the purchase or sale of any financial instrument. Investors should consider the investment objectives, risks, charges and expenses of any mutual fund carefully before investing. This and other information is contained in the fund’s annual and semiannual reports, proxy statement and other fund information, which may be obtained by contacting your financial advisor or visiting the fund’s website at www.chinafundinc.com. This information is unaudited and is intended for informational purposes only. It is presented only to provide information on investment strategies and opportunities. The Fund seeks to achieve its objective through investment in the equity securities of companies and other entities with significant assets, investments, production activities, trading or other business interests in China or which derive a significant part of their revenue from China. Investing in non-U.S. securities entails additional risks, including political and economic risk and the risk of currency fluctuations, as well as lower liquidity. These risks, which can result in greater price volatility, will generally be enhanced in less diversified funds that concentrate investments in a particular geographic region. The Fund is a closed-end exchange traded management investment company. This material is presented only to provide information and is not intended for trading purposes. Closed-end funds, unlike open-end funds, are not continuously offered. After the initial public offering, shares are sold on the open market through a stock exchange, where shares may trade at a premium or a discount. Holdings are subject to change daily.
.