Attached files
| file | filename |
|---|---|
| 8-K - FORM 8-K - Simulations Plus, Inc. | simulations_8k-071113.htm |
| EX-99.1 - PRESS RELEASE - Simulations Plus, Inc. | simulations_8k-ex9901.htm |
Exhibit 99.2
Simulations Plus, Inc. (NASDAQ:SLP) Third Quarter Fiscal Year 2013 Conference Call and Webinar July 11, 2013
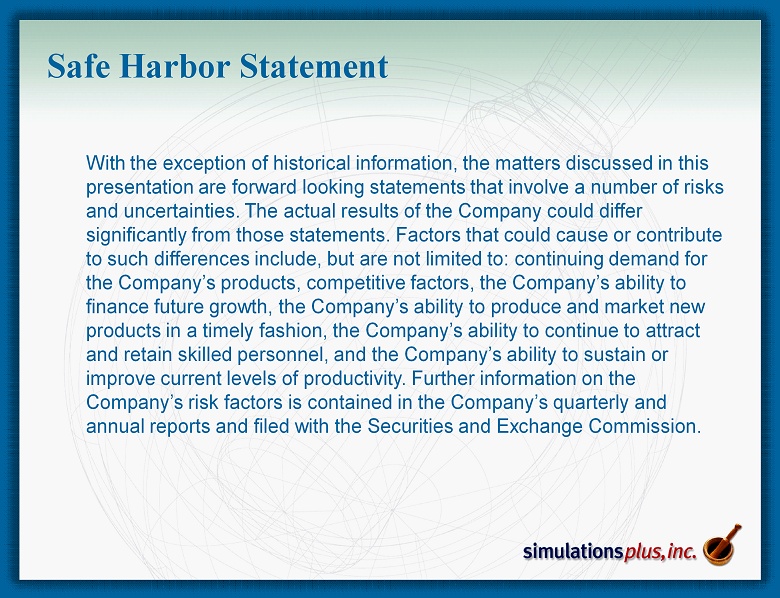
With the exception of historical information, the matters discussed in this presentation are forward looking statements that involve a number of risks and uncertainties. The actual results of the Company could differ significantly from those statements. Factors that could cause or contribute to such differences include, but are not limited to: continuing demand for the Company’s products, competitive factors, the Company’s ability to finance future growth, the Company’s ability to produce and market new products in a timely fashion, the Company’s ability to continue to attract and retain skilled personnel, and the Company’s ability to sustain or improve current levels of productivity. Further information on the Company’s risk factors is contained in the Company’s quarterly and annual reports and filed with the Securities and Exchange Commission. Safe Harbor Statement
| 2 |
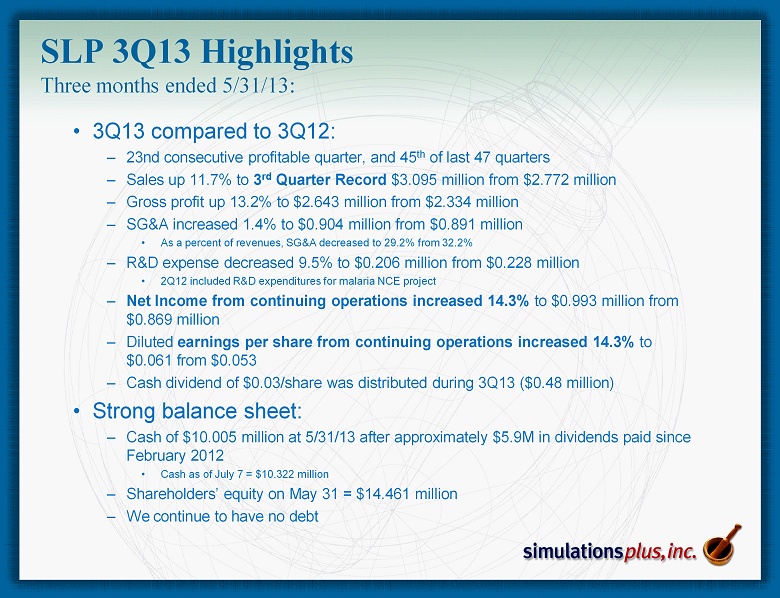
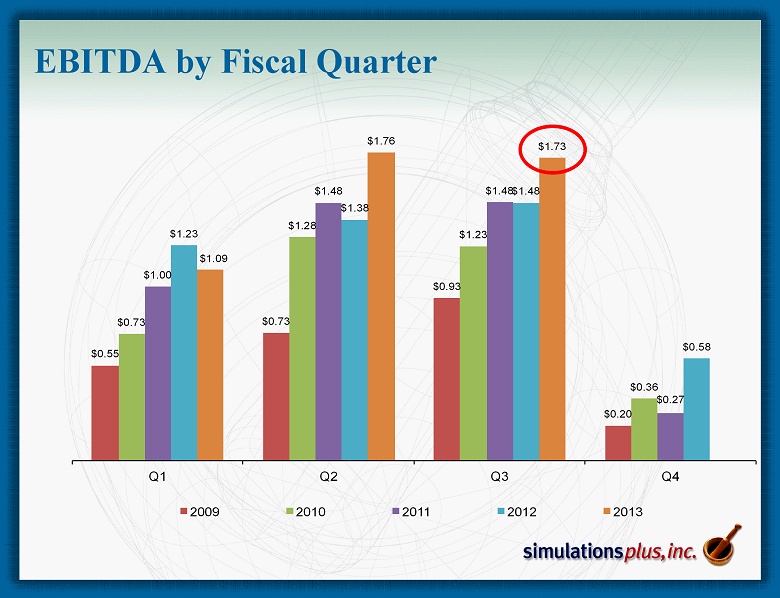
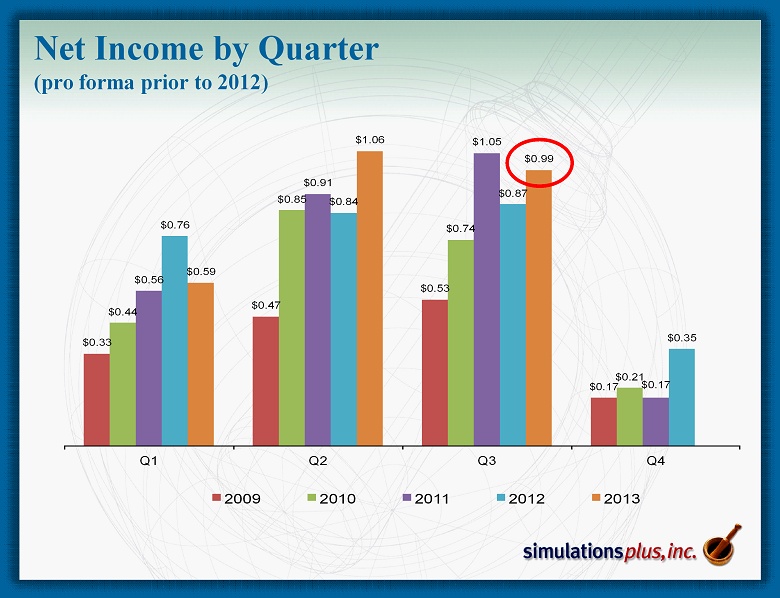
• 3 Q13 compared to 3Q12: – 23nd consecutive profitable quarter, and 45 th of last 47 quarters – Sales up 11.7% to 3 rd Quarter Record $3.095 million from $2.772 million – Gross profit up 13.2% to $2.643 million from $2.334 million – SG&A increased 1.4% to $0.904 million from $0.891 million • As a percent of revenues, SG&A decreased to 29.2% from 32.2% – R&D expense decreased 9.5% to $0.206 million from $0.228 million • 2Q12 included R&D expenditures for malaria NCE project – Net Income from continuing operations increased 14.3% to $0.993 million from $0.869 million – Diluted earnings per share from continuing operations increased 14.3% to $0.061 from $0.053 – Cash dividend of $0.03/share was distributed during 3Q13 ($0.48 million) • Strong balance sheet: – Cash of $10.005 million at 5/31/13 after approximately $5.9M in dividends paid since February 2012 • Cash as of July 7 = $10.322 million – Shareholders’ equity on May 31 = $14.461 million – We continue to have no debt SLP 3Q13 Highlights Three months ended 5/31/13:
| 3 |
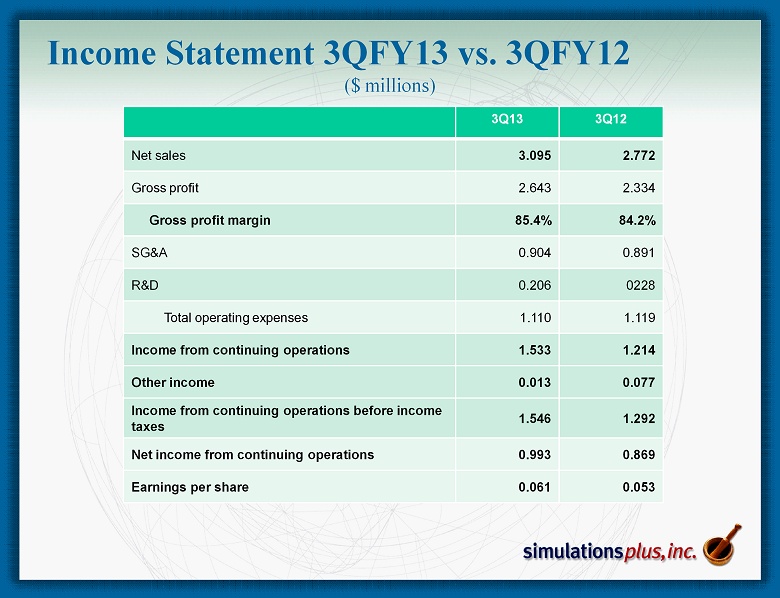
Income Statement 3 QFY13 vs. 3QFY12 ($ millions) 3Q13 3Q12 Net sales 3.095 2.772 Gross profit 2.643 2.334 Gross profit margin 85.4% 84.2% SG&A 0.904 0.891 R&D 0.206 0228 Total operating expenses 1.110 1.119 Income from continuing operations 1.533 1.214 Other income 0.013 0.077 Income from continuing operations before income taxes 1.546 1.292 Net income from continuing operations 0.993 0.869 Earnings per share 0.061 0.053
| 4 |
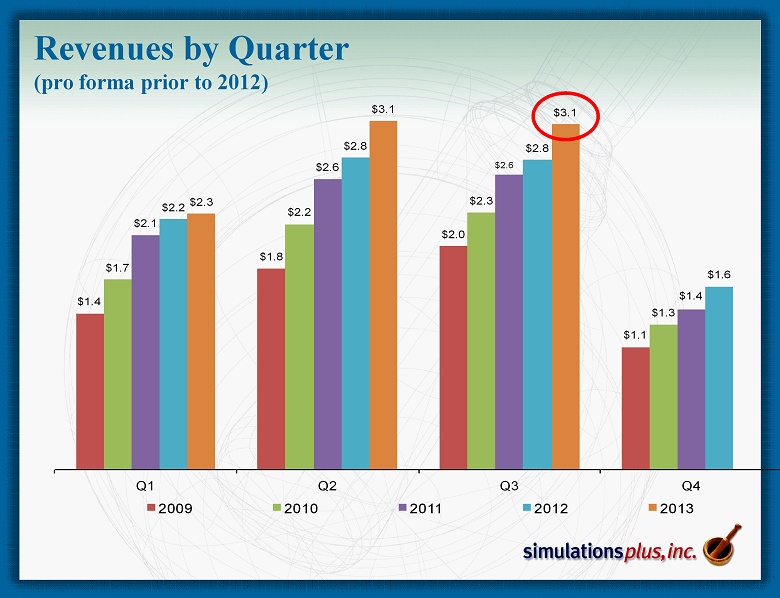
Revenues by Quarter (pro forma prior to 2012) $1.4 $1.8 $2.0 $1.1 $1.7 $2.2 $2.3 $1.3 $2.1 $2.6 $2.6 $1.4 $2.2 $2.8 $2.8 $1.6 $2.3 $3.1 $3.1 Q1 Q2 Q3 Q4 2009 2010 2011 2012 2013
| 5 |
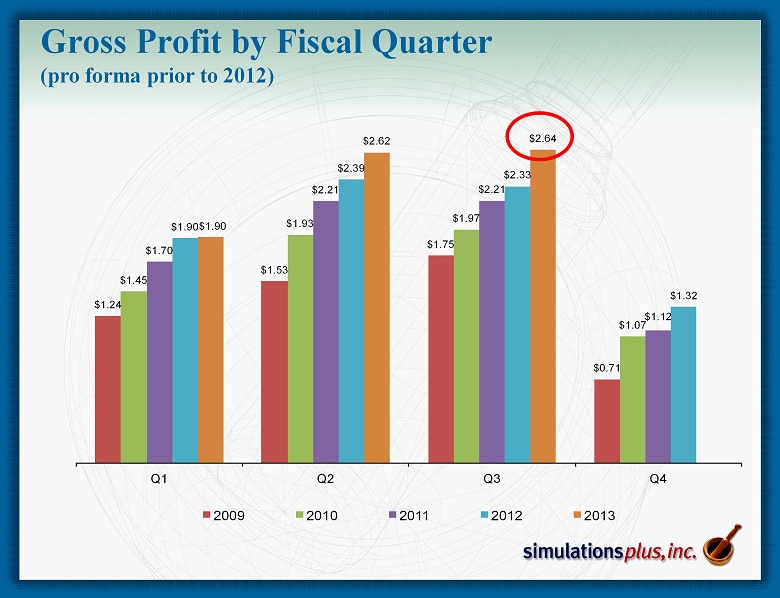
Gross Profit by Fiscal Quarter (pro forma prior to 2012) $1.24 $1.53 $1.75 $0.71 $1.45 $1.93 $1.97 $1.07 $1.70 $2.21 $2.21 $1.12 $1.90 $2.39 $2.33 $1.32 $1.90 $2.62 $2.64 Q1 Q2 Q3 Q4 2009 2010 2011 2012 2013
| 6 |
EBITDA by Fiscal Quarter $0.55 $0.73 $0.93 $0.20 $0.73 $1.28 $1.23 $0.36 $1.00 $1.48 $1.48 $0.27 $1.23 $1.38 $1.48 $0.58 $1.09 $1.76 $1.73 Q1 Q2 Q3 Q4 2009 2010 2011 2012 2013
| 7 |
Net Income by Quarter (pro forma prior to 2012) $0.33 $0.47 $0.53 $0.17 $0.44 $0.85 $0.74 $0.21 $0.56 $0.91 $1.05 $0.17 $0.76 $0.84 $0.87 $0.35 $0.59 $1.06 $0.99 Q1 Q2 Q3 Q4 2009 2010 2011 2012 2013
| 8 |
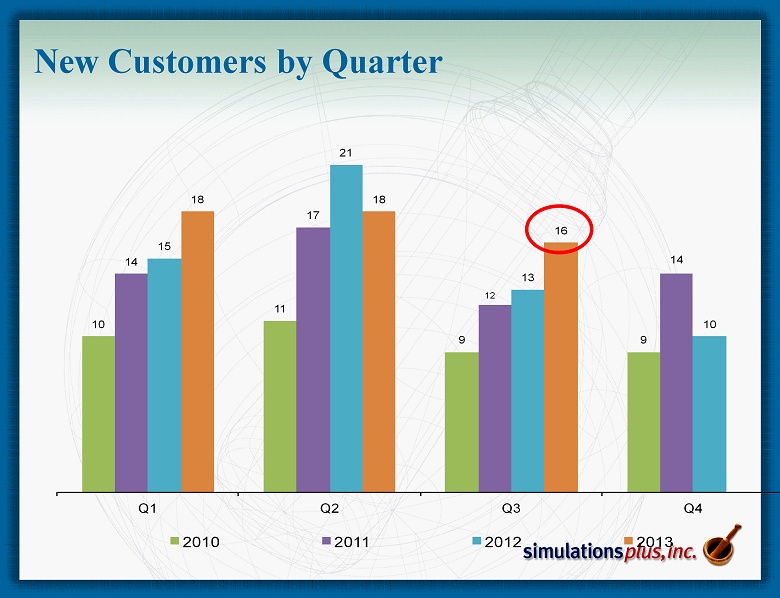
New Customers by Quarter 10 11 9 9 14 17 12 14 15 21 13 10 18 18 16 Q1 Q2 Q3 Q4 2010 2011 2012 2013
| 9 |
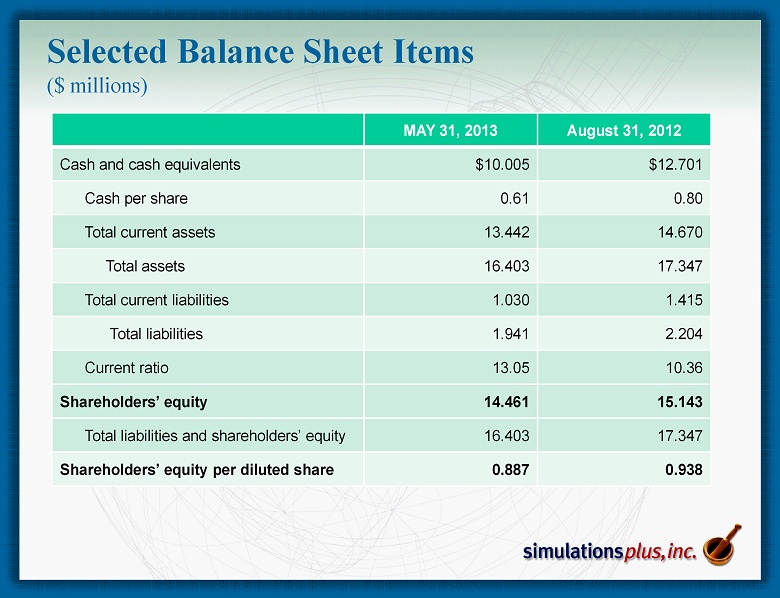
Selected Balance Sheet Items ($ millions) MAY 31, 2013 August 31, 2012 Cash and cash equivalents $10.005 $12.701 Cash per share 0.61 0.80 Total current assets 13.442 14.670 Total assets 16.403 17.347 Total current liabilities 1.030 1.415 Total liabilities 1.941 2.204 Current ratio 13.05 10.36 Shareholders’ equity 14.461 15.143 Total liabilities and shareholders’ equity 16.403 17.347 Shareholders’ equity per diluted share 0.887 0.938
| 10 |
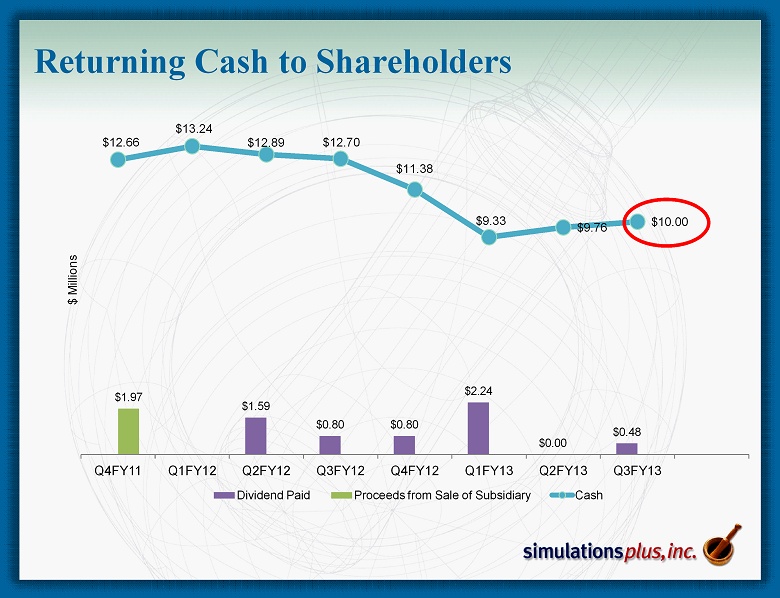
$1.59 $0.80 $0.80 $2.24 $0.00 $0.48 $1.97 $12.66 $13.24 $12.89 $12.70 $11.38 $9.33 $9.76 $10.00 Q4FY11 Q1FY12 Q2FY12 Q3FY12 Q4FY12 Q1FY13 Q2FY13 Q3FY13 $ Millions Dividend Paid Proceeds from Sale of Subsidiary Cash Returning Cash to Shareholders
| 11 |
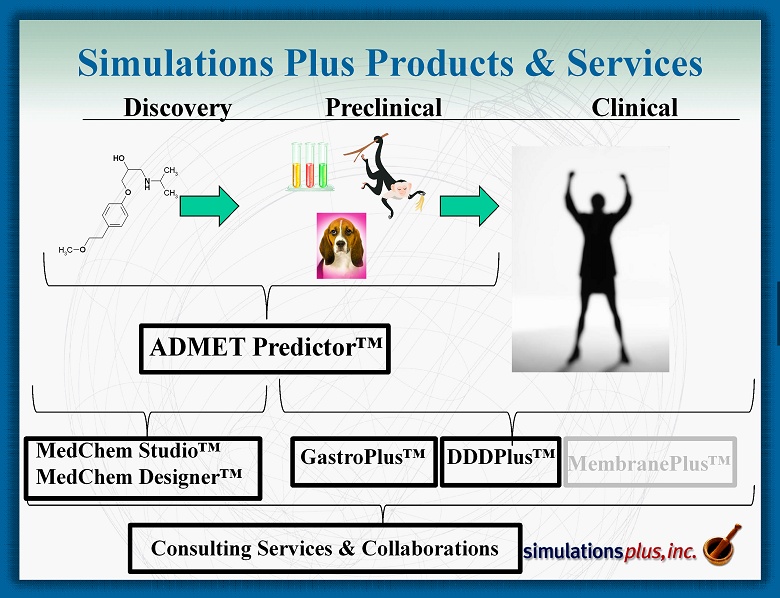
N H O OH O CH 3 CH 3 CH 3 Discovery Preclinical Clinical MedChem Studio™ MedChem Designer™ GastroPlus™ DDDPlus™ ADMET Predictor™ Simulations Plus Products & Services Consulting Services & Collaborations MembranePlus ™
| 12 |
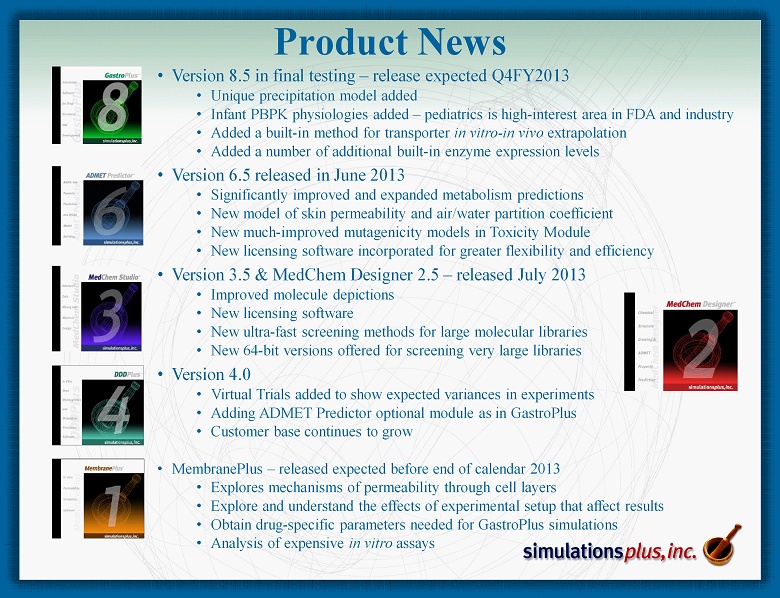
Product News • Version 8.5 in final testing – release expected Q4FY2013 • Unique precipitation model added • Infant PBPK physiologies added – pediatrics is high - interest area in FDA and industry • Added a built - in method for transporter in vitro - in vivo extrapolation • Added a number of additional built - in enzyme expression levels • Version 6.5 released in June 2013 • Significantly improved and expanded metabolism predictions • New model of skin permeability and air/water partition coefficient • New much - improved mutagenicity models in Toxicity Module • New licensing software incorporated for greater flexibility and efficiency • Version 3.5 & MedChem Designer 2.5 – released July 2013 • Improved molecule depictions • New licensing software • New ultra - fast screening methods for large molecular libraries • New 64 - bit versions offered for screening very large libraries • Version 4.0 • Virtual Trials added to show expected variances in experiments • Adding ADMET Predictor optional module as in GastroPlus • Customer base continues to grow • MembranePlus – released expected before end of calendar 2013 • Explores mechanisms of permeability through cell layers • Explore and understand the effects of experimental setup that affect results • Obtain drug - specific parameters needed for GastroPlus simulations • Analysis of expensive in vitro assays
| 13 |
Marketing and Sales Program • Conferences /Scientific Meetings continue to be primary source of leads • During Q3 we did 19 scientific meetings and conferences in the U.S . and Europe, as well as numerous customer visits in Japan • Trainings and Workshops • Conducted 8 on - site training courses at client sites, including over 35 scientists at the FDA and EPA • Held first Cheminformatics training workshop in March in Boston/Cambridge • Two GastroPlus introductory workshops were held with an overflow crowds • Strategic Digital Marketing Initiatives continue • Held 2 webinars on our Cheminformatics software – over 350 registrations • LinkedIn, Facebook, Twitter • Web site redesign completed • Collaborations/Consulting/Grants – Ongoing 5 - year collaboration with the FDA Center for Food Safety and Applied Nutrition to build toxicity models with ADMET Predictor/Modeler™ for food additives and contaminants – Executed Material Transfer Agreement with National Toxicology Program at NIEHS – Consulting studies continue – provides exposure of software to new groups – Ongoing funded collaboration to incorporate transdermal dosing into GastroPlus • We believe fundamental industry shift continues – Four recent submissions from our consulting contracts using GastroPlus modeling results were accepted by regulatory agencies – others also accepted directly from our customers without our consulting – 16 new customers during 3QFY13 (includes new companies as well as new departments within existing large customers)
| 14 |
NCE (New Chemical Entity) Project • Highly successful malaria NCE project demonstrated the value of Simulations Plus software and consulting services for new molecule design • Seven molecules were received from synthesis and were tested against the malaria parasite. All seven showed inhibition of the growth of the parasite, with two active at a nanomolar level against both wild - type and drug - resistant strains of the parasite . • Selection of a second disease target for another NCE design demonstration is ongoing. • Considerable study has gone into several potential targets. The one currently under examination looks promising. New molecules have been designed and are in final evaluation between other tasks. If final analyses are acceptable, we will issue Requests for Quotation for synthesis and testing of a number of new molecules. We expect this to take place in Q4FY13.
| 15 |
Summary • For 3 QFY13: - Record financial performance continues our 5 - year - plus profitable trend - Earnings growth 14.3% on 11.7% revenue growth demonstrates high margins - This is despite substantial increases in income taxes and health insurance • Continuing to Expand our Life Sciences team: - Two new Ph.D.s added in Q3FY13 - Continuing to seek and interview additional scientists - Additional staff will support expanded product line and greater consulting capacity - Life Sciences team strengthens and supports marketing and sales • Aggressive Marketing and Sales Activities - Greater staff time spent on marketing and sales activities - New training workshop for chemistry tools was held in Boston in March - GastroPlus introductory workshops held in Boston and San Diego - GastroPlus basic training workshop in planning for Japan for October • Simulations Plus is globally recognized as a leader - Outstanding reputation for scientific expertise and innovation - Known for strong customer support • Strong cash position and no debt – returning cash to shareholders - Cash dividends totaling approximately $5.9 million have been distributed, yet cash remains at over $10.3 million as of today. The Board of Directors is scheduled to vote on the potential August distribution at their July 29 meeting.
| 16 |
Q&A
| 17 |