Attached files
| file | filename |
|---|---|
| 8-K - FORM 8-K - ICAHN ENTERPRISES L.P. | v347587_8-k.htm |
| EX-99.1 - EXHIBIT 99.1 - ICAHN ENTERPRISES L.P. | v347587_ex99-1.htm |
Icahn Enterprises L.P. Investor Presentation June 2013

Forward - Looking Statements and Non - GAAP Financial Measures Forward - Looking Statements This presentation contains certain statements that are, or may be deemed to be, “forward - looking statements” within the meaning of Section 27 A of the Securities Act of 1933 , as amended, and Section 21 E of the Securities Exchange Act of 1934 , as amended . All statements included herein, other than statements that relate solely to historical fact, are “forward - looking statements . ” Such statements include, but are not limited to, any statement that may predict, forecast, indicate or imply future results, performance, achievements or events, or any statement that may relate to strategies, plans or objectives for, or potential results of, future operations, financial results, financial condition, business prospects, growth strategy or liquidity, and are based upon management’s current plans and beliefs or current estimates of future results or trends . Forward - looking statements can generally be identified by phrases such as “believes,” “expects,” “potential,” “continues,” “may,” “should,” “seeks,” “predicts,” “anticipates,” “intends,” “projects,” “estimates,” “plans,” “could,” “designed,” “should be” and other similar expressions that denote expectations of future or conditional events rather than statements of fact . Our expectations, beliefs and projections are expressed in good faith and we believe that there is a reasonable basis for them . However, there can be no assurance that these expectations, beliefs and projections will result or be achieved . There are a number of risks and uncertainties that could cause our actual results to differ materially from the forward - looking statements contained in this presentation . These risks and uncertainties are described in our Annual Report on Form 10 - K for the year ended December 31 , 2012 and our Quarterly Report on Form 10 - Q for the quarter ended March 31 , 2013 , as well as those described in the Preliminary Prospectus Supplement , including under “Risk Factors . ” There may be other factors not presently known to us or which we currently consider to be immaterial that may cause our actual results to differ materially from the forward - looking statements . You should refer to the summary financial information presented under the caption, “Summary Consolidated Historical Financial Data” in the Preliminary P rospectus Supplement before making any decision to purchase the offered depositary units . All forward - looking statements attributable to us or persons acting on our behalf apply only as of the date of this presentation and are expressly qualified in their entirety by the cautionary statements included in this presentation and in the prospectus supplement . Except to the extent required by law, we undertake no obligation to update or revise forward - looking statements to reflect events or circumstances after the date such statements are made or to reflect the occurrence of unanticipated events . Non - GAAP Financial Measures This presentation contains certain non - GAAP financial measures, including EBITDA, Adjusted EBITDA and Net Asset Value . The non - GAAP financial measures contained herein have limitations as analytical tools and should not be considered in isolation or in lieu of an analysis of our results as reported under U . S . GAAP . These non - GAAP measures should be evaluated only on a supplementary basis in connection with our U . S . GAAP results, including those reported in our consolidated financial statements and the related notes thereto contained in our Annual Report on Form 10 - K for the year ended December 31 , 2012 and our Quarterly Report on Form 10 - Q for the quarter ended March 31 , 2013 . You should refer to the information contained in the Preliminary P rospectus Supplement under the section “Summary Consolidated Historical Financial Data” for a more detailed description regarding the calculation of the non - GAAP measures contained herein and the respective limitations of each .

Investment Highlights (1) Source : Bloomberg. Includes reinvestment of distributions. Based on the share price as of June 10, 2013. (2) Returns are through June 10, 2013 (3) Return assumes that IEP’s holdings in CVR Energy remained in the Investment Funds for the entire period. IEP obtained a major ity stake in CVR Energy in May 2012. Investment Funds returns were ~6.6% when excluding returns on CVR Energy after it became a consolidated entity. Net Asset Value per unit increased from $57 on December 31, 2012 to $72 as of June 10 , 2013 (see page 35 for a more detailed discussion) $5.00 annual distribution (6.5 % yield as of June 10, 2013) Proven Track Record of Delivering Superior Returns – IEP stock price performance since January 2000 Total return of 1,085% (1) – S&P 500, Dow Jones Industrial and Russell 2000 indices only had a total return of approximately 45%, 83% and 136%, over the same period Equates to an annualized return of 20.2% to purchaser of stock on January 1, 2000 who sold on June 10, 2013 (1) – S&P 500, Dow Jones Industrial and Russell 2000 indices generated annualized returns of approximately 2.8%, 4.6% and 6.6%, over the same period (for other comparisons, see page 13) – Icahn Investment Funds performance since inception in November 2004 (2) Gross return of 198.5% Annualized rate of return of 13.5% Returns of 33.3%,15.2%, 34.5% and 20.2% (3) in 2009, 2010, 2011 and 2012, respectively 2013 year - to - date gross return of 9.4% Mr. Icahn believes that he has never seen a time for activism that is better than today: – Corporate balance sheets are carrying excess cash, credit markets are wide open and organic growth opportunities are limited – Activism is the catalyst needed to drive M&A and consolidation activity, which should unlock value and drive investor returns 3

The Icahn Strategy Across all of our businesses, our success is based on a simple formula: we seek to find undervalued companies in the Graham & Do dd tradition, a methodology for valuing stocks that primarily looks for deeply depressed prices. However, while the typical Graham & Dodd value investor purc has es undervalued securities and waits for results, we often become actively involved in the companies we target. That activity may involve a broad range of approac hes , from influencing the management of a target to take steps to improve shareholder value, to acquiring a controlling interest or outright ownership of the target com pany in order to implement changes that we believe are required to improve its business, and then operating and expanding that business. This activism has brought ab out very strong returns over the years. Today, we are a diversified holding company owning subsidiaries engaged in the following operating businesses: Investment, Au tom otive, Energy, Gaming, Railcar, Food Packaging, Metals, Real Estate and Home Fashion. Through our Investment segment, we have significant positions in variou s i nvestments, which include Chesapeake Energy (CHK), Forest Laboratories (FRX), Netflix (NFLX), Transocean Ltd. (RIG), Dell Inc. (DELL), Herbalife Ltd. ( HLF ), Nuance Communications, Inc. (NUAN) and Hain Celestial Group (HAIN), as of the date of this prospectus supplement. Several of our operating businesses started out as investment positions in debt or equity securities, held either directly by Ic ahn Enterprises or Mr. Icahn. Those positions ultimately resulted in control or complete ownership of the target company. Most recently, we acquired a controllin g i nterest in CVR Energy, Inc. (‘‘CVR’’), which started out as a position in our Investment segment and is now an operating subsidiary that comprises our Energy segmen t. As of June 10, 2013, based on the closing sale price of CVR stock and distributions since we acquired control, we had gains of approximately $2.9 billion on ou r p urchase of CVR. The recent acquisition of CVR, like our other operating subsidiaries, reflects our opportunistic approach to value creation, through which returns m ay be obtained by, among other things, promoting change through minority positions at targeted companies in our Investment segment or by acquiring control of those tar get companies that we believe we could run more profitably ourselves. In 2000, we began to expand our business beyond our traditional real estate activities, and to fully embrace our activist str ate gy. On January 1, 2000, the closing sale price of our depositary units was $7.625 per depositary unit. On June 10, 2013, our depositary units closed at $76.68 per dep osi tary unit, representing an increase approximately 1,085% since January 1, 2000 (including reinvestment of distributions into additional depositary units and taki ng into account in - kind distributions of depositary units). Comparatively, the S&P 500, Dow Jones Industrial and Russell 2000 indices increased approximately 45%, 83% an d 136%, respectively, over the same period (including reinvestment of distributions into those indices). During the next several years, we see a favorable opportunity to follow an activist strategy that centers on the purchase of tar get stock and the subsequent removal of any barriers that might interfere with a friendly purchase offer from a strong buyer. Alternatively, in appropriate circumsta nce s, we or our subsidiaries may become the buyer of target companies, adding them to our portfolio of operating subsidiaries, thereby expanding our operations through s uch opportunistic acquisitions. We believe that the companies that we target for our activist activities are undervalued for many reasons, often including inept managem ent . Unfortunately for the individual investor, in particular, and the economy, in general, many poor management teams are often unaccountable and very difficult t o r emove. 4
The Icahn Strategy (continued) Unlike the individual investor, we have the wherewithal to purchase companies that we feel we can operate more effectively th an incumbent management. In addition, through our Investment segment, we are in a position to pursue our activist strategy by purchasing stock or debt positions an d t rying to promulgate change through a variety of activist approaches, ranging from speaking and negotiating with the board and CEO to proxy fights, tender offers a nd taking control. We work diligently to enhance value for all shareholders and we believe that the best way to do this is to make underperforming management teams an d b oards accountable or to replace them. The Chairman of the Board of our general partner, Carl C. Icahn, has been an activist investor since 1980. Mr. Icahn believes th at he has never seen a time for activism that is better than today. Many major companies have substantial amounts of cash. We believe that they are hoarding cas h, rather than spending it, because they do not believe investments in their business will translate to earnings. We believe that one of the best ways for many cash - rich companies to achieve increased earnings is to use their large amounts of excess cash, together with advantageous borrowing opportunities, to purchase other companies in their industries and take advantage of the meaningful sy ner gies that could result. In our opinion, the CEOs and Boards of Directors of undervalued companies that would be acquisition targets are the major road blocks to this lo gical use of assets to increase value, because we believe those CEOs and Boards are not willing to give up their power and perquisites, even if they have done a poo r j ob in administering the companies they have been running. In addition, acquirers are often unwilling to undertake the arduous task of launching a hostile campa ign . This is precisely the situation in which we believe a strong activist catalyst is necessary. We believe that the activist catalyst adds value because, for companies with strong balance sheets, acquisition of their weak er industry rivals is often extremely compelling financially. We further believe that there are many transactions that make economic sense, even at a large premium ov er market. Acquirers can use their excess cash, that is earning a very low return, and/or borrow at the advantageous interest rates now available, to acquire a tar get company. In either case, an acquirer can add the target company’s earnings and the income from synergies to the acquirer’s bottom line, at a relatively low cost. But for these potential acquirers to act, the target company must be willing to at least entertain an offer. We believe that often the activist can step in and remove the obs tacles that a target may seek to use to prevent an acquisition. It is our belief that our strategy will continue to produce strong results in 2013 and into the future, and that belief is re fle cted in the action of the Board of Directors of our general partner, which announced on February 11, 2013, a decision to modify our distribution policy to increase our annual di str ibution to $4.00 per depositary unit. Further, on May 29, 2013, the Board of Directors of our general partner further modified our distribution policy to increase our annual distribution from $4.00 per depositary unit to $5.00 per depositary unit. We believe that the strong cash flow and asset coverage from our operating subs idi aries will allow us to maintain a strong balance sheet and ample liquidity. In our view Icahn Enterprises is in a virtuous cycle. By raising our distribution to our limited partners, and with the resul ts we hope to achieve in 2013, we believe that our depositary units will give us another powerful activist tool, allowing us both to use our depositary units as currency fo r t ender offers and acquisitions (both hostile and friendly) where appropriate, and to increase our fire power by raising additional cash through depositary unit sales. All of these factors will, in our opinion, contribute to making our activism even more efficacious, which we expect to enhance our results and stock value. 5
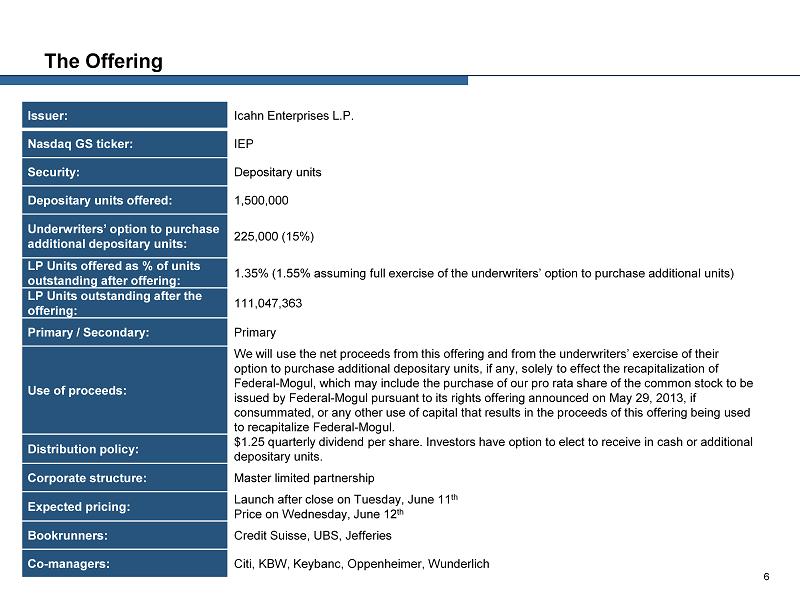
The Offering Issuer: Icahn Enterprises L.P. Nasdaq GS ticker: IEP Security: Depositary units Depositary units offered: 1,500,000 Underwriters’ option to purchase additional depositary units: 225,000 (15%) LP Units offered as % of units outstanding after offering: 1.35% (1.55% assuming full exercise of the underwriters’ option to purchase additional units) LP Units outstanding after the offering: 111,047,363 Primary / Secondary: Primary Use of proceeds: We will use the net proceeds from this offering and from the underwriters’ exercise of their option to purchase additional depositary units, if any, solely to effect the recapitalization of Federal - Mogul, which may include the purchase of our pro rata share of the common stock to be issued by Federal - Mogul pursuant to its rights offering announced on May 29, 2013, if consummated, or any other use of capital that results in the proceeds of this offering being used to recapitalize Federal - Mogul. Distribution policy: $1.25 quarterly dividend per share. Investors have option to elect to receive in cash or additional depositary units. Corporate structure: Master limited partnership Expected pricing: Launch after close on Tuesday, June 11 th Price on Wednesday, June 12 th Bookrunners : Credit Suisse, UBS, Jefferies Co - managers: Citi, KBW, Keybanc, Oppenheimer, Wunderlich 6
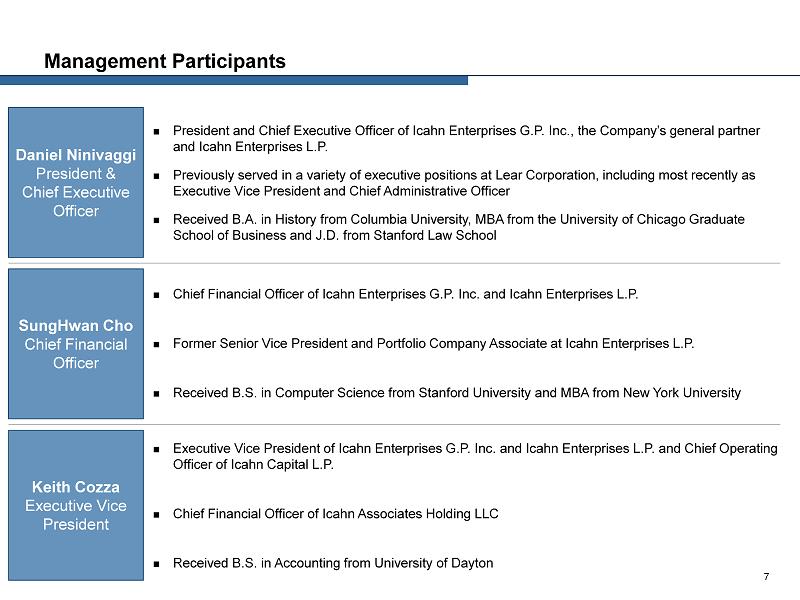
Daniel Ninivaggi President & Chief Executive Officer Management Participants President and Chief Executive Officer of Icahn Enterprises G.P. Inc., the Company’s general partner and Icahn Enterprises L.P . Previously served in a variety of executive positions at Lear Corporation, including most recently as Executive Vice President and Chief Administrative Officer Received B.A. in History from Columbia University, MBA from the University of Chicago Graduate School of Business and J.D. from Stanford Law School Chief Financial Officer of Icahn Enterprises G.P . Inc. and Icahn Enterprises L.P. Former Senior Vice President and Portfolio Company Associate at Icahn Enterprises L.P . Received B.S. in Computer Science from Stanford University and MBA from New York University Keith Cozza Executive Vice President Executive Vice President of Icahn Enterprises G.P. Inc. and Icahn Enterprises L.P. and Chief Operating Officer of Icahn Capital L.P. Chief Financial Officer of Icahn Associates Holding LLC Received B.S. in Accounting from University of Dayton SungHwan Cho Chief Financial Officer 7
Company Overview 8
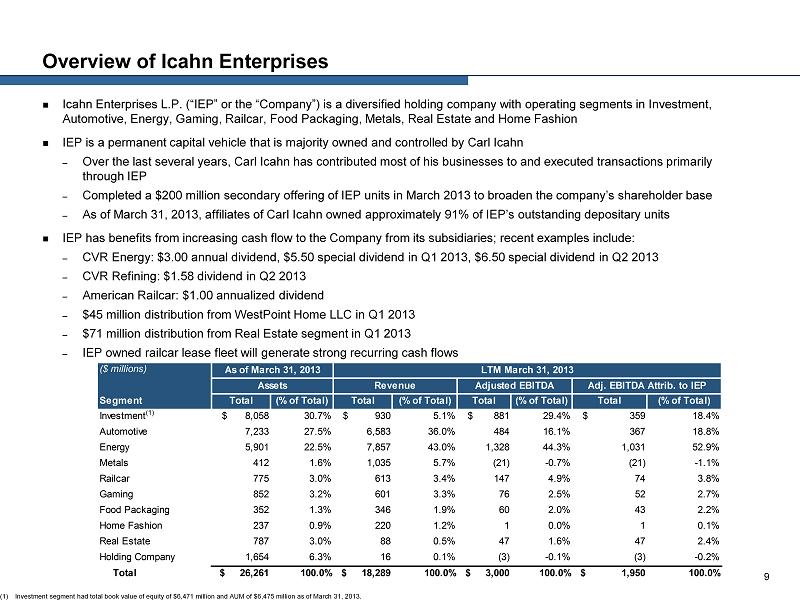
Overview of Icahn Enterprises Icahn Enterprises L.P . (“IEP” or the “Company”) is a diversified holding company with operating segments in Investment, Automotive , Energy, Gaming, Railcar, Food Packaging, Metals, Real Estate and Home Fashion IEP is a permanent capital vehicle that is majority owned and controlled by Carl Icahn – Over the last several years, Carl Icahn has contributed most of his businesses to and executed transactions primarily through IEP – Completed a $200 million secondary offering of IEP units in March 2013 to broaden the company’s shareholder base – As of March 31, 2013, affiliates of Carl Icahn owned approximately 91% of IEP’s outstanding depositary units IEP has benefits from increasing cash flow to the Company from its subsidiaries; recent examples include: – CVR Energy: $3.00 annual dividend, $5.50 special dividend in Q1 2013, $6.50 special dividend in Q2 2013 – CVR Refining: $1.58 dividend in Q2 2013 – American Railcar: $1.00 annualized dividend – $ 45 million distribution from WestPoint Home LLC in Q1 2013 – $71 million distribution from Real Estate segment in Q1 2013 – IEP owned railcar lease fleet will generate strong recurring cash flows (1) Investment segment had total book value of equity of $6,471 million and AUM of $6,475 million as of March 31, 2013. 9 ($ millions) Segment Total (% of Total) Total (% of Total) Total (% of Total) Total (% of Total) Investment (1) $ 8,058 30.7% $ 930 5.1% $ 881 29.4% $ 359 18.4% Automotive 7,233 27.5% 6,583 36.0% 484 16.1% 367 18.8% Energy 5,901 22.5% 7,857 43.0% 1,328 44.3% 1,031 52.9% Metals 412 1.6% 1,035 5.7% (21) -0.7% (21) -1.1% Railcar 775 3.0% 613 3.4% 147 4.9% 74 3.8% Gaming 852 3.2% 601 3.3% 76 2.5% 52 2.7% Food Packaging 352 1.3% 346 1.9% 60 2.0% 43 2.2% Home Fashion 237 0.9% 220 1.2% 1 0.0% 1 0.1% Real Estate 787 3.0% 88 0.5% 47 1.6% 47 2.4% Holding Company 1,654 6.3% 16 0.1% (3) -0.1% (3) -0.2% Total $ 26,261 100.0% $ 18,289 100.0% $ 3,000 100.0% $ 1,950 100.0% As of March 31, 2013 LTM March 31, 2013 Assets Revenue Adjusted EBITDA Adj. EBITDA Attrib. to IEP

Diversified Subsidiary Companies with Significant Inherent Value The Company’s diversification across multiple industries and geographies provides a natural hedge against cyclical and general economic swings Global market share leader in each of its principal product categories with a long history of quality and strong brand names Geographically diverse, regional properties in major gaming markets with significant consolidation opportunities 200 year heritage with some of the best known brands in home fashion; consolidation likely in fragmented sector Leading global market position in non - edible meat casings poised to capture further growth in emerging markets Established regional footprint positioned to actively participate in consolidation of the highly fragmented scrap metal market Leading, vertically integrated manufacturer of railcars with potential to participate in industry consolidation Strategically located mid - continent petroleum refiner and nitrogen fertilizer producer generating record profitability Long - term real estate investment horizon with strong, steady cash flows AREP Real Estate Holdings, LLC IEP’s subsidiary companies possess key competitive strengths and / or leading market positions IEP seeks to create incremental value by investing in organic growth and targeting businesses that offer consolidation opportunities ─ Capitalize on attractive interest rate environment to pursue acquisitions and recognize meaningful synergies 10
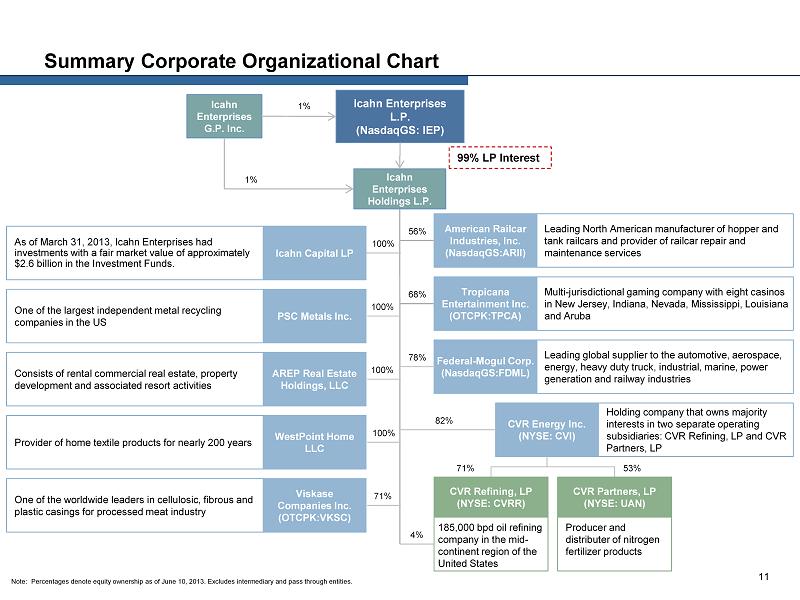
71% CVR Energy Inc. (NYSE: CVI) Summary Corporate Organizational Chart WestPoint Home LLC PSC Metals Inc. AREP Real Estate Holdings, LLC Tropicana Entertainment Inc. (OTCPK:TPCA) Federal - Mogul Corp. (NasdaqGS:FDML) Icahn Enterprises G.P. Inc. Icahn Enterprises L.P. (NasdaqGS: IEP) Icahn Enterprises Holdings L.P . 1% 1% 99% LP Interest 53% 71% 78% 82% American Railcar Industries, Inc. (NasdaqGS:ARII) Icahn Capital LP Viskase Companies Inc. (OTCPK:VKSC) As of March 31, 2013, Icahn Enterprises had investments with a fair market value of approximately $2.6 billion in the Investment Funds. One of the largest independent metal recycling companies in the US Consists of rental commercial real estate, property development and associated resort activities Provider of home textile products for nearly 200 years One of the worldwide leaders in cellulosic, fibrous and plastic casings for processed meat industry Holding company that owns majority interests in two separate operating subsidiaries: CVR Refining, LP and CVR Partners, LP Multi - jurisdictional gaming company with eight casinos in New Jersey, Indiana, Nevada, Mississippi, Louisiana and Aruba Leading North American manufacturer of hopper and tank railcars and provider of railcar repair and maintenance services 68% 100% 100% 56% Producer and distributer of nitrogen fertilizer products CVR Partners, LP (NYSE: UAN) CVR Refining, LP (NYSE: CVRR) 185,000 bpd oil refining company in the mid - continent region of the United States 100% 100% 4% Leading global supplier to the automotive, aerospace, energy, heavy duty truck, industrial, marine, power generation and railway industries Note : Percentages denote equity ownership as of June 10, 2013. Excludes intermediary and pass through entities. 11
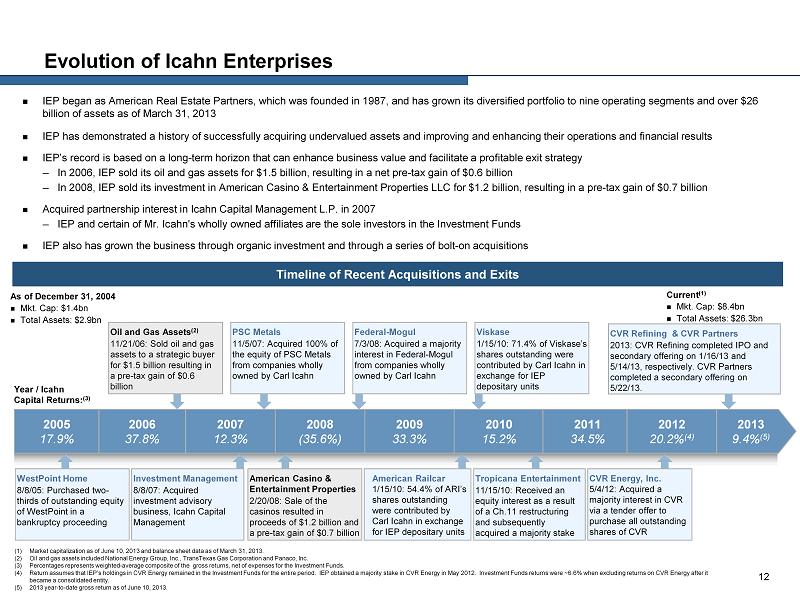
IEP began as American Real Estate Partners, which was founded in 1987, and has grown its diversified portfolio to nine operating segments and over $26 billion of assets as of March 31, 2013 IEP has demonstrated a history of successfully acquiring undervalued assets and improving and enhancing their operations and fin ancial results IEP’s record is based on a long - term horizon that can enhance business value and facilitate a profitable exit strategy ─ In 2006, IEP sold its oil and gas assets for $1.5 billion, resulting in a net pre - tax gain of $0.6 billion ─ In 2008, IEP sold its investment in American Casino & Entertainment Properties LLC for $1.2 billion, resulting in a pre - tax gain of $0.7 billion Acquired partnership interest in Icahn Capital Management L.P . in 2007 ─ IEP and certain of Mr. Icahn's wholly owned affiliates are the sole investors in the Investment Funds IEP also has grown the business through organic investment and through a series of bolt - on acquisitions Evolution of Icahn Enterprises Timeline of Recent Acquisitions and Exits (1) Market capitalization as of June 10, 2013 and balance sheet data as of March 31, 2013. (2) Oil and gas assets included National Energy Group, Inc., TransTexas Gas Corporation and Panaco, Inc . (3) Percentages represents weighted - average composite of the gross returns, net of expenses for the Investment Funds. (4) Return assumes that IEP’s holdings in CVR Energy remained in the Investment Funds for the entire period. IEP obtained a majority stake in CVR Energy in May 2012. Investment Fu nds returns were ~6.6% when excluding returns on CVR Energy after it became a consolidated entity . (5) 2013 year - to - date gross return as of June 10, 2013. As of December 31, 2004 Mkt. Cap: $1.4bn Total Assets: $2.9bn Current (1) Mkt. Cap: $8.4bn Total Assets: $26.3bn 2009 33.3% 2010 15.2% 2005 17.9% 2006 37.8% 2008 (35.6%) 2007 12.3% 2011 34.5% American Casino & Entertainment Properties 2/20/08: Sale of the casinos resulted in proceeds of $1.2 billion and a pre - tax gain of $0.7 b illion American Railcar 1/15/10: 54.4% of ARI’s shares outstanding were contributed by Carl Icahn in exchange for IEP depositary units WestPoint Home 8/8/05: Purchased two - thirds of outstanding equity of WestPoint in a bankruptcy proceeding PSC Metals 11/5/07: Acquired 100% of the equity of PSC Metals from companies wholly owned by Carl Icahn Tropicana Entertainment 11/15/10: Received an equity interest as a result of a Ch.11 restructuring and subsequently acquired a majority stake CVR Energy, Inc. 5/4/12: Acquired a majority interest in CVR via a tender offer to purchase all outstanding shares of CVR Federal - Mogul 7/3/08: Acquired a majority interest in Federal - Mogul from companies wholly owned by Carl Icahn Investment Management 8/8/07: Acquired investment advisory business, Icahn Capital Management Viskase 1/15/10: 71.4 % of Viskase’s shares outstanding were contributed by Carl Icahn in exchange for IEP depositary units Oil and Gas Assets (2) 11/21/06: S old oil and gas assets to a strategic buyer for $1.5 billion resulting in a pre - tax gain of $0.6 billion Year / Icahn Capital Returns: (3) 12 CVR Refining & CVR Partners 2013: CVR Refining completed IPO and secondary offering on 1/16/13 and 5/14/13, respectively. CVR Partners completed a secondary offering on 5/22/13. 2013 9.4% (5) 2012 20.2% (4)

Proven Track Record of Delivering Superior Returns Time Period Trailing Returns (1) IEP Berkshire Leucadia Loews S&P 500 Dow Jones Russell 2000 1 Year 90.4% 41.7% 46.7% 14.4% 26.9% 24.7% 30.9% 3 Years 113.7% 55.7% 49.0% 42.5% 61.5% 62.4% 61.6% 5 Years 8.2% 36.6% (38.7%) (3.1%) 35.5% 42.8% 45.5% 7 Years 128.1% 90.0% 3.0% 38.2% 53.0% 69.1% 55.9% From January 1, 2000 through June 10, 2013 1,085.1% 208.2% 325.8% 405.0% 45.1% 82.7% 135.9% In 2000, IEP began to expand its business beyond its traditional real estate activities to fully embrace its activist strategy ─ IEP stock has increased 1,085% from January 1, 2000, representing an annualized return of 20.2% ( 1 ) Long - term investment time horizon enables IEP to maximize investment returns ─ Permanent capital supports investment horizon ─ Ability to capitalize on market dislocations ─ Remain steadfast through short - term price volatility ─ Focus on building value over time as targets grow and / or experiences turnaround of business performance (1) Source: Bloomberg. Includes reinvestment of distributions. Based on the current share price as of June 10, 2013. IEP Has Performed Favorably Relative to Peers 13

IEP seeks undervalued companies and often becomes “actively” involved in the targeted companies Activist strategy requires significant capital, rapid execution and willingness to take control of companies Implement changes required to improve businesses Ability to Maximize Shareholder Value Through Proven Activist Strategy Purchase of Stock or Debt IEP pursues its activist strategy and seeks to promulgate change x Dealing with the board and management x Proxy fights x Tender offers x Taking control With over 300 years of collective experience, IEP’s investment and legal team is capable of unlocking a target’s hidden value x Financial / balance sheet restructuring x Operation turnarounds x Strategic initiatives x Corporate governance changes IEP is a single, comprehensive investment platform ─ Corporate structure provides IEP the optionality to invest in any security, in any industry and during any cycle over a longe r t erm time horizon Mr. Icahn and Icahn Capital have a long and successful track record of generating significant returns employing the activist str ategy ─ IEP’s subsidiaries often started out as investment positions in debt or equity either directly by Icahn Capital or Mr. Icahn Putting Activism into Action 14
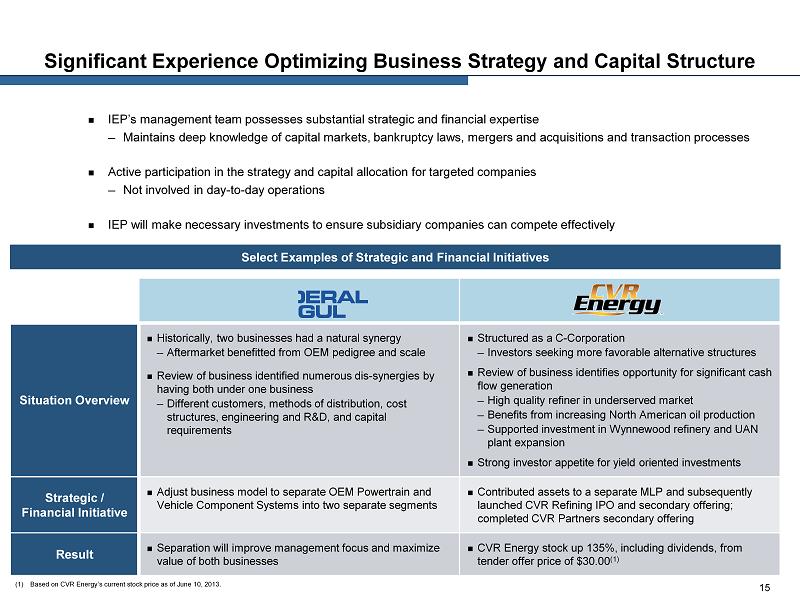
Situation Overview Historically, two businesses had a natural synergy ─ Aftermarket benefitted from OEM pedigree and scale Review of business identified numerous dis - synergies by having both under one business ─ Different customers, methods of distribution, cost structures, engineering and R&D, and capital requirements Structured as a C - Corporation ─ Investors seeking more favorable alternative structures Review of business identifies opportunity for significant cash flow generation ─ High quality refiner in underserved market ─ Benefits from increasing North American oil production ─ Supported investment in Wynnewood refinery and UAN plant expansion Strong investor appetite for yield oriented investments Strategic / Financial Initiative Adjust business model to separate OEM Powertrain and Vehicle Component Systems into two separate segments Contributed assets to a separate MLP and subsequently launched CVR Refining IPO and secondary offering; completed CVR Partners secondary offering Result Separation will improve management focus and maximize value of both businesses CVR Energy stock up 135%, including dividends, from tender offer price of $30.00 (1) Significant Experience Optimizing Business Strategy and Capital Structure IEP’s management team possesses substantial strategic and financial expertise ─ Maintains deep knowledge of capital markets, bankruptcy laws, mergers and acquisitions and transaction processes Active participation in the strategy and capital allocation for targeted companies ─ Not involved in day - to - day operations IEP w ill make necessary investments to ensure subsidiary companies can compete effectively Select Examples of Strategic and Financial Initiatives (1) Based on CVR Energy’s current stock price as of June 10, 2013. 15

Deep Team Led by Carl Icahn Led by Carl Icahn ─ Substantial investing history provides IEP with unique network of relationships and access to Wall Street Team consists of nearly 20 professionals with diverse backgrounds ─ Well rounded team with professionals focusing on different areas such as equity, distressed debt and credit Name Title Years at Icahn Years of Industry Experience Daniel Ninivaggi President & Chief Executive Officer , Icahn Enterprises L.P. 3 22 SungHwan Cho Chief Financial Officer , Icahn Enterprises L.P. 7 15 Vincent J. Intrieri Senior Managing Director, Icahn Capital 15 29 Samuel Merksamer Managing Director, Icahn Capital 5 10 Brett Icahn Portfolio Manager, Sargon Portfolio 11 11 David Schechter Portfolio Manager, Sargon Portfolio 9 16 Keith Cozza Chief Operating Officer, Icahn Capital 9 12 Keith Schaitkin General Counsel, Icahn Enterprises L.P. 12 33 16
Overview of Operating Segments 17
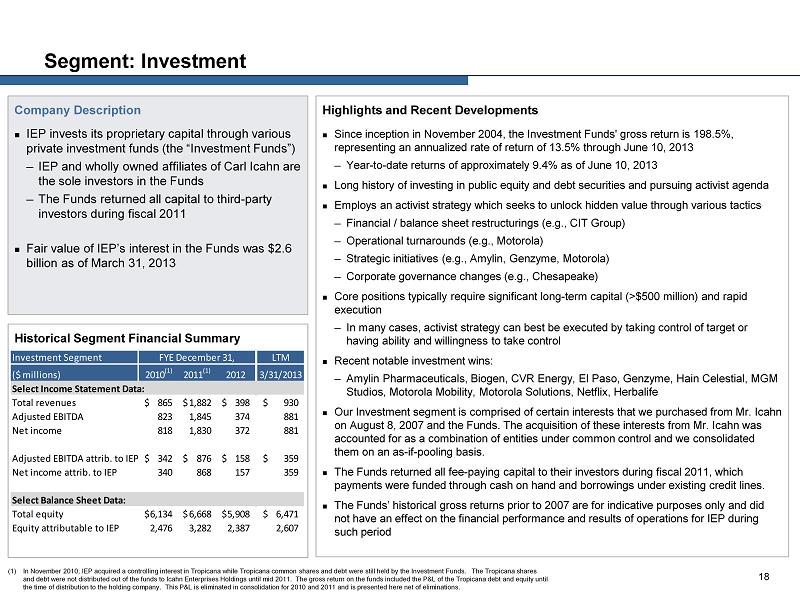
Highlights and Recent Developments Since inception in November 2004, the Investment Funds' gross return is 198.5%, representing an annualized rate of return of 13.5% through June 10, 2013 ─ Year - to - date returns of approximately 9.4% as of June 10, 2013 Long history of investing in public equity and debt securities and pursuing activist agenda Employs an activist strategy which seeks to unlock hidden value through various tactics ─ Financial / balance sheet restructurings (e.g., CIT Group) ─ Operational turnarounds (e.g., Motorola) ─ Strategic initiatives (e.g ., Amylin, Genzyme, Motorola) ─ Corporate governance changes (e.g ., Chesapeake) Core positions typically require significant long - term capital (>$500 million) and rapid execution ─ In many cases, activist strategy can best be executed by taking control of target or having ability and willingness to take control Recent notable investment wins: ─ Amylin Pharmaceuticals, Biogen, CVR Energy, El Paso, Genzyme, Hain Celestial, MGM Studios, Motorola Mobility, Motorola Solutions, Netflix, Herbalife Our Investment segment is comprised of certain interests that we purchased from Mr. Icahn on August 8, 2007 and the Funds. The acquisition of these interests from Mr. Icahn was accounted for as a combination of entities under common control and we consolidated them on an as - if - pooling basis. The Funds returned all fee - paying capital to their investors during fiscal 2011, which payments were funded through cash on hand and borrowings under existing credit lines. The Funds’ historical gross returns prior to 2007 are for indicative purposes only and did not have an effect on the financial performance and results of operations for IEP during such period Segment: Investment Company Description IEP invests its proprietary capital through various private investment funds (the “Investment Funds”) ─ IEP and wholly owned affiliates of Carl Icahn are the sole investors in the Funds ─ The Funds returned all capital to third - party investors during fiscal 2011 Fair value of IEP’s interest in the Funds was $2.6 billion as of March 31, 2013 Historical Segment Financial Summary 18 (1) In November 2010, IEP acquired a controlling interest in Tropicana while Tropicana common shares and debt were still held by the Investment Funds. The Tropicana shares and debt were not distributed out of the funds to Icahn Enterprises Holdings until mid 2011. The gross return on the funds i ncl uded the P&L of the Tropicana debt and equity until the time of distribution to the holding company. This P&L is eliminated in consolidation for 2010 and 2011 and is presented her e net of eliminations. Investment Segment LTM ($ millions) 2010 (1) 2011 (1) 2012 3/31/2013 Select Income Statement Data: Total revenues 865$ 1,882$ 398$ 930$ Adjusted EBITDA 823 1,845 374 881 Net income 818 1,830 372 881 Adjusted EBITDA attrib. to IEP 342$ 876$ 158$ 359$ Net income attrib. to IEP 340 868 157 359 Select Balance Sheet Data: Total equity 6,134$ 6,668$ 5,908$ 6,471$ Equity attributable to IEP 2,476 3,282 2,387 2,607 FYE December 31,

Significant Holdings As of June 10, 2013 (3) As of December 31, 2012 (3) As of December 31, 2011 (3) Company Mkt. Value ($mm) (4) % Ownership (5) Company Mkt. Value ($mm) (4) % Ownership (5) Company Mkt. Value ($mm) (4) % Ownership (5) $1,309 9.0% $1,083 11.5% $1,920 9.4% $1,258 11.5% $992 9.0% $1,773 12.0% $1,224 9.9% $514 10.0% $1,171 10.0% $1,080 4.6% $393 15.6% $798 9.9% $1,017 5.6% $274 14.3% $275 10.3% Icahn Capital (1) Represents a weighted - average composite of the gross returns, net of expenses for the Investment Funds. (2) Return assumes that IEP’s holdings in CVR Energy remained in the Investment Funds for the entire period. IEP obtained a majority stake in CVR Energy in May 2012. Inv est ment Funds returns were ~ 6.6% when excluding returns on CVR Energy after it became a consolidated entity . (3) Aggregate ownership held directly by IEP, as well as Carl Icahn and his affiliates. Based on most recent 13 - F Holdings Reports, 13 - D flings or other public filings available as of specified date. (4) Based on closing share price as of specified date. (5) Total shares owned as a percentage of common shares issued and outstanding. 17.9% 37.8% 12.3% 33.3% 15.2% 34.5% 20.2% 9.7% 2005 2006 2007 2008 2009 2010 2011 2012 2013 Q1 Historical Gross Returns (1) (35.6%) (2) 19

Highlights and Recent Developments CVR Refining IPO completed on January 23, 2013 and secondary offering on May 14, 2013 CVR Partners secondary offering completed May 22, 2013. Crude supply advantages supported by increasing North American crude oil production, decreasing North Sea production, transportation bottlenecks and geopolitical concerns ─ Strategic location allows CVR to benefit from an average realized discount to West Texas Intermediate on purchased crude CVR Partners’ expansion of UAN capacity completed in March 2013 ─ Profitability outlook is strong due to growing demand for corn and current low stocks CVR Energy paid special dividends of $5.50 and $6.50 per unit in Q1 2013 and Q2 2013, respectively, and adopted a $3.00 per unit annual dividend policy ─ CVR Refining 2013 full year distributable cash flow/share guidance of $ 5.50 - $6.50 per common unit ─ CVR Partners 2013 full year distribution outlook of $2.15 - $2.45 per common unit ─ Approximately 36% of production hedged for the remainder of 2013 at $27 crack spread as of March 31, 2013 Ownership Structure as of June 10, 2013: Segment: Energy Company Description CVR Energy, Inc. (NYSE:CVI) operates as a holding company that owns majority interests in two separate operating subsidiaries: CVR Refining, LP (NYSE:CVRR) and CVR Partners, LP ( NYSE:UAN ) ─ CVR Refining is an independent petroleum refiner and marketer of high - value transportation fuels in the mid - continent of the United States ─ CVR Partners is a leading nitrogen fertilizer producer in the heart of the Corn Belt Historical Segment Financial Summary CVR Refining, LP (NYSE:CVRR) CVR Partners, LP (NYSE:UAN ) CVR Energy, Inc. ( NYSE:CVI) Icahn Enterprises, L.P. (NasdaqGS:IEP) 82% 53% 71% 4% 20 Notes: IEP acquired a controlling interest in CVI on May 4, 2012. CVR Energy (Stand - alone) for 2011 is not pro - forma for the acquisition of Wynnewood refinery on December 15, 2011. Energy Segment ($ millions) 5/5/12 - 12/31/12 LTM 3/31/13 Select Income Statement Data: Total revenues 5,519$ 7,857$ Adjusted EBITDA 977 1,328 Net income 338 560 Adjusted EBITDA attrib. to IEP 787$ 1,031$ Net income attrib. to IEP 263 414 CVR Energy (Stand-alone) FYE 2011 FYE 2012 LTM 3/31/13 Net Sales 5,029$ 8,567$ 8,950$ Adjusted EBITDA attrib. to CVI 690 1,264 1,383 Net Income attrib. to CVI 346 379 569
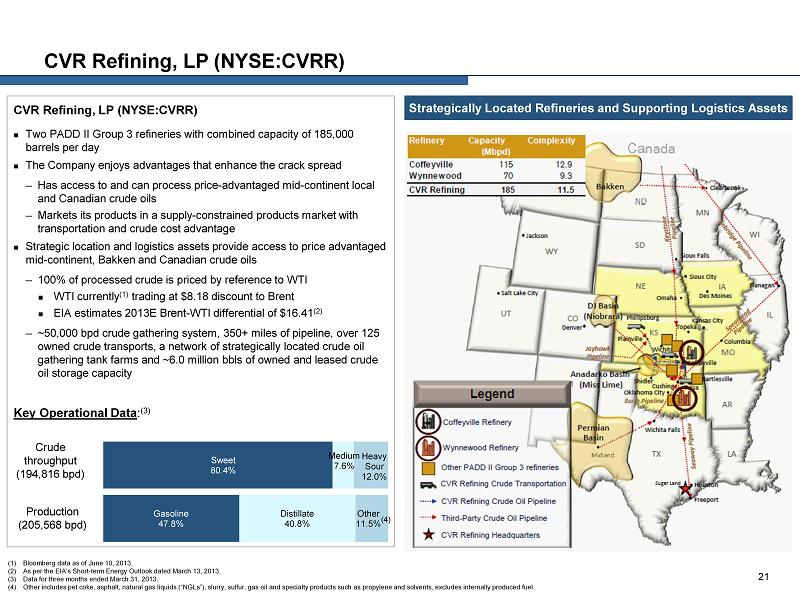
Gasoline 47.8% Distillate 40.8% Other 11.5% CVR Refining, LP (NYSE:CVRR ) Two PADD II Group 3 refineries with combined capacity of 185,000 barrels per day The Company enjoys advantages that enhance the crack spread ─ Has access to and can process price - advantaged mid - continent local and Canadian crude oils ─ Markets its products in a supply - constrained products market with transportation and crude cost advantage Strategic location and logistics assets provide access to price advantaged mid - continent , Bakken and Canadian crude oils ─ 100 % of processed crude is priced by reference to WTI WTI currently (1) trading at $8.18 discount to Brent EIA estimates 2013E Brent - WTI differential of $ 16.41 (2 ) ─ ~50,000 bpd crude gathering system, 350+ miles of pipeline, over 125 owned crude transports, a network of strategically located crude oil gathering tank farms and ~ 6.0 million bbls of owned and leased crude oil storage capacity Key Operational Data : (3) CVR Refining, LP (NYSE:CVRR) Crude throughput (194,816 bpd) Production ( 205,568 bpd ) (1) Bloomberg data as of June 10, 2013. (2) As per the EIA’s Short - term Energy Outlook dated March 13, 2013. (3) Data for three months ended March 31, 2013. (4) Other includes pet coke, asphalt, natural gas liquids (“NGLs”), slurry, sulfur, gas oil and specialty products such as propylene an d s olvents, excludes internally produced fuel . Strategically Located Refineries and Supporting Logistics Assets (4) Sweet 80.4% Medium 7.6% Heavy Sour 12.0% 21

CVR Partners, LP (NYSE:UAN ) Attractive market dynamics for nitrogen fertilizer ─ Decreasing world farmland per capita ─ Increasing demand for corn (largest use of nitrogen fertilizer) and meat ─ Nitrogen represents ~63 % of fertilizer consumption ─ Nitrogen fertilizers must be applied annually, creating stable demand Expansion of UAN capacity completed in Q1 2013 United States is a net importer of fertilizer ─ Imports approximately 43% of its nitrogen fertilizer needs ─ Prices based on marginal imported product tied to high European natural gas prices Cost stability advantage ─ 87% fixed costs compared to competitors with 85 - 90 % variable costs tied to natural gas Strategically located assets ─ 54% of corn planted in 2012 was within $ 45/UAN ton freight rate of plant ─ ~$15/UAN ton transportation advantage to Corn Belt vs. U.S . Gulf Coast CVR Partners, LP (NYSE:UAN) Strategically Located Refineries and Supporting Logistics Assets Yukon 0 (1) Alberta 21 (1) Manitoba 5 (1) North West Territories 0 (1) Corporate Headquarters Fertilizer Plant 2011 Tons by State 100,000+ 10,000 to 100,000 Up to 10,000 22

Segment: Automotive Company Description Federal Mogul Corporation (NasdaqGS:FDML) operates in two business segments: Powertrain and Vehicle Component Systems ─ Powertrain focuses on original equipment powertrain products for automotive, heavy duty and industrial applications ─ Vehicle Component Systems sells and distributes a broad portfolio of products for the global light vehicle aftermarket, while also servicing original equipment manufacturers with certain products Historical Segment Financial Summary Powertrain Highlights and Recent Developments Industry - leading powertrain products to improve fuel economy, reduce emission and enhance durability Over 1,700 patents for powertrain technology and market leading position in many product categories Investing in emerging markets where there are attractive opportunities for growth Introduced enhanced restructuring initiative to lower cost structure, improve manufacturing footprint and drive emerging market growth 2012 results impacted by severe drop in European light vehicle and global heavy duty production Vehicle Component Systems Highlights and Recent Developments Aftermarket benefits from the growing number of vehicles on the road globally and the increasing average age of vehicles in Europe and North America Leader in each of its product categories with a long history of quality and strong brand names including Champion, Wagner, Ferodo, MOOG, Fel - Pro Global distribution channels evolving ─ Investing in emerging markets ─ Leverage brands across geographic markets ─ Streamline distribution in North America Restructuring business with a focus on building low cost manufacturing footprint and sourcing partnerships 23 Automotive Segment FYE December 31, LTM ($ millions) 2010 2011 2012 3/31/2013 Select Income Statement Data: Total revenues 6,239$ 6,937$ 6,677$ 6,583$ Adjusted EBITDA 661 688 508 484 Net income 160 168 (22) (89) Adjusted EBITDA attrib. to IEP 499$ 518$ 386$ 367$ Net income attrib. to IEP 116 121 (24) (76) Select Balance Sheet Data: Total assets 7,296$ 7,288$ 7,282$ 7,233$ Equity attributable to IEP 1,010 967 860 816

Powertrain Segment VCS Segment Product Line Market Position Product Line Market Position Pistons #1 in diesel pistons #2 a cross all pistons Engine Global #1 Rings & Liners Market leader Sealing Components Global #1 in Gaskets Valve Seats and Guides Market leader Brake Pads / Components Global #1 Bearings Market leader Chassis #1 North America #2 Europe Ignition #2 (following Beru spark plug acquisition) Wipers #2 North America #3 Europe Sealing #4 Overall Ignition #2 North America #3 Europe Systems Protection Market leader Federal - Mogul Corp.’s Leading Market Position 24
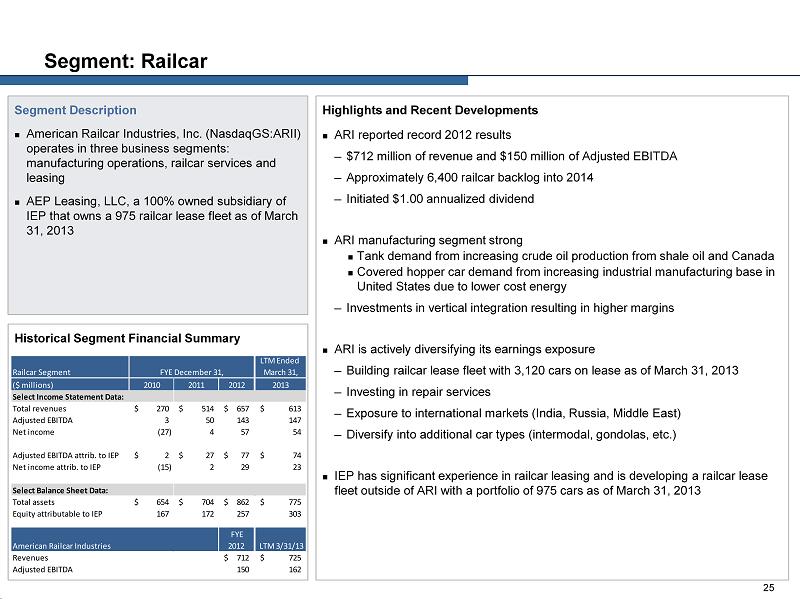
Highlights and Recent Developments ARI reported record 2012 results ─ $ 712 million of revenue and $ 150 million of Adjusted EBITDA ─ Approximately 6,400 railcar backlog into 2014 ─ Initiated $1.00 annualized dividend ARI manufacturing segment strong Tank demand from increasing crude oil production from shale oil and Canada Covered hopper car demand from increasing industrial manufacturing base in United States due to lower cost energy ─ Investments in vertical integration resulting in higher margins ARI is actively diversifying its earnings exposure ─ Building railcar lease fleet with 3,120 cars on lease as of March 31, 2013 ─ Investing in repair services ─ Exposure to international markets (India, Russia, Middle East) ─ Diversify into additional car types (intermodal, gondolas, etc.) IEP has significant experience in railcar leasing and is developing a railcar lease fleet outside of ARI with a portfolio of 975 cars as of March 31, 2013 Segment: Railcar Segment Description American Railcar Industries, Inc. ( NasdaqGS:ARII ) operates in three business segments: manufacturing operations, railcar services and leasing AEP Leasing, LLC, a 100% owned subsidiary of IEP that owns a 975 railcar lease fleet as of March 31, 2013 Historical Segment Financial Summary . 25 Railcar Segment LTM Ended March 31, ($ millions) 2010 2011 2012 2013 Select Income Statement Data: Total revenues 270$ 514$ 657$ 613$ Adjusted EBITDA 3 50 143 147 Net income (27) 4 57 54 Adjusted EBITDA attrib. to IEP 2$ 27$ 77$ 74$ Net income attrib. to IEP (15) 2 29 23 Select Balance Sheet Data: Total assets 654$ 704$ 862$ 775$ Equity attributable to IEP 167 172 257 303 FYE 2012 LTM 3/31/13 Revenues 712$ 725$ Adjusted EBITDA 150 162 FYE December 31, American Railcar Industries

Highlights and Recent Developments Management uses a highly analytical approach to enhance marketing, improve utilization, optimize product mix and reduce expenses ─ Established measurable, property specific, customer service goals and objectives to meet customer needs ─ Utilize sophisticated customer analytic techniques to improve customer experience ─ Reduced corporate overhead by approximately 50% since acquiring Tropicana Selective reinvestment in core properties including upgraded hotel rooms, refreshed casino floor products tailored for each regional market and pursuit of strong brands for restaurant and retail opportunities ─ Tropicana Atlantic City: $ 25 million investment plan ─ Casino Aztar : hotel room renovation in 2012 ─ Consolidated Lighthouse Point & Jubilee in Greenville, MS Announced sale of River Palms in Laughlin, NV C apital structure with ample liquidity for synergistic acquisitions in regional gaming markets Pursuing opportunities in Internet gaming as states legalize online gaming Segment: Gaming Company Description Tropicana Entertainment Inc. (OTCPK:TPCA) operates eight casino facilities featuring approximately 372,000 square feet of gaming space with 7,100 slot machines, 210 table games and 6,000 hotel rooms as of March 31, 2013 ─ Eight casino facilities located in New Jersey, Indiana, Nevada, Mississippi, Louisiana and Aruba ─ Successful track record operating gaming companies, dating back to 2000 Historical Segment Financial Summary 26 (1 ) Gaming segment results for 2010 are for the periods commencing November 15, 2010. Gaming Segment FYE December 31, LTM ($ millions) 2010 (1) 2011 2012 3/31/2013 Select Income Statement Data: Total revenues 78$ 624$ 611$ 601$ Adjusted EBITDA 6 72 79 76 Net income (1) 24 30 24 Adjusted EBITDA attrib. to IEP 1$ 37$ 54$ 52$ Net income attrib. to IEP 1 13 21 16 Select Balance Sheet Data: Total assets 793$ 770$ 852$ 852$ Equity attributable to IEP 122 402 379 382
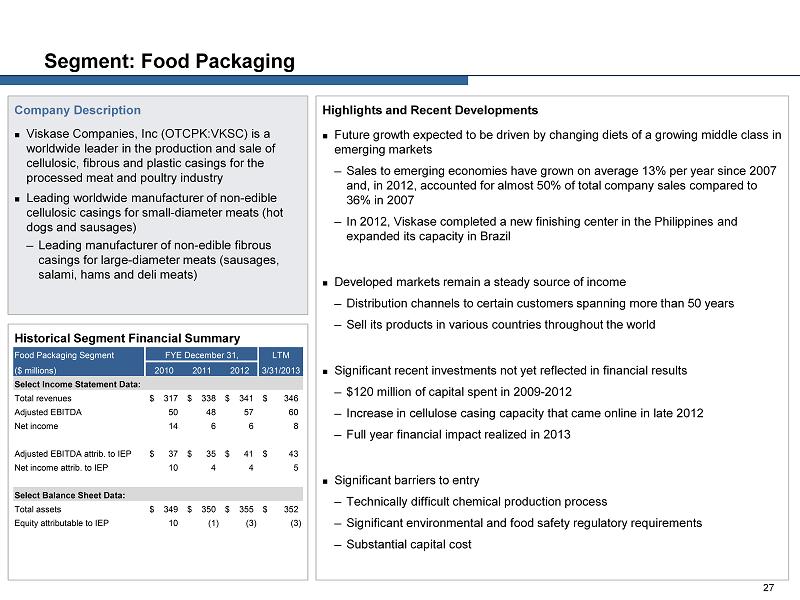
Highlights and Recent Developments Future growth expected to be driven by changing diets of a growing middle class in emerging markets ─ S ales to emerging economies have grown on average 13% per year since 2007 and, in 2012, accounted for almost 50% of total company sales compared to 36% in 2007 ─ In 2012, Viskase completed a new finishing center in the Philippines and expanded its capacity in Brazil Developed markets remain a steady source of income ─ Distribution channels to certain customers spanning more than 50 years ─ Sell its products in various countries throughout the world Significant recent investments not yet reflected in financial results ─ $120 million of capital spent in 2009 - 2012 ─ Increase in cellulose casing capacity that came online in late 2012 ─ Full year financial impact realized in 2013 Significant barriers to entry ─ Technically difficult chemical production process ─ Significant environmental and food safety regulatory requirements ─ Substantial capital cost Segment: Food Packaging Company Description Viskase Companies, Inc (OTCPK:VKSC) is a worldwide leader in the production and sale of cellulosic, fibrous and plastic casings for the processed meat and poultry industry Leading worldwide manufacturer of non - edible cellulosic casings for small - diameter meats (hot dogs and sausages) ─ Leading manufacturer of non - edible fibrous casings for large - diameter meats (sausages, salami, hams and deli meats) Historical Segment Financial Summary 27 Food Packaging Segment FYE December 31, LTM ($ millions) 2010 2011 2012 3/31/2013 Select Income Statement Data: Total revenues 317$ 338$ 341$ 346$ Adjusted EBITDA 50 48 57 60 Net income 14 6 6 8 Adjusted EBITDA attrib. to IEP 37$ 35$ 41$ 43$ Net income attrib. to IEP 10 4 4 5 Select Balance Sheet Data: Total assets 349$ 350$ 355$ 352$ Equity attributable to IEP 10 (1) (3) (3)

Highlights and Recent Developments North American steel production growth is expected to be 5% in 2013 ─ Demand increasing with rebound in non - residential (35 - 40% of steel demand, +6% growth) and residential (5 - 10% of steel demand, +20% growth) construction (1) Increasing global demand for steel and other metals drives demand for U.S. scrap exports PSC is in attractive regional markets ─ $1.8 billion of steel capacity additions in PSC’s geographic area including : V&M Star ($1.0 b illion ), Republic ($ 85 million), US Steel ($500 million) and Timken ($225 million) Scrap recycling process is “greener” than virgin steel production ─ Electric arc furnace steel mills are 60% of U.S. production (1) Highly fragmented industry with potential for further consolidation ─ Capitalizing on consolidation and vertical integration opportunities ─ PSC is building a leading position in its markets Product diversification will reduce volatility through cycles ─ Expansion of non - ferrous share of total business (30% of total revenues in 2012) ─ Opportunities for market extension: auto parts, e - recycling, wire recycling ─ Rebuilding of industrial service accounts Segment: Metals Company Description PSC Metals, Inc. is one of the largest independent metal recycling companies in the U.S. Collects industrial and obsolete scrap metal, processes it into reusable forms and supplies the recycled metals to its customers Strong regional footprint (Upper Midwest, St. Louis Region and the South) ─ Poised to take advantage of Marcellus and Utica shale energy driven investment Historical Segment Financial Summary 28 Metals Segment FYE December 31, LTM ($ millions) 2010 2011 2012 3/31/2013 Select Income Statement Data: Total revenues 725$ 1,096$ 1,103$ 1,035$ Adjusted EBITDA 24 26 (16) (21) Net income 4 6 (58) (62) Adjusted EBITDA attrib. to IEP 24$ 26$ (16)$ (21)$ Net income attrib. to IEP 4 6 (58) (62) Select Balance Sheet Data: Total assets 326$ 476$ 417$ 412$ Equity attributable to IEP 264 384 338 334 (1 ) Source: Steel Research Associates, LLC
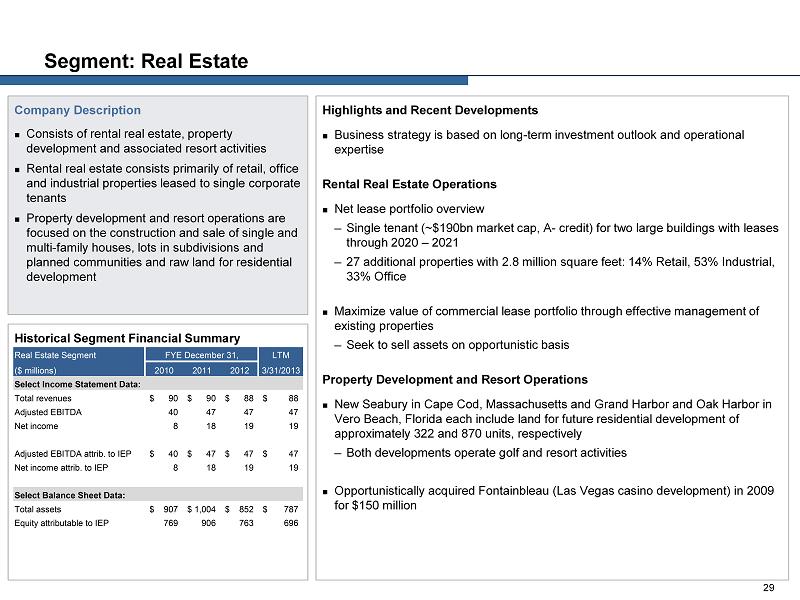
Highlights and Recent Developments Business strategy is based on long - term investment outlook and operational expertise Rental Real Estate Operations Net lease portfolio overview ─ Single tenant (~$190bn market cap, A - credit) for two large buildings with leases through 2020 – 2021 ─ 27 additional properties with 2.8 million square feet: 14% Retail, 53% Industrial, 33% Office Maximize value of commercial lease portfolio through effective management of existing properties ─ Seek to sell assets on opportunistic basis Property Development and Resort Operations New Seabury in Cape Cod, Massachusetts and Grand Harbor and Oak Harbor in Vero Beach, Florida each include land for future residential development of approximately 322 and 870 units, respectively ─ Both developments operate golf and resort activities Opportunistically acquired Fontainbleau (Las Vegas casino development) in 2009 for $150 million Segment: Real Estate Company Description Consists of rental real estate, property development and associated resort activities Rental real estate consists primarily of retail, office and industrial properties leased to single corporate tenants Property development and resort operations are focused on the construction and sale of single and multi - family houses, lots in subdivisions and planned communities and raw land for residential development Historical Segment Financial Summary 29 Real Estate Segment FYE December 31, LTM ($ millions) 2010 2011 2012 3/31/2013 Select Income Statement Data: Total revenues 90$ 90$ 88$ 88$ Adjusted EBITDA 40 47 47 47 Net income 8 18 19 19 Adjusted EBITDA attrib. to IEP 40$ 47$ 47$ 47$ Net income attrib. to IEP 8 18 19 19 Select Balance Sheet Data: Total assets 907$ 1,004$ 852$ 787$ Equity attributable to IEP 769 906 763 696

Highlights and Recent Developments One of the largest providers of home textile goods in the United States Largely completed restructuring of manufacturing footprint ─ Transitioned majority of manufacturing to low cost plants in Bahrain and Pakistan Streamlined merchandising, sales and customer service divisions Focus on core profitable customers and product lines ─ WPH implemented a more customer - focused organizational structure during the first quarter of 2012 with the intent of expanding key customer relationships and rebuilding the company’s sales backlog Consolidation opportunity in fragmented industry Realized benefits from use of NOLs Segment: Home Fashion Company Description WestPoint Home LLC is engaged in manufacturing, sourcing, marketing, distributing and selling home fashion consumer products WestPoint Home owns many of the most well - know brands in home textiles including Martex, Grand Patrician, Luxor and Vellux WPH also licenses brands such as IZOD, Under the Canopy, Southern Tide and Hanes Historical Segment Financial Summary 30 Home Fashion Segment FYE December 31, LTM ($ millions) 2010 2011 2012 3/31/2013 Select Income Statement Data: Total revenues 431$ 325$ 231$ 220$ Adjusted EBITDA (32) (31) (3) 1 Net income (62) (66) (27) (21) Adjusted EBITDA attrib. to IEP (23)$ (24)$ (3)$ 1$ Net income attrib. to IEP (42) (56) (27) (21) Select Balance Sheet Data: Total assets 408$ 319$ 291$ 237$ Equity attributable to IEP 313 283 256 207

Financial Performance 31

Financial Performance Adjusted EBITDA Attributable to Icahn Enterprises Equity Attributable to Icahn Enterprises 32 $939 $1,547 $1,542 $1,950 2010 2011 2012 LTM 3/31/13 $3,183 $3,755 $4,669 $5,068 2010 2011 2012 3/31/2013 LTM ($ in millions) 2010 2011 2012 3/31/2013 Investment 342$ 876$ 158$ 359$ Automotive 499 518 386 367 Energy - - 787 1,031 Metals 24 26 (16) (21) Railcar 2 27 77 74 Gaming 1 37 54 52 Food Packaging 37 35 41 43 Home Fashion (23) (24) (3) 1 Real Estate 40 47 47 47 Holding Company 17 5 11 (3) Total 939$ 1,547$ 1,542$ 1,950$ FYE December 31, Adjusted EBITDA attributable to Icahn Enterprises As of ($ millions) 2010 2011 2012 3/31/2013 Equity attributable to Icahn Enterprises Investment (1) 2,476$ 3,282$ 2,387$ 2,607$ Automotive 1,010 967 860 816 Energy - - 2,383 2,359 Metals 264 384 338 334 Railcar 167 172 257 303 Gaming 122 402 379 382 Food Packaging 10 (1) (3) (3) Home Fashion 313 283 256 207 Real Estate 769 906 763 696 Holding Company (1,948) (2,640) (2,951) (2,633) Total 3,183$ 3,755$ 4,669$ 5,068$ FYE December 31, (1) In November 2010, IEP acquired a controlling interest in Tropicana while Tropicana common shares and debt were still held by the Investment Funds. The Tropicana shares and debt were not distributed out of the funds to Icahn Enterprises Holdings until mid 2011. The gross return on the funds i ncl uded the P&L of the Tropicana debt and equity until the time of distribution to the holding company. This P&L is eliminated in consolidation for 2010 and 2011 and is presented her e net of eliminations.

Consolidated Financial Snapshot ($Millions) 33 2010 2011 2012 3/31/2012 3/31/2013 Revenues: Investment 887$ 1,896$ 398$ 71$ 603$ 930$ Automotive 6,239 6,937 6,677 1,774 1,680 6,583 Energy - - 5,519 - 2,338 7,857 Gaming 78 624 611 153 143 601 Railcar 270 514 657 182 138 613 Food Packaging 317 338 341 83 88 346 Metals 725 1,096 1,103 332 264 1,035 Real Estate 90 90 88 21 21 88 Home Fashion 431 325 231 57 46 220 Holding Company 57 36 29 11 (2) 16 Eliminations (22) (14) - - - - 9,072$ 11,842$ 15,654$ 2,684$ 5,319$ 18,289$ Adjusted EBITDA: Investment 823$ 1,845$ 374$ 68$ 575$ 881$ Automotive 661 688 508 165 141 484 Energy - - 977 - 351 1,328 Gaming 6 72 79 21 18 76 Railcar 3 50 143 30 34 147 Food Packaging 50 48 57 13 16 60 Metals 24 26 (16) - (5) (21) Real Estate 40 47 47 11 11 47 Home Fashion (32) (31) (3) (5) (1) 1 Holding Company 69 5 11 7 (7) (3) Consolidated Adjusted EBITDA 1,644$ 2,750$ 2,177$ 310$ 1,133$ 3,000$ NCI Adjusted EBITDA (705) (1,203) (635) (97) (512) (1,050) IEP Adjusted EBITDA 939$ 1,547$ 1,542$ 213$ 621$ 1,950$ Capital Expenditures 422$ 481$ 890$ 197$ 278$ 971$ LTM 3/31/2013 FYE December 31, Three Months Ended

Strong Balance Sheet As of March 31, 2013 Food Real Home Holding Investment Automotive Energy Metals Railcar Gaming Packaging Estate Fashion Company Consolidated Total Assets: Cash and Cash Equivalents: 2$ 269$ 1,041$ 16$ 57$ 241$ 18$ 26$ 12$ 755$ 2,437$ Cash at Partnerships and Restricted Cash 766 - - 3 6 15 1 4 9 620 1,424 Investments 7,226 247 - - 43 35 - - 13 126 7,690 Accounts Receivable, Net - 1,488 283 109 32 12 66 3 35 - 2,028 Inventories, Net - 1,124 525 106 86 - 66 - 61 - 1,968 Property, Plant And Equipment, Net - 1,946 2,637 139 520 430 153 662 81 3 6,571 Goodwill and Intangible Assets, Net - 1,772 1,322 11 7 68 11 75 3 - 3,269 Other Assets 64 387 93 28 24 51 37 17 23 150 874 Total Assets 8,058$ 7,233$ 5,901$ 412$ 775$ 852$ 352$ 787$ 237$ 1,654$ 26,261$ - Total Liabilities and Equity: Accounts Payable, Accrued and Other 544$ 1,901$ 1,547$ 72$ 144$ 131$ 71$ 21$ 30$ 206$ 4,667$ Securities Sold at Fair Value 620 - - - - - - - - - 620 Due To Brokers 423 - - - - - - - - - 423 Postemployment Benefit Liability - 1,361 - 3 9 - 65 - - - 1,438 Debt - 2,818 677 3 150 170 215 70 - 4,081 8,184 Total Liabilities 1,587$ 6,080$ 2,224$ 78$ 303$ 301$ 351$ 91$ 30$ 4,287$ 15,332$ Equity Attributable to Icahn Enterprises 2,607 816 2,359 334 303 382 (3) 696 207 (2,633) 5,068 Equity to Non-Controlling Interests 3,864 337 1,318 - 169 169 4 - - - 5,861 Total Equity 6,471$ 1,153$ 3,677$ 334$ 472$ 551$ 1$ 696$ 207$ (2,633)$ 10,929$ Total Liabilities and Equity 8,058$ 7,233$ 5,901$ 412$ 775$ 852$ 352$ 787$ 237$ 1,654$ 26,261$ ($Millions) 34

IEP Summary Financial Information Significant Valuation demonstrated by market value of IEP’s public subsidiaries and Holding Company interest in Funds and book value or market comparables of other assets (1) Investment Segment Equity Attributable to Icahn Enterprises as of the respective dates indicated. (2) Based on closing share price as of the respective dates indicated and the number of shares owned by the Holding Company on su ch date. The Holding Company owned (a) 71.2 million shares of CVR Energy as of each date indicated, (b) 4.0 million common units and 6.0 million common units of CVR Refining as of March 31, 2013 and June 10, 2013, respectively, (c) 7 6.4 million shares as of June 30, 2012 and 76.7 million shares of Federal - Mogul as of each other date indicated and (d) 11.9 million shares of American Railcar Industries as each date indicated. (3) Amounts based on market comparables due to lack of material trading volume. Tropicana valued at 7.0x, 7.0x, 8.0x and 9.0x Adj ust ed EBITDA for the twelve months ended June 30, 2012, September 30, 2012, December 31, 2012 and March 31, 2013, respectively. Viskase valued at 10.0x Adjusted EBITDA for the twelve months ended June 30, 2012, September 30, 2012 and June 10, 2013, and 11.0x Ad ju sted EBITDA for twelve months ended December 31 2012 and March 31, 2013. The June 10, 2013 Tropicana valuation is the same as March 31, 2013 valuation due to the lack of any new financial informatio n s ubsequent to March 31, 2013. (4) Represents equity attributable to us as of each respective date except for June 10, 2013 which is as of March 31, 2013, due t o l ack of any new financial information subsequent to March 31, 2013. (5) Holding Company’s cash and cash equivalents balance as of each respective date except for June 10, 2013 which is as of March 31, 2013 and pro forma ( i ) for the purchase of two million common units of CVRR and (ii) for the payment of the $6.50 special dividend paid by CVR on June 10, 2013. (6) March 31, 2013 and June 10, 2013 Holding Company debt are adjusted for the satisfaction and discharge of the indenture govern ing our variable rate convertible notes due 2013. (7) March 31, 2013 and June 10, 2013 Holding Company other net assets are adjusted for the satisfaction and discharge of the inde ntu re governing our variable rate convertible notes due 2013. June 10, 2013 is also adjusted for the distribution of additional IEP depository units on April 15, 2013 in connection with our quarterly distribution. (8) LP Units Outstanding and the GP Unit equivalent as of each respective date. (9) We use the net asset value of the depository units as an additional method for considering the value of the depositary units, an d we believe that this information can be helpful to investors. Please note, however, that the net asset value of the depositary units does not represent the market price at which the depositary units trade. Accordingly, data regarding net ass et value should not be considered in isolation. Our depository units are not redeemable, which means that investors have no right or ability to obtain from us the net asset value of depositary units that they own. Depositary units may be bought a nd sold on The NASDAQ Global Select Market (‘‘NASDAQ’’) at prevailing market prices. Those prices may be higher or lower than the net asset value of the depositary units as calculated by management. 35 ($Millions, except per unit amounts) As of June 30 Sept 30 Dec 31 March 31 June 10 2012 2012 2012 2013 2013 Market-valued Subsidiaries: Holding Company interest in Funds (1) $2,076 $2,349 $2,387 $2,607 $2,600 CVR Energy (2) 1,892 2,617 3,474 3,675 4,101 CVR Refining (2) -- -- -- 139 185 Federal-Mogul (2) 840 702 615 462 788 American Railcar Industries (2) 322 336 377 555 410 Total market-valued subsidiaries $5,130 $6,004 $6,853 $7,438 $8,083 Other Subsidiaries Tropicana (3) $480 $482 $512 $546 $546 Viskase (3) 148 155 268 283 240 Real Estate Holdings (4) 741 746 763 696 696 PSC Metals (4) 410 396 338 334 334 WestPoint Home (4) 271 266 256 207 207 AEP Leasing (4) -- 13 60 112 112 Total - other subsidiaries $2,050 $2,058 $2,196 $2,178 $2,136 Add: Holding Company cash and cash equivalents (5) 1,128 1,046 1,045 755 1,156 Less: Holding Company debt (6) (3,770) (4,084) (4,082) (3,525) (3,525) Add: Other Holding Company net assets (7) 37 43 86 137 229 Total Net Asset Value $4,575 $5,067 $6,098 $6,983 $8,080 Units Outstanding (8) 102.4 106.3 107.0 110.2 111.8 NAV Per Unit (9) $45 $48 $57 $63 $72
Appendix — EBITDA Reconciliation 36

EBITDA and Adjusted EBITDA Reconciliation 37 ($Millions) Twelve Months Ended March 31, 2010 2011 2012 2012 2013 2013 Attributable to Icahn Enterprises Net income 199$ 750$ 396$ 49$ 277$ 624$ Interest expense, net 338 377 456 103 119 472 Income tax expense (benefit) 11 27 (128) (36) 93 1 Depreciation, depletion and amortization 328 309 434 78 114 470 EBITDA attributable to Icahn Enterprises 876$ 1,463$ 1,158$ 194$ 603$ 1,567$ Impairment 8 58 106 2 - 104 Restructuring 12 9 25 6 6 25 Non-service cost of U.S. based pension 25 18 29 8 2 23 FIFO impact unfavorable - - 58 - (5) 53 OPEB curtailment gains (22) (1) (40) - - (40) Certain share-based compensation expense - - 30 - 7 37 Major scheduled turnaround expense - - 88 - - 88 Discontinued operations - - - - 36 36 Net (gain) on extinguishment of debt 40 - 7 1 (5) 1 Unrealized loss on certain derivatives - - 57 - (26) 31 Expenses related to certain acquisitions - - 4 - - 4 Other - - 20 2 3 21 Adjusted EBITDA attributable to Icahn Enterprises 939$ 1,547$ 1,542$ 213$ 621$ 1,950$ Year Ended December 31, Three Months Ended March 31,

EBITDA and Adjusted EBITDA Reconciliation by Segment – FYE 2012 38 ($Millions) Investment Automotive Energy Gaming Railcar Food Packaging Metals Real Estate Home Fashion Holding Company Total Attributable to Icahn Enterprises Net income (loss) 157$ (24)$ 263$ 21$ 29$ 4$ (58)$ 19$ (27)$ 12$ 396$ Interest expense, net 1 105 31 8 8 15 - 5 - 283 456 Income tax (benefit) expense - (22) 149 3 23 4 (1) - - (284) (128) Depreciation, depletion and amortization - 224 105 22 13 13 26 23 8 - 434 EBITDA attributable to Icahn Enterprises 158$ 283$ 548$ 54$ 73$ 36$ (33)$ 47$ (19)$ 11$ 1,158$ Impairment - 76 - 1 - - 18 - 11 - 106 Restructuring - 20 - - - 1 - - 4 - 25 Non-service cost of U.S. based pension - 27 - - - 2 - - - - 29 FIFO impact unfavorable - - 58 - - - - - - - 58 OPEB curtailment gains - (40) - - - - - - - - (40) Certain share-based compensation expense - - 27 - 3 - - - - - 30 Major scheduled turnaround expense - - 88 - - - - - - - 88 Net loss on extinguishment of debt - - 5 1 1 - - - - - 7 Unrealized loss on certain derivatives - - 57 - - - - - - - 57 Expenses related to certain acquisitions - - 4 - - - - - - - 4 Other - 20 - (2) - 2 (1) - 1 - 20 Adjusted EBITDA attributable to Icahn Enterprises 158$ 386$ 787$ 54$ 77$ 41$ (16)$ 47$ (3)$ 11$ 1,542$
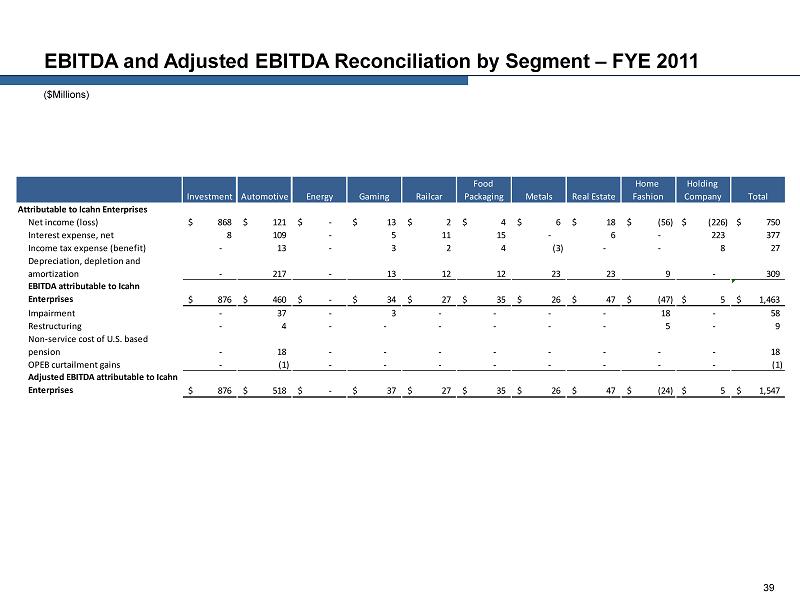
EBITDA and Adjusted EBITDA Reconciliation by Segment – FYE 2011 39 ($Millions) Investment Automotive Energy Gaming Railcar Food Packaging Metals Real Estate Home Fashion Holding Company Total Attributable to Icahn Enterprises Net income (loss) 868$ 121$ -$ 13$ 2$ 4$ 6$ 18$ (56)$ (226)$ 750$ Interest expense, net 8 109 - 5 11 15 - 6 - 223 377 Income tax expense (benefit) - 13 - 3 2 4 (3) - - 8 27 Depreciation, depletion and amortization - 217 - 13 12 12 23 23 9 - 309 EBITDA attributable to Icahn Enterprises 876$ 460$ -$ 34$ 27$ 35$ 26$ 47$ (47)$ 5$ 1,463$ Impairment - 37 - 3 - - - - 18 - 58 Restructuring - 4 - - - - - - 5 - 9 Non-service cost of U.S. based pension - 18 - - - - - - - - 18 OPEB curtailment gains - (1) - - - - - - - - (1) Adjusted EBITDA attributable to Icahn Enterprises 876$ 518$ -$ 37$ 27$ 35$ 26$ 47$ (24)$ 5$ 1,547$
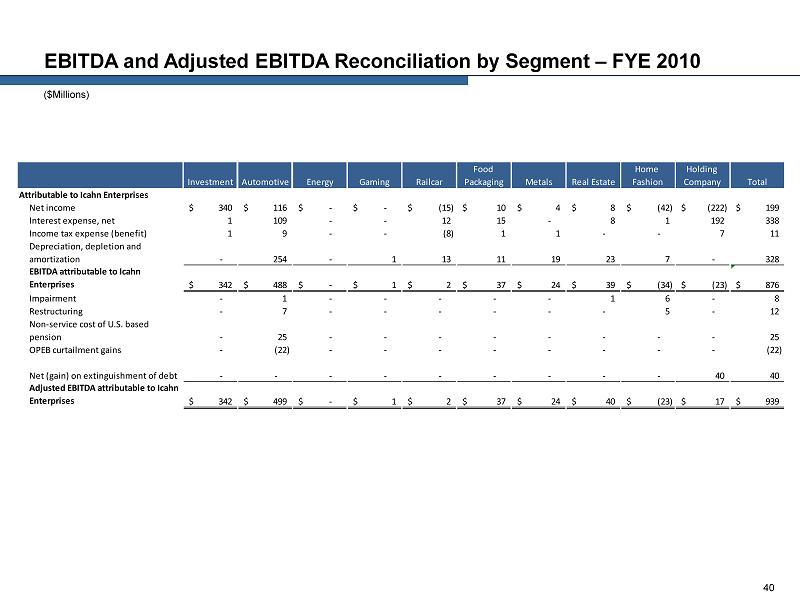
EBITDA and Adjusted EBITDA Reconciliation by Segment – FYE 2010 40 ($Millions) Investment Automotive Energy Gaming Railcar Food Packaging Metals Real Estate Home Fashion Holding Company Total Attributable to Icahn Enterprises Net income 340$ 116$ -$ -$ (15)$ 10$ 4$ 8$ (42)$ (222)$ 199$ Interest expense, net 1 109 - - 12 15 - 8 1 192 338 Income tax expense (benefit) 1 9 - - (8) 1 1 - - 7 11 Depreciation, depletion and amortization - 254 - 1 13 11 19 23 7 - 328 EBITDA attributable to Icahn Enterprises 342$ 488$ -$ 1$ 2$ 37$ 24$ 39$ (34)$ (23)$ 876$ Impairment - 1 - - - - - 1 6 - 8 Restructuring - 7 - - - - - - 5 - 12 Non-service cost of U.S. based pension - 25 - - - - - - - - 25 OPEB curtailment gains - (22) - - - - - - - - (22) Net (gain) on extinguishment of debt - - - - - - - - - 40 40 Adjusted EBITDA attributable to Icahn Enterprises 342$ 499$ -$ 1$ 2$ 37$ 24$ 40$ (23)$ 17$ 939$

EBITDA and Adjusted EBITDA Reconciliation by Segment – Q1 2013 41 ($Millions) Investment Automotive Energy Gaming Railcar Food Packaging Metals Real Estate Home Fashion Holding Company Total Attributable to Icahn Enterprises Net income (loss) 233$ (29)$ 151$ 3$ 1$ 2$ (6)$ 5$ (3)$ (80)$ 277$ Interest expense, net - 24 11 3 1 4 - 1 - 75 119 Income tax expense (benefit) - 9 82 1 7 1 (5) - - (2) 93 Depreciation, depletion and amortization - 55 32 5 4 4 6 6 2 - 114 EBITDA attributable to Icahn Enterprises 233$ 59$ 276$ 12$ 13$ 11$ (5)$ 12$ (1)$ (7)$ 603$ Restructuring - 6 - - - - - - - - 6 Non-service cost of U.S. based pension - 1 - - - 1 - - - - 2 FIFO impact unfavorable - - (5) - - - - - - - (5) Certain share-based compensation expense - - 4 - 3 - - - - - 7 Loss on discontinued operations - 36 - - - - - - - - 36 Net (gains) on extinguishment of debt - - (5) - - - - - - - (5) Unrealized (gain) on certain derivatives - - (26) - - - - - - - (26) Other - 5 - - (1) - - (1) - - 3 Adjusted EBITDA attributable to Icahn Enterprises 233$ 107$ 244$ 12$ 15$ 12$ (5)$ 11$ (1)$ (7)$ 621$

EBITDA and Adjusted EBITDA Reconciliation by Segment – Q1 2012 42 ($Millions) Investment Automotive Energy Gaming Railcar Food Packaging Metals Real Estate Home Fashion Holding Company Total Attributable to Icahn Enterprises Net income (loss) 31$ 23$ -$ 8$ 7$ 1$ (2)$ 5$ (9)$ (15)$ 49$ Interest expense, net 1 27 - 1 3 4 - 1 - 66 103 Income tax expense (benefit) - 8 - (1) 4 1 (4) - - (44) (36) Depreciation, depletion and amortization - 53 - 6 3 3 6 5 2 - 78 EBITDA attributable to Icahn Enterprises 32$ 111$ -$ 14$ 17$ 9$ -$ 11$ (7)$ 7$ 194$ Impairment - 1 - - - - - - 1 - 2 Restructuring - 5 - - - - - - 1 - 6 Non-service cost of U.S. based pension - 7 - - - 1 - - - - 8 Net (gains) on extinguishment of debt - - - 1 - - - - - - 1 Other - 2 - (1) 1 - - - - - 2 Adjusted EBITDA attributable to Icahn Enterprises 32$ 126$ -$ 14$ 18$ 10$ -$ 11$ (5)$ 7$ 213$

EBITDA and Adjusted EBITDA Reconciliation by Segment – LTM Q1 2013 43 ($Millions) Investment Automotive Energy Gaming Railcar Food Packaging Metals Real Estate Home Fashion Holding Company Total Attributable to Icahn Enterprises Net income (loss) 359$ (76)$ 414$ 16$ 23$ 5$ (62)$ 19$ (21)$ (53)$ 624$ Interest expense, net - 102 42 10 6 15 - 5 - 292 472 Income tax (benefit) expense - (21) 231 5 26 4 (2) - - (242) 1 Depreciation, depletion and amortization - 226 137 21 14 14 26 24 8 - 470 EBITDA attributable to Icahn Enterprises 359$ 231$ 824$ 52$ 69$ 38$ (38)$ 48$ (13)$ (3)$ 1,567$ Impairment - 75 - 1 - - 18 - 10 - 104 Restructuring - 21 - - - 1 - - 3 - 25 Non-service cost of U.S. based pension - 21 - - - 2 - - - - 23 FIFO impact unfavorable - - 53 - - - - - - - 53 OPEB curtailment gains - (40) - - - - - - - - (40) Certain share-based compensation expense - - 31 - 6 - - - - - 37 Major scheduled turnaround expense - - 88 - - - - - - - 88 Loss on discontinued operations - 36 - - - - - - - - 36 Net loss on extinguishment of debt - - - - 1 - - - - - 1 Unrealized loss on certain derivatives - - 31 - - - - - - - 31 Expenses related to certain acquisitions - - 4 - - - - - - - 4 Other - 23 - (1) (2) 2 (1) (1) 1 - 21 Adjusted EBITDA attributable to Icahn Enterprises 359$ 367$ 1,031$ 52$ 74$ 43$ (21)$ 47$ 1$ (3)$ 1,950$

Adjusted EBITDA Reconciliation – CVR Energy (CVI) 44 ($Millions) CVR Energy (CVI) Source: Q1 2013 CVI Investor Presentation 2011 2012 LTM Q1 2013 Net income (loss) attributable to CVR Energy stockholders 346$ 379$ 569$ Interest expense, net of interest income 55 75 71 Depreciation and amortization 90 130 132 Income tax expense (benefit) 210 226 329 FIFO impact (favorable) unfavorable (26) 58 71 Goodwill impairment - - - Unrealized (gain) loss on derivatives, net (85) 148 (13) Share-based compensation 27 39 41 Loss on disposal of fixed asset 3 - - Loss on extinguishment of debt 2 38 64 Major turnaround expense 66 129 108 Expenses associated with proxy matter - 44 29 Expenses associated with Gary-Williams acquisition 9 11 7 Adjusted EBITDA and EBITDA expenses related to non-controlling interest (8) (11) (25) Adjusted EBITDA 690$ 1,264$ 1,383$ Full Year

Adjusted EBITDA Reconciliation – American Railcar Industries (ARII) 45 ($Millions) American Railcar Industries (ARII) Source: Q1 2013 & Q4 2012 Investor Presentation FYE 2012 LTM Q1 2013 Net earnings 64$ 70$ Income tax expense 42 46 Interest expense 18 16 Loss on debt extinguishment 2 3 Interest income (3) (3) Depreciation 24 25 - - EBITDA 147 156 Other income related to short-term investments (2) (4) Expense related to stock appreciation rights compensation 5 10 - - Adjusted EBITDA 150$ 162$