Attached files
| file | filename |
|---|---|
| 8-K - OLD LINE BANCSHARES, INC. FORM 8-K - OLD LINE BANCSHARES INC | oldline8k.htm |
Exhibit 99.1

James W. Cornelsen
President & CEO
Mark A. Semanie
Executive Vice President, COO & CFO
NASDAQ: OLBK
2nd Annual DC Field Trip
Sponsored By Sandler O’Neill
June 11, 2013

OLBK - 6/2013
OLD LINE BANCSHARES, INC | 2
This presentation includes forward-looking statements, including statements about future
results. These statements are subject to uncertainties and risks, including but not limited to our
ability to integrate acquisitions; the strength of the U.S. economy and the local economies where
we conduct operations; harsh weather conditions; fluctuations in inflation, interest rates, or
monetary policies; changes in the stock market and other capital and real estate markets;
legislative or regulatory changes; customer acceptance of third-party products and services;
increased competition and its effect on pricing; technological changes; security breaches and
computer viruses that may affect our computer systems; changes in consumer spending and
savings habits; our growth and profitability; changes in accounting; and our ability to manage the
risks involved in the foregoing. These factors, as well as additional factors, can be found in our
Annual Report on Form 10-K for the fiscal year ended December 31, 2012 along with our other
filings with the SEC, which are available at the SEC’s internet site (http://www.sec.gov). Actual
results may differ materially from projections and could be affected by a variety of factors,
including factors beyond our control. Forward-looking statements in this presentation speak only
as of the date of these materials, and we assume no obligation to update forward-looking
statements or the reasons why actual results could differ. In addition, this presentation includes
certain non-GAAP financial measures.
Forward-Looking Statement

OLBK - 6/2013
OLD LINE BANCSHARES, INC | 3
OLBK Corporate Overview
§ 5th largest MD-headquartered independent banking company
traded on a major exchange with $1.2 billion total assets, $124.3M
market capitalization, 23 branch locations*
traded on a major exchange with $1.2 billion total assets, $124.3M
market capitalization, 23 branch locations*
§ Primary market area is suburban Maryland - (Washington, D.C.
suburbs and Southern Maryland). Also targets customers
throughout the greater Washington, D.C. metropolitan area
suburbs and Southern Maryland). Also targets customers
throughout the greater Washington, D.C. metropolitan area
§ We operate in the best strategic, natural submarkets within
footprint with population growth rates & per capita income above
national averages - bedroom communities for both Washington
and Baltimore
footprint with population growth rates & per capita income above
national averages - bedroom communities for both Washington
and Baltimore
§ We operate Loan Production Offices in seven locations
§ We have been an acquirer (2 completed) and will continue to seek
logical acquisitions
logical acquisitions
§ 29.84% Insider/Stakeholder and Board ownership; 18.33%
institutional & .82% mutual fund ownership*
institutional & .82% mutual fund ownership*
*Source: SNL Financial, Inc. as of 05/20/2013

OLBK - 6/2013
OLD LINE BANCSHARES, INC | 4
Vision
Grow Old Line Bancshares’ position
as the community bank of choice and
the employer of choice
across our Maryland-based footprint.
as the community bank of choice and
the employer of choice
across our Maryland-based footprint.

OLBK - 6/2013
OLD LINE BANCSHARES, INC | 5
Presentation Agenda
1. Market Analysis
2. Financial Performance Highlights
3. Key Strategic Goals
4. Compelling Investment Considerations

OLD LINE BANCSHARES, INC | 6
OLBK - 6/2013
95
70
PENNSYLVANIA
495
95
66
83
MD
2
495
695
Old Line Bank branch (23)
ANNE
ARUNDEL
PRINCE
GEORGE’S
ST.
MARY’S
CHARLES
Old Line Bank Branch Map

OLD LINE BANCSHARES, INC | 7
OLBK - 6/2013
|
|
As of March 31, 2013
|
|
||||
|
|
Old Line
|
WSB
|
Combined
|
|||
|
|
Deposits
|
Branches
|
Deposits
|
Branches
|
Deposits
|
Branches
|
|
County
|
($mm)
|
(#)
|
($mm)
|
(#)
|
($mm)
|
(#)
|
|
Prince George’s
|
346
|
7
|
79
|
1
|
425
|
8
|
|
Charles
|
226
|
4
|
69
|
1
|
295
|
5
|
|
Saint Mary’s
|
116
|
3
|
-
|
-
|
116
|
3
|
|
Anne Arundel
|
32
|
2
|
75
|
3
|
107
|
5
|
|
Calvert
|
28
|
2
|
-
|
-
|
28
|
2
|
|
Total
|
748
|
18
|
223
|
5
|
971
|
23
|
Logical In-Market Consolidation
95
70
PENNSYLVANIA
495
95
66
83
MD
2
495
695
Old Line Bank
Source: Internal Data

OLD LINE BANCSHARES, INC | 8
OLBK - 6/2013
Selected OLBK Market Highlights
§ Household income for entire franchise is $78,182 vs. $50,157 for the U.S.
§ Projected HH income growth rate (2012-2017) is 13.37% across franchise.
§ Projected 5-year population growth rate (2012-2017) in overall market = 3.86%.
§ OLBK deposit market rank/share by county (2012):
Maryland Rank Share # Branches
Prince George’s #6 5.43% 8
Charles #3 16.00% 5
Saint Mary’s #4 8.41% 3
Anne Arundel #13 1.15% 5
Calvert #8 2.69% 2
Source: SNL Financial, Inc.

OLD LINE BANCSHARES, INC | 9
OLBK - 6/2013
|
|
2008
|
2009
|
2010
|
2011
|
2012
|
|
Total Assets (000)
|
$317,731
|
$357,219
|
$401,910
|
$811,042
|
$861,856
|
|
Total Loans, net (000)
|
$231,054
|
$265,009
|
$299,606
|
$539,298
|
$595,145
|
|
Total Deposits (000)
|
$231,431
|
$286,348
|
$340,527
|
$690,768
|
$735,458
|
|
Return on Average Assets
|
0.64%
|
0.62%
|
0.36%
|
0.77%
|
0.90%
|
|
Return on Average Equity
|
5.03%
|
5.35%
|
3.87%
|
9.03%
|
10.52%
|
|
Total Equity/Total Assets
|
13.31%
|
10.25%
|
9.37%
|
8.45%
|
8.75%
|
|
Tangible Equity/Tangible Assets
|
13.31%
|
10.25%
|
9.37%
|
7.87%
|
8.29%
|
|
Total Risk-Based Capital Ratio
|
17.40%
|
13.70%
|
12.40%
|
11.26%
|
11.40%
|
|
Net Interest Margin
|
3.78%
|
3.75%
|
3.83%
|
4.59%
|
4.63%
|
|
Efficiency Ratio
|
69.87%
|
69.19%
|
71.72%
|
64.27%
|
60.51%
|
|
Nonperforming Assets/Assets(1)
|
.27%
|
.60%
|
1.12%
|
1.87%
|
1.26%
|
Old Line Bancshares, Inc.
(1)Nonperforming assets (NPAs) include non-accrual loans, 90 days past due and still accruing loans, accruing
troubled debt restructurings, and net other real estate and other assets owned.
troubled debt restructurings, and net other real estate and other assets owned.
Year-End Highlights
Source: SNL
Financial, Inc.
Financial, Inc.

OLD LINE BANCSHARES, INC | 10
OLBK - 6/2013
Loan Composition
Deposit Composition
Loans and Deposits
(As of 03/31/13)
Source: FFIEC Call Report

OLD LINE BANCSHARES, INC | 11
OLBK - 6/2013
Credit Composition & Quality
Loan Portfolio Composition (As of 03/31/13)
|
|
Balance
|
Percent
|
|
Residential Mortgages
|
|
|
|
Construction
|
13,154
|
2.14
|
|
Permanent
|
102,809
|
16.69
|
|
|
|
|
|
Total Mortgage Loans
|
115,963
|
18.83
|
|
|
|
|
|
Commercial Loans
|
|
|
|
Owner Occupied R/E
|
158,995
|
25.82
|
|
Non-Owner Occupied R/E
|
182,943
|
29.70
|
|
Farmland
|
1,380
|
0.22
|
|
Construction and Land Development
|
45,110
|
7.32
|
|
Business Loans and Lines
|
81,395
|
13.22
|
|
|
|
|
|
Total Commercial Loans
|
469,823
|
76.28
|
|
|
|
|
|
Consumer Loans
|
|
|
|
Home Equity Lines
|
19,232
|
3.12
|
|
Personal Lines
|
70
|
0.01
|
|
Installment
|
9,180
|
1.49
|
|
Credit Cards
|
1,635
|
0.27
|
|
|
|
|
|
Total Consumer Loans
|
30,117
|
4.89
|
|
|
|
|
|
Total Loans
|
615,903
|
100.00
|
Dollars in thousands. Source: FFIEC Call Report
OLD LINE BANCSHARES, INC | 12
OLBK - 6/2013
Credit Composition & Quality
Dollars in thousands. (1)Non-performing assets include loans 90+ days past due, non-accruals and OREO.
|
|
2Q2011
|
3Q2011
|
4Q2011
|
1Q2012
|
2Q2012
|
3Q2012
|
4Q2012
|
1Q2013
|
Percent of
Total NPAs |
|
Residential Mortgages
|
|
|
|
|
|
|
|
|
|
|
Construction
|
-
|
-
|
-
|
242
|
242
|
242
|
242
|
242
|
2.96
|
|
Permanent
|
2,814
|
4,072
|
1,945
|
1,298
|
1,499
|
2,838
|
3,261
|
3,214
|
39.30
|
|
Total Mortgage Loans
|
2,814
|
4,072
|
1,945
|
1,540
|
1,741
|
3,080
|
3,503
|
3,456
|
42.26
|
|
|
|
|
|
|
|
|
|
|
|
|
Commercial Loans
|
|
|
|
|
|
|
|
|
|
|
Owner Occupied R/E
|
225
|
225
|
1,091
|
2,267
|
2,262
|
2,257
|
771
|
341
|
4.17
|
|
Non-owner Occupied R/E
|
1,050
|
946
|
75
|
427
|
427
|
427
|
426
|
500
|
6.11
|
|
Construction and Land
Development |
1,840
|
1,490
|
2,628
|
2,151
|
2,883
|
1,394
|
300
|
300
|
3.67
|
|
Business Loans and
Lines
|
636
|
78
|
90
|
261
|
259
|
1,153
|
910
|
855
|
10.45
|
|
Total Commercial Loans
|
3,751
|
2,739
|
3,884
|
5,106
|
5,831
|
5,231
|
2,407
|
1,996
|
24.40
|
|
|
|
|
|
|
|
|
|
|
|
|
Consumer Loans
|
-
|
-
|
34
|
-
|
1
|
2
|
6
|
0
|
.00
|
|
|
|
|
|
|
|
|
|
|
|
|
Other Real Estate Owned
|
3,949
|
4,126
|
4,005
|
3,919
|
3,491
|
3,231
|
3,720
|
2,727
|
33.34
|
|
|
|
|
|
|
|
|
|
|
|
|
Total Nonperforming
Assets (1) |
10,514
|
10,937
|
9,868
|
10,565
|
11,064
|
11,544
|
9,636
|
8,179
|
100.00
|
|
|
|
|
|
|
|
|
|
|
|
|
NPAs/Total Assets (1)
|
1.38
|
1.39
|
1.22
|
1.32
|
1.31
|
1.35
|
1.13
|
1.03
|
|
Source: FFIEC Call Reports

OLD LINE BANCSHARES, INC | 13
OLBK - 6/2013
Historically, OLBK’s asset quality has been strong.
Credit Composition & Quality
|
|
2008
|
2009
|
2010
|
2011
|
2012
|
|
NPAs & 90+ days Past
Due/Assets
|
.27
|
.60
|
1.12
|
1.87
|
1.26
|
|
|
|
|
|
|
|
|
Nonperforming Loans/Loans
(1) |
.37
|
.80
|
1.11
|
2.06
|
1.19
|
|
|
|
|
|
|
|
|
Reserves/Gross Loans
|
.85
|
.93
|
.82
|
.69
|
.66
|
|
|
|
|
|
|
|
|
Reserves/Nonperforming
Loans |
233.14
|
116.20
|
73.56
|
33.51
|
55.82
|
|
|
|
|
|
|
|
|
Net Charge-offs/Average
Loans |
.01
|
.16
|
.38
|
.11
|
.23
|
Source: SNL Financial, Inc.
(1)Non-performing loans include loans 90+ days past due, non-accruals and accruing troubled debt restructurings.

OLD LINE BANCSHARES, INC | 14
OLBK - 6/2013
Dollars in thousands.
Quarterly Financial Trends
|
|
2Q11
|
3Q11
|
4Q11
|
1Q12
|
2Q12
|
3Q12
|
4Q12
|
1Q13 |
|
Net Interest Income
|
7,471
|
8,345
|
7,700
|
7,762
|
8,464
|
8,537
|
8,402
|
7,847
|
|
Provision for Credit Losses
|
50
|
800
|
800
|
375
|
375
|
375
|
400
|
200
|
|
Non-interest Income
|
747
|
676
|
657
|
667
|
710
|
633
|
642
|
717
|
|
Non-interest Income - Non-
Recurring |
-
|
222
|
-
|
-
|
-
|
-
|
7
|
(86)
|
|
Non-interest Expense
|
5,788
|
6,030
|
5,410
|
5,689
|
6,029
|
6,081
|
6,191
|
6,839
|
|
Non-interest Expense - Non-
Recurring |
377
|
78
|
29
|
29
|
29
|
49
|
1,064
|
240
|
|
Net Income (Loss) before Taxes
|
1,773
|
2,407
|
2,143
|
2,580
|
2,995
|
2,920
|
1,691
|
1,795
|
|
Applicable Income Taxes
|
656
|
737
|
198
|
844
|
983
|
912
|
(19)
|
522
|
|
Net Income (Loss)
|
1,117
|
1,670
|
1,945
|
1,736
|
2,012
|
2,008
|
1,709
|
1,273
|
|
Net Income (Loss) Available to
Common Stockholders |
1,183
|
1,707
|
1,967
|
1,756
|
2,029
|
2,028
|
1,717
|
1,286
|
|
EPS - Net Income (Loss)
Available to Common Stockholders |
.17
|
.25
|
.29
|
.26
|
.29
|
.29
|
.25
|
.19
|
|
Net Interest Margin
|
4.63
|
5.04
|
4.46
|
4.46
|
4.79
|
4.72
|
4.55
|
4.28
|
|
Efficiency Ratio (GAAP)
|
66.71
|
63.95
|
59.98
|
63.00
|
63.70
|
58.26
|
57.28
|
70.92
|
|
Non-interest Income/Operating
Revenue (GAAP) |
9.24
|
7.43
|
7.84
|
7.91
|
7.74
|
6.90
|
7.10
|
8.37
|
|
Return on Average Assets
|
.60
|
.87
|
.97
|
.86
|
.97
|
.93
|
.79
|
.59
|
|
Return on Average Equity
|
6.97
|
10.78
|
11.55
|
10.64
|
12.02
|
11.71
|
9.77
|
7.05
|
Source: SNL Financial, Inc.

OLD LINE BANCSHARES, INC | 15
OLBK - 6/2013
Financial Results & Trends
Average Balance Sheet Growth
Dollars in thousands.
Source: SNL Financial, Inc.
4Q12

OLD LINE BANCSHARES, INC | 16
OLBK - 6/2013
Revenue Composition
Revenue Breakdown
1Q13 Non-interest Income Detail (1)
Dollars in thousands. (1)Non-interest income y-t-d excludes investment securities gains
Source: SNL Financial, Inc.

OLD LINE BANCSHARES, INC | 17
OLBK - 6/2013
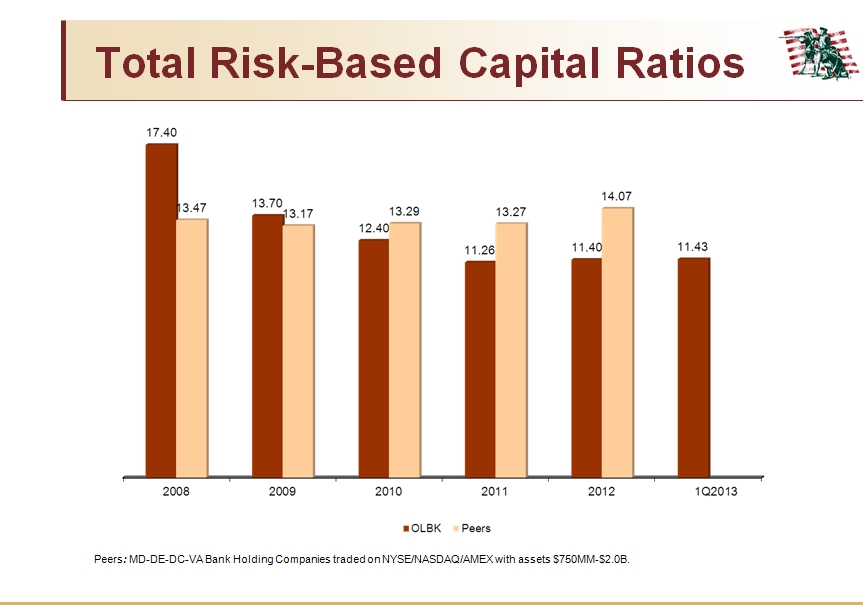
Capital Adequacy
Minimum total risk-based capital ratio to be well capitalized - 10%
Source: SNL Financial, Inc.

OLD LINE BANCSHARES, INC | 18
OLBK - 6/2013
Key Strategic Goals
Profitability
§ Target Net Interest Margin - NIM > 4.25%
§ Maintain bank efficiency ratios <60%
§ Reduce Non-Performing Assets - NPAs <1%
§ DDA balances to exceed 25% of Total Deposits
§ Grow loan portfolio in excess of 15% annually

OLD LINE BANCSHARES, INC | 19
OLBK - 6/2013
Key Strategic Goals
§ Commitment to invest in infrastructure to maintain state-
of-the art status of existing systems; add quality talent to
support growth
of-the art status of existing systems; add quality talent to
support growth
§ Dominate all sub-markets within our footprint
§ Acquire smaller community banks in-market
§ Expand reach into new contiguous natural markets
§ Grow sources of non-interest income
Growth

OLD LINE BANCSHARES, INC | 20
OLBK - 6/2013
95
70
PENNSYLVANIA
495
95
66
83
MD
2
495
695
Old Line Bank branch (23)
ANNE
ARUNDEL
PRINCE
GEORGE’S
ST.
MARY’S
CHARLES
Old Line Bank Branch Map

OLD LINE BANCSHARES, INC | 21
OLBK - 6/2013
§ Track record of consistent financial performance
§ Depth of senior management talent and across entire employee base
§ Strong underlying capital position with good access to capital markets
§ Strong track record of consistent asset quality
§ Solid net interest margin compares favorably to peers
§ Skilled bank acquirers
§ Dominant independent and locally headquartered
financial services company within our footprint
financial services company within our footprint
§ Acquirer and employer of choice within footprint; Now
moving towards dominant suburban MD position
surrounding D.C.
moving towards dominant suburban MD position
surrounding D.C.
What Makes OLBK Unique?

OLBK - 6/2013
OLD LINE BANCSHARES, INC | 22
WSB Merger - Strategic Rationale
§ In-market acquisition consistent with Old Line’s long-term growth strategy:
§ Significant operating synergies
§ Built on successful acquisition of Maryland Bankcorp in 2011
§ Expands product line by adding a successful mortgage origination and sale unit
§ Created a $1.2 billion Maryland-based bank with a continuing focus on the greater
Washington, D.C. metropolitan area, Anne Arundel County and southern Maryland:
§ Old Line expanded to 23 branches and deposits of over $970 million
§ Of banks based in Maryland, Old Line is the 5th largest in assets and 3rd largest
in full service branches
§ Old Line has the highest board/insider ownership (29.84%) of any publicly-
traded Maryland bank with assets over $1.2 billion

OLBK - 6/2013
OLD LINE BANCSHARES, INC | 23
WSB Merger - Financial Rationale
§ 7% EPS accretion in Year 1 excluding merger related costs, with
higher levels in later years.
§ Restructured WSB FHLB borrowings of $26 million at 4.40%;
and another $42 million at 1.84%
§ Opportunity to reduce WSB legacy deposit costs
§ Significant in-market cost savings
§ Return to pre-closing tangible book within one year
§ Payback on tangible book dilution from transaction in ~3.5 years
§ Pricing compares favorably to recent local and regional transactions

OLD LINE BANCSHARES, INC | 24
OLBK - 6/2013
Compelling Investment Considerations
§ We deliver a proven track record of results
§ Our deep management talent could lead a much larger company
§ We are the emerging leader in in-market consolidations
§ We are focused on creating sustainable competitive
advantages
advantages
§ Our current valuation is attractive considering our rapid
ramp-up of EPS over a short timeframe
ramp-up of EPS over a short timeframe
§ Our customer base is stable with good population growth
trends and above average demographics in the affluent retail
and small middle-market segments
trends and above average demographics in the affluent retail
and small middle-market segments
§ Our demand deposit growth focus is outperforming our peer
group
group

OLD LINE BANCSHARES, INC | 25
OLBK - 6/2013
ADDENDUM

OLD LINE BANCSHARES, INC | 26
OLBK - 6/2013
Significant WSB Merger Assumptions
§ Gross credit and OREO mark-down of $18 million
§ Real estate mark-up of $7.7 million
§ Mark on FHLB borrowings ($26 million at 4.40% and $42 million at 1.84%) of
$4.6 million
§ CDI of 1.96% on non-CD accounts amortized over 8 years (SL)
§ Combined Old Line and WSB merger related expenses of $3.2 million after
tax
§ Cost savings of 35% of WSB’s annualized non-interest expense (projections
assume 20% of cost savings not realized in year one)
* Information is based upon original due diligence. Valuation of acquired
balance sheet is in process.

OLD LINE BANCSHARES, INC | 27
OLBK - 6/2013
Publicly traded Bank
Holding Companies in MD,
DC, VA, DE
with total
Holding Companies in MD,
DC, VA, DE
with total
assets between $750MM-$2.0B
Peer Group Definition

OLD LINE BANCSHARES, INC | 28
OLBK - 6/2013
Peers: MD-DE-DC-VA Bank Holding Companies traded on NYSE/NASDAQ/AMEX with assets $750MM-$2.0B. Data as of 12/31/2012
Source: SNL Financial, Inc.
OLBK Peer Group

OLD LINE BANCSHARES, INC | 29
OLBK - 6/2013
Talent, depth, unique skills…
James W. Cornelsen, 58, is the President and Chief Executive Officer of Old Line Bancshares, Inc. and Old Line Bank. He joined Old Line
Bank and its Board of Directors in 1994 and has been a member of the Board of Directors of Old Line Bancshares, Inc. since its incorporation
in April 2003. He has over 30 years of commercial banking experience. Prior to joining OLBK, Mr. Cornelsen was a Senior Vice President at
Sequoia National Bank and Vice President of Commercial Lending at Citizens Bank of Maryland.
Mark A. Semanie, 50, joined Old Line Bank in January 2013. He is an Executive Vice President and Chief Operating Officer and Acting Chief
Financial Officer and assists in the planning and strategic growth of Old Line Bank. Mr. Semanie is a CPA and prior to joining Old Line Bank
he was the Senior Vice President and Chief Financial Officer of Carrollton Bancorp and prior to that tenure he served as Executive Vice
President and Chief Financial Officer at Bay National Bank. He has over 25 years of accounting and financial services experience.
Joseph E. Burnett, 67, joined Old Line Bank as a Senior Vice President and Chief Lending Officer in August 2001 and was promoted to
Executive Vice President in May 2006. He is also an Executive Vice President of Old Line Bancshares, Inc. He has over 45 years of banking
experience in the Washington, D.C. metropolitan area specializing in commercial transactions. Prior to joining Old Line Bank, Mr. Burnett was
a Senior Vice President in Commercial Lending at Farmers Bank for two years (1999-2001) and at Suburban Bank for twelve years (1987-
1999).
Sandi F. Burnett, 55, Executive Vice President and Chief Credit Officer of Old Line Bank, joined Old Line Bank in 2005 as Senior Vice
President and the team leader for the College Park, MD loan production office. Prior to joining Old Line Bank, she was employed by BB&T, a
major southeastern regional bank, most recently as a City Executive, Senior Vice President. In this capacity, she was responsible for
supervising the overall team management, portfolio quality and growth within suburban Maryland, principally Prince George’s County. Prior to
this position, she was employed by Commerce Bank, a local bank that merged into BB&T in 1999. She started with Commerce Bank in
1994. Ms. Burnett is a career banker with over 30 years of commercial banking experience.
Kevin P. Huffman, 52, joined Old Line Bank in May 2013 as Executive Vice President. Prior to joining Old Line Bank, Mr. Huffman served as
President and Director of The Washington Savings Bank from January 2004 until merger with Old Line Bank. He also served as Chief
Operating Officer of The Washington Savings Bank since May 2003 and Director of WSB since its formation in January 2008. He joined The
Washington Savings Bank in November 2001; prior to which he served in multiple capacities for Pen Mar Bancshares, Patapsco Valley
Bancshares, Inc. and Commercial and Farmers Bank.
OLBK Senior Management Team

OLD LINE BANCSHARES, INC | 30
OLBK - 6/2013
Selected Financial Data
|
|
2008
|
2009
|
2010
|
2011
|
2012
|
1Q2013
|
|
Performance Ratios:
|
|
|
|
|
|
|
|
Return on average assets
|
.64
|
.62
|
.36
|
.77
|
.90
|
.59
|
|
Return on average common equity
|
5.03
|
4.36
|
4.14
|
9.37
|
10.52
|
7.05
|
|
Yield on average interest-earning
assets |
6.10
|
5.54
|
5.22
|
5.46
|
5.12
|
4.78
|
|
Rate on average interest-bearing
liabilities |
2.95
|
2.15
|
1.64
|
1.08
|
.89
|
.66
|
|
Net interest spread
|
3.15
|
3.39
|
3.58
|
4.38
|
4.23
|
4.12
|
|
Net interest margin
|
3.78
|
3.75
|
3.83
|
4.59
|
4.63
|
4.28
|
|
Efficiency ratio-GAAP
|
69.87
|
69.19
|
71.72
|
64.27
|
60.51
|
70.92
|
|
|
|
|
|
|
|
|
|
Capital Ratios:
|
|
|
|
|
|
|
|
Tier 1 leverage
|
14.00
|
10.00
|
9.20
|
7.78
|
7.94
|
8.14
|
|
Total risk-based capital
|
17.40
|
13.70
|
12.40
|
11.26
|
11.40
|
11.43
|
|
Tier 1 risk-based capital
|
16.60
|
12.80
|
11.60
|
10.61
|
10.77
|
10.79
|
|
Total equity to total assets
|
13.31
|
10.25
|
9.37
|
8.45
|
8.75
|
8.66
|
|
|
|
|
|
|
|
|
|
Credit Quality Ratios:
|
|
|
|
|
|
|
|
Allowance for loan losses to loans
|
.85
|
.93
|
.82
|
.69
|
.66
|
.66
|
|
Nonperforming loans to total loans
(1) |
.37
|
.80
|
1.11
|
2.06
|
1.19
|
1.08
|
|
Nonperforming assets to total assets
|
.27
|
.60
|
1.12
|
1.87
|
1.26
|
1.03
|
|
Net charge-offs to average loans
|
.01
|
.16
|
.38
|
.11
|
.23
|
.07
|
Source: SNL Financial, Inc.
(1)Non-performing loans include loans 90+ days past due, non-accruals and accruing troubled debt restructurings.

OLD LINE BANCSHARES, INC | 31
OLBK - 6/2013
ROAA/ROAE
ROAA
ROAE
|
Peers: MD-DE-DC-VA Bank Holding Companies traded on NYSE/NASDAQ/AMEX with assets $750MM-/$2B.
|
2008 2009 2010 2011 2012 1Q2013
2008 2009 2010 2011 2012 1Q2013
Source: SNL Financial, Inc.

OLD LINE BANCSHARES, INC | 32
OLBK - 6/2013
Source: SNL Financial, Inc.
OLD LINE BANCSHARES, INC | 33
OLBK - 6/2013
Peers: MD-DE-DC-VA Bank Holding Companies traded on NYSE/NASDAQ/AMEX with assets $750MM-$2.0B.
Source: SNL Financial, Inc.

OLD LINE BANCSHARES, INC | 34
OLBK - 6/2013
Net Interest Margin
|
Peers: MD-DE-DC-VA Bank Holding Companies traded on NYSE/NASDAQ/AMEX with assets $750MM-$2.0B.
|
Source: SNL Financial, Inc.

OLD LINE BANCSHARES, INC | 35
OLBK - 6/2013
Efficiency Ratio
(GAAP)
Peers: MD-DE-DC-VA Bank Holding Companies traded on NYSE/NASDAQ/AMEX with assets $750MM-$2.0B.
Note: Presented on a GAAP basis
Source: SNL Financial, Inc.

OLD LINE BANCSHARES, INC | 36
OLBK - 6/2013
Peers: MD-DE-DC-VA Bank Holding Companies traded on NYSE/NASDAQ/AMEX with assets $750MM - $2.0B.
Source: SNL Financial, Inc.