Attached files
| file | filename |
|---|---|
| 8-K - FORM 8-K - Capital Bank Financial Corp. | d551215d8k.htm |
 Transforming the Franchise
June 2013
Exhibit 99.1 |
 Safe Harbor Statement
2
Forward-Looking Statements
Information in this presentation contains forward-looking statements. Any
statements about our expectations, beliefs, plans, predictions,
forecasts,
objectives,
assumptions
or
future
events
or
performance
are
not
historical
facts
and
may
be
forward-looking.
These statements are often, but not always, made through the use
of words or phrases such as “anticipate,”
“believes,”
“can,”
“could,”
“may,”
“predicts,”
“potential,”
“should,”
“will,”
“estimate,”
“plans,”
“projects,”
“continuing,”
“ongoing,”
“expects,”
“intends”
and
similar
words
or
phrases.
Accordingly,
these
statements
are
only
predictions
and
involve
estimates,
known
and
unknown
risks,
assumptions
and
uncertainties
that
could
cause
actual
results
to
differ
materially
from
those
expressed
in
them.
Our
actual
results
could differ materially from those anticipated in such forward-looking
statements as a result of several factors more fully described under the
caption “Risk Factors” in the annual report on Form 10-K and
other periodic reports filed by us with the Securities and Exchange
Commission. Any or all of our forward-looking statements in this presentation may turn out to be inaccurate. The
inclusion of this forward-looking information should not be regarded as a
representation by us or any other person that the future plans, estimates or
expectations contemplated by us will be achieved. We have based these forward-looking statements largely on
our
current
expectations
and
projections
about
future
events
and
financial
trends
that
we
believe
may
affect
our
financial
condition,
results of operations, business strategy and financial needs. There are important
factors that could cause our actual results, level of activity, performance
or achievements to differ materially from the results, level of activity, performance or achievements expressed
or implied by the forward looking statements including, but not limited to: (1)
changes in general economic and financial market conditions;
(2)
changes
in
the
regulatory
environment;
(3)
economic
conditions
generally
and
in
the
financial
services
industry;
(4)
changes in the economy affecting real estate values; (5) our ability to achieve
loan and deposit growth; (6) the completion of future acquisitions or
business combinations and our ability to integrate the acquired business into our business model; (7) projected
population and income growth in our targeted market areas; and (8) volatility and
direction of market interest rates and a weakening of the economy which
could materially impact credit quality trends and the ability to generate loans. All forward-looking statements
are necessarily only estimates of future results and actual results may differ
materially from expectations. You are, therefore, cautioned not to place
undue reliance on such statements which should be read in conjunction with the other cautionary statements
that are included elsewhere in this presentation. Further, any forward-looking
statement speaks only as of the date on which it is made and we undertake no
obligation to update or revise any forward-looking statement to reflect events or circumstances after the
date
on
which
the
statement
is
made
or
to
reflect
the
occurrence
of
unanticipated
events. |
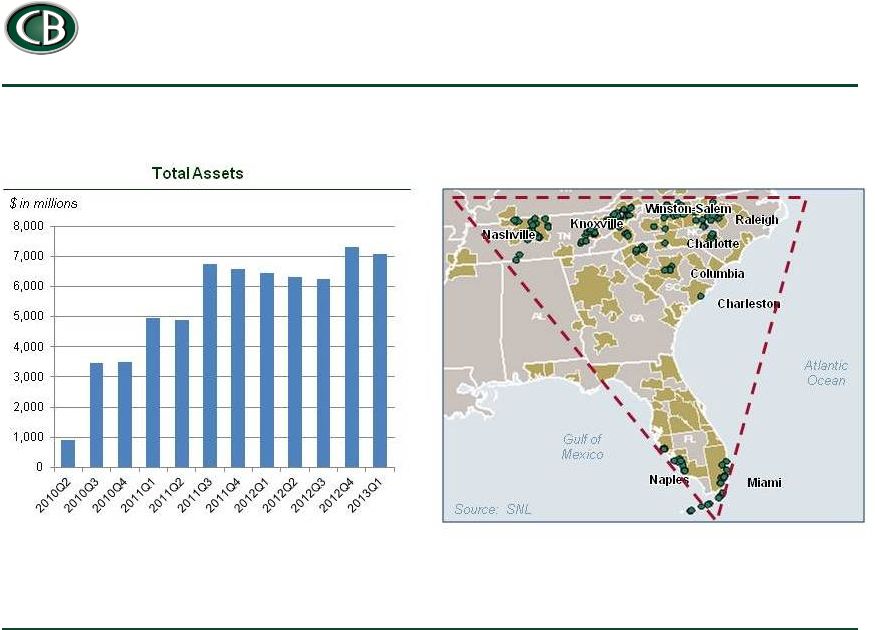 The
Capital Bank Story 3
From ‘blind pool’
to $7.1 billion bank in less than three years |
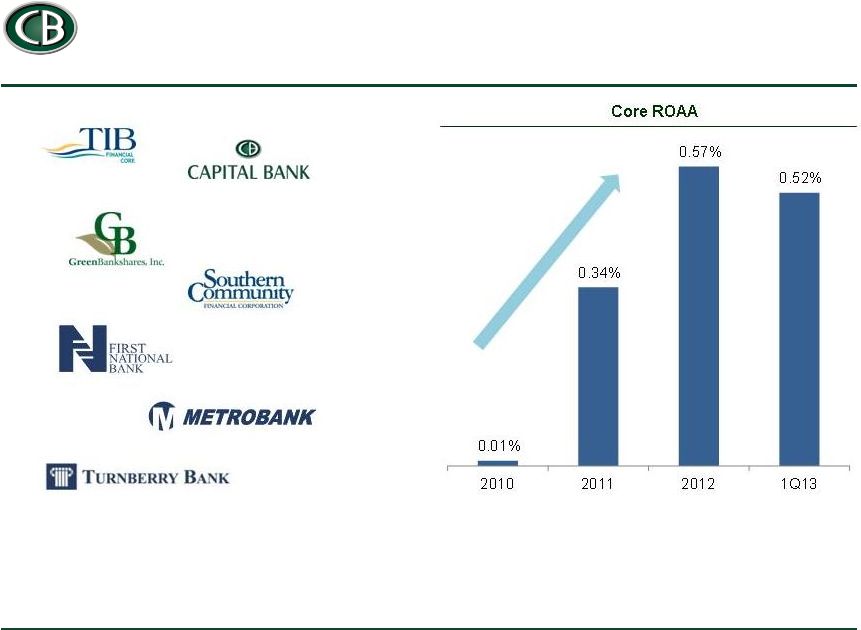 4
Significant Improvement in Returns
See reconciliation of non-GAAP measures in appendix.
|
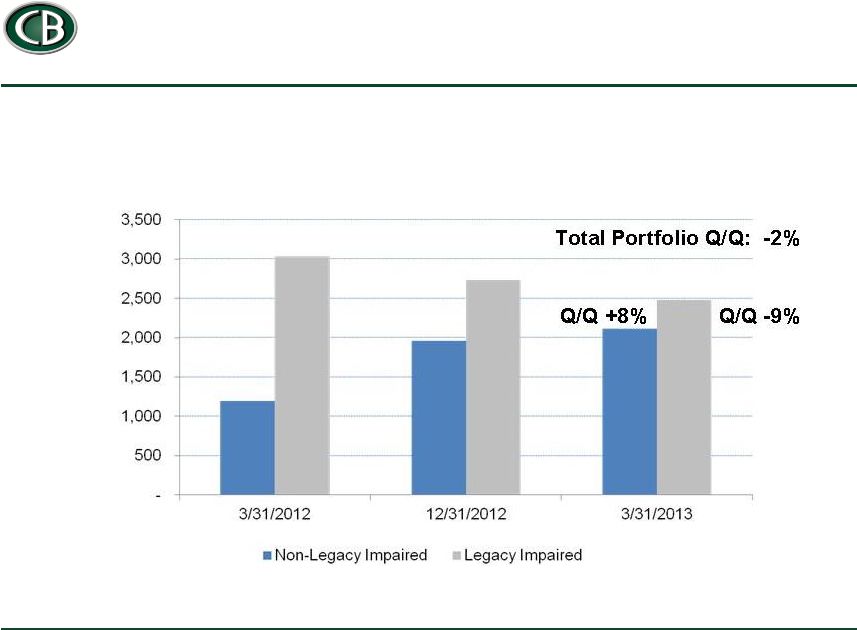 Transforming the Loan Portfolio
5
$ in millions
Legacy Impaired = accounted for as Purchase Credit Impaired
|
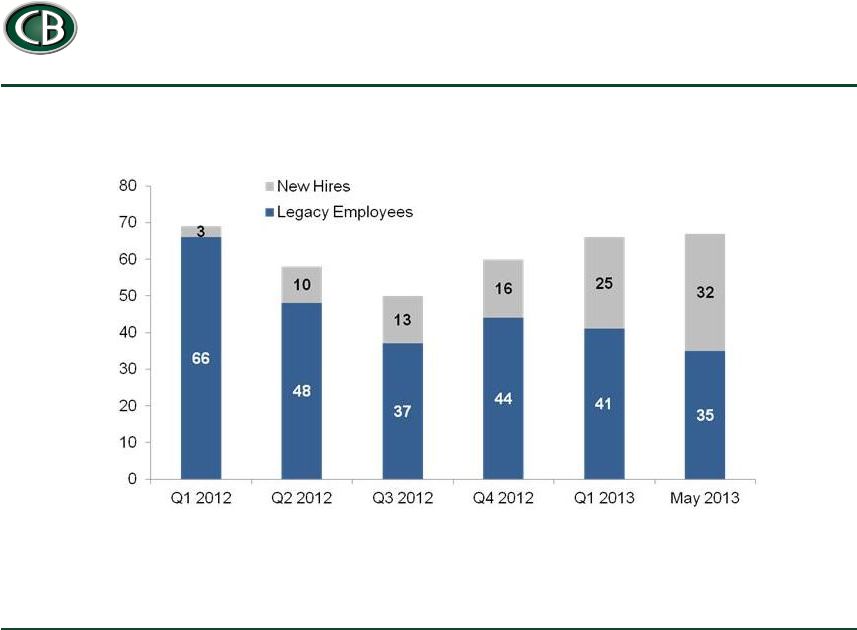 Topgrading the Commercial Salesforce
6
Number of salespersons |
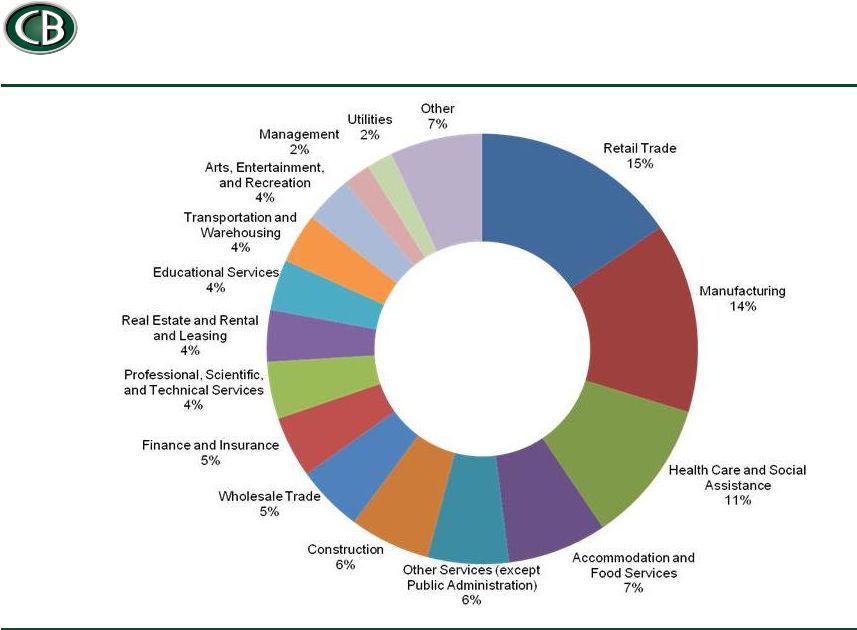 Commercial Book Starts with Customer Selection
7
Originated commercial
loan portfolio as of
3/31/2013, by borrower
industry
Excludes all acquired loans. |
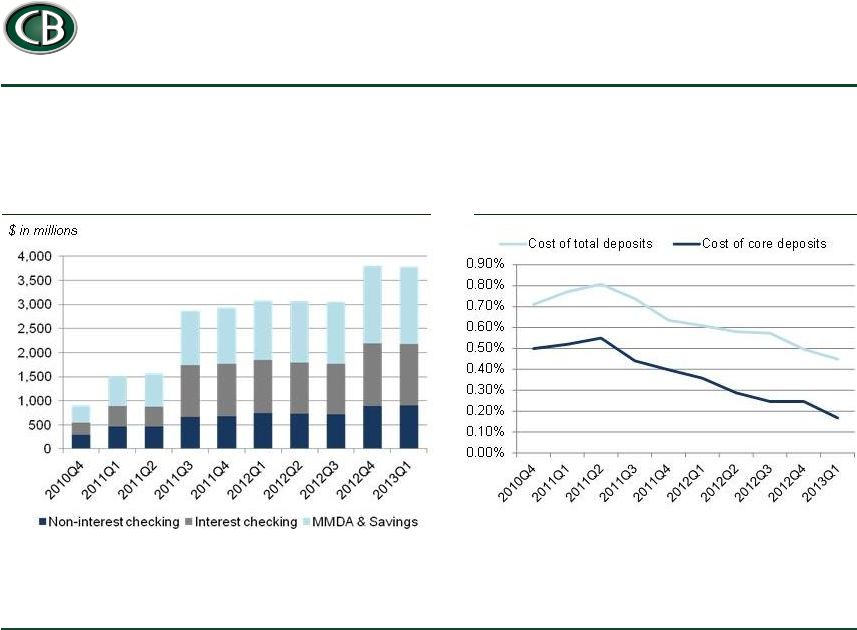 Transforming the Deposit Franchise
8
Growing Core Deposits
And Lowering Deposit Costs |
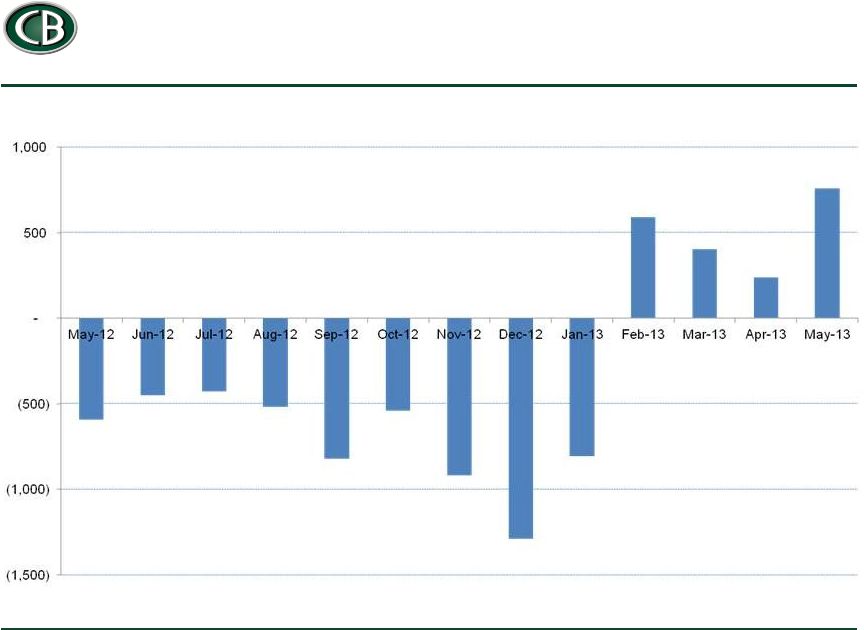 Checking Accounts Now Growing after Integrations
9
Sequential change in total checking accounts
Excludes addition of checking accounts from Southern Community in October
2012 |
 Transforming the Team with Promotions/New Hires
10
General Counsel
BSA/AML Executive
Enterprise Risk Executive
Head of Loan Operations
Head of Small Business Lending
Wealth Management Executive |
 First Quarter Highlights
11
See reconciliation of non-GAAP measures in appendix.
Reported GAAP net income of $5.6 million, or $0.10 per diluted share
Reported core net income of $9.4 million, or $0.17 per diluted share
TBV per share of $17.89
Originations steady at $251 million
Deposit costs down 3 bps on core deposit repricing
Legacy credit costs improved from $12 mm to $8 mm
Strongly capitalized with 13.5% tier 1 leverage
Loan portfolio shrank 2% on Special Assets resolution activity
|
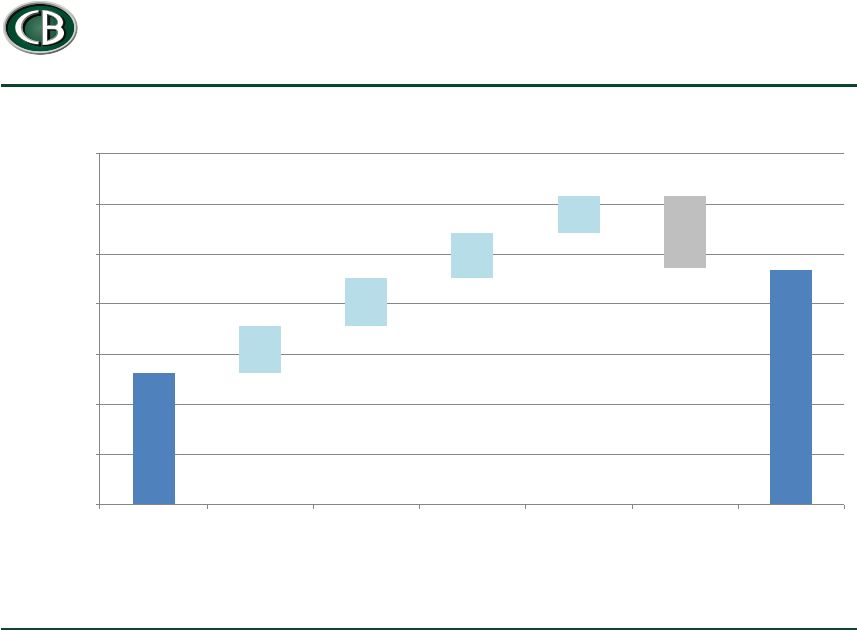 Illustrative Path to Target Returns
12
Core ROAA
0.19%
0.19%
0.18%
0.15%
0.29%
0.0%
0.2%
0.4%
0.6%
0.8%
1.0%
1.2%
1.4%
1Q13
Loan growth,
net
Legacy credit
expense
normalization
Fee income
initiatives, net
Other initiatives
Normalization
of NIM
Target
ROAA = Return on average assets.
See reconciliation of non-GAAP measures in appendix.
|
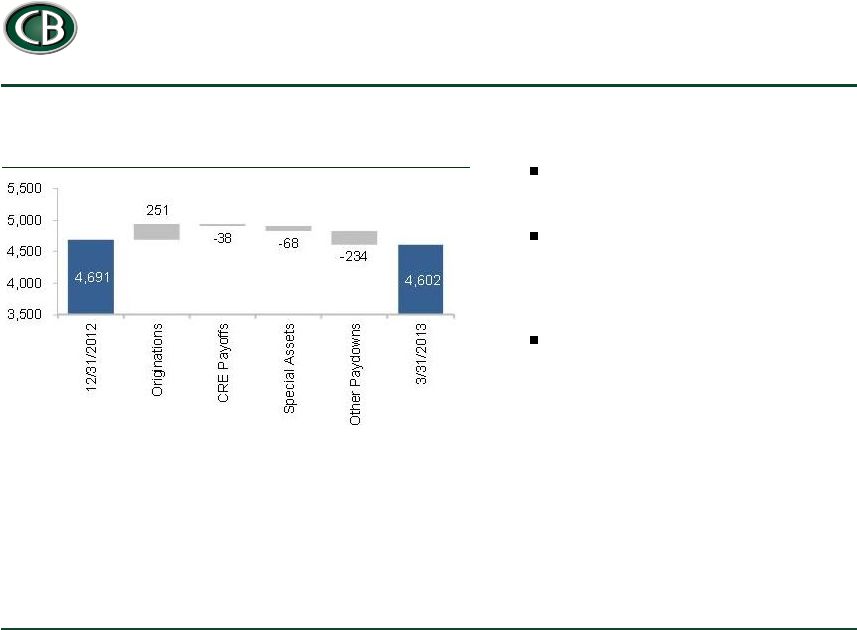 1Q13 Portfolio Growth Impacted by Resolutions
13
Loan Portfolio
Loan portfolio growth was -2% in 1Q13,
an improvement from -3% in 4Q
As expected, paydowns of commercial
real estate slowed significantly from $138
mm in 4Q to $38 mm in 1Q as we have
significantly reduced CRE concentrations
Resolution activity picked up from $43
mm in 4Q to $68 mm in 1Q, reflecting
progress in resolving criticized / classified
loans |
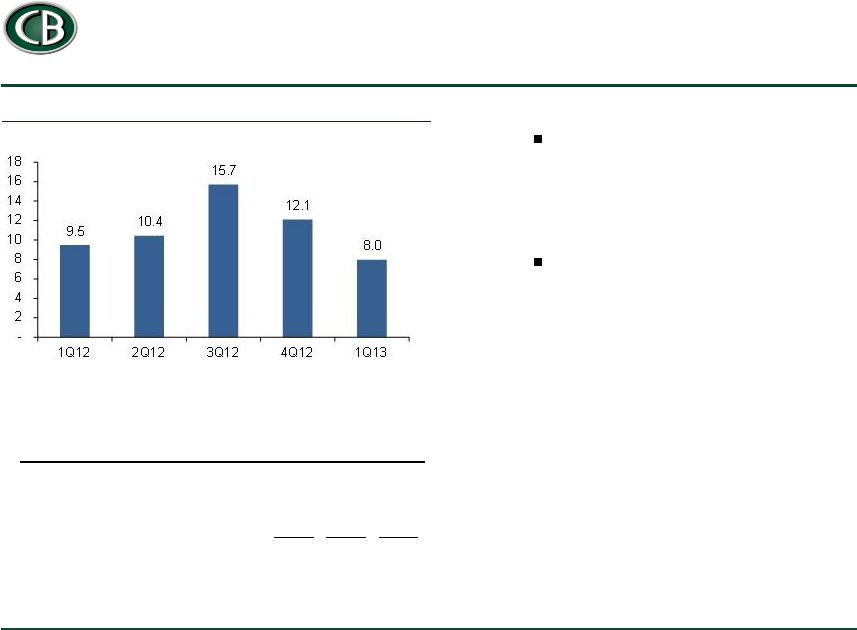 Legacy Credit Expenses Improved in 1Q13
14
Favorable performance on legacy
covered loans in Florida and South
Carolina drove the negative provision
and the corresponding writedown on the
FDIC asset
REO write-downs improved slightly from
4Q and remain largely concentrated in
non-urban land & lots
Legacy Credit Expense
$ in millions
1Q12
4Q12
1Q13
Provision on legacy loans
4.0
1.4
(3.1)
FDIC indemnification asset income
(0.3)
(0.3)
2.2
Foreclosed asset related expenses
4.2
9.2
6.8
Loan workout expense
1.6
1.8
2.1
Total legacy credit expense
9.5
12.1
8.0
|
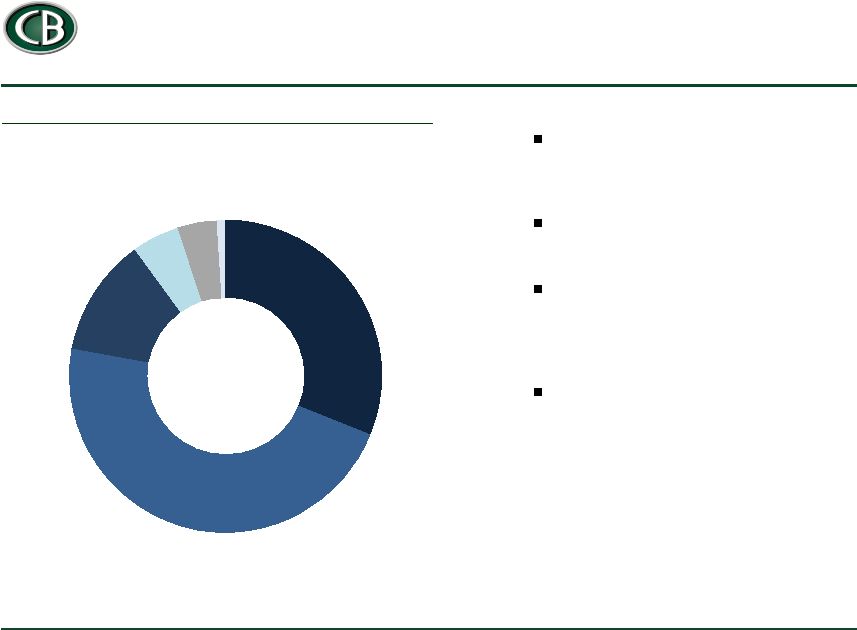 Liquidity and Capital Ratios Remain Strong
15
We continue to run a conservative
liquidity strategy as part of our asset
sensitive position
Effective duration of investments was 3.1
years at March 31, 2013
Our capital ratios remain strong with tier
1 leverage of 12.2% at the bank and
13.5% on a consolidated basis at
3/31/2013
We have substantially completed the $50
million stock repurchase authorized in
February 2013
Liquidity
$ in millions, at 3/31/2013
Cash /
Equivalents,
$510 , 31%
Agency MBS,
$768 , 47%
Agency
CMO, $200 ,
12%
ABS / Other,
$82 , 5%
CMBS, $66 ,
4%
Muni, $16 ,
1% |
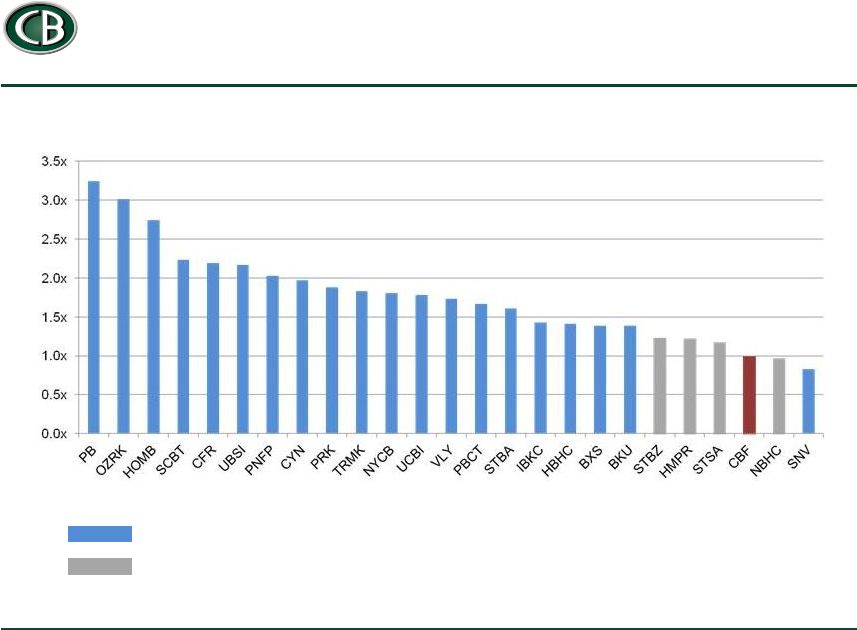
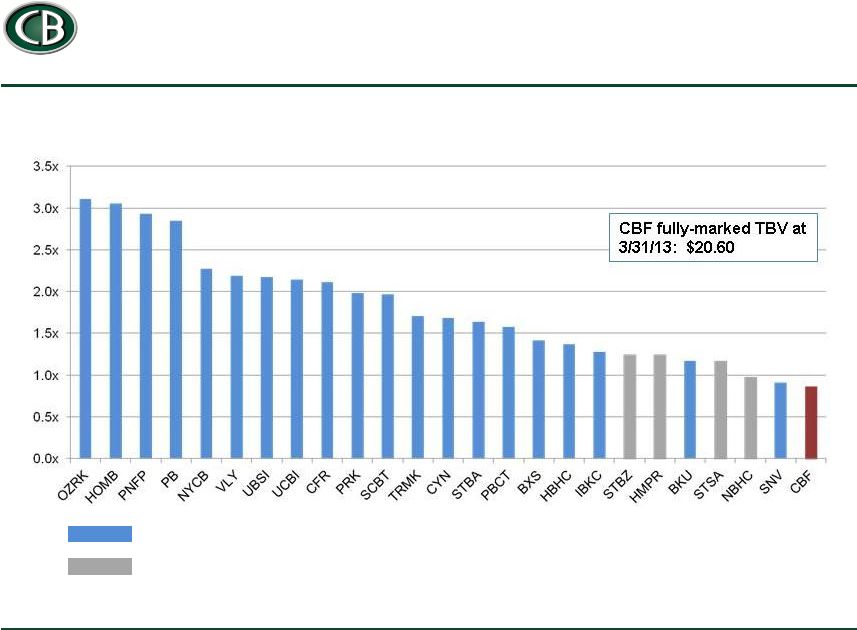 CBF and Peers: Price to Fully-marked TBV
16
Note: Fully Marked TBV as of 3/31/2013, stock prices as of 6/3/2013.
Fully-marked TBV equals net assets, adjusted for fair value of financial instruments, less
goodwill and intangibles net of tax effect. See appendix for additional
discussion of estimated fair value adjustments. Source: Company
filings, SNL Financial Peer
Blind Pools / Recap |
 Capital Bank: Transforming the Franchise
17
Building high-quality loan portfolio
Building low-cost deposit franchise
Consistent progress in resolving legacy assets
Deploying capital to drive investor returns
Positioned in attractive growth markets
Committed to organic growth and higher returns |
 Appendix
18 |
 CBF and Peers: Price to Tangible Book Value
19
Note: TBV as of most recent quarter available, stock prices as of
6/3/2013. Peer
Blind Pools / Recap |
 Tangible and Fully-marked Tangible Book Value
20
Fair Value = Carrying Value adjusted for the fair value of financial
instruments. See explanatory note on following page. $ in millions
December 31, 2012
March 31, 2013
Total common shareholders' equity
$1,156
$1,161
Intangibles, net of taxes
(165)
(165)
Tangible book
value $991
$997
Common shares outstanding
55.8
55.7
Tangible
book value per share $17.74
$17.89
$ in millions
Fair Value
Carrying
Value
Difference
Fair Value
Carrying
Value
Difference
Assets
6,758
6,475
283
6,533
6,276
257
Liabilities
6,105
6,097
8
5,887
5,877
10
Net assets
653
378
275
646
399
247
Net assets, net of tax effect
168
151
Plus tangible book value
991
997
Fully-marked tangible book value
1,159
1,147
Shares outstanding
55.8
55.7
Fully marked TBV / share
$20.75
$20.60
December 31, 2012
March 31, 2013 |
 Tangible and Fully-marked Tangible Book Value
21
The methods and assumptions used to estimate fair value of financial instruments
are described as follows: Carrying amount is the estimated fair value for
cash and cash equivalents, receivable from FDIC, derivatives, noncontractual demand deposits and certain
short-term borrowings. As it is not practicable to determine the fair value of
Federal Reserve, Federal Home Loan Bank stock, indemnification asset and other
bankers’
bank stock due to restrictions placed on transferability, the estimated fair value
is equal to their carrying amount. Security fair values are based on market
prices or dealer quotes, and if no such information is available, on the rate and term of the security and information about the issuer including
estimates of discounted cash flows when necessary. For fixed rate loans or
contractual deposits and for variable rate loans or deposits with infrequent
repricing or repricing limits, fair value is based on discounted
cash flows using current market rates applied to the estimated life, adjusted for
expected credit risk. Fair values for impaired loans are estimated using
discounted cash flow analysis or underlying collateral values. Fair value of long-term debt is based on
current rates for similar financing.
The fair value of off-balance sheet items that includes commitments to extend
credit to fund commercial, consumer, real estate construction and real estate-
mortgage loans and to fund standby letters of credit is considered nominal.
The most significant difference between carrying value and estimated fair value of
financial instruments is the differential between the carrying value and
estimated fair value of our loan portfolio. As described in Note
14 to the Company’s Consolidated Financial Statements, the estimated fair
value of loans
exceeded their carrying value by approximately $256.8 million. This difference
arises as acquired loans were initially recorded at acquisition date fair values
which incorporated management’s expectation of lifetime credit losses. As our
loan cash flow expectations and experience has generally improved from our
original expectations and the market interest rates for similar instruments have
generally declined, our estimates of fair value have increased. These
estimates utilize discounted cash flows as a primary valuation approach
incorporating collateral value, prepayment and credit risk (including consumer credit
scores where applicable) along with the LIBOR/Swap curve for market interest rates.
For loans with higher credit risk ratings, incremental spreads were added
for credit and liquidity factors. Estimated fair values for commercial loans were determined using syndicated loan prices and spreads, survey data from
the Federal Reserve e2 release, and rated corporate bonds. The Company’s
internal risk ratings were mapped to the Federal Reserve e2 and Moody’s rating
categories. Estimated fair values for commercial real estate loans also
incorporated commercial mortgage backed security securitization prices and spreads.
Estimated fair values for consumer loans were determined using product-specific
survey rate data from a leading provider of financial information. Estimated
fair values for residential mortgage loans were determined using
mortgage backed security option-adjusted spreads, with incremental spreads
added credit and liquidity. Credit spreads were sourced from third party
survey data of mortgage banking activities from a leading provider of financial information. |
 First Quarter Core Earnings Summary
22
($ millions except per share data)
1Q13
4Q12
1Q12
Q/Q
Y/Y
Net interest income
67.8
66.0
63.9
3%
6%
Provision
6.9
4.4
5.4
-57%
-28%
Core non-interest income
10.9
15.4
12.1
-29%
-10%
Core non-interest expense
56.4
61.9
54.0
9%
-4%
Pretax income
15.4
15.1
16.6
2%
-7%
Core net income
9.4
9.3
10.1
1%
-7%
Per share
$0.17
$0.17
$0.22
0%
-24%
Non-core adjustments
(3.9)
(4.0)
(4.0)
Non-controlling interest
-
-
(0.9)
Net income
5.6
5.3
5.2
Per share
$0.10
$0.10
$0.12
Net interest margin
4.41%
4.11%
4.50%
Core fee ratio
13.9%
18.8%
15.9%
Core efficiency ratio
72%
76%
71%
Core ROAA
0.52%
0.51%
0.62%
Core ROAE
3.2%
3.2%
4.0%
See reconciliation of non-GAAP measures on p. 24-25.
|
 Disciplined and Thoughtful Acquiror
23
Announce
Premium
Price /
Price /
Target
Date
to Market
TBV
Adj. TBV
06/10
(77%)
0.25x
1.25x
11/10
59%
0.45x
1.25x
05/11
(20%)
0.41x
1.17x
03/12
59%
0.95x
1.42x
Capital Bank Average
5%
0.51x
1.27x
Comparables Average
59%
1.28x
1.85x
07/10
NA
NA
0.93x
(1)
(2)
Extensive local market
knowledge, including board-level
relationships with many targets
Healthy acquiror with clean
balance sheet and compelling
growth story
Creative structuring skills
Track record of timely regulatory
approval and rapid integration
No social issues
(3)
Source:
Company filings, SNL Financial, FactSet, and management.
(1)
Premium / (discount) paid per share to 1-day unaffected share price.
(2)
Price / adjusted TBV = Announced deal value / (TBV –
net loan mark + incremental DTA).
(3)
Comparable unassisted M&A transactions include those $25mm–$500mm in deal
value between two public banks since July 2010 with public credit mark disclosures (25 such transactions).
Conservative Deal Pricing
Acquisitions have been negotiated at discounts to prevailing deal pricing
|
 Reconciliation of Core Net Income
24
$ in millions
Core non Interest Income
1Q12
2Q12
3Q12
4Q12
1Q13
Net interest income
$63.9
$63.3
$60.3
$66.0
$67.8
Reported non interest income
14.8
12.2
20.3
15.4
10.9
(-)Securities / Purchase Gains
2.7
0.9
4.9
0.0
–
(-)Insurance settlement gain
–
–
1.8
–
–
Core non interest income
$12.1
$11.3
$13.6
$15.4
$10.9
Reported non interest expense
$63.2
$58.6
$69.4
$68.4
$61.0
(-) Conversion expenses
1.6
1.6
4.2
2.4
0.0
(-) Stock compensation
6.5
4.2
4.2
3.8
1.6
(-) Extinguishment debt
0.3
–
2.9
–
0.3
(-) CVR Valuation
–
–
(0.1)
–
2.6
(-) Insurance settlement expense
–
–
1.8
–
–
(-) Intangible impairment
–
–
–
0.2
–
(-) Legal fees
0.9
0.4
0.5
0.1
0.1
Core non interest expense
$54.0
$52.5
$55.9
$61.9
$56.4
*Core fee ratio
15.87%
15.13%
18.59%
18.80%
13.86%
**Core efficiency ratio
70.95%
70.36%
75.41%
76.14%
71.68%
*Core fee ratio: core noninterest income / (net interest income + core noninterest income)
**Core efficiency ratio: core noninterest expense / (net interest income + core noninterest
income) |
 Reconciliation of Core Net Income and Core ROAA
25
$ in millions
Pre-Tax
After-Tax
Pre-tax
After-Tax
Pre-tax
After-Tax
For the Quarter
For the Quarter
For the Quarter
For the Quarter
For the Quarter
For the Quarter
Ended
Ended
Ended
Ended
Ended
Ended
1Q13
1Q13
4Q12
4Q12
1Q12
1Q12
$5.6
$5.6
$5.3
$5.3
$6.2
$6.2
Non-Interest Income
Security gains
-
-
-
-
(2.8)
(1.7)
Insurance settlement gain
-
-
-
-
-
-
Non-Interest Expense
1.6
0.9
3.8
2.3
6.5
3.9
-
-
2.4
1.5
1.6
1.0
2.6
2.6
-
-
-
-
0.1
0.1
0.1
0.1
0.9
0.5
0.3
0.2
-
-
0.3
0.2
-
-
0.2
0.1
-
-
Taxes
Tax benefit
-
-
-
-
-
-
Tax Effect
(0.8)
N/A
(2.5)
N/A
(2.6)
N/A
$9.4
$9.4
$9.3
$9.3
$10.1
$10.1
Average Assets
$7,182
$7,352
$6,553
Average Equity
$1,166
$1,153
$1,003
*Core ROAA
0.52%
0.51%
0.62%
**Core ROAE
3.2%
3.2%
4.0%
*Core ROAA: Annualized core net income / average assets
**Core ROAE: Annualized core net income / average equity
Net income
Adjustments
Core Net Income
Non-cash equity compensation
Conversion and severance expense
(conversion and salary / employee benefits)
Loss on extinguishment of debt
CVR (other expense)
Legal and merger (professional fees)
Impairment of intangible |
 26
Core ROAA
$ in millions
Pre -Tax
After -Tax
Pre -Tax
After -Tax
Pre -Tax
After -Tax
Pre -Tax
After -Tax
YTD 2010
YTD 2010
YTD 2011
YTD 2011
YTD 2012
YTD 2012
1Q13
1Q13
Net income
$12.1
$12.1
$7.5
$7.5
$55.7
$55.7
$5.6
$5.6
Adjustments:
Non-Interest Income
Security gains
–
–
($4.7)
($2.9)
($8.6)
($5.2)
–
–
Insurance settlement gain
–
–
–
–
($1.7)
($1.1)
–
–
Non-Interest Expense
Non-cash equity compensation
–
–
9.8
6.0
18.7
11.4
1.6
0.9
Conversion and severance expense
(conversion and salary/employee benefits)
2.0
1.2
7.6
4.6
9.2
5.6
0.0
0.0
CVR (other expense)
–
–
–
–
–
–
2.6
2.6
Legal and merger (professional fees)
2.5
2.0
1.5
1.5
2.5
2.2
0.1
0.1
Loss on extinguishment of debt
–
–
(0.4)
(0.3)
3.3
2.0
0.3
0.2
Impairment of intangible
–
–
2.9
1.8
0.2
0.1
–
–
Insurance settlement expense
–
–
–
–
1.7
1.1
–
–
Bargain purchase gain
(15.2)
(15.2)
–
–
–
–
–
–
Tax benefit
–
–
–
–
(34.0)
(34.0)
–
–
Tax effect
(1.3)
N/A
(6.0)
N/A
(9.2)
N/A
(0.8)
N/A
Core net income
$0.1
$0.1
$18.2
$18.2
$37.8
$37.8
$9.4
$9.4
Average assets
$1,581
$5,344
$6,615
$7,182
Core ROAA
0.01%
0.34%
0.57%
0.52% |
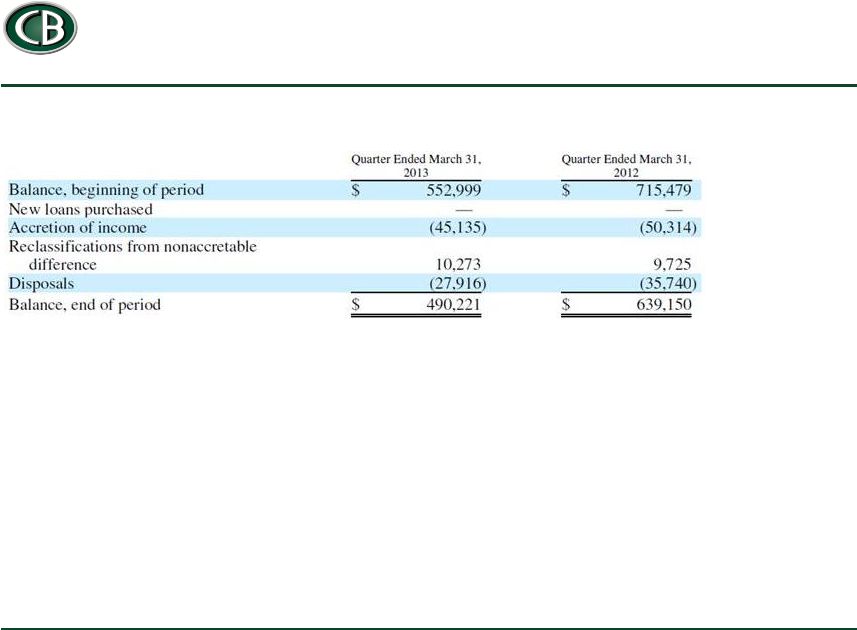 27
Accretable Yield Rollforward
Contractual yield on loan portfolio 1Q 2013: 5.1%
$ in thousands |