Attached files
| file | filename |
|---|---|
| EXCEL - IDEA: XBRL DOCUMENT - Xcerra Corp | Financial_Report.xls |
| EX-32 - EX-32 - Xcerra Corp | d505476dex32.htm |
| EX-31.2 - EX-31.2 - Xcerra Corp | d505476dex312.htm |
| EX-31.1 - EX-31.1 - Xcerra Corp | d505476dex311.htm |
Table of Contents
UNITED STATES
SECURITIES AND EXCHANGE COMMISSION
Washington, D.C. 20549
FORM 10-Q
(Mark One)
| x | QUARTERLY REPORT PURSUANT TO SECTION 13 OR 15(d) OF THE SECURITIES EXCHANGE ACT OF 1934 |
For the quarterly period ended April 30, 2013
OR
| ¨ | TRANSITION REPORT PURSUANT TO SECTION 13 OR 15(d) OF THE SECURITIES EXCHANGE ACT OF 1934 |
For the transition period from to
Commission file number: 000-10761
LTX-CREDENCE CORPORATION
(Exact name of registrant as specified in its charter)
| Massachusetts | 04-2594045 | |
| (State or other jurisdiction of incorporation or organization) |
(I.R.S. Employer Identification No.) | |
| 825 University Ave, Norwood, Massachusetts |
02062 | |
| (Address of principal executive offices) | (Zip Code) | |
(781) 461-1000
(Registrant’s telephone number, including area code)
[None]
(Former name, former address and former fiscal year, if changed since last report)
Indicate by check mark whether the registrant: (1) has filed all reports required to be filed by Section 13 or 15(d) of the Securities Exchange Act of 1934 during the preceding 12 months (or for such shorter period that the registrant was required to file such reports), and (2) has been subject to such filing requirements for the past 90 days. Yes x No ¨
Indicate by check mark whether the registrant has submitted electronically and posted on its corporate Web site, if any, every Interactive Data File required to be submitted and posted pursuant to Rule 405 of Regulation S-T (§232.405 of this chapter) during the preceding 12 months (or for such shorter period that the registrant was required to submit and post such files). Yes x No ¨
Indicate by check mark whether the registrant is a large accelerated filer, an accelerated filer, a non-accelerated filer, or a smaller reporting company. See the definitions of “large accelerated filer”, “accelerated filer” and “smaller reporting company” in Rule 12b-2 of the Exchange Act.
| Large accelerated filer | ¨ | Accelerated filer | x | |||
| Non-accelerated filer | ¨ (Do not check if a smaller reporting company) | Smaller reporting company | ¨ | |||
Indicate by check mark whether the registrant is a shell company (as defined in Rule 12b-2 of the Exchange Act). Yes ¨ No x
Indicate the number of shares outstanding of each of the issuer’s classes of common stock, as of the latest practicable date.
| Class |
Outstanding at June 3, 2013 | |
| Common Stock, $0.05 par value per share | 47,593,835 shares |
Table of Contents
LTX-CREDENCE CORPORATION
| Page Number | ||||
| Part I. |
||||
| Item 1. |
||||
| Consolidated Balance Sheets as of April 30, 2013 and July 31, 2012 |
3 | |||
| 4 | ||||
| Consolidated Statements of Cash Flows for the Nine Months Ended April 30, 2013 and April 30, 2012 |
5 | |||
| 6-15 | ||||
| Item 2. |
Management’s Discussion and Analysis of Financial Condition and Results of Operations |
16 | ||
| Item 3. |
24 | |||
| Item 4. |
24 | |||
| Part II. |
||||
| Item 1. |
24 | |||
| Item 1A. |
25 | |||
| Item 2. |
25 | |||
| Item 4. |
25 | |||
| Item 6. |
25 | |||
| SIGNATURE | 26 | |||
| EXHIBIT INDEX | 27 | |||
2
Table of Contents
CONSOLIDATED BALANCE SHEETS
(In thousands)
| April 30, 2013 |
July 31, 2012 |
|||||||
| (Unaudited) | ||||||||
| ASSETS |
||||||||
| Current assets: |
||||||||
| Cash and cash equivalents |
$ | 28,497 | $ | 29,446 | ||||
| Marketable securities |
98,304 | 107,728 | ||||||
| Accounts receivable—trade, net of allowances of $0 and $39 |
24,679 | 31,182 | ||||||
| Accounts receivable—other |
807 | 740 | ||||||
| Inventories |
31,132 | 28,850 | ||||||
| Prepaid expenses and other current assets |
2,904 | 3,440 | ||||||
|
|
|
|
|
|||||
| Total current assets |
186,323 | 201,386 | ||||||
| Property and equipment, net |
17,708 | 18,229 | ||||||
| Intangible assets, net |
1,966 | 3,153 | ||||||
| Goodwill |
43,030 | 43,030 | ||||||
| Other assets |
1,227 | 1,270 | ||||||
|
|
|
|
|
|||||
| Total assets |
$ | 250,254 | $ | 267,068 | ||||
|
|
|
|
|
|||||
| LIABILITIES AND STOCKHOLDERS’ EQUITY |
||||||||
| Current liabilities: |
||||||||
| Accounts payable |
$ | 13,348 | $ | 12,734 | ||||
| Accrued expenses |
18,296 | 19,736 | ||||||
| Deferred revenue |
5,154 | 5,347 | ||||||
|
|
|
|
|
|||||
| Total current liabilities |
36,798 | 37,817 | ||||||
| Other long-term liabilities |
11,684 | 13,547 | ||||||
| Commitments and contingencies (Note 5) |
||||||||
| Stockholders’ equity: |
||||||||
| Common stock |
2,380 | 2,430 | ||||||
| Additional paid-in capital |
744,405 | 750,760 | ||||||
| Accumulated other comprehensive income |
174 | 230 | ||||||
| Accumulated deficit |
(545,187 | ) | (537,716 | ) | ||||
|
|
|
|
|
|||||
| Total stockholders’ equity |
201,772 | 215,704 | ||||||
|
|
|
|
|
|||||
| Total liabilities and stockholders’ equity |
$ | 250,254 | $ | 267,068 | ||||
|
|
|
|
|
|||||
See accompanying Notes to Consolidated Financial Statements.
3
Table of Contents
CONSOLIDATED STATEMENTS OF OPERATIONS AND COMPREHENSIVE LOSS
(Unaudited)
(In thousands, except per share data)
| Three Months Ended April 30, |
Nine Months Ended April 30, |
|||||||||||||||
| 2013 | 2012 | 2013 | 2012 | |||||||||||||
| Net product sales |
$ | 28,092 | $ | 21,753 | $ | 88,521 | $ | 60,761 | ||||||||
| Net service sales |
8,165 | 9,084 | 25,940 | 27,910 | ||||||||||||
|
|
|
|
|
|
|
|
|
|||||||||
| Net sales |
36,257 | 30,837 | 114,461 | 88,671 | ||||||||||||
| Cost of sales |
17,558 | 15,024 | 53,699 | 43,941 | ||||||||||||
|
|
|
|
|
|
|
|
|
|||||||||
| Gross profit |
18,699 | 15,813 | 60,762 | 44,730 | ||||||||||||
| Engineering and product development expenses |
13,407 | 12,223 | 39,003 | 37,503 | ||||||||||||
| Selling, general and administrative expenses |
9,213 | 8,829 | 28,401 | 26,496 | ||||||||||||
| Amortization of purchased intangible assets |
395 | 791 | 1,187 | 2,372 | ||||||||||||
| Restructuring |
356 | 739 | 655 | 926 | ||||||||||||
|
|
|
|
|
|
|
|
|
|||||||||
| Loss from operations |
(4,672 | ) | (6,769 | ) | (8,484 | ) | (22,567 | ) | ||||||||
| Other income (expense): |
||||||||||||||||
| Interest expense |
(60 | ) | (47 | ) | (167 | ) | (129 | ) | ||||||||
| Interest income |
200 | 266 | 685 | 650 | ||||||||||||
| Other (expense) income, net |
(177 | ) | 15 | (65 | ) | 366 | ||||||||||
|
|
|
|
|
|
|
|
|
|||||||||
| Loss before provision for (benefit from) income taxes |
(4,709 | ) | (6,535 | ) | (8,031 | ) | (21,680 | ) | ||||||||
| Provision for (benefit from) income taxes |
35 | 93 | (560 | ) | (456 | ) | ||||||||||
|
|
|
|
|
|
|
|
|
|||||||||
| Net loss |
$ | (4,744 | ) | $ | (6,628 | ) | $ | (7,471 | ) | $ | (21,224 | ) | ||||
|
|
|
|
|
|
|
|
|
|||||||||
| Net loss per share: |
||||||||||||||||
| Basic and diluted |
$ | (0.10 | ) | $ | (0.14 | ) | $ | (0.16 | ) | $ | (0.43 | ) | ||||
| Weighted-average common and common equivalent shares used in computing net loss per share: |
||||||||||||||||
| Basic and diluted |
47,547 | 49,017 | 47,761 | 49,156 | ||||||||||||
| Comprehensive loss: |
||||||||||||||||
| Net loss |
$ | (4,744 | ) | $ | (6,628 | ) | $ | (7,471 | ) | $ | (21,224 | ) | ||||
| Unrealized gain (loss) on marketable securities |
18 | (13 | ) | (56 | ) | 80 | ||||||||||
|
|
|
|
|
|
|
|
|
|||||||||
| Comprehensive loss |
$ | (4,726 | ) | $ | (6,641 | ) | $ | (7,527 | ) | $ | (21,144 | ) | ||||
|
|
|
|
|
|
|
|
|
|||||||||
See accompanying Notes to Consolidated Financial Statements.
4
Table of Contents
CONSOLIDATED STATEMENTS OF CASH FLOWS
(Unaudited)
(In thousands)
| Nine Months Ended April 30, |
||||||||
| 2013 | 2012 | |||||||
| CASH FLOWS FROM OPERATING ACTIVITIES: |
||||||||
| Net loss |
$ | (7,471 | ) | $ | (21,224 | ) | ||
| Add (deduct) non-cash items: |
||||||||
| Stock-based compensation |
3,502 | 3,435 | ||||||
| Depreciation and amortization |
6,188 | 8,352 | ||||||
| Restructuring |
655 | 926 | ||||||
| Other |
(417 | ) | 1,535 | |||||
| Changes in operating assets and liabilities: |
||||||||
| Accounts receivable |
6,489 | 13,570 | ||||||
| Inventories |
(5,140 | ) | (8,937 | ) | ||||
| Prepaid expenses |
1,243 | 595 | ||||||
| Accounts payable |
614 | (4,576 | ) | |||||
| Accrued expenses |
(2,573 | ) | (8,108 | ) | ||||
| Deferred revenue |
(193 | ) | (31 | ) | ||||
|
|
|
|
|
|||||
| Net cash provided by (used in) operating activities |
2,897 | (14,463 | ) | |||||
| CASH FLOWS FROM INVESTING ACTIVITIES: |
||||||||
| Proceeds from sales and maturities of available-for-sale securities |
53,494 | 53,536 | ||||||
| Proceeds from sales and maturities of held-to-maturity securities |
4,900 | 5,750 | ||||||
| Purchases of available-for-sale securities |
(45,519 | ) | (112,229 | ) | ||||
| Purchases of held-to-maturity securities |
(4,842 | ) | (10,678 | ) | ||||
| Purchases of property and equipment |
(2,197 | ) | (2,485 | ) | ||||
|
|
|
|
|
|||||
| Net cash provided by (used in) investing activities |
5,836 | (66,106 | ) | |||||
| CASH FLOWS FROM FINANCING ACTIVITIES: |
||||||||
| Repurchases of common stock |
(9,208 | ) | (6,077 | ) | ||||
| Payments of tax withholdings for vested RSUs, net of proceeds from stock option exercises |
(1,009 | ) | (1,128 | ) | ||||
| Proceeds from shares issued from employees’ stock purchase plan |
389 | 397 | ||||||
|
|
|
|
|
|||||
| Net cash used in financing activities |
(9,828 | ) | (6,808 | ) | ||||
| Effect of exchange rate changes on cash and cash equivalents |
146 | (482 | ) | |||||
|
|
|
|
|
|||||
| Net decrease in cash and cash equivalents |
(949 | ) | (87,859 | ) | ||||
| Cash and cash equivalents at beginning of period |
29,446 | 123,198 | ||||||
|
|
|
|
|
|||||
| Cash and cash equivalents at end of period |
$ | 28,497 | $ | 35,339 | ||||
|
|
|
|
|
|||||
See accompanying Notes to Consolidated Financial Statements.
5
Table of Contents
NOTES TO CONSOLIDATED FINANCIAL STATEMENTS
(Unaudited)
1. THE COMPANY
LTX-Credence Corporation (“LTX-Credence” or the “Company”) provides market-focused, cost-optimized automated test equipment (ATE) solutions for the semiconductor industry. The Company designs, manufactures, markets and services ATE solutions that address the broad, divergent test requirements of the wireless, computing, automotive and digital consumer market segments of the semiconductor industry. Semiconductor designers and manufacturers worldwide use the Company’s equipment to test their devices during the manufacturing process. After testing, these devices are incorporated in a wide range of products, including personal and tablet computers, mobile internet equipment such as wireless access points and interfaces, broadband access products such as cable modems and set top boxes, personal communication and entertainment products such as mobile phones and personal digital music players, consumer products such as televisions, videogame systems and digital cameras, automobile electronics and power management devices used in portable and automotive electronics. The Company also sells hardware and software support and maintenance services for its test systems.
2. SUMMARY OF SIGNIFICANT ACCOUNTING POLICIES
Basis of Presentation
The accompanying unaudited consolidated financial statements have been prepared pursuant to the Rules of the Securities and Exchange Commission for quarterly reports on Form 10-Q and, accordingly, these footnotes condense or omit information and disclosures which substantially duplicate information provided in our latest audited financial statements. These unaudited consolidated financial statements should be read in conjunction with the financial statements and notes included in our Annual Report on Form 10-K for the fiscal year ended July 31, 2012. In the opinion of management, these unaudited consolidated financial statements reflect all adjustments, including normal recurring accruals, necessary for a fair presentation of the results for the interim periods presented. The operating results for the three and nine months ended April 30, 2013 are not necessarily indicative of future trends or the Company’s results of operations for the entire fiscal year ending July 31, 2013.
These unaudited consolidated financial statements include the accounts of the Company and its wholly owned subsidiaries. All significant inter-company transactions and balances have been eliminated in consolidation.
Foreign Currency Measurement
The financial statements of the Company’s foreign subsidiaries are measured in accordance with Topic 830, Foreign Currency Matters, to the Financial Accounting Standards Board Codification (FASB ASC). The Company’s functional currency is the U.S. dollar. Accordingly, the Company’s foreign subsidiaries measure monetary assets and liabilities at month-end exchange rates while long-term non-monetary items are measured at historical rates. Income and expense accounts are measured at the average exchange rates in effect during the month. Net gains or losses resulting from foreign currency measurement and transaction gains or losses are included in the consolidated results of operations as a component of other income, net, for the three and nine months ended April 30, 2013 and 2012.
Revenue Recognition
The Company recognizes revenue based on guidance provided in Topic 605, Revenue Recognition to the FASB ASC (“ASC 605”). The Company recognizes revenue when persuasive evidence of an arrangement exists, delivery has occurred or services have been rendered, the seller’s price is fixed or determinable and collectability is reasonably assured.
Revenue related to equipment sales is recognized when: (a) the Company has a written sales agreement; (b) delivery has occurred; (c) the price is fixed or determinable; (d) collectability is reasonably assured; (e) the product delivered is standard product with historically demonstrated acceptance; and (f) there is no unique customer acceptance provision or payment tied to acceptance or an undelivered element significant to the functionality of the system. Generally, payment terms are time based after product shipment. When sales to a customer involve multiple elements, revenue is recognized on the delivered element provided that (1) the undelivered element is a proven technology, (2) there is a history of acceptance on the product with the customer, (3) the undelivered element is not essential to the customer’s application, (4) the delivered item(s) has value to the customer on a stand-alone basis, and (5) if the arrangement included a general right of return relative to the delivered item(s), delivery or performance of the undelivered item(s) is considered probable and substantially in the control of the Company. The arrangement consideration, or the amount of revenue to be recognized on each separate unit of accounting, is allocated at the inception of the arrangement to all deliverables on the basis of their relative selling price based on the provisions of Accounting Standards Update (“ASU”) 2009-13, Multiple Deliverable Revenue Arrangements (“ASU 2009-13”).
6
Table of Contents
Revenue related to spare parts is recognized on shipment.
Revenue related to maintenance and service contracts is recognized ratably over the duration of the contracts.
Engineering and Product Development Expenses
The Company expenses all engineering, research and development expenses as incurred. Expenses subject to capitalization in accordance with Topic 985, Software, to the FASB ASC relating to certain software development costs, were insignificant for the three and nine months ended April 30, 2013 and 2012.
Shipping and Handling Costs
Shipping and handling costs are included in cost of sales in the consolidated statements of operations. Shipping and handling costs were insignificant for the three and nine months ended April 30, 2013 and 2012.
Income Taxes
The provision for (benefit from) income taxes relates principally to operating results of foreign entities in jurisdictions primarily in Asia and Europe and the release of reserves due to statute of limitation expirations.
As of April 30, 2013 and July 31, 2012, the total liability for unrecognized income tax benefits was $6.8 million and $8.0 million, respectively (of which $3.3 million and $4.4 million, if recognized, would impact the Company’s income tax rate). The Company recognizes interest and penalties related to uncertain tax positions as a component of income tax expense. As of April 30, 2013 and July 31, 2012, the Company had accrued approximately $0.8 million and $1.0 million for potential payment of accrued interest and penalties.
The Company conducts business globally and, as a result, the Company and its subsidiaries or branches file income tax returns in the U.S. federal jurisdiction and various U.S. state and foreign jurisdictions. In the normal course of business the Company is subject to examination by taxing authorities throughout the world, including such major jurisdictions as the United States, Singapore, France and Germany. With few exceptions, the Company is no longer subject to U.S. federal, state and local or non-U.S. income tax examinations for years prior to 1998.
As a result of completion of the Company’s merger with Credence Systems Corporation (“Credence”) on August 29, 2008, a greater than 50% cumulative ownership change in both entities triggered a significant limitation in net operating loss carryforward utilization. The Company’s ability to use operating and acquired net operating loss and credit carryforwards is subject to annual limitation as defined in sections 382 and 383 of the Internal Revenue Code. The Company currently estimates that the annual limitation on its use of net operating losses generated through August 29, 2008 will be approximately $10.1 million which, based on currently enacted federal carryforward periods, limits the amount of net operating losses able to be used to approximately $202.0 million. The Company will continue to assess the realizability of these carryforwards in subsequent periods.
Accounting for Stock-Based Compensation
The Company maintains and has made awards that remain outstanding under various stock-based compensation plans, including the Company’s 2010 Stock Plan, as amended on November 26, 2010 (“2010 Plan”), the Company’s 2004 Stock Plan, the Company’s 2001 Stock Plan, the Company’s 1999 Stock Plan, and the Company’s 1993 Stock Plan. In addition, the Company assumed and has made awards that remain outstanding under the StepTech, Inc. Stock Option Plan as part of its acquisition of StepTech, Inc. (“StepTech”) in 2003 and the Credence 2005 Stock Incentive Plan in connection with its acquisition of Credence. The Company can only grant new awards under the 2010 Plan.
The Company recognizes stock-based compensation expense for its equity awards in accordance with the provisions of Topic 718, Compensation – Stock Compensation to the FASB ASC (“ASC 718”). Under ASC 718, the Company is required to recognize as expense the estimated fair value as of the grant date of all share-based payments to employees. In accordance with this standard, the Company has elected to recognize the compensation cost of each service based award on a straight-line basis over the vesting period of such award. The Company recorded stock-based compensation expense of approximately $1.1 million and $3.5 million for the three and nine months ended April 30, 2013, respectively, and $0.9 million and $3.4 million, respectively, for the three and nine months ended April 30, 2012, in connection with its share-based payments.
The Company granted 20,000 restricted stock unit awards during the three months ended April 30, 2013, all of which are service-based and vest 25% in each of the next four years.
The Company granted 82,000 restricted stock unit awards during the three months ended January 31, 2013, all of which are service-based and vest in twelve months from the grant date.
7
Table of Contents
The Company granted 793,900 restricted stock unit awards during the three months ended October 31, 2012, all of which are service-based and vest 25% in each of the next four years.
Product Warranty Costs
The Company’s products are sold with warranty provisions that require it to remedy deficiencies in quality or performance of products over a specified period of time at no cost to its customers. The Company generally offers a warranty for all of its products, the standard terms and conditions of which are based on the product sold and the customer. For all tester products sold, the Company accrues a liability for the estimated cost of standard warranty at the time of tester shipment. Factors that impact the expected product warranty liability include the number of installed testers, historical and anticipated product failure rates, material usage and service labor costs. The Company periodically assesses the adequacy of its recorded product warranty liability and adjusts it as necessary.
The following table shows the change in the product warranty liability, as required by Topic 460, Guarantees, to the FASB ASC for the nine months ended April 30, 2013 and 2012:
| Nine Months Ended April 30, |
||||||||
| Product Warranty Activity |
2013 | 2012 | ||||||
| (in thousands) | ||||||||
| Balance at beginning of period |
$ | 1,672 | $ | 2,281 | ||||
| Warranty expenditures for current period |
(2,834 | ) | (2,426 | ) | ||||
| Changes in liability related to pre-existing warranties |
(86 | ) | 60 | |||||
| Provision for warranty costs in the period |
2,543 | 1,658 | ||||||
|
|
|
|
|
|||||
| Balance at end of period |
$ | 1,295 | $ | 1,573 | ||||
|
|
|
|
|
|||||
Net loss per share
Basic net loss per share is computed by dividing net loss available to common stockholders by the weighted average number of common shares outstanding for the period. As the Company was in a net loss position for all periods presented, diluted EPS equals basic EPS:
| Three Months Ended April 30, |
Nine Months Ended April 30, |
|||||||||||||||
| 2013 | 2012 | 2013 | 2012 | |||||||||||||
| (in thousands, except per share data) | ||||||||||||||||
| Net loss |
$ | (4,744 | ) | $ | (6,628 | ) | $ | (7,471 | ) | $ | (21,224 | ) | ||||
| Basic and diluted net loss per share: |
||||||||||||||||
| Weighted average shares outstanding |
47,547 | 49,017 | 47,761 | 49,156 | ||||||||||||
| Basic and diluted EPS |
$ | (0.10 | ) | $ | (0.14 | ) | $ | (0.16 | ) | $ | (0.43 | ) | ||||
For the periods ended April 30, 2013 and 2012, options to purchase approximately 1.0 million shares and 1.3 million shares, respectively, of common stock were not included in the calculation of diluted net loss per share because their inclusion would have been anti-dilutive. These options could be dilutive in the future. The calculation of diluted net loss per share also excludes 2.0 million and 1.9 million restricted stock units for the periods ended April 30, 2013 and 2012, respectively, in accordance with the contingently issuable shares guidance of Topic 260, Earnings Per Share, to the FASB ASC.
Cash and Cash Equivalents and Marketable Securities
The Company considers all highly liquid investments that are readily convertible to cash and that have original maturity dates of three months or less to be cash equivalents. Cash and cash equivalents consist primarily of operating cash. Marketable securities consist primarily of debt securities that are classified as available-for-sale and held-to-maturity, in accordance with Topic 320, Investments – Debt and Equity Securities, to the FASB ASC. The Company also holds certain investments in commercial paper or certificates of deposit that it considers to be held-to-maturity, based on their maturity dates. Securities available-for-sale includes corporate, asset-backed, mortgage-backed, and governmental obligations with various contractual maturity dates, some of which are greater than one year. The Company considers the securities to be liquid and convertible to cash within 30 days. The Company has the ability and intent to liquidate any security that the Company holds to fund operations over the next twelve months if necessary and as such has classified these securities as short-term. Governmental obligations include U.S. Government, State, Municipal and Federal Agency securities. The Company has an overnight sweep investment arrangement with its bank for certain accounts to allow the Company to enter into diversified overnight investments via a money market mutual fund which generally provides a higher investment yield than a regular operating account.
8
Table of Contents
Gross unrealized gains and losses on investments held by the Company for the three and nine months ended April 30, 2013 and 2012 were not significant. Unrealized gains and losses on investments held by the Company are reflected as a separate component of comprehensive income (loss) and are included in Stockholders’ Equity. Realized gains, losses and interest on investments held by the Company are included in interest income in the Consolidated Statements of Operations and Comprehensive Loss. The Company analyzes its investments for impairment on a quarterly basis or upon occurrence of indicators of possible impairment. There were no other than temporary impairment losses in the three and nine months ended April 30, 2013 or 2012.
Inventories
Inventories are stated at the lower of cost or market, determined on the first-in, first-out (“FIFO”) method, and include materials, labor and manufacturing overhead. The components of inventories are as follows:
| April 30, 2013 |
July 31, 2012 |
|||||||
| (in thousands) | ||||||||
| Purchased components and parts |
$ | 16,743 | $ | 13,811 | ||||
| Units-in-progress |
4,209 | 3,045 | ||||||
| Finished units |
10,180 | 11,994 | ||||||
|
|
|
|
|
|||||
| Total inventories |
$ | 31,132 | $ | 28,850 | ||||
|
|
|
|
|
|||||
The Company establishes inventory reserves when conditions exist that indicate inventory may be in excess of anticipated demand or is obsolete based upon assumptions about future demand for the Company’s products or market conditions. The Company regularly evaluates the ability to realize the value of inventory based on a combination of factors including the following: forecasted sales or usage, estimated product end of life dates, estimated current and future market value and new product introductions.
Purchasing and usage alternatives are also explored to mitigate inventory exposure. When recorded, reserves are intended to reduce the carrying value of inventory to its net realizable value. As of April 30, 2013 and July 31, 2012, inventory is stated net of inventory reserves of $41.2 million and $42.4 million, respectively. If actual demand for products deteriorates or market conditions are less favorable than projected, additional inventory reserves may be required. Such reserves are not reversed until the related inventory is sold or otherwise disposed of. The Company had sales of $0.1 million and $0.9 million of previously reserved inventory for the three and nine months ended April 30, 2013, which represents the gross cash received from the customer. The Company released reserves of $0.04 million and $0.3 million for the three and nine months ended April 30, 2013, related to these sales. The Company had sales of $0.7 million and $5.9 million of previously reserved inventory for the three and nine months ended April 30, 2012, which represents the gross cash received from the customer. The Company released reserves of $0.4 million and $1.5 million for the three and nine months ended April 30, 2012, related to these sales.
Property and Equipment
Property and equipment acquired is recorded at cost. The Company provides for depreciation and amortization on the straight-line method. Charges are made to operating expenses in amounts that are sufficient to amortize the cost of the assets over their estimated useful lives. Equipment spares used for service and internally manufactured test systems used for testing components and engineering projects are recorded at cost and depreciated over three to seven years. Repair and maintenance costs that do not extend the lives of property and equipment are expensed as incurred. Property and equipment are summarized as follows:
| April 30, 2013 |
July 31, 2012 |
Estimated Useful Lives | ||||||||
| (in thousands) | (in years) | |||||||||
| Equipment spares |
$ | 50,687 | $ | 57,841 | 5 or 7 | |||||
| Machinery, equipment and internally manufactured systems |
39,544 | 38,067 | 3-7 | |||||||
| Office furniture and equipment |
3,697 | 3,885 | 3-7 | |||||||
| Purchased software |
2,867 | 2,870 | 3 | |||||||
| Land |
2,524 | 2,524 | — | |||||||
| Leasehold improvements |
6,398 | 6,187 | Term of lease or useful life, not to exceed 10 years | |||||||
|
|
|
|
|
|||||||
| Property and equipment, gross |
105,717 | 111,374 | ||||||||
| Less: accumulated depreciation and amortization |
(88,009 | ) | (93,145 | ) | ||||||
|
|
|
|
|
|||||||
| Property and equipment, net |
$ | 17,708 | $ | 18,229 | ||||||
|
|
|
|
|
|||||||
9
Table of Contents
Impairment of Long-Lived Assets Other Than Goodwill
On an ongoing basis, management reviews the value of and period of amortization or depreciation of the Company’s long-lived assets. In accordance with Topic 360, Property, Plant and Equipment, to the FASB ASC, the Company reviews whether impairment losses exist on its long-lived assets other than goodwill when indicators of impairment are present. During this review, the Company assesses future cash flows and re-evaluates the significant assumptions used in determining the original cost of long-lived assets other than goodwill. Although the assumptions may vary, they generally include revenue growth, operating results, cash flows and other indicators of value. Management then determines whether there has been a permanent impairment of the value of long-lived assets based upon events or circumstances that have occurred since acquisition. The extent of the impairment amount recognized is based upon a determination of the impaired asset’s fair value compared to its carrying value. As of April 30, 2013 and July 31, 2012 there were no indicators that required the Company to conduct a recoverability test as of those dates.
Goodwill and Other Intangibles
In accordance with Topic 350, Intangibles – Goodwill and Other, to the FASB ASC (“ASC 350”), the Company is required to review goodwill by reporting unit for impairment at least annually or more often if there are indicators of impairment present. The Company has determined its entire business represents one reporting unit. Historically, the Company has performed its annual impairment analysis during the fourth quarter of each year. The Company evaluated the implied fair value based on the Company’s market capitalization of its one reporting unit as compared to the carrying value of the net assets assigned to its reporting unit as of April 30, 2013 and July 31, 2012. As of those dates, the fair value of the reporting unit exceeded the carrying value of its net assets and therefore no impairment existed.
The Company’s goodwill consists of the following:
| Goodwill |
April 30, 2013 |
July 31, 2012 |
||||||
| (in thousands) | ||||||||
| Merger with Credence Systems Corporation (August 29, 2008) |
$ | 28,662 | $ | 28,662 | ||||
| Acquisition with Step Tech Inc. (June 10, 2003) |
14,368 | 14,368 | ||||||
|
|
|
|
|
|||||
| Total goodwill |
$ | 43,030 | $ | 43,030 | ||||
|
|
|
|
|
|||||
There was no change in the goodwill balance for the three or nine months ended April 30, 2013 or 2012.
Intangible assets, all of which relate to the Credence merger, consist of the following:
| As of April 30, 2013 | ||||||||||||||||
| Description |
Estimated Useful Life |
Gross Carrying Amount |
Accumulated Amortization |
Net Amount | ||||||||||||
| (in years) | (in thousands) | (in thousands) | (in thousands) | |||||||||||||
| Trade names |
1.0 | $ | 300 | $ | 300 | $ | — | |||||||||
| Distributor relationships |
2.0 | 2,800 | 2,800 | — | ||||||||||||
| Key customer relationships |
3.0 | 8,500 | 8,500 | — | ||||||||||||
| Developed technology—ASL |
6.0 | 16,000 | 15,544 | 456 | ||||||||||||
| Developed technology—Diamond |
9.0 | 9,400 | 8,772 | 628 | ||||||||||||
| Maintenance agreements |
7.0 | 1,900 | 1,018 | 882 | ||||||||||||
|
|
|
|
|
|
|
|||||||||||
| Total intangible assets |
$ | 38,900 | $ | 36,934 | $ | 1,966 | ||||||||||
|
|
|
|
|
|
|
|||||||||||
10
Table of Contents
| As of July 31, 2012 | ||||||||||||||||
| Description |
Estimated Useful Life |
Gross Carrying Amount |
Accumulated Amortization |
Net Amount | ||||||||||||
| (in years) | (in thousands) | (in thousands) | (in thousands) | |||||||||||||
| Trade names |
1.0 | $ | 300 | $ | 300 | $ | — | |||||||||
| Distributor relationships |
2.0 | 2,800 | 2,800 | — | ||||||||||||
| Key customer relationships |
3.0 | 8,500 | 8,500 | — | ||||||||||||
| Developed technology—ASL |
6.0 | 16,000 | 14,965 | 1,035 | ||||||||||||
| Developed technology—Diamond |
9.0 | 9,400 | 8,367 | 1,033 | ||||||||||||
| Maintenance agreements |
7.0 | 1,900 | 815 | 1,085 | ||||||||||||
|
|
|
|
|
|
|
|||||||||||
| Total intangible assets |
$ | 38,900 | $ | 35,747 | $ | 3,153 | ||||||||||
|
|
|
|
|
|
|
|||||||||||
Intangible assets are amortized based upon the pattern of estimated economic use over their estimated useful lives. The weighted average estimated remaining useful life over which these intangible assets will be amortized is 1.7 years.
The Company expects amortization for these intangible assets to be:
| For the fiscal year ending July 31, |
Amount | |||
| (in thousands) | ||||
| Remainder of 2013 |
$ | 395 | ||
| 2014 |
769 | |||
| 2015 |
396 | |||
| 2016 |
321 | |||
| 2017 |
85 | |||
|
|
|
|||
| Total |
$ | 1,966 | ||
|
|
|
|||
3. SEGMENT REPORTING
In accordance with the provisions of Topic 280, Segment Reporting to the FASB ASC, the Company operates as one reporting segment, that is, the design, manufacture and marketing of automated test equipment for the semiconductor industry that is used to test system-on-a-chip, digital, analog and mixed signal integrated circuits.
The Company’s net sales to geographic area for the three and nine months ended April 30, 2013 and 2012, along with its long-lived assets at April 30, 2013 and July 31, 2012, are summarized as follows:
| Three Months Ended April 30, |
Nine Months Ended April 30, |
|||||||||||||||
| 2013 | 2012 | 2013 | 2012 | |||||||||||||
| (in thousands) | ||||||||||||||||
| Net sales (ship to location): |
||||||||||||||||
| United States |
$ | 5,640 | $ | 7,309 | $ | 21,343 | $ | 23,828 | ||||||||
| Taiwan |
9,408 | 6,532 | 29,743 | 14,298 | ||||||||||||
| Philippines |
5,867 | 6,149 | 17,714 | 14,805 | ||||||||||||
| Malaysia |
4,140 | 4,108 | 12,395 | 6,914 | ||||||||||||
| All other countries (none greater than 10% of total) |
11,202 | 6,739 | 33,266 | 28,826 | ||||||||||||
|
|
|
|
|
|
|
|
|
|||||||||
| Total Net Sales |
$ | 36,257 | $ | 30,837 | $ | 114,461 | $ | 88,671 | ||||||||
|
|
|
|
|
|
|
|
|
|||||||||
11
Table of Contents
Long-lived assets consist of property and equipment:
| April 30, 2013 |
July 31, 2012 |
|||||||
| (in thousands) | ||||||||
| Long-lived assets: |
||||||||
| United States |
$ | 15,381 | $ | 16,386 | ||||
| Japan |
708 | 564 | ||||||
| Singapore |
375 | 312 | ||||||
| Philippines |
531 | 166 | ||||||
| All other countries |
713 | 801 | ||||||
|
|
|
|
|
|||||
| Total long-lived assets |
$ | 17,708 | $ | 18,229 | ||||
|
|
|
|
|
|||||
Transfer prices on products sold to foreign subsidiaries are intended to produce profit margins that correspond to the subsidiary’s sales and support efforts.
4. RESTRUCTURING
In accordance with the provisions of Topic 420, Exit or Disposal Cost Obligation, to the FASB ASC, the Company recognizes certain costs associated with headcount reductions, office vacancies and other costs to move or relocate operations or employees as restructuring costs in the period in which such actions are initiated and approved by management or the obligations are incurred, as applicable. The following table sets forth the Company’s restructuring accrual activity for the nine months ended April 30, 2013 and April 30, 2012 (in thousands):
| Severance Costs |
Facility Leases |
Total | ||||||||||
| Balance July 31, 2012 |
$ | 364 | $ | 3,697 | $ | 4,061 | ||||||
| Additions to expense |
231 | 424 | 655 | |||||||||
| Accretion |
— | 167 | 167 | |||||||||
| Stock based compensation |
(48 | ) | — | (48 | ) | |||||||
| Cash paid |
(425 | ) | (1,134 | ) | (1,559 | ) | ||||||
|
|
|
|
|
|
|
|||||||
| Balance April 30, 2013 |
$ | 122 | $ | 3,154 | $ | 3,276 | ||||||
|
|
|
|
|
|
|
|||||||
| Included in the Company’s Consolidated Balance Sheet: |
||||||||||||
| Accrued expenses |
$ | 122 | $ | 1,088 | $ | 1,210 | ||||||
| Other long-term liabilities |
— | 2,066 | 2,066 | |||||||||
|
|
|
|
|
|
|
|||||||
| Balance at April 30, 2013 |
$ | 122 | $ | 3,154 | $ | 3,276 | ||||||
|
|
|
|
|
|
|
|||||||
| Severance Costs |
Facility Leases |
Total | ||||||||||
| Balance July 31, 2011 |
$ | 6 | $ | 4,761 | $ | 4,767 | ||||||
| Additions to expense |
836 | 90 | 926 | |||||||||
| Accretion |
— | 135 | 135 | |||||||||
| Stock based compensation |
(15 | ) | — | (15 | ) | |||||||
| Cash paid |
(150 | ) | (1,145 | ) | (1,295 | ) | ||||||
|
|
|
|
|
|
|
|||||||
| Balance April 30, 2012 |
$ | 677 | $ | 3,841 | $ | 4,518 | ||||||
|
|
|
|
|
|
|
|||||||
| Included in the Company’s Consolidated Balance Sheet: |
||||||||||||
| Accrued expenses |
$ | 677 | $ | 1,107 | $ | 1,784 | ||||||
| Other long-term liabilities |
— | 2,734 | 2,734 | |||||||||
|
|
|
|
|
|
|
|||||||
| Balance at April 30, 2012 |
$ | 677 | $ | 3,841 | $ | 4,518 | ||||||
|
|
|
|
|
|
|
|||||||
During the quarter ending April 30, 2013, the Company recorded $0.4 million of restructuring expense related to changes in sublease assumptions on a previously restructured facility. The remainder of the facility related expenses shown for the nine months
12
Table of Contents
ending April 30, 2013, relate to changes in the Company’s service organization, to move certain board repair functions and other roles from North American locations to subsidiary offices in Singapore and the Philippines, and relocation costs between the Company’s former and current facilities in the Philippines. The Company recognized $0.3 million of severance and other post employment obligations associated with these moves during the Company’s first fiscal quarter, of which approximately $0.1 million remains to be paid as of April 30, 2013.
During the nine months ending April 30, 2012, the Company reduced headcount in its global field service and applications engineering groups. The Company also vacated two facilities in North America. The restructuring expense of $0.9 million recorded during this period includes severance and other post-employment benefits associated with these headcount reductions, as well as an early termination fee incurred upon vacating one of the facilities, and its remaining rent obligations under these leases.
The cash paid for the nine months ending April 30, 2013 and April 30, 2012 represents lease payments for the Company’s previously restructured facilities and severance paid.
5. COMMITMENTS AND CONTINGENCIES
From time to time, the Company is subject to certain legal proceedings and other contingencies, the outcomes of which are subject to significant uncertainty. The Company accrues for estimated losses if it is probable that an asset has been impaired or a liability has been incurred and the amount of the loss can be reasonably estimated. The Company uses judgment and evaluates, with the assistance of legal counsel, whether a loss contingency arising from litigation should be disclosed or recorded. The outcome of legal proceedings and other contingencies is inherently uncertain and often difficult to estimate. Accordingly, if the outcome of legal proceedings and other contingencies is different than is anticipated by the Company, the Company would record the difference between any previously recorded amount and the full amount at which the matter was resolved, in earnings in the period resolved, which could negatively impact the Company’s results of operations and financial position for the period.
The Company is a defendant in a litigation matter incidental to the business that is related to customer expectations of test system performance for product that was shipped in 2006 by Credence. The Company does not believe the plaintiff’s claims have merit and its vigorously defending its position. An estimate of any potential loss cannot be made; the Company does not believe a loss is probable, and accordingly the Company has not accrued any amounts related to this matter.
In the ordinary course of business, the Company agrees from time to time to indemnify certain customers against certain third party claims for property damage, bodily injury, personal injury or intellectual property infringement arising from the operation or use of the Company’s products. Also, from time to time in agreements with suppliers, licensors and other business partners, the Company agrees to indemnify these partners against certain liabilities arising out of the sale or use of the Company’s products. The maximum potential amount of future payments the Company could be required to make under these indemnification obligations in the aggregate is theoretically unlimited; however, the Company has general and umbrella insurance policies that enable it to recover a portion of any amounts paid and many of its agreements contain a limit on the maximum amount, as well as limits on the types of damages recoverable. Based on the Company’s experience with such indemnification claims, it believes the estimated fair value of these obligations is minimal. Accordingly, the Company has no liabilities recorded for these agreements as of April 30, 2013 or July 31, 2012.
Subject to certain limitations, the Company indemnifies its current and former officers and directors in certain circumstances in connection with their services as directors and officers of the Company. Although the maximum potential amount of future payments the Company could be required to make under these agreements is theoretically unlimited, as there were no known or pending claims, the Company has not accrued a liability for these agreements as of April 30, 2013 or July 31, 2012.
The Company had approximately $15.5 million and $15.1 million of non-cancelable inventory commitments with an outsourced supplier as of April 30, 2013 and July 31, 2012, respectively. The Company expects to consume the inventory through normal operating activity.
13
Table of Contents
The Company has operating lease commitments for certain facilities and equipment that expire at various dates through 2021. Minimum lease payment obligations under non-cancelable leases are as follows:
Lease Commitments:
| For the fiscal year ending July 31, |
Amount | |||
| (in thousands) | ||||
| Remainder of 2013 |
$ | 1,399 | ||
| 2014 |
5,467 | |||
| 2015 |
4,705 | |||
| 2016 |
4,275 | |||
| 2017 |
2,519 | |||
| Thereafter |
4,663 | |||
|
|
|
|||
| Total minimum lease payments |
$ | 23,028 | ||
|
|
|
|||
6. ACCRUED EXPENSES
Accrued expenses consisted of the following at April 30, 2013 and July 31, 2012:
| (in thousands) | ||||||||
| April 30, 2013 |
July 31, 2012 |
|||||||
| Accrued compensation |
$ | 7,751 | $ | 7,059 | ||||
| Accrued vendor liability |
2,249 | 2,373 | ||||||
| Warranty reserve |
1,295 | 1,672 | ||||||
| Accrued restructuring |
1,210 | 1,502 | ||||||
| Accrued taxes |
1,098 | 931 | ||||||
| Accrued commissions |
696 | 1,301 | ||||||
| Other accrued expenses |
3,997 | 4,898 | ||||||
|
|
|
|
|
|||||
| Total accrued expenses |
$ | 18,296 | $ | 19,736 | ||||
|
|
|
|
|
|||||
7. FAIR VALUE MEASUREMENTS
The Company determines its fair value measurements for assets and liabilities based upon the provisions of Topic 820, Fair Value Measurements and Disclosures to the FASB ASC.
The Company holds short-term money market investments and certain other financial instruments which are carried at fair value. The Company determines fair value based upon quoted prices, when available, or through the use of alternative approaches when market quotes are not readily accessible or available.
Valuation techniques for fair value are based upon observable and unobservable inputs. Observable inputs reflect market data obtained from independent sources, while unobservable inputs reflect the Company’s best estimate, considering all relevant information. These valuation techniques involve some level of management estimation and judgment. The valuation process to determine fair value also includes making appropriate adjustments to the valuation model outputs to consider risk factors.
The fair value hierarchy of the Company’s inputs used in the determination of fair value for assets and liabilities during the current period consists of three levels. Level 1 inputs are composed of unadjusted, quoted prices in active markets for identical assets or liabilities at the measurement date. Level 2 inputs include quoted prices for similar instruments in active markets, quoted prices for identical or similar instruments in markets that are not active, inputs other than quoted prices that are observable for the asset or liability, and inputs that are derived principally from or corroborated by observable market data by correlation or other means. Level 3 inputs incorporate the Company’s own best estimate of what market participants would use in pricing the asset or liability at the measurement date where consideration is given to the risk inherent in the valuation technique and the risk inherent in the inputs to the model. If inputs used to measure an asset or liability fall within different levels of the hierarchy, the categorization is based on the lowest level input that is significant to the fair value measurement of the asset or liability. The Company’s assessment of the significance of a particular input to the fair value measurement in its entirety requires judgment and considers factors specific to the asset or liability.
14
Table of Contents
The following table presents financial assets and liabilities measured at fair value and their related valuation inputs as of April 30, 2013 and as of July 31, 2012:
| Fair Value Measurements at Reporting Date Using (in thousands) |
||||||||||||||||
| April 30, 2013 |
Total Fair Value of Asset or Liability |
Quoted Prices in Active Markets for Identical Assets (Level 1) |
Significant Other Observable Inputs (Level 2) |
Significant Unobservable Inputs (Level 3) |
||||||||||||
| Cash and cash equivalents (1) |
$ | 28,497 | $ | 28,497 | $ | — | $ | — | ||||||||
| Marketable securities (2) |
94,553 | 5,308 | 89,245 | — | ||||||||||||
|
|
|
|
|
|
|
|
|
|||||||||
| Total assets |
$ | 123,050 | $ | 33,805 | $ | 89,245 | $ | — | ||||||||
|
|
|
|
|
|
|
|
|
|||||||||
| July 31, 2012 |
Total Fair Value of Asset or Liability |
Quoted Prices in Active Markets for Identical Assets (Level 1) |
Significant Other Observable Inputs (Level 2) |
Significant Unobservable Inputs (Level 3) |
||||||||||||
| Cash and cash equivalents (1) |
$ | 29,446 | $ | 29,081 | $ | 365 | $ | — | ||||||||
| Marketable securities (2) |
104,932 | 7,226 | 97,706 | — | ||||||||||||
|
|
|
|
|
|
|
|
|
|||||||||
| Total assets |
$ | 134,378 | $ | 36,307 | $ | 98,071 | $ | — | ||||||||
|
|
|
|
|
|
|
|
|
|||||||||
| (1) | Cash and cash equivalents as of April 30, 2013 and July 31, 2012 includes cash held in operating accounts of approximately $28.3 million and $28.6 million, respectively, that are not subject to fair value measurements. For purposes of this disclosure they are included as having Level 1 inputs. |
| (2) | Marketable securities as of April 30, 2013 and July 31, 2012 exclude approximately $3.8 million and $2.8 million, respectively, of commercial paper which is held to maturity and not subject to fair value measurements. |
The carrying value of accounts receivable, prepaid expenses and accounts payable approximate fair value due to their short-term nature.
There were no assets or liabilities recorded at fair value on a non-recurring basis requiring valuation disclosures as of April 30, 2013 or as of July 31, 2012.
8. STOCKHOLDERS’ EQUITY
Stock Repurchases
On September 15, 2011, the Company announced that its Board of Directors had authorized a stock repurchase program for up to $25 million of shares of the Company’s common stock. Under this program, the Company is authorized to repurchase shares of its common stock from time to time in open market transactions. The Company will determine the timing and amount of the transactions based on its evaluation of market conditions and other factors. The repurchase program may be suspended or discontinued at any time and has no expiration date.
During the nine months ending April 30, 2013 and 2012 the Company repurchased 1,642,272 and 1,121,600 shares of common stock, respectively, for a total purchase price of $9.2 million and $6.1 million, respectively. There were no repurchases made for the three months ending April 30, 2013 and 2012, respectively. Cumulatively, as of April 30, 2013, the Company has repurchased 3,294,666 shares of common stock for a total purchase price of $18.7 million since the inception of the program.
9. RECENT ACCOUNTING PRONOUNCEMENTS
There are no recent accounting pronouncements impacting the Company’s consolidated financial statements for the three and nine months ending April 30, 2013.
15
Table of Contents
Item 2. MANAGEMENT’S DISCUSSION AND ANALYSIS OF FINANCIAL CONDITION AND RESULTS OF OPERATIONS
The following discussion should be read together with the Consolidated Financial Statements and Notes thereto appearing in Part I, Item 1 in this quarterly report on Form 10-Q. Certain statements in “Management’s Discussion and Analysis of Financial Condition and Results of Operations” are forward-looking statements that involve risks and uncertainties. Words such as may, will, could, should, would, anticipates, expects, intends, plans, predicts, projects, believes, seeks, estimates and similar expressions identify such forward-looking statements. The forward-looking statements contained herein are based on current expectations and entail various risks and uncertainties that could cause actual results to differ materially and adversely from those expressed in such forward-looking statements. Factors that might cause such a difference include, among other things, those set forth under “Risk Factors” in the Company’s Annual Report for the fiscal year ended ending July 31, 2012 filed on Form 10-K with the SEC on October 15, 2012 and those appearing elsewhere in this quarterly report on Form 10-Q. Readers are cautioned not to place undue reliance on these forward-looking statements, which speak only as of the date hereof and reflect management’s estimates and analysis only as of the date hereof. We assume no obligations to update these forward-looking statements to reflect actual results or changes in factors or assumptions affecting forward-looking statements.
Overview
We provide market-focused, cost-optimized automated test equipment (ATE) solutions for the semiconductor industry. We design, manufacture, market and service ATE solutions that address the broad, divergent test requirements of the wireless, computing, automotive and digital consumer markets of the semiconductor industry. Semiconductor designers and manufacturers worldwide use our equipment to test their devices during the manufacturing process. After testing, these devices are incorporated in a wide range of products, including personal and tablet computers, mobile internet equipment such as wireless access points and interfaces, broadband access products such as cable modems and set top boxes, personal communication and entertainment products such as mobile phones and personal digital music players, consumer products such as televisions, videogame systems and digital cameras, automobile electronics and power management devices used in portable and automotive electronics. We also sell hardware and software support and maintenance services for our test systems.
We focus our marketing and sales efforts on integrated device manufacturers (IDMs), outsourced semiconductor assembly and test providers, (OSATs), which perform assembly and testing services for the semiconductor industry, and fabless semiconductor companies, which design integrated circuits but have no manufacturing capability. We offer our customers a comprehensive portfolio of semiconductor test systems and provide a global network of strategically deployed applications and support resources.
Industry Conditions and Outlook
We sell capital equipment and services to companies that design, manufacture, assemble or test semiconductor devices. The semiconductor industry is highly cyclical, causing a cyclical impact on our financial results. As a capital equipment provider, our revenue is driven by the capital expenditure budgets and spending patterns of our customers, who often delay or accelerate purchases in reaction to variations in their business. The level of capital expenditures by these semiconductor companies depends on the current and anticipated market demand for semiconductor devices and the products that incorporate them. Therefore, demand for our semiconductor test equipment is dependent on growth in the semiconductor industry. In particular, three primary characteristics of the semiconductor industry drive the demand for semiconductor test equipment:
| • | increases in unit production of semiconductor devices; |
| • | increases in the complexity of semiconductor devices used in electronic products; and |
| • | the emergence of next generation device technologies. |
16
Table of Contents
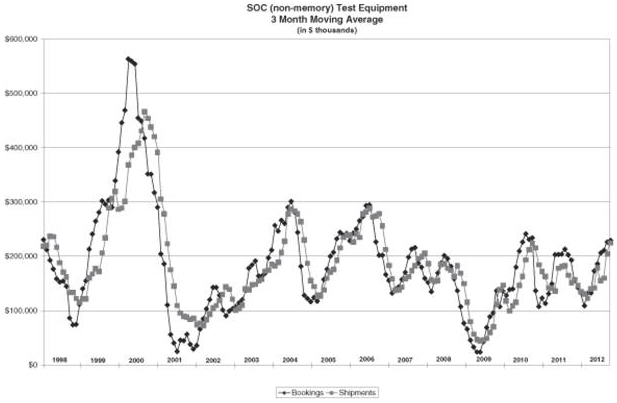
The following graph shows the cyclicality in semiconductor test equipment orders and shipments from fiscal 1998 through fiscal 2012 (using the three month moving average), as calculated by SEMI, an industry trade organization:
Consistent with our business strategy, we invest significant amounts in engineering and product development to design and enhance our tester platforms throughout the semiconductor business cycle. During periods of industry weakness, we implement cost reduction measures, such as the strict oversight and reduction in discretionary travel and other variable overhead expenses. We believe that these reductions in operating costs preserve our ability to fund critical engineering and product development efforts and continue to provide our customers with the levels of responsiveness and service they require. We believe that our competitive advantage in the semiconductor test industry is primarily driven by the ability of our combined tester platforms to meet or exceed the cost and technical specifications required for the testing of advanced semiconductor devices. Our current investment in engineering and product development is focused on enhancements and additions to our product offerings with new options and instruments designed for specific market segments. We believe this will continue to differentiate our tester platforms from the product offerings of our competitors.
We have transitioned the manufacture of certain components and subassemblies to contract manufacturers, thereby reducing our fixed manufacturing costs associated with direct labor and overhead. We believe that transforming product manufacturing costs from fixed to variable costs allows us to improve our performance in the highly cyclical semiconductor equipment industry.
We are exposed to the risks associated with the volatility of the U.S. and global economies. The lack of visibility regarding whether or when there will be sustained growth periods for the sale of electronic goods and information technology equipment, and uncertainty regarding the amount of sales, underscores the need for caution in predicting growth in the semiconductor test equipment industry in general and in our revenues and profits specifically. Slow or negative growth in the U.S. and global economies may materially and adversely affect our business, financial condition and results of operations. Our results of operations would also be adversely affected if we were to experience lower than anticipated order levels, cancellations of orders in backlog, extended customer delivery requirements or pricing pressure as a result of a slowdown. At lower levels of revenue, there is a higher likelihood that these types of changes in our customers’ requirements would adversely affect our results of operations because in any particular quarter a limited number of transactions accounts for an even greater portion of sales for the quarter.
Critical Accounting Policies and the Use of Estimates
The preparation of financial statements in conformity with generally accepted accounting principles requires management to make estimates and assumptions that affect the reported amount of assets, liabilities, revenues and expenses, and related disclosure of contingent assets and liabilities. We base these estimates and assumptions on historical experience and evaluate them on an on-going
17
Table of Contents
basis to ensure they remain reasonable under current conditions. Actual results could differ from those estimates. We believe that our most critical accounting policies upon which our financial reporting depends and which involve the most complex and subjective decisions or assessments are as follows: revenue recognition, inventory reserves, income taxes, warranty, goodwill and other intangibles, impairment of long-lived assets and allowances for doubtful accounts.
A summary of those accounting policies and estimates that we believe to be most critical to fully understand and evaluate our financial results is set forth below. The summary should be read in conjunction with our Consolidated Financial Statements and Notes and related disclosures in Part I, Item 1 in this quarterly report on Form 10-Q.
Revenue Recognition
Our revenue recognition policy is described in Note 2, Summary of Significant Accounting Policies, contained in the Notes to Consolidated Financial Statements included in Part 1, Item 1 in this quarterly report on Form 10-Q. We recognize revenue when persuasive evidence of an arrangement exists, delivery or customer acceptance (if required) has occurred or services have been rendered, the price is fixed or determinable and collectability is reasonably assured.
Inventory Reserves
We sell capital equipment to companies that design, manufacture, assemble, and test semiconductor devices. We are exposed to a number of economic and industry factors that could result in portions of our inventory becoming either obsolete or in excess of anticipated usage. These factors include, but are not limited to, changes in our customers’ capital expenditures, technological changes in our markets, our ability to meet changing customer requirements, competitive pressures in products and prices, and the availability of key components from our suppliers. Our policy is to establish inventory reserves when conditions exist that suggest our inventory may be in excess of anticipated demand or is obsolete based upon our assumptions about future demand for our products or market conditions. We regularly evaluate the ability to realize the value of our inventory based on a combination of factors including the following: historical usage rates, forecasted sales or usage, estimated product end of life dates, estimated current and future market values and new product introductions. Purchasing and alternative usage options are also explored to mitigate inventory exposure. When recorded, our reserves are intended to reduce the carrying value of our inventory to its net realizable value. Such reserves are not reversed until the related inventory is sold or otherwise disposed.
For the three and nine months ended April 30, 2013 we recorded sales of $0.1 million and $0.9 million of previously reserved inventory, which represents gross cash received from the customer. We released reserves of $0.04 million and $0.3 million for three and nine months ended April 30, 2013, related to these sales.
For the three and nine months ended April 30, 2012 we recorded sales of $0.7 million and $5.9 million of previously reserved inventory, which represents gross cash received from the customer. We released reserves of $0.4 million and $1.5 million for the three and nine months ended April 30, 2012, related to these sales.
As of April 30, 2013 and July 31, 2012, our inventory of $31.1 million and $28.9 million, respectively, is stated net of inventory reserves of $41.2 million and $42.4 million, respectively, and primarily consists of X-Series, ASL, ASLx, Diamond, and Diamondx products.
Income Taxes
In accordance with FASB ASC Topic 740, Income Taxes (“ASC 740”), we recognize deferred income taxes based on the expected future tax consequences of differences between the financial statement basis and the tax basis of assets and liabilities calculated using enacted tax rates for the year in which the differences are expected to be reflected in the tax return. Valuation allowances are established when necessary to reduce deferred taxes to the amount expected to be realized.
We have deferred tax assets resulting from tax credit carryforwards, net operating losses and other deductible temporary differences, which will reduce taxable income in future periods. ASC 740 requires that a valuation allowance be established when it is “more likely than not” that all or a portion of deferred tax assets will not be realized. A review of all available positive and negative evidence needs to be considered, including a company’s performance, the market environment in which it operates, the length of carryback and carryforward periods, existing sales backlog and future sales projections. Where there are cumulative losses in recent years, ASC 740 creates a strong presumption that a valuation allowance is needed. This presumption can be overcome in very limited circumstances. As a result of our cumulative loss position in recent years and the increased uncertainty relative to the timing of profitability in future periods, we continue to maintain a valuation allowance for our entire net deferred tax assets. The valuation allowance for deferred tax assets increased from $194.5 million at July 31, 2011, to $200.1 million at July 31, 2012. The increase in our valuation allowance compared to the prior year was primarily due to an increase in deferred tax assets associated with the taxable losses generated in various jurisdictions.
18
Table of Contents
We expect to record a full valuation allowance on future tax benefits until we can sustain an appropriate level of profitability. Until such time, we would not expect to recognize any significant tax benefits in our future results of operations. We will continue to monitor the recoverability of our deferred tax assets on a periodic basis. As a result of the merger with Credence in 2008 and Internal Revenue Service Code Section 382 guidance, the future utilization of the combined company’s net operating loss deductions will be significantly limited.
Valuation of Goodwill
In accordance with Topic 350, Intangibles – Goodwill and Other, to the FASB ASC (“ASC 350”), we are required to review goodwill by reporting unit for impairment at least annually or more often if there are indicators of impairment present. We have determined our entire business represents one reporting unit. Historically, we have performed our annual impairment analysis during the fourth quarter of each year. We evaluated the implied fair value based on our market capitalization of our one reporting unit as compared to the carrying value of the net assets assigned to our reporting unit as of April 30, 2013 and July 31, 2012. As of those dates, the implied fair value of the goodwill of our reporting unit exceeded our carrying value of our net assets and therefore no impairment existed.
Valuation of Identifiable Intangible Assets
Our identifiable intangible assets include existing technology, customer and distributor relationships and trade names. Our existing technology relates to patents, patent applications and know-how with respect to the technologies embedded in our currently marketed products.
In estimating the useful life of acquired assets, we considered paragraph 11 of ASC 350, which lists the pertinent factors to be considered when estimating the useful life of an intangible asset. These factors included a review of the expected use by the combined company of the assets acquired, the expected useful life of another asset (or group of assets) related to the acquired assets, legal, regulatory or other contractual provisions that may limit the useful life of an acquired asset or may enable the extension of the useful life of an acquired asset without substantial cost, the effects of obsolescence, demand, competition and other economic factors, and the level of maintenance expenditures required to obtain the expected future cash flows from the asset. We expect to amortize these intangible assets over estimated useful lives using a method that is based on estimated future cash flows as we believe this will approximate the pattern in which the economic benefits of the assets will be derived.
Impairment of Long-Lived Assets Other Than Goodwill
On an ongoing basis, management reviews the value and period of amortization or depreciation of long-lived assets. In accordance with Topic 360, Property, Plant and Equipment to the FASB ASC (“ASC 360”), we review whether impairment losses exist on long-lived assets other than goodwill when indicators of impairment are present. During this review, we assess future cash flows and reevaluate the significant assumptions used in determining the original cost of long-lived assets other than goodwill. Although the assumptions may vary, they generally include revenue growth, operating results, cash flows and other indicators of value. Management then determines whether there has been a permanent impairment of the value of long-lived assets based upon events or circumstances that have occurred since acquisition. The extent of the impairment amount recognized is based upon a determination of the impaired asset’s fair value compared to its carrying value. As of April 30, 2013 and July 31, 2012, there were no indicators that required us to conduct a recoverability test as of these dates.
Warranty
We provide standard warranty coverage on our systems, providing labor and parts necessary to repair the systems during the warranty period. We account for the estimated warranty cost as a charge to cost of sales when the revenue is recognized. The estimated warranty cost is based on historical product performance and field expenses. We use actual service hours and parts expense per system and apply the actual labor and overhead rates to estimate the warranty charge. The actual product performance and/or field expense profiles may differ, and in those cases we adjust the warranty accrual accordingly.
Trade Accounts Receivable and Allowance for Doubtful Accounts
Trade accounts receivable are recorded at the invoiced amount, do not bear interest, and typically have a contractual maturity of ninety days or less. A majority of our trade receivables are derived from sales to large multinational semiconductor manufacturers throughout the world. The volatility of the industries that we serve can cause certain of our customers to experience shortages of cash, which can impact their ability to make required payments. In order to monitor potential credit losses, we perform ongoing credit evaluations of our customers’ financial condition. We maintain an allowance for doubtful accounts for potential credit losses based upon our assessment of the expected collectability of all accounts receivable. We review the allowance for doubtful accounts periodically to assess the adequacy of the allowances. In any circumstances in which we are aware of a customer’s inability to meet its financial obligations, we provide an allowance, which is based on the age of the receivables, the circumstances surrounding the customer’s financial situation and our historical experience. If circumstances change, and the financial condition of our customers were adversely affected resulting in their inability to meet their financial obligations to us, we may need to record additional allowances. Account balances are charged off against the allowance when it is determined the receivable will not be recovered.
19
Table of Contents
Recent Accounting Pronouncements
There were no recent accounting pronouncements impacting our consolidated financial statements as of the three and nine months ending April 30, 2013.
Results of Operations
The following table sets forth for the periods indicated the principal items included in the Consolidated Statements of Operations in thousands, except for percent changes and per share data:
| Consolidated Statements of Operations | ||||||||||||||||||||||||
| Three Months Ended April 30, |
Nine Months Ended April 30, |
|||||||||||||||||||||||
| 2013 | 2012 | % Change |
2013 | 2012 | % Change |
|||||||||||||||||||
| Net product sales |
$ | 28,092 | $ | 21,753 | 29.1 | % | $ | 88,521 | $ | 60,761 | 42.4 | % | ||||||||||||
| Net service sales |
8,165 | 9,084 | (10.1 | ) | 25,940 | 27,910 | (7.1 | ) | ||||||||||||||||
|
|
|
|
|
|
|
|
|
|||||||||||||||||
| Net sales |
36,257 | 30,837 | 17.6 | 114,461 | 88,671 | 29.1 | ||||||||||||||||||
| Cost of sales |
17,558 | 15,024 | 16.9 | 53,699 | 43,941 | 22.2 | ||||||||||||||||||
|
|
|
|
|
|
|
|
|
|||||||||||||||||
| Gross profit |
18,699 | 15,813 | 18.3 | 60,762 | 44,730 | 35.8 | ||||||||||||||||||
| Engineering and product development expenses |
13,407 | 12,223 | 9.7 | 39,003 | 37,503 | 4.0 | ||||||||||||||||||
| Selling, general and administrative expenses |
9,213 | 8,829 | 4.3 | 28,401 | 26,496 | 7.2 | ||||||||||||||||||
| Amortization of purchased intangible assets |
395 | 791 | (50.1 | ) | 1,187 | 2,372 | (50.0 | ) | ||||||||||||||||
| Restructuring |
356 | 739 | (51.8 | ) | 655 | 926 | (29.3 | ) | ||||||||||||||||
|
|
|
|
|
|
|
|
|
|||||||||||||||||
| Loss from operations |
(4,672 | ) | (6,769 | ) | (31.0 | ) | (8,484 | ) | (22,567 | ) | (62.4 | ) | ||||||||||||
| Other income (expense): |
||||||||||||||||||||||||
| Interest expense |
(60 | ) | (47 | ) | 27.7 | (167 | ) | (129 | ) | 29.5 | ||||||||||||||
| Interest income |
200 | 266 | (24.8 | ) | 685 | 650 | 5.4 | |||||||||||||||||
| Other (expense) income, net |
(177 | ) | 15 | (1,280.0 | ) | (65 | ) | 366 | (117.8 | ) | ||||||||||||||
|
|
|
|
|
|
|
|
|
|||||||||||||||||
| Loss before provision for (benefit from) income taxes |
(4,709 | ) | (6,535 | ) | (27.9 | ) | (8,031 | ) | (21,680 | ) | (63.0 | ) | ||||||||||||
| Provision for (benefit from) income taxes |
35 | 93 | (62.4 | ) | (560 | ) | (456 | ) | 22.8 | |||||||||||||||
|
|
|
|
|
|
|
|
|
|||||||||||||||||
| Net loss |
$ | (4,744 | ) | $ | (6,628 | ) | (28.4 | )% | $ | (7,471 | ) | $ | (21,224 | ) | (64.8 | )% | ||||||||
|
|
|
|
|
|
|
|
|
|||||||||||||||||
| Net loss per share: |
||||||||||||||||||||||||
| Basic and diluted |
$ | (0.10 | ) | $ | (0.14 | ) | $ | (0.16 | ) | $ | (0.43 | ) | ||||||||||||
20
Table of Contents
The following table sets forth for the periods indicated the principal items included in the Consolidated Statements of Operations expressed in each case as a percentages of net sales:
| Percentage of Net Sales | ||||||||||||||||
| Three Months Ended April 30, |
Nine Months Ended April 30, |
|||||||||||||||
| 2013 | 2012 | 2013 | 2012 | |||||||||||||
| Net sales |
100.0 | % | 100.0 | % | 100.0 | % | 100.0 | % | ||||||||
| Cost of sales |
48.4 | 48.7 | 46.9 | 49.6 | ||||||||||||
|
|
|
|
|
|
|
|
|
|||||||||
| Gross profit |
51.6 | 51.3 | 53.1 | 50.4 | ||||||||||||
| Engineering and product development expenses |
37.0 | 39.6 | 34.1 | 42.3 | ||||||||||||
| Selling, general and administrative expenses |
25.4 | 28.6 | 24.8 | 29.9 | ||||||||||||
| Amortization of purchased intangible assets |
1.1 | 2.6 | 1.0 | 2.7 | ||||||||||||
| Restructuring |
1.0 | 2.4 | 0.6 | 1.0 | ||||||||||||
|
|
|
|
|
|
|
|
|
|||||||||
| Loss from operations |
(12.9 | ) | (21.9 | ) | (7.4 | ) | (25.5 | ) | ||||||||
| Other income (expense): |
||||||||||||||||
| Interest expense |
(0.2 | ) | (0.2 | ) | (0.1 | ) | (0.1 | ) | ||||||||
| Interest income |
0.6 | 0.9 | 0.6 | 0.7 | ||||||||||||
| Other income, net |
(0.5 | ) | (0.0 | ) | (0.1 | ) | 0.4 | |||||||||
|
|
|
|
|
|
|
|
|
|||||||||
| Loss before provision for (benefit from) income taxes |
(13.0 | ) | (21.2 | ) | (7.0 | ) | (24.5 | ) | ||||||||
| Provision for (benefit from) income taxes |
0.1 | 0.3 | (0.5 | ) | (0.5 | ) | ||||||||||
|
|
|
|
|
|
|
|
|
|||||||||
| Net loss |
(13.1 | )% | (21.5 | )% | (6.5 | )% | (24.0 | )% | ||||||||
|
|
|
|
|
|
|
|
|
|||||||||
Three and Nine Months ended April 30, 2013 Compared to the Three and Nine Months ended April 30, 2012
Net sales. The increase in product sales in the three and nine months ended April 30, 2013 as compared to the same periods in 2012 is driven primarily by higher demand for all product platforms within our portfolio.
The decrease in service revenue for the periods presented is primarily a result of increased reliability of our products, and older legacy products being decommissioned.
Geographically, sales to customers outside of the United States were 84.4% and 76.3% of net sales for the three months ended April 30, 2013 and 2012, respectively and 81.4% and 73.1% of net sales for the nine months ended April 30, 2013 and 2012, respectively. The overall increase in sales to customers outside the United States is primarily a result of higher demand in Taiwan, Malaysia, and the Philippines.
Cost of Sales. The increase in cost of sales for the periods shown, including warranty expense on product sales, is consistent with the increase in revenue for the comparable periods.
Engineering and product development expenses. The increase in engineering and product development expenses in the three and nine months ended April 30, 2013 as compared to the same period of the prior year is primarily due to an increase in consulting expenses related to next-generation instrumentation as well as an increase in payroll expense due to added headcount for the comparable periods.
Selling, general and administrative expenses. The increase in selling, general, and administrative expenses for the three and nine months ended April 30, 2013 as compared to April 30, 2012 is primarily due to commission expense associated with the increase in revenue for the same periods.
Amortization of purchased intangible assets. The overall decrease in amortization follows discounted cash flows of certain intangible assets, which were heavily weighted in the first three years after the merger with Credence in 2008. The underlying intangible assets relate to developed technology and maintenance agreements.
Restructuring. The restructuring expense recorded in the three months ended April 30, 2013 was related to changes in sublease assumptions on a previously restructured facility in which we recognized $0.4 million of expense. The remainder of the facility related expenses shown for the nine months ending April 30, 2013, relate to changes in our service organization, to move certain board repair functions and other roles from North American locations to subsidiary offices in Singapore and the Philippines, and relocation costs between our former and current facilities in the Philippines. We recognized $0.3 million of severance and other post employment
21
Table of Contents
obligations associated with these moves during our first fiscal quarter, of which approximately $0.1 million remains to be paid as of April 30, 2013. During the nine months ending April 30, 2012, we reduced headcount in our global field service and applications engineering groups. We also vacated two facilities in North America. The restructuring expense of $0.9 million recorded during this period includes severance and other post-employment benefits associated with these headcount reductions, as well as an early termination fee incurred upon vacating one of the facilities, and our remaining rent obligations under these leases.
Interest expense. Interest expense is from the accretion of the difference between the net present value and the estimated future value of our facility-related restructuring liability. The underlying lease associated with this liability ends in 2017.
Interest income. Interest income is higher in the nine months ended April 30, 2013 as compared to the nine months ended April 30, 2012, due to higher returns based on the allocation of marketable securities within our portfolio.
Other (expense) income, net. Other income, net primarily includes the net impact of changes in realized foreign exchange gains and losses. Other income, net for the nine months ended April 30, 2013 includes approximately $0.2 million realized loss from balance sheet revaluation of assets and liabilities denominated in Yen and Euro.
Provision for (benefit from) income taxes. The provision for (benefit from) income taxes recorded during the periods presented was primarily due to the release of reserves due to statute of limitation expirations and foreign tax on earnings generated in foreign jurisdictions.
As of April 30, 2013 and July 31, 2012, the total liability for unrecognized income tax benefits was $6.8 million and $8.0 million, respectively (of which $3.3 million and $4.4 million, if recognized, would impact the Company’s income tax rate).
We expect to maintain a full valuation allowance on United States deferred tax assets until we can sustain an appropriate level of profitability to ensure utilization of existing assets. Until such time, we would not expect to recognize any significant tax benefits in our results of operations.
Liquidity and Capital Resources
The following is a summary of significant items impacting our liquidity and capital resources for the nine months ending April 30, 2013 (in millions):
| Cash, cash equivalents and marketable securities at July 31, 2012 |
$ | 137.2 | ||
| Repurchases of common stock |
(9.2 | ) | ||
| Capital expenditures |
(2.2 | ) | ||
| Other cash sources, net |
1.0 | |||
|
|
|
|||
| Cash and cash equivalents and marketable securities at April 30, 2013 |
$ | 126.8 | ||
|
|
|
As of April 30, 2013, we had net working capital of $149.5 million, as compared to $163.6 million of net working capital at July 31, 2012. The decrease in cash and cash equivalents and marketable securities, and working capital, was primarily due to stock repurchases of $9.2 million as well as other changes in net working capital.
Accounts receivable trade, net, was $24.7 million at April 30, 2013, a decrease of 20.8% as compared to $31.2 million at July 31, 2012. This decrease is largely driven by the decrease in net sales for the same period. Net sales for the quarter ending April 30, 2013 was $36.2 million, a decrease of 16.8%, as compared to net sales of $43.5 million for the quarter ending July 31, 2012.
Inventories increased $2.2 million to $31.1 million at April 30, 2013 from $28.9 million at July 31, 2012, as a result of changes in product sales mix during the periods presented and an increase in consignment inventory placed at customers.
Capital expenditures totaled approximately $2.2 million for the nine months ended April 30, 2013, as compared to $2.5 million for the nine months ended April 30, 2012. Capital expenditures for the nine months ended April 30, 2013 and April 30, 2012 were composed primarily of capital related to certain engineering projects and tester spare parts to support a larger installed base of test equipment.
We had $2.9 million in net cash provided by operating activities for the nine months ended April 30, 2013, as compared to net cash used in operating activities of $14.5 million for the same period of the prior year. The net cash provided by operating activities for the nine months ended April 30, 2013 was primarily related to our net loss of $7.5 million, adjusted for non-cash items including depreciation and amortization and stock based compensation of approximately $9.9 million, offset by a decrease in working capital of
22
Table of Contents
$0.5 million. The net cash used in operating activities for the nine months ended April 30, 2012 was primarily related to our net loss of $21.2 million, and an increase in working capital of $7.5 million, offset by non-cash items, principally depreciation and amortization and stock-based compensation, of approximately $14.2 million.
We had $5.8 million in net cash provided by investing activities for the nine months ended April 30, 2013 as compared to net cash used in investing activities of $66.1 million for the nine months ended April 30, 2012. The net cash provided by investing activities for the nine months ended April 30, 2013 was primarily related to $53.4 million of proceeds from sales and maturities of available-for-sale securities, $4.9 million in proceeds from sales of held-to-maturity securities, offset by $45.5 million of purchases of available-for-sale securities, $4.8 million in purchases of held-to-maturity securities, and $2.2 million of purchases of property and equipment. The net cash used in investing activities for the nine months ended April 30, 2012 was primarily related to $112.2 million of purchases of available-for-sale securities, $10.7 million in purchases of held-to-maturity securities, and $2.5 million of purchases of property and equipment offset by $53.5 million of proceeds from sales and maturities of available-for-sale securities and $5.8 million of proceeds from sales and maturities of held-to-maturity securities.
We had $9.8 million in net cash used in financing activities for the nine months ended April 30, 2013 as compared to net cash used in financing activities of $6.8 million for the nine months ended April 30, 2012. The net cash used in financing activities for the nine months ended April 30, 2013 was primarily related to stock repurchases of $9.2 million and the remainder was related to $1.0 million of payments of tax withholdings for vested restricted stock units, net of proceeds from stock option exercises offset by $0.4 million in proceeds from shares issued from the employee stock purchase plan. The net cash used in financing activities for the nine months ended April 30, 2012 was primarily related to the repurchase of our common stock of $6.1 million and payments of tax withholdings for vested restricted stock units, net of proceeds from stock option exercises of $1.1 million, offset by proceeds from shares issued from the employee stock purchase plan of $0.4 million.
Commitments and Contingencies
Our major outstanding contractual obligations are related to our rental properties, other operating leases, inventory purchase commitments, and severance payments.
In the ordinary course of business, we agree from time to time to indemnify certain customers against certain third party claims for property damage, bodily injury, personal injury or intellectual property infringement arising from the operation or use of our products. Also, from time to time in agreements with suppliers, licensors and other business partners, we agree to indemnify these partners against certain liabilities arising out of the sale or use of our products. The maximum potential amount of future payments we could be required to make under these indemnification obligations is theoretically unlimited; however, we have general and umbrella insurance policies that enable it to recover a portion of any amounts paid and many of its agreements contain a limit on the maximum amount, as well as limits on the types of damages recoverable. Based on our experience with such indemnification claims, we believe the estimated fair value of these obligations is minimal. Accordingly, we have no liabilities recorded for these agreements as of April 30, 2013 or July 31, 2012.
We are a defendant in a litigation matter incidental to the business that is related to customer expectations of test system performance for product that was shipped in 2006 by Credence. We do not believe the plaintiff’s claims have merit and we are vigorously defending our position. An estimate of any potential loss cannot be made; we do not believe a loss is probable, and accordingly we have not accrued any amounts related to this matter.
Subject to certain limitations, we indemnify our current and former officers and directors for liability or costs they may incur upon certain events or occurrences encountered in the course of performing their duties to us. Although the maximum potential amount of future payments we could be required to make under these agreements is theoretically unlimited, as there were no known or pending claims, we have not accrued a liability for these agreements as of April 30, 2013 or July 31, 2012.
The aggregate outstanding amount of our contractual obligations was $38.7 million as of April 30, 2013. These obligations and commitments represent maximum payments based on current operating forecasts. Certain of the commitments could be reduced if changes to our operating forecasts occur in the future.
23
Table of Contents
The following summarizes our contractual obligations as of April 30, 2013 and the effect such obligations are expected to have on our liquidity and cash flow in future periods:
| Total | 2013 | 2014-2015 | 2016-2017 | Thereafter | ||||||||||||||||
| (in thousands) | ||||||||||||||||||||
| Contractual Obligations: |
||||||||||||||||||||
| Operating leases |
$ | 23,028 | $ | 1,399 | $ | 10,172 | $ | 6,794 | $ | 4,663 | ||||||||||
| Inventory commitments |
15,543 | 15,543 | — | — | — | |||||||||||||||
| Severance |
122 | 122 | — | — | — | |||||||||||||||
|
|
|
|
|
|
|
|
|
|
|
|||||||||||
| Total Contractual Obligations |
$ | 38,693 | $ | 17,064 | $ | 10,172 | $ | 6,794 | $ | 4,663 | ||||||||||
|
|
|
|
|
|
|
|
|
|
|
|||||||||||
Off-Balance Sheet Arrangements
As of April 30, 2013 we did not have any off-balance sheet arrangements.
| Item 3. | Quantitative and Qualitative Disclosures about Market Risk |
There has been no material change in our Market Risk exposure since the filing of the 2012 Annual Report on Form 10-K.
| Item 4. | Controls and Procedures |
Evaluation of Disclosure Controls and Procedures. Our management, with the participation of our Chief Executive Officer and Chief Financial Officer, evaluated the effectiveness of our disclosure controls and procedures as of January 31, 2013. The term “disclosure controls and procedures,” as defined in Rules 13a-15(e) and 15d-15(e)) under the Exchange Act, means controls and other procedures of a company that are designed to ensure that information required to be disclosed by a company in the reports that it files or submits under the Exchange Act is recorded, processed, summarized and reported, within the time period specified in the SEC’s rules and forms. Disclosure controls and procedures include, without limitation, controls and procedures designed to ensure that information required to be disclosed by a company in the reports that it files or submits under the Exchange Act is accumulated and communicated to our management, including its principal executive and principal financial officers, as appropriate to allow timely decisions regarding required disclosure. Management recognizes that any controls and procedures, no matter how well designed and operated, can provide only reasonable assurance of achieving their objectives and management necessarily applies its judgment in evaluating the cost-benefit relationship of possible controls and procedures. Based on the evaluation of our disclosure controls and procedures as of April 30, 2013, our Chief Executive Officer and Chief Financial Officer concluded that, as of such date, our disclosure controls and procedures were effective at the reasonable assurance levels.
Changes in Internal Controls. There was no change in our internal control over financial reporting (as defined in Rules 13a-15(f) and 15d-15(f)) under the Exchange Act) during the fiscal quarter ended April 30, 2013 that has materially affected, or is reasonably likely to materially affect our internal control over financial reporting.
Limitations on the Effectiveness of Controls
Our management, including our Chief Executive Officer and Chief Financial Officer, does not expect that our disclosure controls and procedures or our internal controls can prevent all error and all fraud. A control system, no matter how well conceived and operated, can provide only reasonable, not absolute, assurance that the objectives of the control system are met. Further, the design of a control system must reflect the fact that there are resource constraints, and the benefits of controls must be considered relative to their costs. The inherent limitations in all control systems include the realities that judgments in decision-making can be faulty and that breakdowns can occur because of simple error or mistake. Additionally, controls can be circumvented by the individual acts of some persons or by collusion of two or more people. Because of the inherent limitations in a cost-effective control system, misstatements due to error or fraud may occur and not be detected.
| Item 1. | Legal Proceedings |
From time to time we are party to legal proceedings in the course of our business. We do not, however, expect such legal proceedings to have a material adverse effect on our business, financial condition or results of operations.
24
Table of Contents
| Item 1A. | Risk Factors |
There have been no material changes to the risk factors previously disclosed in our Annual Report that was filed on Form 10-K for the year ended July 31, 2012. For a discussion of such risks refer to Item 1A, Risk Factors, contained in our 2012 Annual Report on Form 10-K as filed with the SEC on October 15, 2012.
| Item 2. | Unregistered Sales of Equity Securities and Use of Proceeds |
The following table provides information regarding repurchases of common stock made by us since inception of our board-authorized stock repurchase program.
| Period |
Total Number of Shares Purchased |
Average Price Paid per Share |
Total Number of Shares Purchased as Part of Publicly Announced Plans or Programs (1) |
Remaining Dollar Value that May Yet Be Purchased Under the Plans or Programs (excluding commissions) |
||||||||||||
| Inception of program |
— | $ | — | — | $ | 25,000,000 | ||||||||||
| Fiscal year ended 7/31/2012 |
1,652,394 | $ | 5.84 | 1,652,394 | $ | 15,474,033 | ||||||||||
| Quarter ended 10/31/2012 |
1,518,043 | $ | 5.62 | 1,518,043 | $ | 6,924,667 | ||||||||||
| Quarter ended 1/31/2013 |
124,229 | $ | 5.37 | 124,229 | $ | 6,265,866 | ||||||||||
| Quarter ended 4/30/2013 |
— | $ | — | — | $ | 6,265,866 | ||||||||||
|
|
|
|
|
|||||||||||||
| Total |
3,294,666 | $ | 5.61 | 3,294,666 | ||||||||||||
|
|
|
|
|
|||||||||||||
| (1) | On September 15, 2011, the board of directors authorized a stock repurchase program, pursuant to which we are authorized to repurchase up to $25 million of our common stock from time to time in open market transactions. The repurchase program may be suspended or discontinued at any time and has no expiration date. |
There were no repurchases of common stock in the three months ending April 30, 2013.
| Item 4. | Mine Safety Disclosures |
Not applicable.
| Item 6. | Exhibits |
The exhibits filed as part of this Quarterly Report on Form 10-Q are set forth on the Exhibit Index immediately preceding such exhibits, and are incorporated herein by reference.
25
Table of Contents
Pursuant to the requirements of the Securities Exchange Act of 1934, the registrant has duly caused this report to be signed on its behalf by the undersigned thereunto duly authorized.
| LTX-Credence Corporation | ||||||
| Date: June 10, 2013 | By: | /S/ MARK J. GALLENBERGER | ||||
| Mark J. Gallenberger | ||||||
| Chief Financial Officer and Treasurer | ||||||
| (Principal Financial Officer) | ||||||
26
Table of Contents
| Exhibit Number |
Description | |
| 10.1 | Second Amended and Restated 2004 Employee Stock Purchase Plan (Incorporated by reference as Exhibit 99.1 to the Registrant’s Form S-8 Registration Statement filed on January 17, 2013) | |
| 31.1 * | Certification of the Chief Executive Officer pursuant to Rule 13a-14(a) of the Exchange Act | |
| 31.2 * | Certification of the Chief Financial Officer pursuant to Rule 13a-14(a) of the Exchange Act | |
| 32 * | Certification of the Chief Executive Officer and Chief Financial Officer pursuant to Rule 13a-14(b) of the Exchange Act and 18 U.S.C. Section 1350 | |
| 101.INS** | XBRL Instance Document | |
| 101.SCH** | XBRL Taxonomy Extension Schema Document | |
| 101.CAL** | XBRL Taxonomy Extension Calculation Linkbase Document | |
| 101.DEF** | XBRL Taxonomy Extension Definition Linkbase | |
| 101.LAB** | XBRL Taxonomy Extension Label Linkbase Document | |
| 101.PRE** | XBRL Taxonomy Extension Presentation Linkbase Document | |
| * | Filed herewith |
| ** | Pursuant to Rule 406T of Regulation S-T, the Interactive Data Files on Exhibit 101 hereto are deemed not filed or part of a registration statement or prospectus for purposes of Sections 11 or 12 of the Securities Act of 1933, as amended, are deemed not filed for purposes of Section 18 of the Securities and Exchange Act of 1934, as amended, and otherwise are not subject to liability under those sections. |
27