Attached files
| file | filename |
|---|---|
| 8-K - 8-K - Mastech Digital, Inc. | d550576d8k.htm |
 Q2 2013
Industry & MHH Overview
CONFIDENTIAL
Exhibit 99.1 |
 Copyright
©2010 Mastech, Inc. All Rights Reserved. mastech.com 2
Safe Harbor...
Certain statements contained in this presentation are forward-looking statements
based on management’s expectations, estimates, projections and assumptions.
Words such as “expects,” “anticipates,” “plans,”
“believes,” “scheduled,” “estimates” and variations of
these words and similar expressions are intended to identify forward-looking
statements, which include but are not limited to projections of revenues,
earnings, and cash flow. These statements are based on information currently
available to the Company and it assumes no obligation to update the forward-looking
statements as circumstances change. These statements are not guarantees of future
performance and involve certain risks and uncertainties, which are difficult to predict.
Therefore, actual future results and trends may differ materially from what is forecast
in forward-looking statements due to a variety of factors, including, without
limitation, the level of market demand for its services, the highly competitive market
for the types of services offered by the company, the impact of competitive factors on
profit margins, market conditions that could cause the Company’s customers to
reduce their spending for its services, and the company’s ability to create,
acquire and build new lines of business, to attract and retain qualified personnel,
reduce costs and conserve cash, and other risks that are described in more detail in
the company’s filings with the Securities and Exchange Commission including its
Form 10-K for the year ended December 31, 2012. |
 3
Mastech: A National Staffing Business
e-Business Solutions; Service Oriented Architecture & Web Services
Business Intelligence & Data Warehousing
ERP / CRM Implementation
Surgical Nursing & Physical / Occupational Therapy
700
full-time IT
Consultants in the USA
100
FTE
Healthcare
Professionals
200 Staff Employees (Sales / Recruitment / Support / Management)
70% of Staff India-Based
Service Offerings
Employees/
Consultants
26 years
of Staffing Industry Experience (former iGATE Corporation
subsidiary)
Spun-off from iGATE in October 2008; certified MBE
Trade on NYSE / MKT: “MHH” Only
Public IT Staffing Company with “Centralized “
Business Model
History
National provider of
Information Technology and Specialized
Healthcare
Staffing
Services
100% of Revenues are derived from Staffing Services
Business
Description
Integrity,
Accountability,
Quality,
Dignity
&
Respect
Core Values |
 MHH
– Shareholder Performance
MHH 2013 YTD:
•
40% Increase To-Date
•
12 Month Trailing P/E = 9.80
Pittsburgh Business Times, Largest Public Companies Jan 2013
Finance.Yahoo.com
/
MHH
–
June
4,
2013 |
   IT Employment
Hits Another All-time High in April! •
215K IT jobs created in the US in the past 12 months; 350K in the past 24 months
•
5.1% Y-O-Y Growth... 3X the Growth rate of the general workforce
•
17
th
consecutive month of growth; former all time high eclipsed in Q1 2012
|
 IT Staffing
Industry Forecasted to Grow 8% |
 H/C Staffing
Industry Forecasted to Grow 9% |
 Bottom
Line....with USA GDP Forecasted @ 2%.... And Q1-2013 at 2.4%....
|
 Two IT
Staffing Industry Business Models... •
Geographic
decentralized
control & leadership;
relationship sales
model
•
Gross Margin: 24-30%
•
S, G & A
(expenses)
: 20-25%
•
Operating Margins: 4-8%
Branch
Services
Model
•
Customers
drive Geography; majority of
the organization centralized;
Low Cost
Location
opportunity;
•
Gross Margin: 18-21%
•
S, G & A
(expenses)
: 13-17%
•
Operating Margins: 4-8%
Centralized
Model
“prove it & move it”;
;
Value
Pricing |
 Professional
Procurement Services Enter the Fray... VMS
(vendor management system)
•
9 yr penetration–All Buyers: 8%
to 60% •
9
yr
penetration-
Core
Buyers:
42%
to
73%
•
Technology
/ Telecomm Industry: 75%
in use;
21% planned use (96%)
•
All Large Scale (Fortune 1000): 75% or
more in Use and nearly all planned use. |
 Bottom
Line... Professional Procurement Processes & Tools have changed The Staffing
Industry... •
Create Transparency & Level the Playing Field...
•
Comparisons become easier
•
Price & Delivery Matters
•
Relationships less important
•
Exert Pressure on Gross Margins
•
Low Cost Players will be advantaged
•
Forces Thinking to Move from Gross Margin to Operating Profit
•
MHH Loves ‘em...and the Branch Guys Don’t...
•
MHH
Operating
Profit
Increase....
Driven
by
Top
Line
Growth
and
Leverage
on the Cost Structure
•
2012 over 2011: 89%; 2011 over 2010: 75%
•
Here to Stay ...
•
Argue Penetration Levels & Timing |
 MHH exceeds
market growth rates 2010-2012 Strong Balance Sheet / Access to Capital
Returned $9.2 million to Shareholders in 2012
Q1-2012:
Dutch Auction Tender Offer within Share Buyback Program Limits
Q4-2012:
$2 / Share Special Dividend
Revenue –
19% CAGR
EPS –
89% CAGR
Consultants On Billing –
18% CAGR |
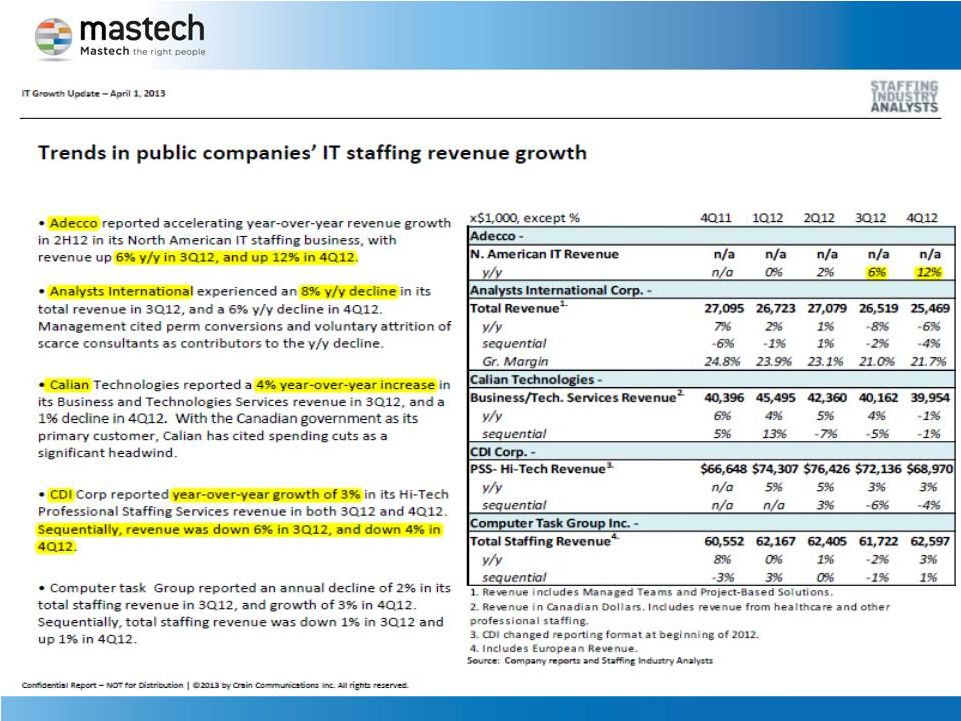
 Industry
Trends & Outlook
What Differentiates
Mastech
MHH: A Catalyst for Future Growth
Centralized Business Model; Scalable
Cost Structure; Low-
Cost
Recruitment Engine
Strong Brand Recognition with both
U.S. Citizens and H1
B Visa
Professionals
Established Client-
Base of High-
Volume Consumers of Staffing
Services
Favorable Pricing / Value Proposition
for Clients
Motivated and Capable Management
Team
-
U.S. Job Market Recovery Positive for
Industry
Fundamental Shift Towards Greater
Utilization of Staffing Services
Large Consumers of Staffing Services
Employing VMS / MSP Model
Client Focus more about Consultant
Quality, Speed to Market and Value
Pricing |
 Bottom
Line....Macro Growing; Staffing Industry Changes Favor Centralized
Model; MHH Performing |
 MHH Goals
(not Guidance) •
Organically Grow Revenues at +1.5X Industry Average. |
 MHH Goals
(not Guidance) •
Organically Grow Revenues at +1.5X Industry Average.
•
Maintain Gross Margins @ 19%. |
 MHH Goals
(not Guidance) •
Organically Grow Revenues at +1.5X Industry Average.
•
Maintain Gross Margins @ 19%.
•
Drive Operating Expenses to 13-14% of Revenue. |
 MHH Goals
(not Guidance) •
Organically Grow Revenues at +1.5X Industry Average.
•
Maintain Gross Margins @ 19%.
•
Drive Operating Expenses to 13-14% of Revenue..
•
Deliver Operating Margins of 6%+ of Revenue. |
 MHH Goals
(not Guidance) •
Organically Grow Revenues at +1.5X Industry Average.
•
Maintain Gross Margins @ 19%.
•
Drive Operating Expenses to 13-14% of Revenue.
•
Deliver Operating Margins of +6% of Revenue.
•
Continue to Return Capital to our Shareholders. |
 Q2
2013 Industry & MHH Overview
CONFIDENTIAL |
 MHH ... 1.5X
industry Growth |
 MHH ... 1.5X
industry Growth |
 Professional
Procurement Services Enter the Fray... (MSP / VMS)
MSP (managed service provider program) •
5 yr penetration–All Buyers: 34% to 54%
•
5
yr
penetration-
Core
Buyers:
48%
to
58%
•
Technology
/
Telecomm
Industry:
62%
in
use; 7% planned use (69%)
•
All Large Scale (Fortune 1000): 60% in Use an
additional 10-15% planned use. |