Attached files
| file | filename |
|---|---|
| 8-K - 8-K - DUKE REALTY CORP | d549584d8k.htm |
 REIT
WEEK: 2013 NAREIT Investor Forum June 5-6, 2013
Exhibit 99.1 |
 2013 Duke Realty Corporation
2
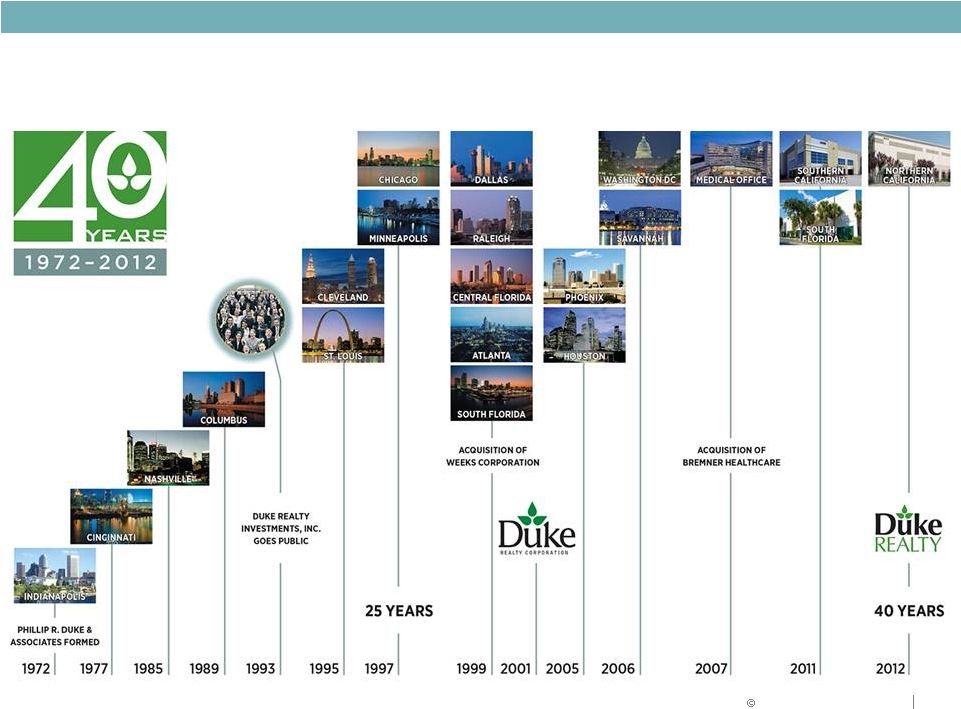
40 Years Timeline
RELIABLE. ANSWERS. |
 2013 Duke Realty Corporation
3
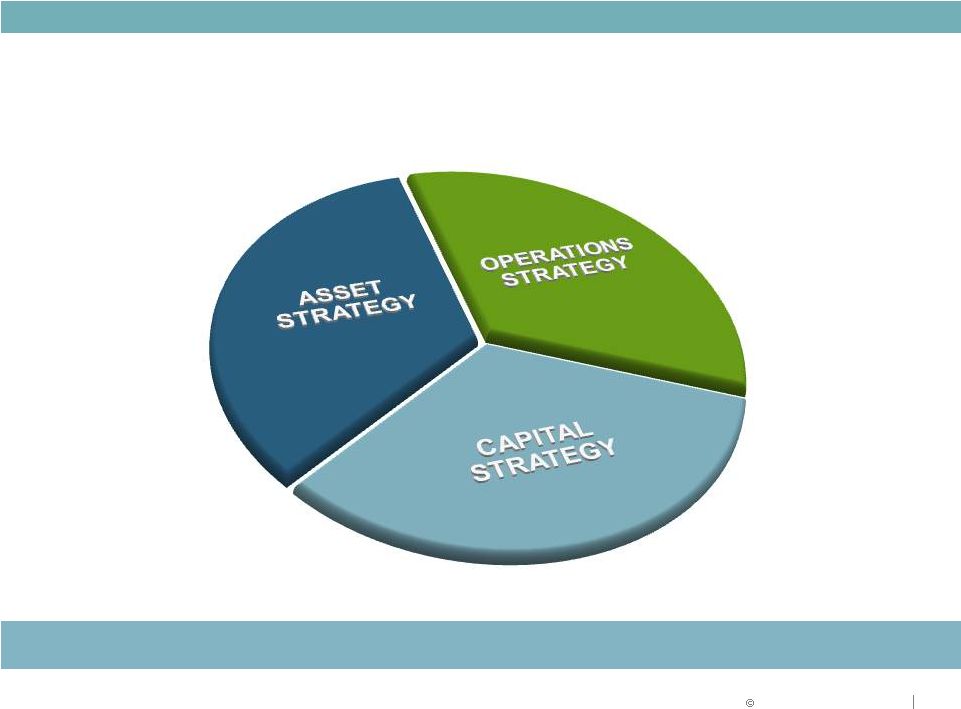
Three-Pronged Strategy for Success
Strategies for delivering shareholder value
RELIABLE. ANSWERS. |
 RELIABLE. ANSWERS.
2013 Duke Realty Corporation
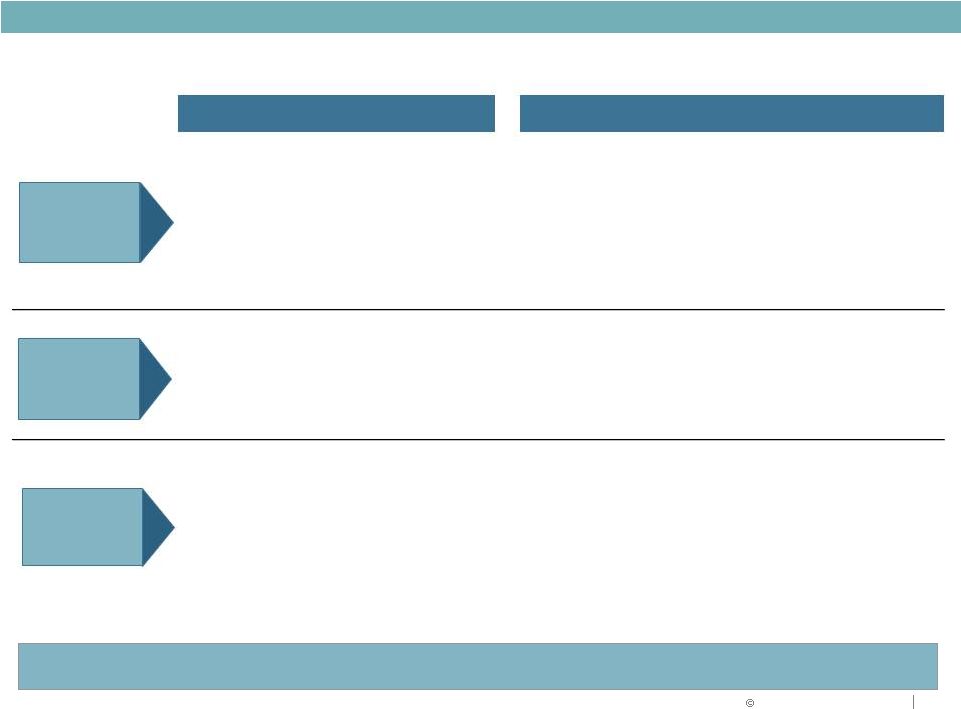
Strategic Focus
2013 Goals and Objectives
2013 Update
•
Lease-up portfolio, manage cap ex; continue
positive same property income growth
•
Focus on rent growth to continue to drive same
property NOI growth
•
Development starts of $400 to $500 million focus
on industrial and medical office
•
Total portfolio occupancy as of quarter end 91.8%; industrial portfolio
at 93.1%; medical office at 92.4%
•
Approximately 6.4 million square feet of leases completed in Q1
•
2.6% same property NOI growth
•
$139MM development starts. Two bulk industrial projects 74%
leased (at 8.6% yield), four 100% leased medical office (7.9% yield)
and one 100% leased office (7.7% yield)
•
Continue strong momentum from 2012 on
repositioning of portfolio
•
Pursue acquisitions of industrial assets
•
Continue pruning suburban office primarily in
Midwest
•
Closed on $30MM of acquisitions during the quarter, weighted 26%
industrial and 74% medical; In May, closed on $312MM acquisition
of eight, class A bulk industrial facilities (“USAA”)
•
$223MM in dispositions of primarily suburban office assets in Q1
•
Disposed of Pembroke Pines retail center in May for $188 million
•
Opportunistically access capital markets . . .
push out debt maturity schedule further
•
Continue improving coverage ratios
•
Maintain minimal balance on line of credit
•
Debt to EBITDA @ 7.25x; Fixed charge ratio of 1.86x, improved from
prior year
•
Issued $572MM of equity at a $14.25 share price
•
Issued $250MM of senior notes at a 3.625% coupon maturing 2023
•
Redeemed $178MM of 8.375% Series O Preferred shares
•
Zero credit facility balance and $307MM of cash at quarter end
•
Closed on a $250MM 5 year term loan at LIBOR+1.35% in May
4
Solid start and executing across all three aspects of our strategy
Operations
Strategy
Asset
Strategy
Asset
Strategy
Capital
Strategy |
 2013 Duke Realty Corporation
OPERATIONS STRATEGY
5 |
 2013 Duke Realty Corporation
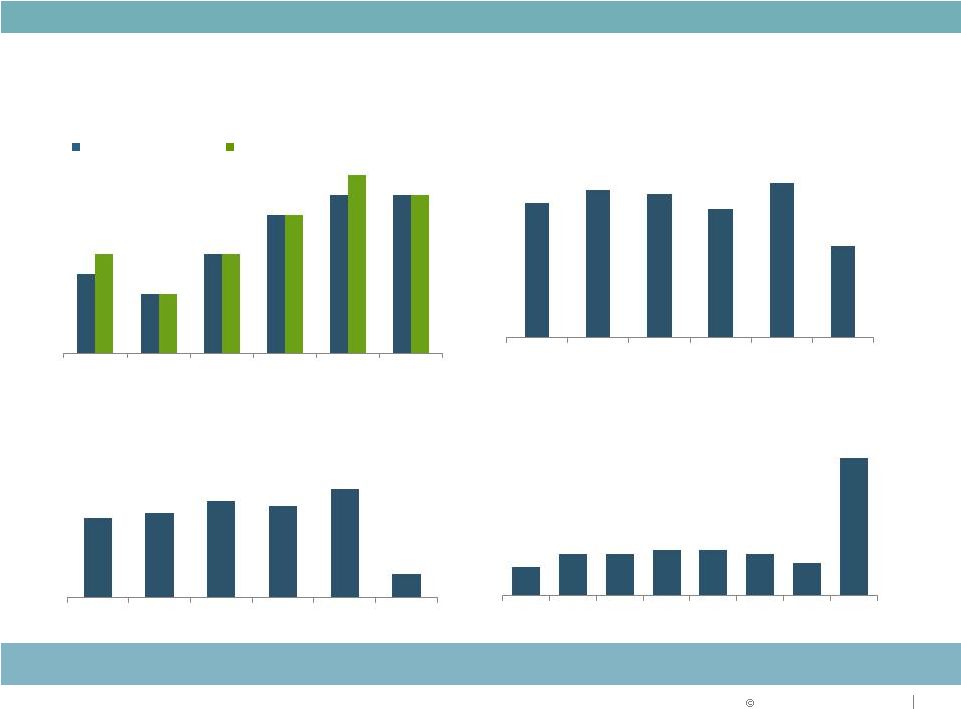
Consistent Operating Performance
Stabilized Occupancy (%)
Strong
historical
occupancy
–
fundamentals
solid
Lease Renewals (%)
Strong lease renewal percentages
Total occupancy
In-service occupancy
Leasing Activity
New
Leases
and
Renewals
–
Consistent
Execution
(in
millions
of
square feet)
Lease Maturity Schedule
Lease maturities are well balanced with no one year accounting for
more than 11%
88%
89%
87%
91%
91%
89%
89%
87%
6
OPERATIONS STRATEGY
93%
72%
79%
77%
69%
83%
21.4
22.7
25.9
24.5
29.3
92%
92%
2008
2009
2010
2011
2012
Q1 2013
92%
49%
2008
2009
2010
2011
2012
Q1 2013
6.4
2008
2009
2010
2011
2012
Q1 2013
7%
10%
10%
11%
11%
10%
8%
33%
2013
2014
2015
2016
2017
2018
2019
2020+
Demonstrated ability to maintain consistency through economic cycles
|
 2013 Duke Realty Corporation
1.
2.
3.
Notes
Sources SNL and company filings
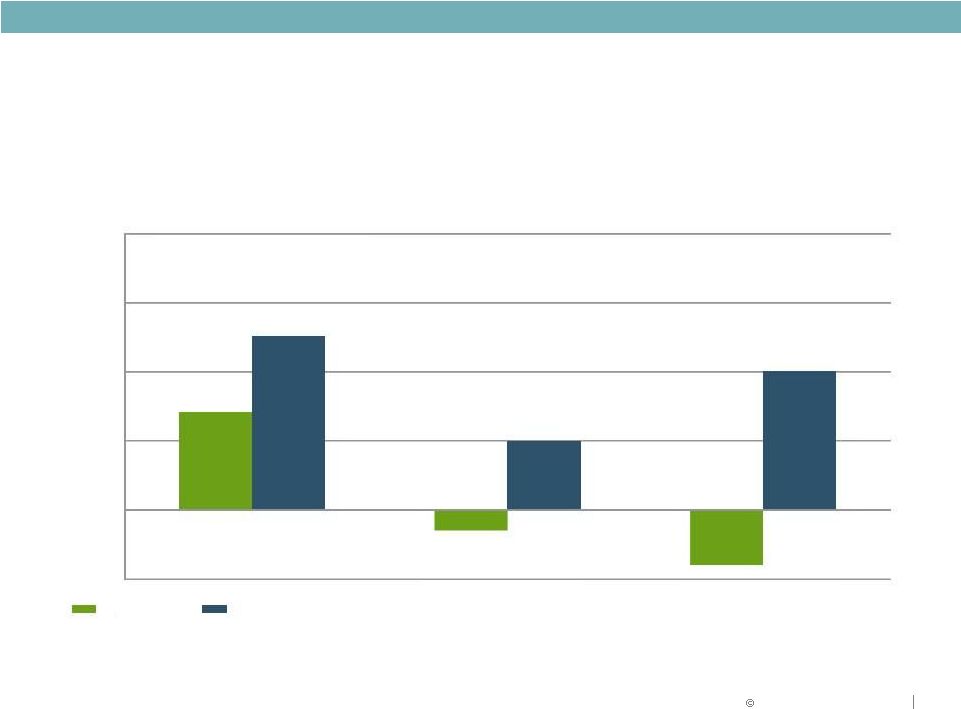
Duke Realty
Suburban Office Peers
(2)
Industrial Peers (3)
Consistent NOI Growth Outperformance
Relative Performance vs. Peers
OPERATIONS STRATEGY
7
1.4%
(0.3%)
(0.8%)
2.5%
1.0%
2.0%
(1.0%)
0.0%
1.0%
2.0%
3.0%
4.0%
5-Year Avg.
1-Year Avg.
Annual Same-Store
NOI Growth
(1)
Based on simple average of calendar year-over-year annual same-property cash NOI
growth. Five year analysis measures 2008 - 2012 Suburban Office Peers include
BDN, CLI, HIW, OFC and LRY; weighted by historical market cap Industrial includes DCT, EGP, FR,
AMB and PLD; weighted by historical market cap |
 2013 Duke Realty Corporation
8
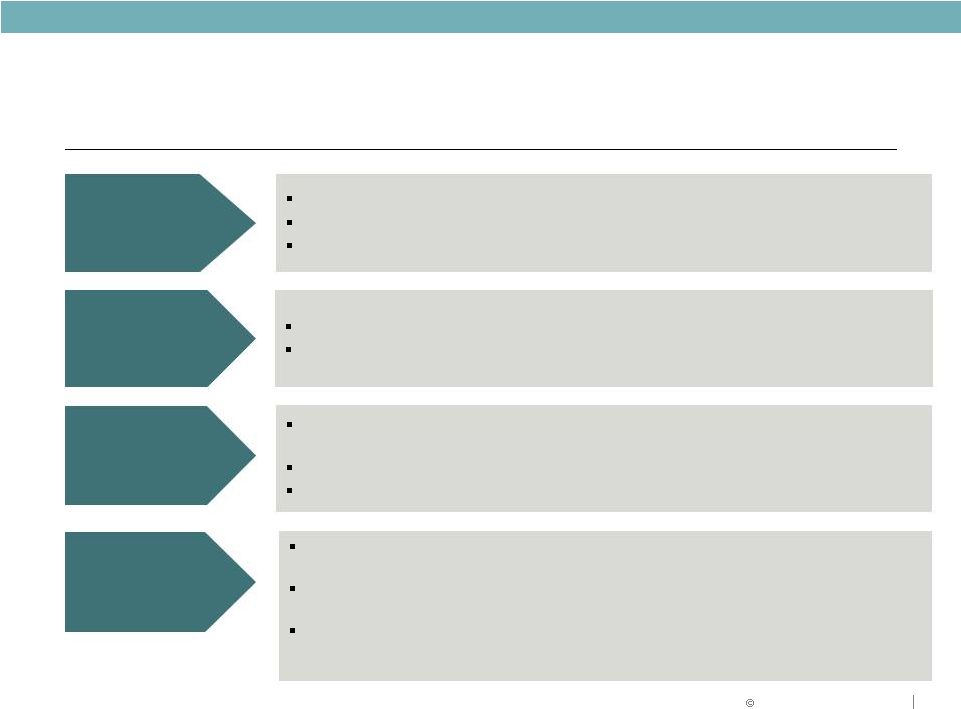
Positioned for NAV Growth
KEY NAV GROWTH DRIVERS
Lease-Up
existing
vacancy
In-service Portfolio occupancy of 92.1%
Strong leasing pipeline
Demonstrated track record of 65-85% tenant renewal rate over past 6 full
years Accretive
Development
Current development pipeline of $621 million (3.4MM SF of industrial, 1.0MM SF of
medical office and 0.7MM SF of suburban office, currently 83%
pre-leased) 2013 estimated development starts of $400 to $500
million High quality land bank to facilitate future development
Continued Asset
Repositioning
Acquisitions of primarily core and value-add bulk industrial, located in
strategic distribution markets, leased to high quality tenants with
contractual lease escalators Dispositions focused on more capital intensive
suburban office mainly in the Midwest, retail, and select older medical and
industrial/flex assets Asset recycling has been AFFO neutral to positive,
while extending average lease duration,
lowering
cash
flow
volatility,
improving
tenant
credit
and
improving
overall
quality of portfolio
Increase Rents
\
Reduced
Capex
Rent roll downs burning off and positive same property NOI performance
Forecasts
of
industrial
market
wide
average
annual
rent
growth
of
2.7%
*
from
2014-17
* Rent forecasts a composite of PPR and Green Street
OPERATIONS STRATEGY |
 RELIABLE. ANSWERS.
2013 Duke Realty Corporation
Development Strategic Advantages
Development platform creates value
9
Duke Realty 40 years of experience in development
Recognized as one of the leading commercial developers nationally
Land bank in strategic locations that can support approximately 55
million square feet of development is a significant value advantage
Capital deployed in development can generate 75 to 150 basis
points of premium yield over comparable acquisition yields
Risk management policies in place to govern maximum
development pipeline size and speculative development starts
|
 2013 Duke Realty Corporation
10
Land and Development Capabilities
OPERATIONS STRATEGY
$549
million
HELD FOR
DEVELOPMENT
Attractive positions contribute to future development and value
•
Strategically located in key distribution markets and
vibrant commercial corridors
•
Cost feasibility and development strategies
completed for all land investments; Land fully zoned
for intended use
•
Land bank can support approximately 55 million
square feet of future development
o
46.6 million square feet of future industrial
development in key distribution markets
o
8.0 million square feet of future office development
land primarily for build-to-suit
•
Monetizing land bank supports strong development
yield premiums and accelerates further
improvement in credit profile
•
Sales of $76 million since 2009 have resulted in an
approximate 5% gain over impaired basis
Office 36%
Industrial
64% |
 RELIABLE. ANSWERS.
2013 Duke Realty Corporation
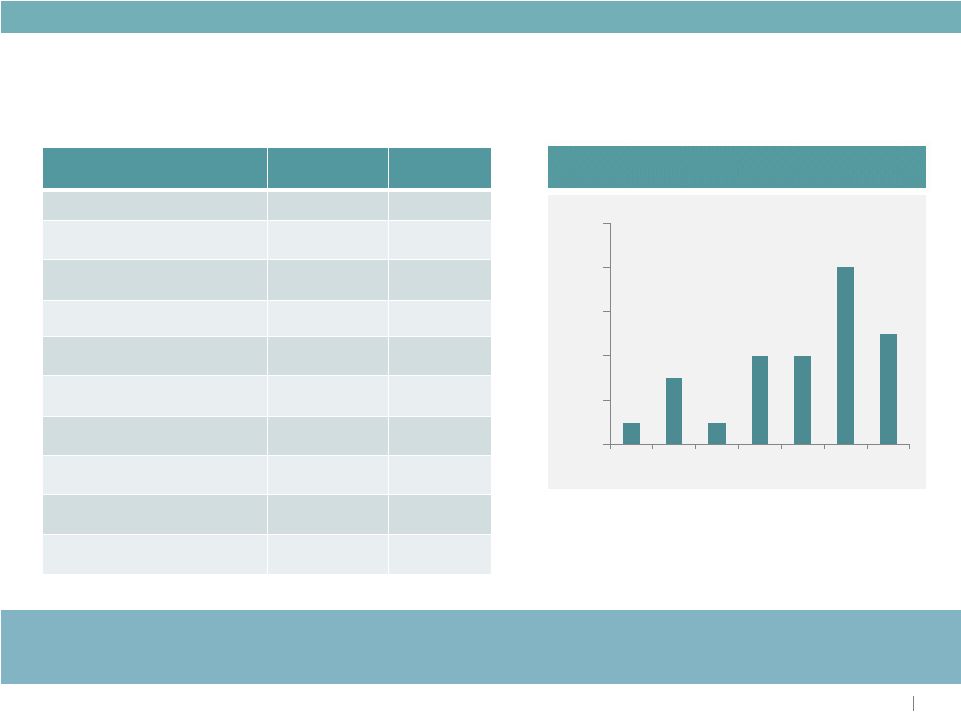
11
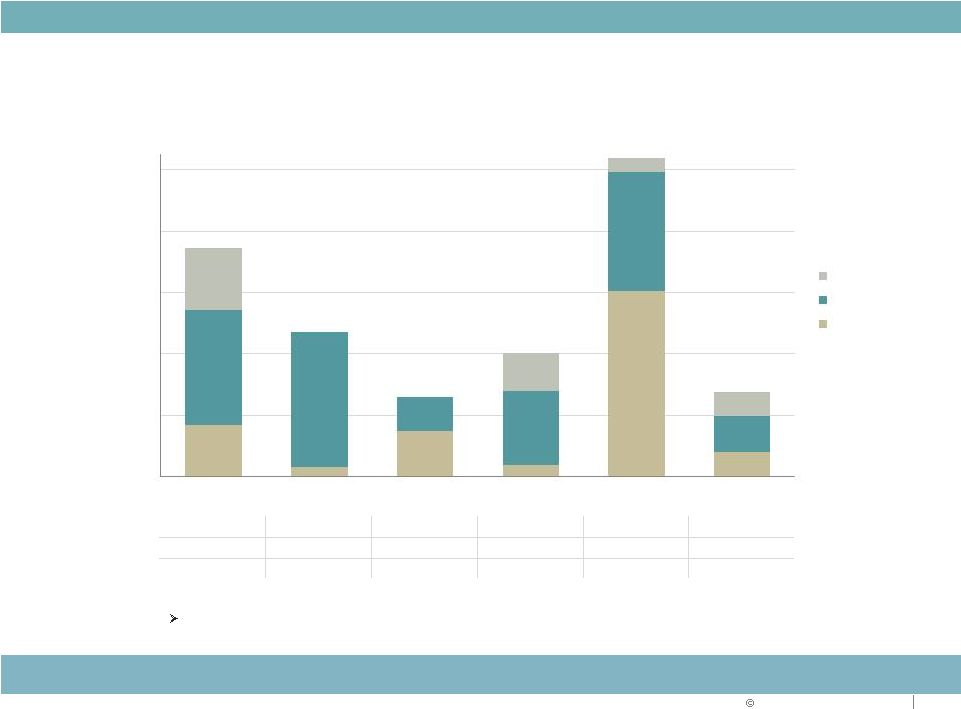
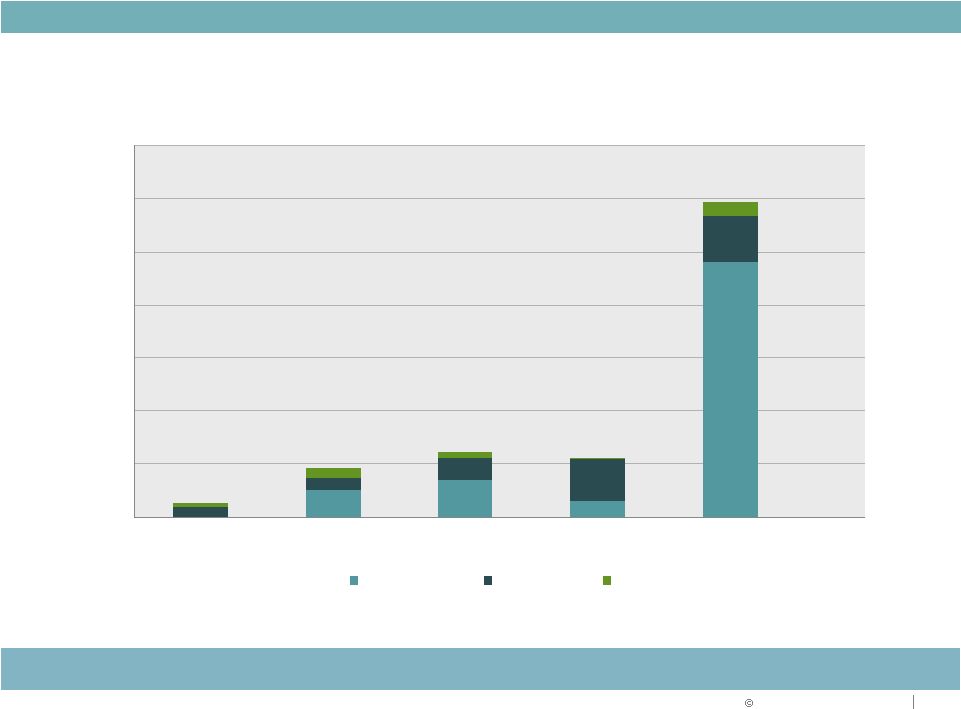
Historical Development Starts
National Development Platform Providing Solid Growth
Stabilized
Costs in
$millions
Original Pre-lease %:
39%
87%
88%
97%
77%
81%
Current Lease %:
91%
90%
99%
97%
80%
81%
Stabilized Yield:
8.2%
8.5%
8.9%
7.5%
7.3%
8.0%
$373
$236
$130
$202
$519
$138
Current development pipeline of 5.1 million square feet, $621 million in
stabilized costs, 83% pre-leased at a weighted average stabilized yield
of 7.5% 84
16
74
19
302
40
188
220
56
120
194
59
101
63
23
39
0
100
200
300
400
500
2008
2009
2010
2011
2012
2013 YTD
Office
Medical
Industrial |
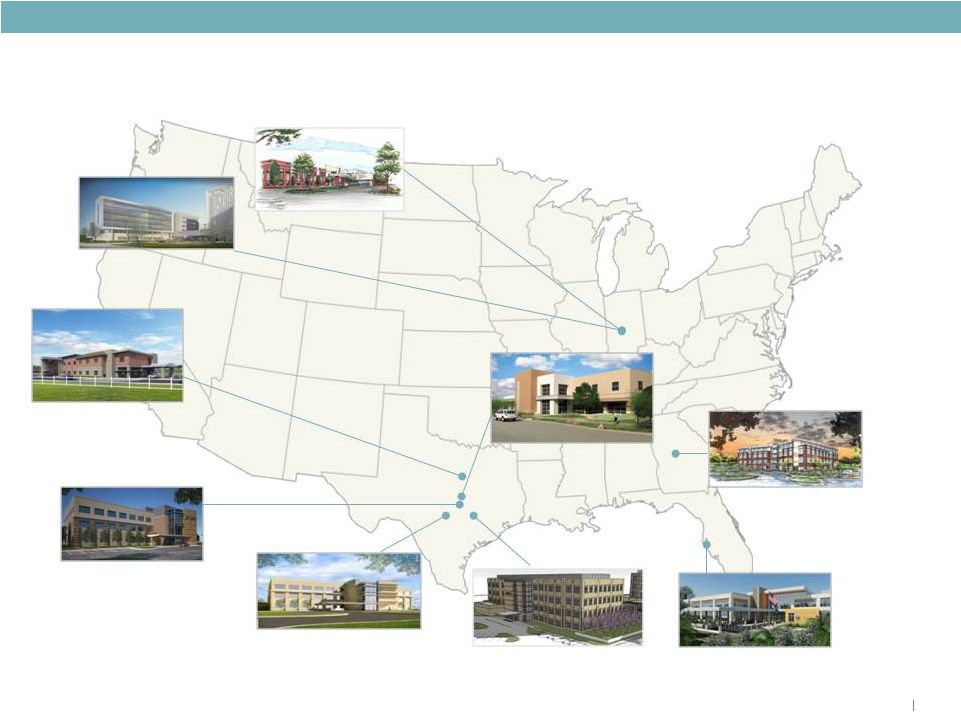
 2013 Duke Realty Corporation
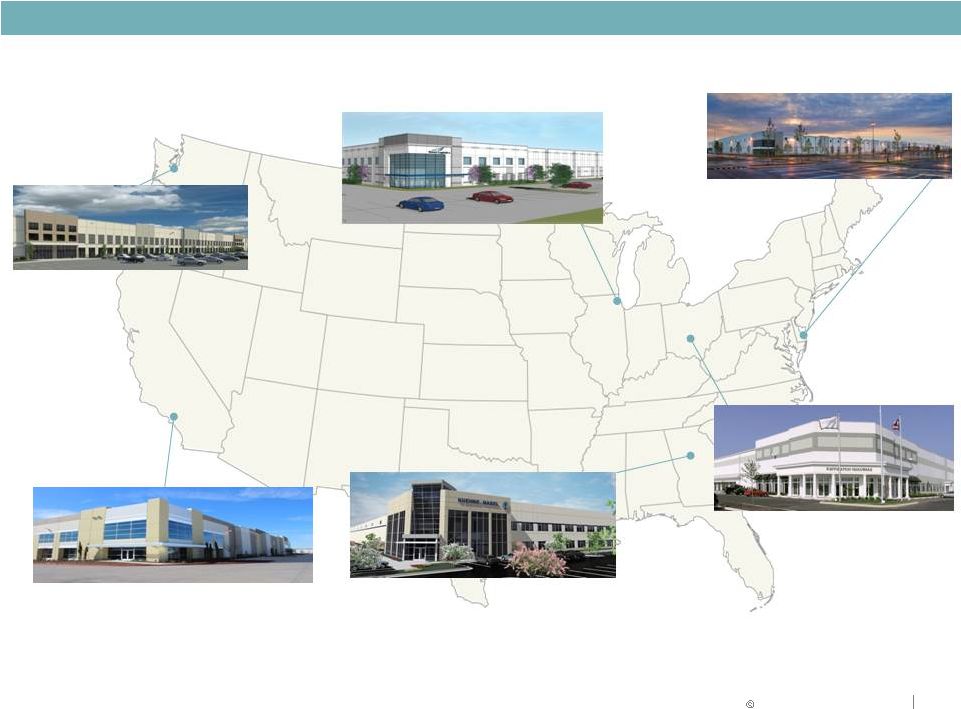
Chicago Industrial
Select 2012 Industrial Development Starts
12
Columbus Industrial
•
OPERATIONS STRATEGY
Southern California Industrial
Atlanta Industrial
Greater Seattle Bulk Industrial
Delaware Industrial
•
Regional distribution center build-to-suit in greater
Seattle for internet retailer
•
1,016,000 square feet
•
15 year lease term
•
Yusen Logistics build-to-suit
•
O’Hare submarket on 26 acre brownfield redevelopment
•
230,000 square feet
•
12 year lease term
•
Regional distribution center build-to-
suit in Delaware for internet retailer
•
1,015,000 square feet
•
12 year lease term
•
Speculative development on Duke Realty land
in Chino, CA
•
Inland Empire West submarket
•
421,000 square feet
•
Kuehne & Nagel build-to-suit on Duke Realty land at Camp
Creek
•
South Atlanta submarket near Hartsfield Airport
•
211,000 square feet
•
10 year lease term
•
Restoration Hardware expansion for Eastern
U.S. Distribution Operations
•
West Jefferson submarket on 19 acres of
our land
•
418,000 square feet, as an addition to
existing 805,000 square feet
•
15 year lease term |
 2013 Duke Realty Corporation
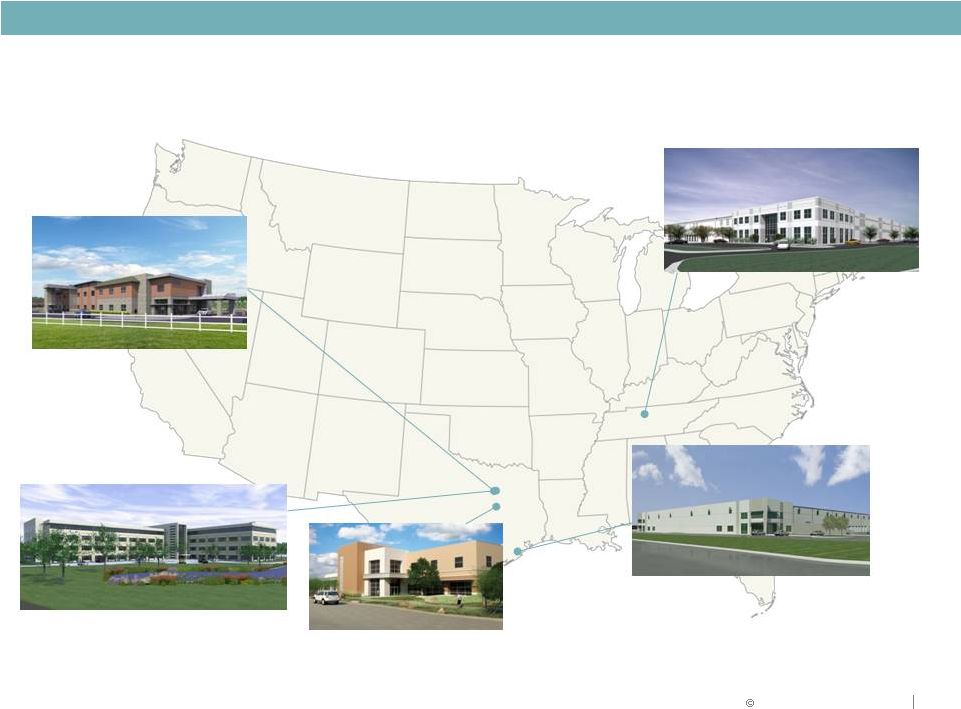
2013 YTD Development Starts
13
OPERATIONS STRATEGY
Nashville Industrial
Dallas Medical Office
Dallas Office
Houston Industrial
Waco Medical Office
•
•
•
•
Regional distribution center build-to-suit for
Starbucks
•
680,000 square feet
•
7.5 year lease term
•
Three Baylor Emergency (ER) facilities in Metro Dallas
(cities of Rockwell, Murphy and Burleson)
•
114,000 total square feet
•
$15 million project cost each ($45 million total)
•
Build-to-suit on Duke Realty land
•
200,000 square feet
•
16 year lease term
Scott & White Healthcare
37,000 square feet
15 year term
•
•
•
Speculative development on Duke Realty
land
Airport submarket
240,000 square feet |
 2013 Duke Realty Corporation
ASSET STRATEGY
14 |
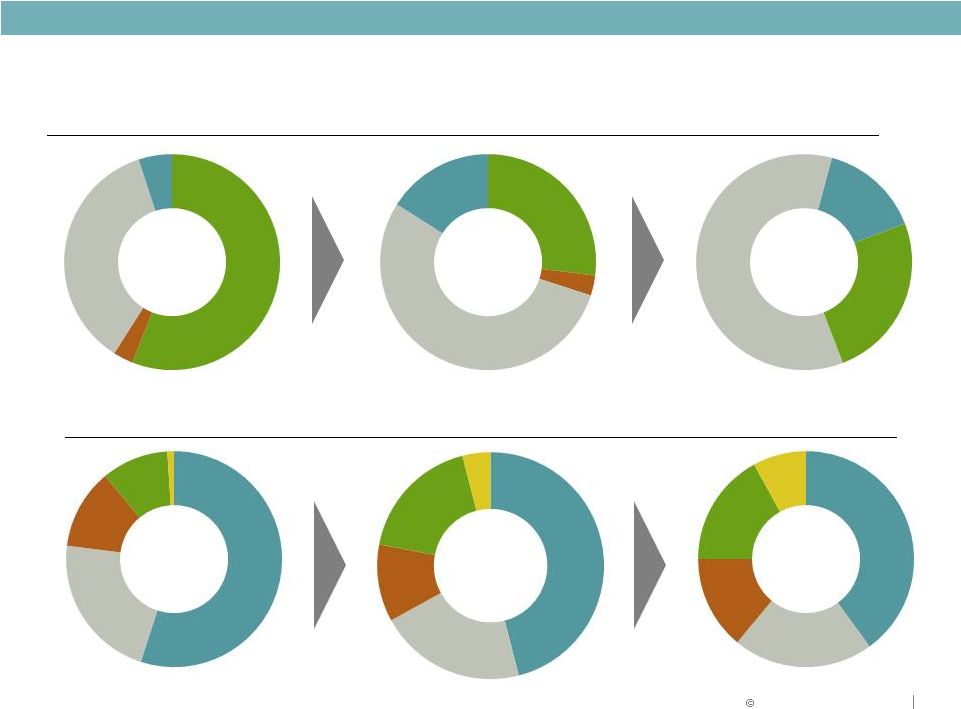 2013 Duke Realty Corporation
1Q 2013
YE
2013
15
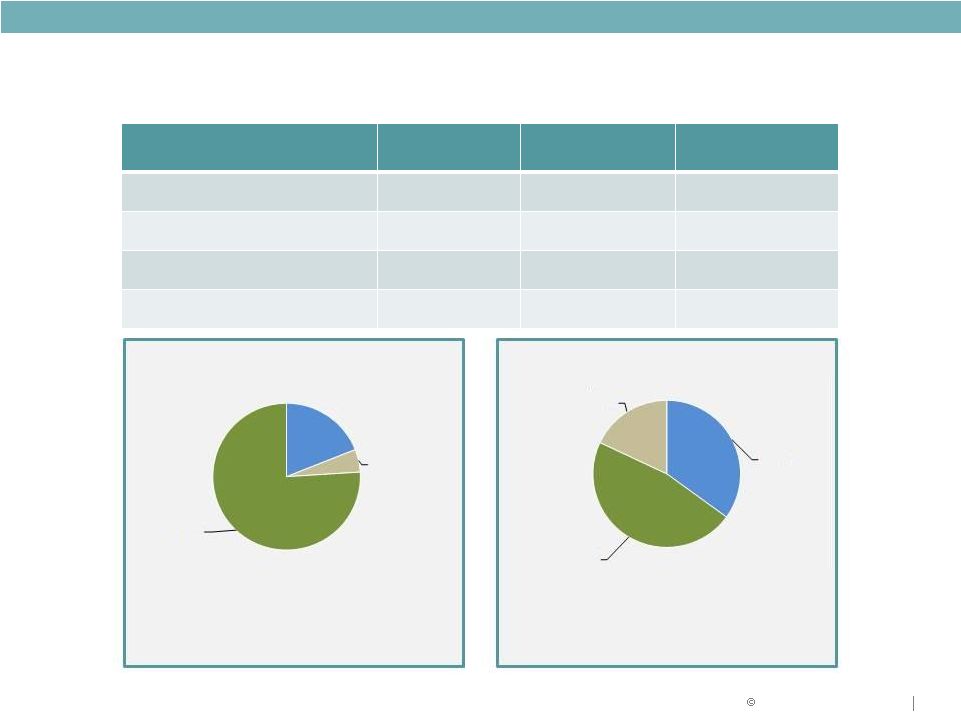
Asset Strategy
BY PRODUCT
2009
BY GEOGRAPHY
ASSET STRATEGY
2009
YE
2013
Southeast
22%
Southeast
1Q 2013
Southeast
21%
Office
56%
Retail
3%
Industrial
36%
Medical
Office
5%
Office
27%
Retail
3%
Industrial
54%
Medical
Office
16%
Office
25%
Industrial
60%
Medical
Office
15%
Midwest
55%
East
12%
South
10%
West
1%
Note: Figures represents share of quarterly net operating income
Midwest
46%
East 11%
South 18%
West 4%
Midwest
40%
21%
East
14%
South
17%
West
8% |
 2013 Duke Realty Corporation
16
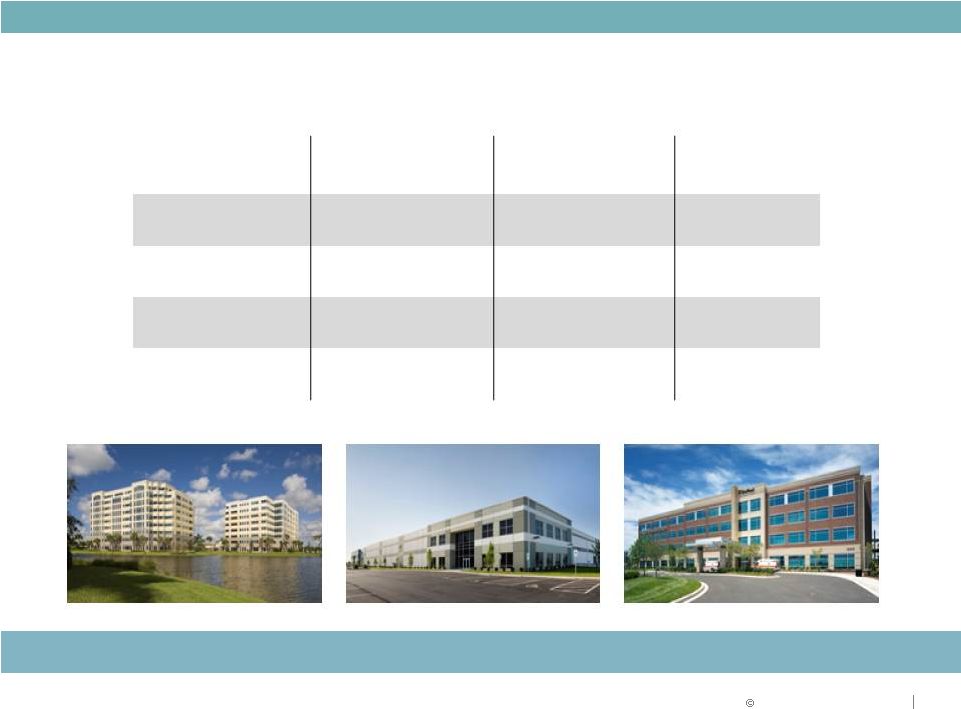
New, High Quality Portfolio with Long-term Leases
ASSET STRATEGY
Premier portfolio of assets
Portfolio average
Bulk
Industrial
Suburban Office
Medical Office
Property age
11.3 years
15.0 years
6.7 years
Property size
230,000 SF
114,000 SF
78,000 SF
Lease term
7.2 years
6.8 years
11.3 years
Tenant size
80,000 SF
11,000 SF
9,000 SF |
 2013 Duke Realty Corporation
17
Premier Quality Industrial Portfolio
ASSET STRATEGY
Focus on modern bulk warehouse
with strong performance characteristics
<100,000
100,000-500,000
>500,000
Percentage Total Square Feet
9%
55%
36%
Building Square Footage
(000's)
10,000
61,000
40,000
Number of Buildings
151
278
53
Average Tenant Size
22,000
88,000
482,000
Occupancy
90.3%
93.0%
95.3%
Building Size
Portfolio Metric
(As of March 31, 2013) |
 2013 Duke Realty Corporation
18
2013 Notable Dispositions
Solid Momentum on Executing Disposition Strategy
Raleigh, NC
Sale of 50% joint venture at $98.3 million
sales price (building valuation $328/SF)
300,000 square feet
95% leased
Chambers Street Portfolio
ASSET STRATEGY
•
CapTrust Tower
•
•
•
17 primarily office and flex properties located across FL,
OH, MN, TX, AZ and NC
Sale of 20% joint venture interest to partner for $98.6
million sales price ($149/SF Office; $79/SF Industrial)
3.3 million square feet
98% leased
•
•
•
• |
 2013 Duke Realty Corporation
19
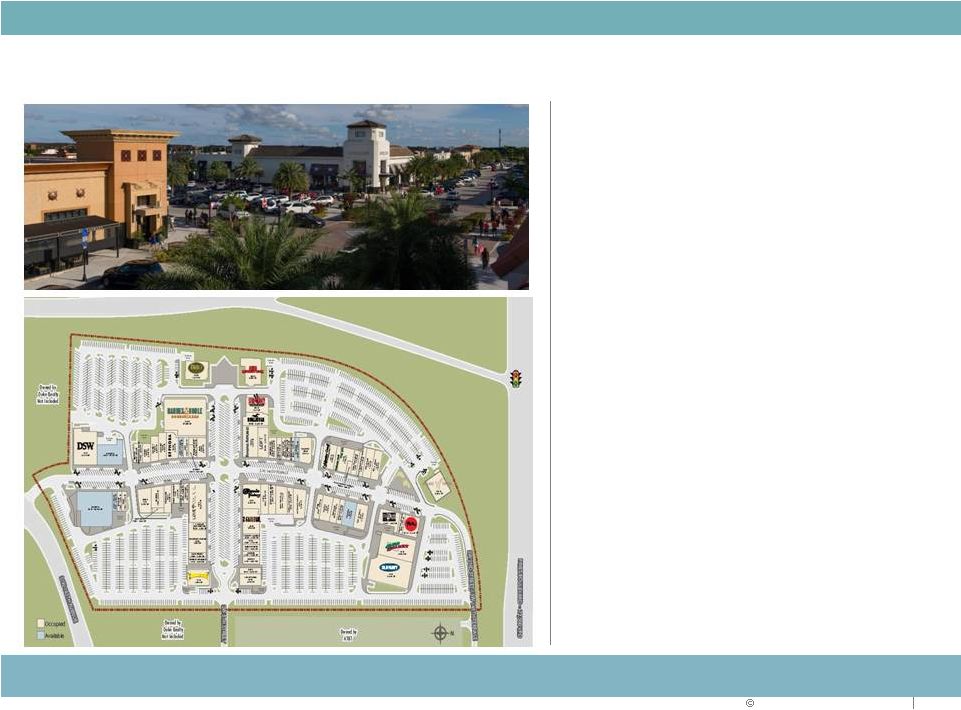
Pembroke Pines Retail Disposition
Pembroke Gardens
Lifestyle Center
INTERSTATE-75 / 136,000 VPD
Pembroke Pines, FL, on
Interstate 75
391,000 square feet, 90%
leased
$188 million sales proceeds
($480/SF)
Proceeds strategically recycled
into high quality industrial
portfolio
•
•
•
•
ASSET STRATEGY
Successful development, lease-up and gain on sale of non-core asset
|
 2013 Duke Realty Corporation
Consistent with long-term asset strategy, this transaction is an opportunity
to buy a portfolio of 100% modern, class A bulk assets in major distribution
markets 8 facilities, 4.9 million square feet, seven markets
$312 million purchase price, or ~$66/SF, $99 million of assumed debt. Closed
in May 2013.
100% leased to 10 tenants
90% in Duke Realty target markets . . . California, Pennsylvania, New Jersey and
Houston
The portfolio is representative of our existing portfolio and superior to most
acquisition opportunities:
–
Average age of 8 years
–
Average building size of 608,000 sf
–
Minimum clear height of 30’
with 7 assets 32’+
–
All assets are cross docked
Exceptional portfolio of Class A assets
20
ASSET STRATEGY
Transaction executed at attractive pricing
USAA Portfolio Industrial Acquisition |
 2013 Duke Realty Corporation
21
ASSET STRATEGY
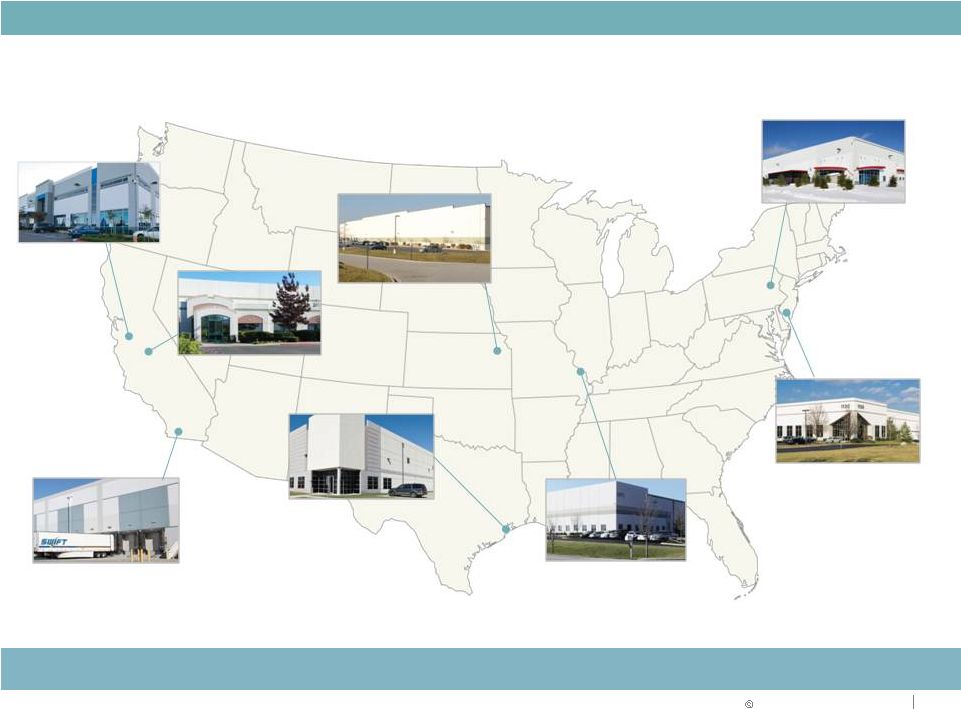
USAA Portfolio Acquisition
Strategic capital recycling into high quality bulk industrial portfolio
Home Depot Deployment
Center
Central Valley, CA
660,000 SF, 100% leased
JoAnne Stores
Central Valley, CA
635,000 SF, 100% leased
Redlands Commerce
Center
Inland Empire East
575,000 SF, 100% leased
Lakeview Commerce Center
St. Louis, MO
540,000 SF, 100% leased
Kimberly-Clark Regional DC
Kansas City, KS
447,000 SF, 100% leased
Interport Building I
Houston, TX
600,000 SF, 100% leased
1130 Commerce Blvd
Southern NJ
386,000 SF, 100% leased
Sears Distribution Center
Northeast PA
1,026,000 SF, 100% leased |
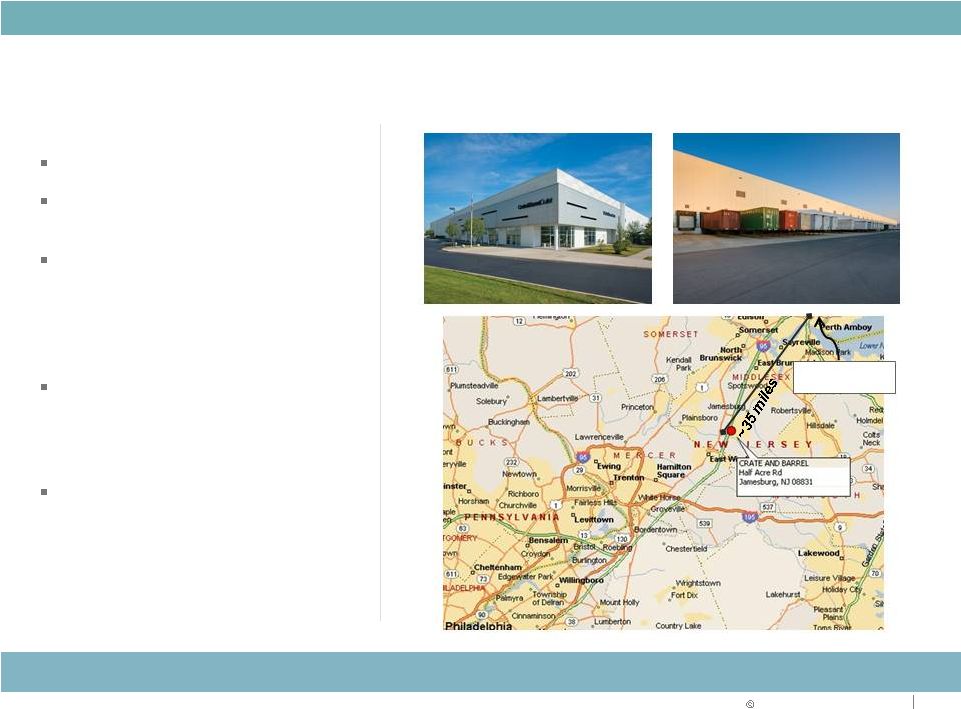 2013 Duke Realty Corporation
2 facilities totaling 950,000 SF
9 years old, 100% leased to
Crate & Barrel
Located in Cranbury, NJ, just off
I-95, equidistant to Philadelphia
and New York City, a key
distribution market in the
Eastern U.S.
One of three distribution
locations for Crate & Barrel, with
Duke Realty owning/managing
another location in Naperville, IL
$75 million purchase price, or
~$79/SF. Closed in April 2013
22
Central New Jersey Industrial Acquisition
ASSET STRATEGY
Duke Realty enters key distribution market in Eastern U.S.
Port of Newark
Container Terminal |
 2013 Duke Realty Corporation
23
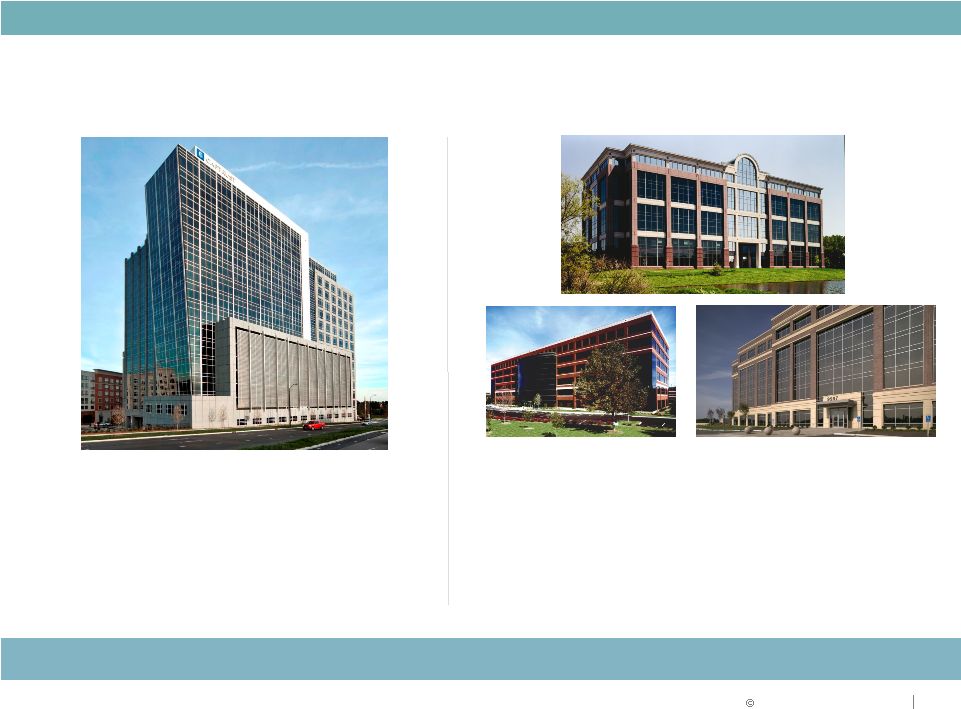
Midwest Office Portfolio being Marketed
Continue Pruning Midwest Suburban Office According to Plan
ASSET STRATEGY
•
17
Class
A
buildings,
2.3
million
square
feet,
average
age
of
16
years
•
Cincinnati, Cleveland and St. Louis markets
•
91.8% leased |
 2013 Duke Realty Corporation
24
MEDICAL OFFICE STRATEGY |
 2013 Duke Realty Corporation
25
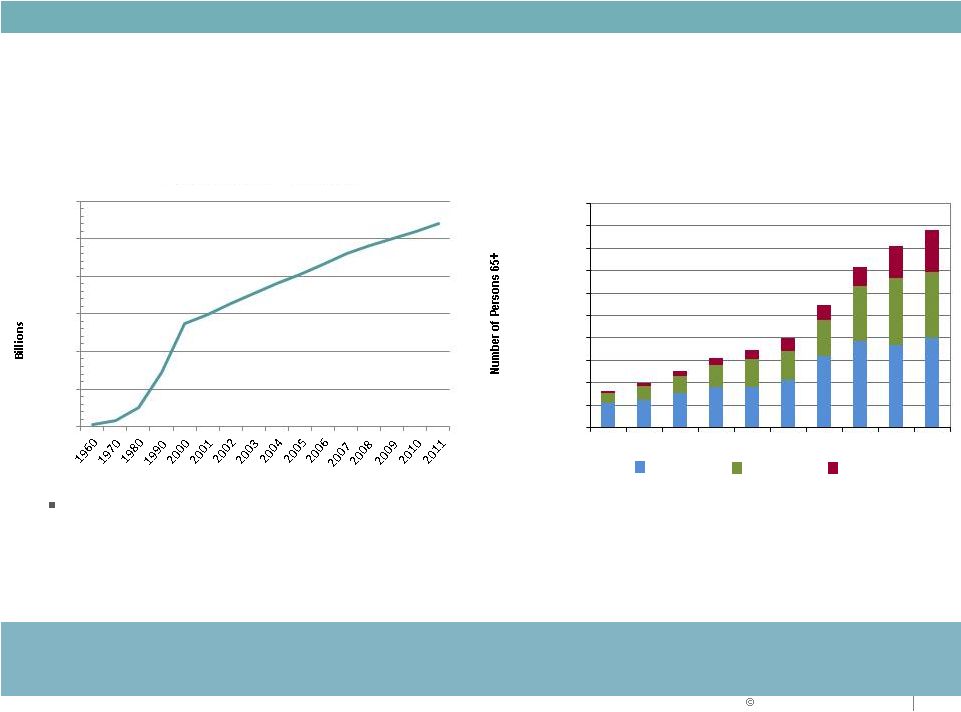
Healthcare Trends
The nation’s largest industry
•
More than 17% of GDP; predicted to exceed 23% by 2020
•
U.S. population 65+ expected to approach 90 million by 2050
•
Aging population driving increase in healthcare expenditures
MEDICAL OFFICE STRATEGY
Annual Healthcare
Expenditures
Source: U.S. Bureau of the Census
Population Age 65+: 1960-2050
Source: U.S. Bureau of the Census
Age 65-74
Age 75-84
Age 85+
Growing healthcare expenditures and demographics
should drive long term MOB demand
$0
$500
$1,000
$1,500
$2,000
$2,500
$3,000
0
10,000,000
20,000,000
30,000,000
40,000,000
50,000,000
60,000,000
70,000,000
80,000,000
90,000,000
100,000,000
1960
1970
1980
1990
2000
2010
2020
2030
2040
2050 |
  ©
2013 Duke Realty Corporation
26
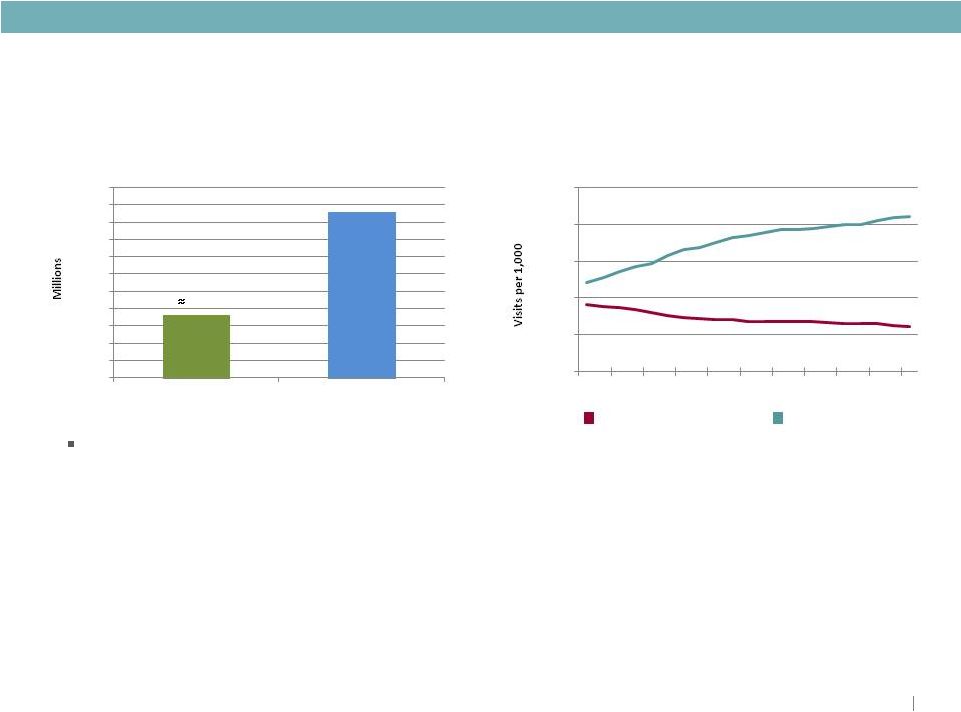
Healthcare Trends
MEDICAL OFFICE STRATEGY
Projected U.S. Residents with Insurance in 2021
Source: U.S. Bureau of the Census and U.S. Center for Disease Control and
Prevention Inpatient and Outpatient Trends
Source: Avalere Health, American Hospital Association
Annual Survey, U.S. Census Bureau
Inpatient Days
Outpatient Visits
Affordable Care Act should further improve trend for demand for lowest-cost
setting outpatient facilities such as Medical Office
223M
+253M
205
210
215
220
225
230
235
240
245
250
255
260
Before ACA
After ACA
0
500
1,000
1,500
2,000
2,500
1990
1992
1994
1996
1998
2000
2002
2004
2006
2008
2010
Affordable Care Act
People insured expected to increase by 30 to 50 million – increased demand for care Number of physicians will increase – growing MOB space demand
Patient care shifting to more cost-efficient MOB settings with higher acuity
of services • Reduced reimbursements
will make real estate efficiency a priority – larger deals and floor plates
Healthcare system consolidation and physician employment by hospitals escalating – growing
MOB demand and improving tenant credit
•
•
•
• |
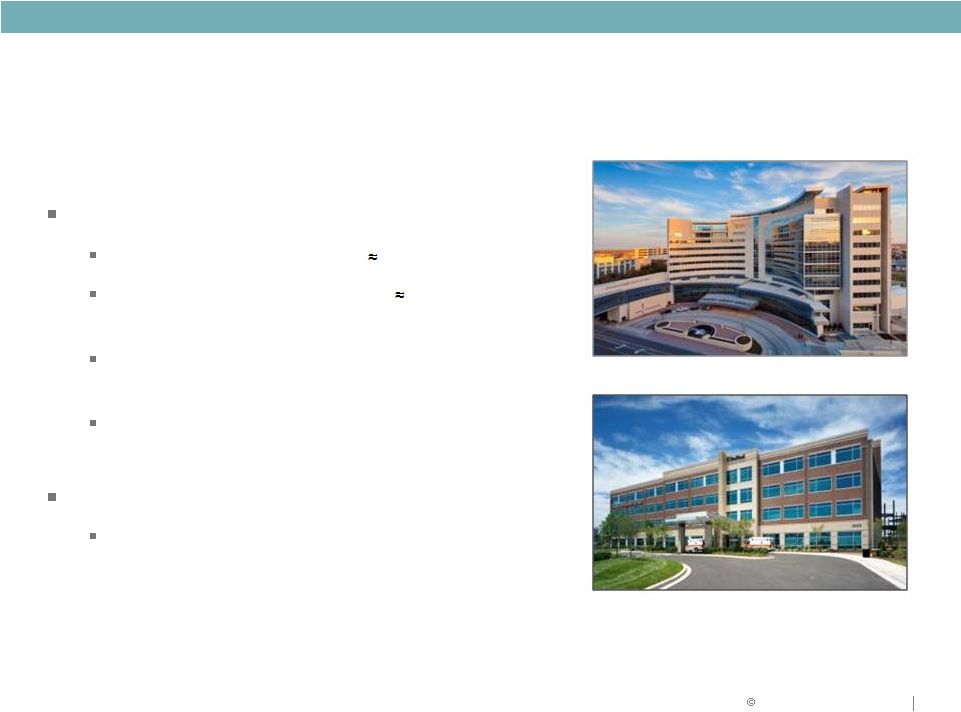 2013 Duke Realty Corporation
Our Plan
Existing healthcare assets $1.5 Billion
New developments projected
$200 Million
in 2013
92.4% leased at March 31, 2013 . . .
projected to increase in 2013
Recycle selected non-strategic assets and
recognize value created
Our Focus
Virtually all assets are on campus or affiliated with
a major health system
Goal: Grow Medical Office Primarily through Development
27
MEDICAL OFFICE STRATEGY |
 2013 Duke Realty Corporation
28
In-Service
Under
Development
Total
Properties
70
13
83
Investment $
$1.2 B
$290 M
$1.5 B
Square Feet
5.5 M
1.0 M
6.5 M
Leased Occupancy
91%
100%
92%
Medical Office Portfolio at March 31, 2013
MEDICAL OFFICE STRATEGY
Portfolio investment
by product type
MOB
On-Campus
MOB
Off-Campus
Specialty
Hospital
19%
5%
76%
Regional
National
Portfolio investment by
hospital system
Local
35%
47%
18% |
 ©
2013 Duke Realty Corporation
29
Healthcare Development Pipeline
MEDICAL OFFICE STRATEGY
Department of Veterans Affairs
Tampa, FL
117,000 SF, 100% pre-leased
Scott and White Healthcare
Marble Falls, TX
67,000 SF, 100% pre-leased
Wishard Health
Indianapolis, IN
274,000 SF, 100% pre-leased
Scott & White Healthcare
College Station, TX
119,000 SF, 100% pre-leased
Centerre / Community Health
Indianapolis, IN
60,000 SF, 100% pre-leased
Northside Hospital Orthopedic Clinic
Atlanta, GA
101,000 SF, 100% pre-leased
Scott & White Healthcare
Temple, TX
78,000 SF, 100% pre-leased
Baylor Healthcare (4 Facilities)
Dallas, TX
38,000 square feet each (152,000 total
square feet), 100% pre-leased
Scott & White Healthcare
Waco, TX
35,000 SF, 100% pre-leased |
 ©
2013 Duke Realty Corporation
30
1%
3%
1%
4%
4%
8%
5%
0%
2%
4%
6%
8%
10%
2013
2014
2015
2016
2017
2018
2019
Lease Expirations (% of In-Service Sq. Ft.) High credit tenants and limited lease
maturity result in stable and growing cash flow
Top Health System Relationships
Health System
Credit Rating
(Moody's)
Rentable SF
Ascension Health
Aa1
510,000
Baylor Health Care System
Aa2
450,000
Scott & White Healthcare
A1
438,000
Harbin Clinic
Unrated
313,000
Franciscan Alliance, Inc.
Aa3
288,000
Health & Hospital Corp Marion
County (Wishard)
Aa1
274,000
Trinity Health
Aa2
259,000
Catholic Health Initiatives
Aa2
250,000
Veterans Administration
Aaa
224,000
Northside Hospital
Unrated
210,000
MEDICAL OFFICE STRATEGY
As of 3/31/13 |
 2013 Duke Realty Corporation
Strategic Benefits to Duke Realty
Medical office solid NOI growth and lower volatility
31
•
NOI growth with long term leases averaging over 11 years with very high
tenant retention
o
Typical lease includes 2-3% annual net rent escalators with
expenses passed through
•
Strong credit tenants with over 95% of the portfolio leased to, or affiliated
with major hospital systems (a majority credit-rated A or AA)
•
The newest portfolio in REIT sector with an average age of 7 years
•
Total portfolio occupancy of 92.4%
•
Medical office development starts solid with approximately $200 million
projected for 2013, majority 100% leased
•
Growth industry, defensive asset class
•
Capital markets liquidity benefits and G&A synergies
MEDICAL OFFICE STRATEGY |
 2013 Duke Realty Corporation
CAPITAL STRATEGY AND 2013 GUIDANCE
32 |
 2013 Duke Realty Corporation
Capital Strategy Focus
33
Reducing leverage
Increasing coverage ratios
Maintaining size and quality of unencumbered asset base
Executing portfolio repositioning in alignment with capital strategy
objectives
Further improve balance sheet strength and ratings
CAPITAL STRATEGY
1
2
3
4 |
 2013 Duke Realty Corporation
•
Investment grade rated debt for over 16 years
•
Proven access to multiple capital sources
•
Available line of credit -
$850 million capacity
•
Conservative AFFO payout ratio (74%)
34
Key Capital Metrics & Goals
2010
Actual
2012
Actual
Q1
2013
Goal
Debt to Gross Assets
46.3%
49.7%
47.6%
45.0%
Debt + Preferred to
Gross Assets
55.5%
56.1%
52.1%
50.0%
Fixed Charge
Coverage Ratio
1.79 : 1
1.81 : 1
1.86 : 1
2.00 : 1
Debt + Preferred /
EBITDA
8.88
9.25
8.04
7.75
CAPITAL STRATEGY
Progressing toward strategic plan goals |
 2013 Duke Realty Corporation
% Total Return
(1)
:
YTD 2013
FY 2012
FY 2011
DRE
+2.1%
DRE
+20.8%
S&P 400
+16.9%
RMS
+8.7%
Comps
(3)
+28.2%
DRE
+23.9%
Comps
(3)
-6.0%
S&P 500
+16.0%
RMS
+11.0%
S&P 500
+2.1%
S&P 400
+17.9%
S&P 500
+16.6%
S&P 400
-1.7%
RMS
+17.8%
Comps
(3)
+15.4%
Relative Performance of Duke Realty
Notes
1.
2.
3.
35
(2)
RELIABLE. ANSWERS.
DRE stock price as of end of trading 5/29/13,@ $16.85
Total return for comparable companies calculated on a market cap weighted basis Comparables include PLD, BDN,
CLI, DCT, HIW, LRY, FR, OFC, and EGP; PLD and AMB are included historically; figures shown on a market cap weighted basis |
 RELIABLE. ANSWERS.
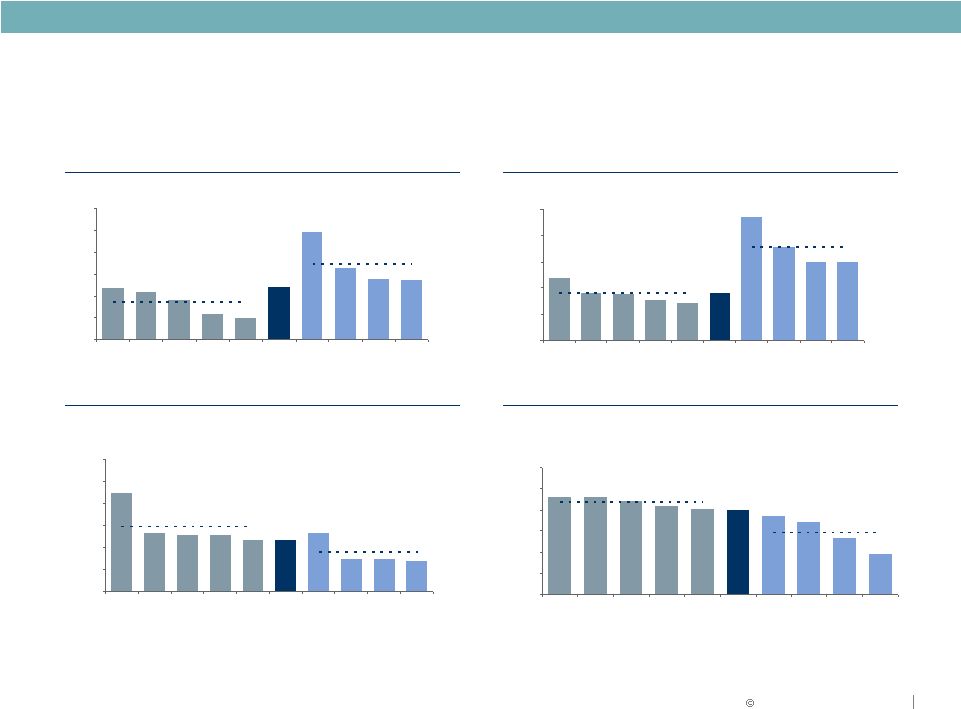
2013 Duke Realty Corporation
Industrial Average: 19.8x
Office Average: 12.9x
15.5x
14.7x
15.8x
25.7x
10.1x
13.4x
17.2x
10.9x
19.3x
17.0x
6.0x
10.0x
14.0x
18.0x
22.0x
26.0x
30.0x
LRY
OFC
HIW
CLI
BDN
DRE
PLD
EGP
FR
DCT
Industrial Average: 27.9x
Industrial Average: 3.0%
Office Average: 19.1x
Office Average: 4.4%
Office Average: 7.0%
Price / 2013E FFO
Implied Cap Rate
(1)
Dividend Yield
Price / 2013E AFFO
Key:
Office: LRY=Liberty; CLI=Mack-Cali; HIW=Highwoods; BDN=Brandywine;
OFC=Corporate Office Industrial: PLD=Prologis; FR=First Industrial; DCT=DCT
Industrial Trust; EGP=Eastgroup Source: SNL Financial, 5/29/13
(1) Per Wall Street research as of 5/20/13
Duke Realty Valuation Statistics
Duke Realty still undervalued by most levered and NAV metrics
Industrial Average: 5.8%
22.0x
19.2x
19.3x
33.7x
17.8x
19.0x
25.0x
25.0x
17.3x
28.0x
10.0x
15.0x
20.0x
25.0x
30.0x
35.0x
LRY
HIW
OFC
BDN
CLI
DRE
PLD
FR
EGP
DCT
8.5%
6.4%
6.6%
6.7%
6.6%
5.5%
5.4%
5.5%
6.4%
6.7%
4.0%
5.0%
6.0%
7.0%
8.0%
9.0%
10.0%
CLI
BDN
OFC
HIW
LRY
DRE
FR
DCT
PLD
EGP
4.6%
1.9%
3.5%
3.7%
4.0%
4.1%
2.7%
4.2%
4.5%
4.6%
0.0%
1.0%
2.0%
3.0%
4.0%
5.0%
6.0%
HIW
LRY
CLI
BDN
OFC
DRE
DCT
EGP
PLD
FR
36 |
 RELIABLE. ANSWERS.
2013 Duke Realty Corporation
ATM Program –
Overview
Future Outlook
Recap and
Timeline Usage
Use opportunistically as business warrants; primarily to fund development
with 60% equity; very cost efficient capital
Integral to growth plans and de-levering goals
•
Raised $24.8MM in Q2 at a VWAP of $18.24
to close out second shelf program
37
Appropriately funding our business
ATM Timeline
Action
Initial $150MM
Program
Second $200MM
Program
Current $300MM
Program
Implemented Program
Feb 11, 2010
May 7, 2012
May 21, 2013
Completed Program
Mar 15, 2012
May 15, 2013 |
 2013 Duke Realty Corporation
$0
$500
$1,000
$1,500
$2,000
$2,500
$3,000
$3,500
2013
2014
2015
2016
2017 and beyond
Unsecured Debt
Secured Debt
JV Debt
$609
38
Liquidity Position
($ in millions)
CAPITAL STRATEGY
Maturity ladder actively managed
$134
$463
$557
$2,973
Debt Maturity and Amortization Schedule
May 31, 2013 |
 RELIABLE. ANSWERS.
2013 Duke Realty Corporation
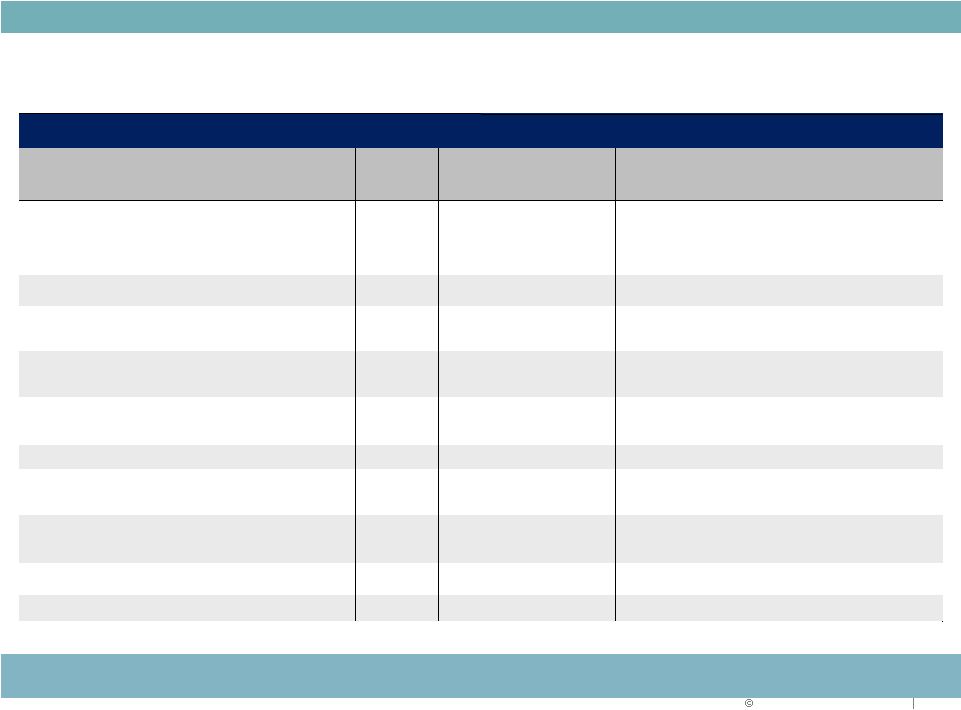
2013 Range of Estimates
$ in millions
39
Leasing actions, capital recycling and development execution drive upside
2013 Range of Estimates
Metrics
2012
Actual
Q1 2013
Actual
Pessimistic
Optimistic
Key Assumptions
Core FFO per share
$1.02
$0.26
$1.03
$1.11
-
Continued improvement in operating fundamentals
-
Development projects
-
Growth in asset base from repositioning actitivies
AFFO Payout Ratio
83%
74%
83%
76%
-
Annual dividend maintained at $0.68 per share
Average
Occupancy
-
In-Service
92.2%
92.6%
92.0%
94.0%
-
Positive momentum continued, although slower pace
-
Expirations only 7% of portfolio
Same Property NOI Growth
2.5%
2.4%
1.0%
4.0%
-
Occupancy growth slowing
-
Slightly improved rental rate assumptions
Building Acquisitions
$801
$30
$300
$500
-
Remain selective regarding property type and
location in alignment with long-term strategy
Building Dispositions
$141
$222
$400
$600
-
Continue to prune remaining office and retail
Land Sale Proceeds
$12
$0.6
$15
$25
-
Selling identified non-strategic parcels
-
Demand still sluggish, but improving
Development Starts
$520
$139
$400
$500
-
Comprised mainly of industrial and medical office
-
Substantially pre-leased
Service Operations Income
$22
$9
$16
$24
-
Consistent third party volumes anticipated
General & Administrative expense
$44
$13
$43
$37
-
Continued efficiency gains |
 2013 Duke Realty Corporation
40
WHY DUKE REALTY?
Quality portfolio improving with asset strategy
Solid balance sheet improving with capital strategy
Unmatched ability to execute on daily operations
Development capabilities in place with existing land bank
Talent and leadership depth to execute
Delivering on what we say we will do
RELIABLE. ANSWERS |
 RELIABLE. ANSWERS.
2013 Duke Realty Corporation
41
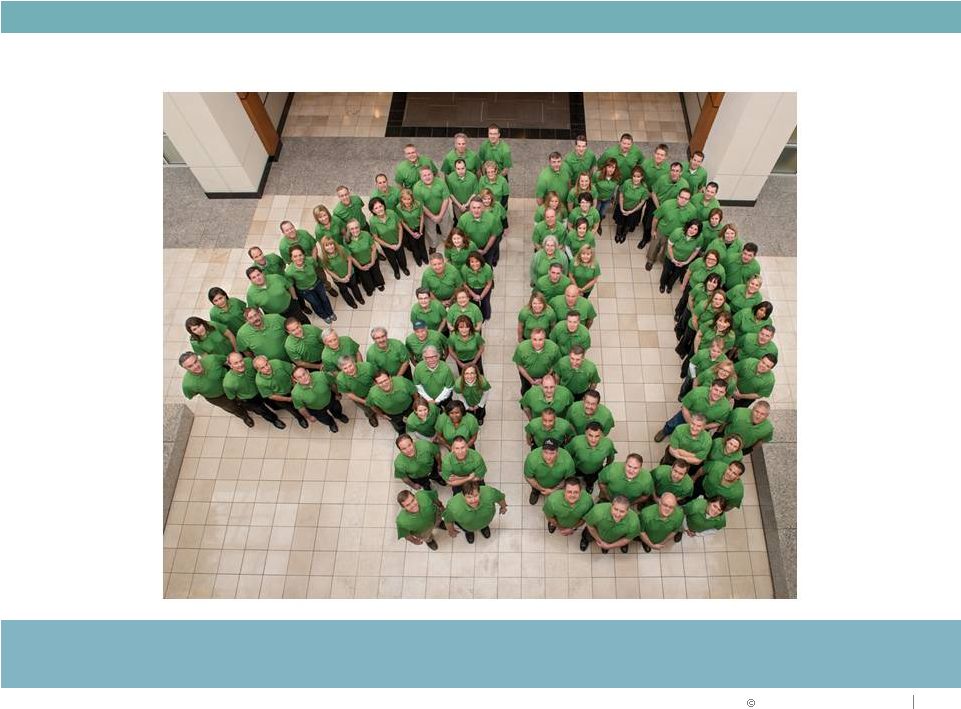
40 Years of Reliability
Long-tenured associates in our Indianapolis headquarters commemorated
Duke
Realty’s 40
th
year in business |
 RELIABLE. ANSWERS.
2013 Duke Realty Corporation
Forward-Looking Statement
This slide presentation contains statements that constitute “forward-looking
statements” within the
meaning of the Securities Act of 1933 and the Securities Exchange Act of 1934 as
amended by the Private Securities Litigation Reform Act of 1995. These
forward-looking statements include, among others, our statements regarding
(1) strategic initiatives with respect to our assets, operations and capital and (2) the
assumptions underlying our expectations. Prospective investors are cautioned
that any such forward- looking statements are not guarantees of future
performance and involve risks and uncertainties, and that actual results may
differ materially from those contemplated by such forward-looking statements. A
number of important factors could cause actual results to differ
materially from those contemplated by
forward-looking statements in this slide presentation. Many of these
factors are beyond our ability to control or predict. Factors that could
cause actual results to differ materially from those contemplated in this
slide presentation include the factors set forth in our filings with the Securities and Exchange
Commission, including our annual report on Form10-K, quarterly reports on Form
10-Q and current reports on Form 8-K. We believe these
forward-looking statements are reasonable, however, undue reliance should
not be placed on any forward-looking statements, which are based on current expectations. We
do
not assume any obligation to update any forward-looking statements as a result of
new information or future developments or otherwise.
Certain of the financial measures appearing in this slide presentation are or may be
considered to be non- GAAP financial measures. Management believes that
these non-GAAP financial measures provide additional appropriate measures
of our operating results. While we believe these non-GAAP financial
measures are useful in evaluating our company, the information should be considered
supplemental in nature and not a substitute for the information prepared in
accordance with GAAP. We have provided for
your reference supplemental financial disclosure for these measures, including the
most directly comparable GAAP measure and an associated reconciliation in our
most recent quarter supplemental report, which is available on our website at
www.dukerealty.com. Our most recent quarter supplemental report also
includes the information necessary to recalculate certain operational ratios and ratios of
financial position. The calculation of these non-GAAP measures may differ
from the methodology used by other REITs, and therefore, may not be
comparable. 42 |