Attached files
| file | filename |
|---|---|
| 8-K - 8-K - VEREIT, Inc. | v346954_8-k.htm |

American Realty Capital Properties Company Overview June 2013
22 NASDAQ: ARCP • Largest NASDAQ-listed equity REIT • Free standing, single tenant properties with net leases • Target property characteristics: o High quality, ‘Main & Main’ locations o Strong tenants, including investment grade corporates and high health ratio national tenants o Focus on essential community goods and services • Focus on properties subject to long and mid-duration (“vintage”) leases • Extract outsized growth potential from renewal/releasing of vintage lease properties • Below market rents • Purchase price below replacement cost Unique Investment Strategy American Realty Capital Properties

33 2•01Fe3b ruHaryi g20h13li: gCohmtpsle ted acquisition of American Realty Capital Trust III • Announced $2.2 billion merger with CapLease, Inc., expected to close in Q3 or Q4 2013 • Announced $807 million acquisition from GE Capital of 471 property portfolio of quick service restaurants, expected to close in Q2 2013 • Closed on $313.7 million of new acquisitions through May 3, 2013 • Launched $60 million “At-The-Market” equity offering program • Filed “well known seasoned issuer” (WKSI) automatic shelf registration • Upsized unsecured credit facility up to $1.45 billion(1) • ARCP added to the MSCI US REIT Index (add date of May 31, 2013) 2013 Highlights (1) The credit facility also includes an “accordion feature” that would allow ARCP, subject to certain conditions, to increase the aggregate commitments to $2.5 billion.

4 „h Accretion to Earnings and Dividends: Expected to be immediately accretive to ARCP¡¦s AFFO per share by approximately $0.11 per share. Upon closing, ARCP will increase its dividend by $0.03 per share, or 3.2%, to $0.94 per share, while maintaining a conservative payout ratio. „h Increased Size and Scale: Pro forma enterprise value of approximately $6.0 billion, among the largest publicly traded net lease REITs. The increased size and scale resulting from the transaction significantly enhances ARCP¡¦s ability to execute large transactions and strengthens its position as an industry consolidator in the fragmented net lease real estate industry where size and cost of capital matter. „h Increased Diversification: ARCP¡¦s top ten tenant diversification improves from 60% to 43% post merger. This transaction improves the quality of ARCP¡¦s revenue through additional diversification while strengthening the overall capital structure on a risk adjusted basis. „h Impact on Balance Sheet: With respect to LSE¡¦s $1.2 billion of outstanding debt, ARCP intends to assume approximately $580 million and repay the balance, thus materially reducing the legacy leverage and paying off LSE¡¦s high coupon debt and preferred equity. „h Management Additions, Integration and Operating Synergies: LSE¡¦s management team is expected to join American Realty Capital, the parent of ARCP¡¦s external advisor, upon completion of the merger. These additions increase the depth and breadth of the ARC team, provide management continuity of the LSE assets, add build-to-suit capabilities and bring ARCP closer to internalizing its management. $2.2 Bn Acquisition of CapLease (NYSE: LSE). This acquisition provides ARCP with substantial strategic, financial and portfolio benefits.

5 „h Strategic Portfolio Construction: This portfolio acquisition significantly advances ARCP¡¦s investment objectives by growing its net lease portfolio consistent with its investment strategy and further reduces its credit concentration by adding 137 new tenants. ARCP¡¦s expected 2013 portfolio will include more than 225 distinct tenants. „h High Portfolio Occupancy and Balance of Lease Duration: The Company reasonably expects its portfolio to remain approximately 100% occupied. The average remaining lease duration on the entire portfolio would be 9.0 years, reflecting the Company¡¦s strong balance of mid-term and long-term lease durations. Only modest lease rollover would occur until 2018. „h Increased Size and Scale: Once ARCP completes its expected 2013 acquisitions, its portfolio of 1,264 net lease properties, containing over 30 million rentable square feet, will be one of the largest net lease portfolios among public REITs. „h Available Financing: Strong and diverse capital markets environment provides ARCP with flexibility in constructing attractive long-term capital structure. „h Increased Diversification/Reduced Concentration: 2013 pro forma rental revenue generated by ARCP¡¦s largest 10 tenants will decline from 60% to 36%. The Company¡¦s portfolio would include tenants located in 48 states plus Puerto Rico spanning 27 industries. $807 Million GE Capital Portfolio Acquisition. 2013 acquisition targets achieved by mid-year.

ARCP has assembled a large, diversified net leased property portfolio. 6 Current Pro Forma Total Square Feet 17.0 M 29.8 M % Investment Grade(1) 79% 69% Avg. Remaining Lease Term 11.1 years 9.0 years Occupancy 100% 100% No. of Properties 722 1,253(2) No. of Tenants 55 229 No. of Industries 20 27 States 45 + PR 48+PR 2013 Annualized Rents $169.4 M $345.5 M (1) Includes investment grade tenants affiliated with investment grade entities as determined by a major independent rating agency. For purposes of this presentation, we have attributed the ratings of the affiliated parent company to the tenant. (2) Excludes CapLease HoldCo assets.

77 ARCP has outperformed the RMS, S&P 500 and leading publicly traded net lease REITs over the trailing nine months. Source: SNL Financial (1) Total return calculated from September 4, 2012 to market close on June 3, 2013. 41.44% 18.62% 17.57% 9.79% 9.66% 0 5 10 15 20 25 30 35 40 45 ARCP S&P 500 NNN MSCI US REIT (RMS) O

8 ARCP Post CapLease Merger will Increase its Dividend for the 7th Consecutive Quarter.(1) (1) Pending the close of the proposed transaction. (2) Dividends based on dividend rate at the end of each period. $0.875 $0.875 $0.880 $0.885 $0.890 $0.895 $0.900 $0.910 $0.940 $0.840 $0.860 $0.880 $0.900 $0.920 $0.940 $0.960 Q'3 2011 Q'4 2011 Q'1 2012 Q'2 2012 Q'3 2012 Q'4 2012 Q'1 2013 Q'2 2013 ARCP Post Merger Per Share Historical Annualized Dividend(2)

9 AFFO per share is projected to grow by 28% from 2013 to 2014.(1) ($ amounts in millions, except per share data) 2014 Prior Guidance 2014 Revised Guidance Low High Low High FFO/share (fully diluted) $1.05 $1.09 $1.14 $1.18 Growth Rate 12.6% 22.1% AFFO/share (fully diluted) $1.06 $1.10 $1.17 $1.21 Growth Rate 16.1% 28.0% (1) Using midpoints of guidance range. ARCP Pro Forma Earnings Guidance 2013 Key Assumptions: • AFFO per share: Range - $0.91 to $0.95 • Acquisitions: Acquire an additional $800 million of assets (balance of 2013) • Financing: Capacity to utilize $1.45 billion unsecured financing: • $1.45 billion term/revolver @ 2.45% fixed rate interest • Weighted Average Shares Outstanding: 191.0 million (fully diluted) 2014 Key Assumptions: • Acquisitions: Acquire $1 billion of assets • Capitalization: 65% equity issuance, 35% debt utilization • Weighted Average Shares Outstanding: 252.5 million (fully diluted)

1100 Total Square Feet 17.0 million % Investment Grade(2) 79% Avg. Remaining Lease Term 11.1 years No. of Properties 722 Top 10 Tenant Concentration 60.1% Top 10 Tenant % Investment Grade 100% No. of Tenants 55 No. of Industries 20 States 45 + PR 2013 Annualized Rents $169.4 million ARCP Current Portfolio Total Square Feet 29.8 million % Investment Grade(2) 69% Avg. Remaining Lease Term 9.0 years No. of Properties 1,253 Top 10 Tenant Concentration 36.3% Top 10 Tenant % Investment Grade 100% No. of Tenants 229 No. of Industries 27 States 48 + PR 2013 Annualized Rents $345.5 million ARCP Pro Forma Portfolio(1) ARCP: A Leader in the Net Lease Industry. (1) Includes impact of CapLease and GE portfolio acquisitions. Excludes CapLease Holdco assets. (2) Includes investment grade tenants affiliated with investment grade entities as determined by a major rating agency. For purposes of this presentation, we have attributed the ratings of the affiliated parent company.

11 ARCP CapLease(1) GE Portfolio Pro Forma # of Properties 722 60 471 1,253 Total Square Feet (mm) 17.0 10.7 2.1 29.8 2013 Annualized Rent (mm)(2) $169.4 $120.7 $55.3 $345.5 Lease Term Remaining (yrs) 11.0 6.7 6.1 9.0 Investment Grade(3) 78.9% 85.0% 0.9% 68.5% Tenant (Groups) 55 40 137 229 States 45+PR 22+PR 44 48+PR Industries 20 19 5 27 Top 10 Tenants % 60.1% 52.4% 50.9% 36.3% Top 10 Investment Grade % 100% 100% 0.0% 100% 8 ARCP CapLease(1) GE Pro Forma Office 18.5% 72.1% 0.1% 34.3% Retail 56.9% 10.9% 99.9% 47.7% Distribution 24.6% 17.0% 0.0% 18.0% 100.0% 100.0% 100.0% 100.0% Property Type Breakdown(4) (1) Excluding CapLease HoldCo assets. (2) GE Portfolio: 2012 Cash Rent. (3) Includes investment grade tenants affiliated with investment grade entities as determined by a major rating agency. For purposes of this presentation, we have attributed the ratings of the affiliated parent company. (4) As a percentage of GAAP Rent. Pro Forma Portfolio Breakdown.

812 ARCP Tenant % Rating Dollar General 10.8% BBBCitizens Bank 10.1% A FedEx 9.4% BBB Walgreens 7.7% BBB AON Corporation 6.4% BBB+ General Mills 3.9% BBB+ GSA 3.4% AA+ Advance Auto 2.9% BBBBed Bath & Beyond 2.8% BBB+ Family Dollar 2.6% BBB- 60.1% 100.0% Pro Forma Tenant % Rating Dollar General 5.4% BBBAON Corporation 5.3% BBB+ Citizens Bank 5.0% A GSA 4.7% AA+ FedEx 4.7% BBB Walgreens 3.9% BBB General Mills 2.0% BBB+ TJX Companies, Inc. 1.8% A Lowes Companies, Inc. 1.7% AExelis, Inc. 1.7% BBB- 36.3% 100.0% Note: Includes investment grade tenants affiliated with investment grade entities as determined by a major rating agency. For purposes of this presentation, we have attributed the ratings of the affiliated parent company. Pro Forma Top Ten Tenants Breakdown.

1133 13 17.0 29.8 0.0 5.0 10.0 15.0 20.0 25.0 30.0 35.0 ARCP Current ARCP Pro Forma (millions) Total Square Feet 721 1,264 0 200 400 600 800 1,000 1,200 1,400 ARCP Current ARCP Pro Forma No. of Properties 55 229 0 50 100 150 200 250 ARCP Current ARCP Pro Forma No. of Tenants $169.4 $345.5 0.0 50.0 100.0 150.0 200.0 250.0 300.0 350.0 400.0 ARCP Current ARCP Pro Forma (millions) 2013 Annualized Rents Pro Forma Portfolio to Expand Significantly.

14 Tenant %of NOI Rating(1) 5.4% BBB- 5.3% BBB+ 5.0% A 4.7% AA+ 4.7% BBB 3.9% BBB 2.0% BBB+ 1.8% A 1.7% A- 1.7% BBB- 36.2% 100.0% Top 10 Tenants = 100% Investment Grade Note: Excludes held-for-sale assets. (1) Includes investment grade tenants affiliated with investment grade entities as determined by a major independent rating agency. For purposes of this presentation, we have attributed the ratings of the affiliated parent company to the tenant. Pro forma Top 10 Tenant Concentration Improves to only 36%.

15 Dollar General 5.4% 5.4% BBBAON Corporation 5.3% 10.7% BBB+ Citizens Bank 5.0% 15.8% A GSA 4.7% 20.5% AA+ FedEx 4.7% 25.2% BBB Walgreens 3.9% 29.1% BBB General Mills 2.0% 31.1% BBB+ TJX Companies, Inc. 1.8% 32.9% A Lowes Companies, Inc. 1.7% 34.6% AExelis, Inc. 1.7% 36.3% BBBDineEquityInc. 1.7% 37.9% B The Kroger Co. 1.6% 39.5% BBB Invesco Holding Co. Ltd. 1.6% 41.2% AJack In The Box, Inc. 1.5% 42.7% NR Tiffany & Co. 1.5% 44.1% AAdvance Auto 1.4% 45.6% BBBBed Bath & Beyond 1.4% 47.0% BBB+ Nestle Holdings, Inc. 1.4% 48.3% AA Allstate Insurance Company 1.3% 49.7% A+ Family Dollar 1.3% 51.0% BBBKaiser Foundation 1.2% 52.2% A-1 Williams Sonoma 1.2% 53.4% NR Cadbury Holdings Limited 1.1% 54.5% BBB Golden Corral 1.1% 55.6% NR Arby's Restaurant Group, Inc. 1.1% 56.7% NR Tenant Cum. Credit Rating Rite Aid 1.1% 57.7% BExpress Scripts 1.0% 58.7% BBB General Motors Financial Company, Inc. 1.0% 59.7% BB Farmers Group, Inc. 1.0% 60.6% AACVS 0.9% 61.6% BBB+ Rubbermaid 0.9% 62.5% BBBPraxair, Inc 0.9% 63.4% A DaVita Dialysis 0.9% 64.3% BBWorleyParsons Limited 0.8% 65.1% NR Farmers New World Life Insurance Co 0.8% 65.9% AAAbbott Laboratories 0.8% 66.7% A+ TD Bank 0.8% 67.5% AAPantry Gas & Convenience 0.8% 68.4% B+ Kum & Go 0.8% 69.2% NR Cooper Tire & Rubber Company 0.8% 69.9% BBMetroPCS Communications, Inc. 0.8% 70.7% B+ Krystal 0.8% 71.5% NR GE Aviation 0.7% 72.2% AA+ Del Monte Corporation 0.7% 72.9% B Fresenius 0.7% 73.7% NR Capital One Financial Corporation 0.7% 74.4% BBB Carrols 0.7% 75.1% BHanesbrands 0.7% 75.8% BBJohn Deere 0.7% 76.5% A AT&T Services, Inc. 0.7% 77.1% A- 77.1% Tenant % of GAAP Rent Cum. Credit Rating 69% of Overall Portfolio Investment Grade Top 50 Tenants are 60% Investment Grade. % of GAAP Rent

16 16 Consumer Products 10.5% Quick Service 9.3% Insurance 9.0% Discount Retail 9.0% Retail Banking 6.7% Pharmacy 5.9% Healthcare 5.5% Government Services 5.1% Freight 4.7% Casual Dining 4.4% Family Dining 4.4% Specialty Retail 3.4% Diversified Industrial 3.4% Auto Retail 2.5% Financial Services 2.5% Supermarket 2.4% Home Maintenance 2.4% Gas/Convenience 2.1% Telecommunications 2.0% Consulting 1.4% Auto Services 1.2% Aerospace 0.7% Media 0.6% Publishing 0.5% Consumer Goods 0.2% Storage Facility 0.2% Professional 0.0% 100% 27 Distinct Industries Industry % of GAAP Rent Consumer Products, 10.5% Quick Service, 9.3% Insurance, 9.0% Discount Retail, 9.0% Retail Banking, 6.7% Pharmacy, 5.9% Healthcare, Government 5.5% Services, 5.1% Freight, 4.7% Casual Dining, 4.4% Family Dining, 4.4% Specialty Retail, 3.4% Diversified Industrial, 3.4% Auto Retail, 2.5% Financial Services, 2.5% Supermarket, 2.4% Home Maintenance, 2.4% Gas/Convenience, 2.1% Telecommunications, 2.0% Consulting, 1.4% Auto Services, 1.2% Aerospace, 0.7% Media, 0.6% Publishing, 0.5% Consumer Goods, 0.2% Storage Facility, 0.2% Professional, 0.0% Pro Forma Portfolio Increases to 27 Distinct Industries. Industries Focus on Essential Community Goods and Servicesâ
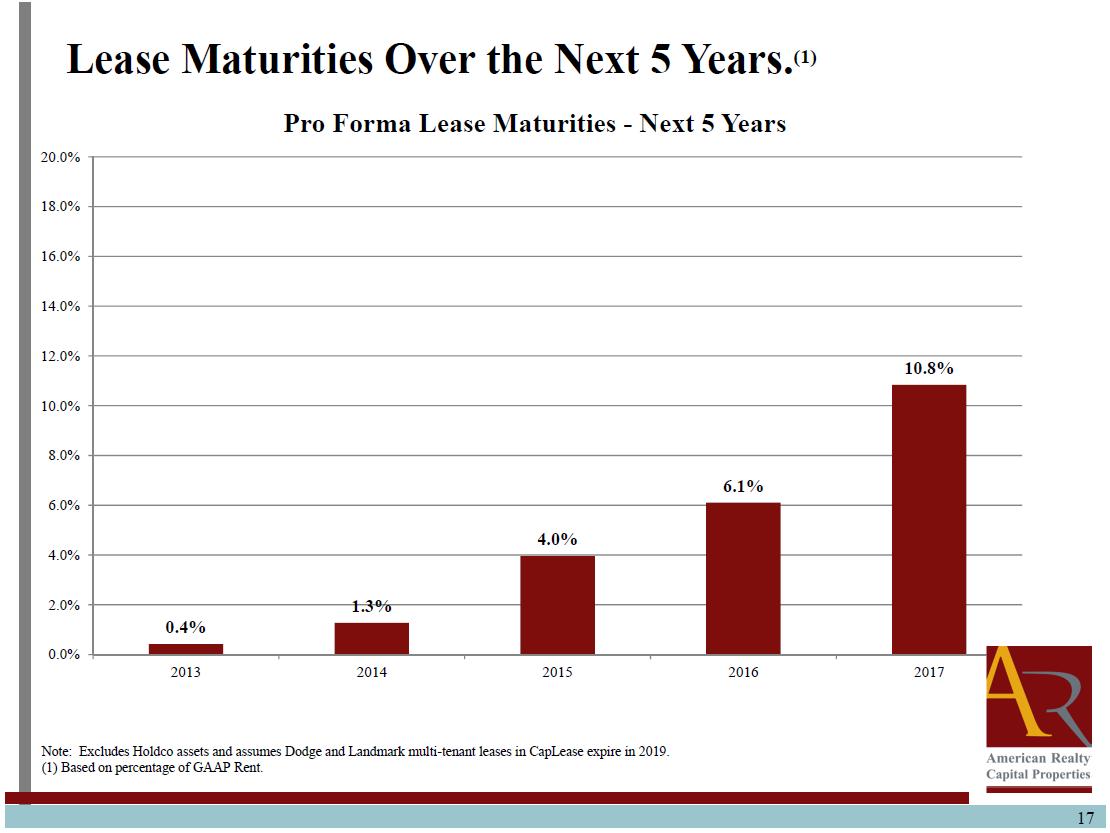
17 17 0.4% 1.3% 4.0% 6.1% 10.8% 0.0% 2.0% 4.0% 6.0% 8.0% 10.0% 12.0% 14.0% 16.0% 18.0% 20.0% 2013 2014 2015 2016 2017 Pro Forma Lease Maturities - Next 5 Years Note: Excludes Holdco assets and assumes Dodge and Landmark multi-tenant leases in CapLease expire in 2019. (1) Based on percentage of GAAP Rent. Lease Maturities Over the Next 5 Years.(1)

18 ARCP is operated by a proven management team. Nicholas S. Schorsch Chairman & CEO • CEO of ARCP’s manager (ARC Properties Advisors) • Former Chairman & CEO of ARCT (acquired by Realty Income in January 2013) • Former CEO of American Financial Realty Trust (NYSE: AFR) • Two-Time Ernst & Young Entrepreneur of the Year Brian S. Block Chief Financial Officer • Chief Financial Officer of ARCP’s manager (ARC Properties Advisors) • Former Chief Financial Officer, American Realty Capital Trust • Former Chief Accounting Officer, American Financial Realty Trust (NYSE: AFR) • Former public accounting experience (Ernst & Young and Arthur Andersen) Edward M. Weil, Jr. President • President of ARCP’s manager (ARC Properties Advisors) • CEO of Realty Capital Securities • Former Senior VP, Sales & Leasing of American Financial Realty Trust (NYSE: AFR) Demonstrated value creation, deep knowledge of the portfolio, and superior public company and capital markets experience with over $15 billion of real estate acquisitions in the last decade Supported by a team of over 95 real estate professionals Asset Management Property Management Accounting Legal Human Resources Capital Markets Originations Underwriting Due Diligence Financing Investor Relations

19 ARCP¡¦s management structure brings significant benefits to shareholders. „« Largest U.S. buyer of net lease real estate „«Vertically integrated team of 95 real estate professionals „« Efficient operational, legal and administrative support „« Strong, consistent track record in net lease space „« Lower fees and expenses „« Performance based management compensation Scale and expertise generate better execution at lower costs
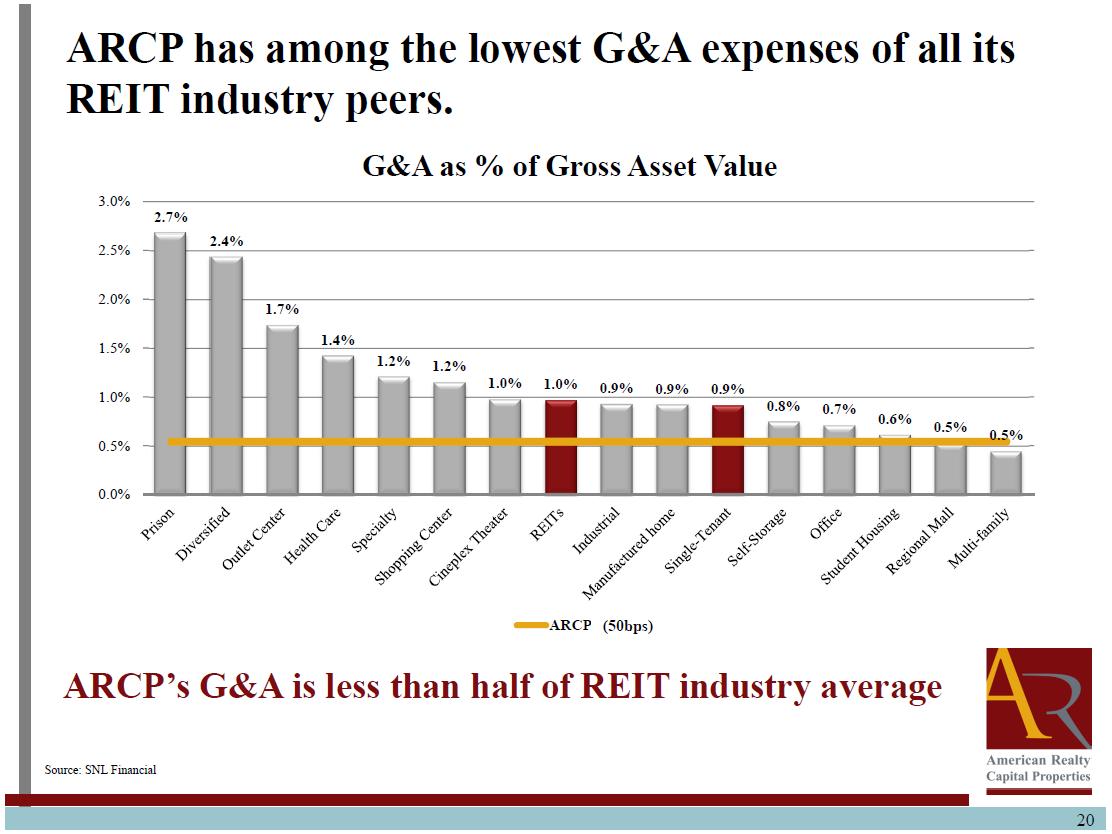
20 2.7% 2.4% 1.7% 1.4% 1.2% 1.2% 1.0% 1.0% 0.9% 0.9% 0.9% 0.8% 0.7% 0.6% 0.5% 0.5% 0.0% 0.5% 1.0% 1.5% 2.0% 2.5% 3.0% G&A as % of Gross Asset Value ARCP (3bp) ARCP’s G&A is less than half of REIT industry average ARCP has among the lowest G&A expenses of all its REIT industry peers. Source: SNL Financial (50bps)

21 ARCP offers investors significant benefits. Unique Strategy: Unlike any competitor, ARCP acquires both long and mid-duration leases Stable Income Plus Growth: ARCP offers a well-diversified net lease portfolio with high credit quality tenants, long-weighted and mid-weighted average lease terms and growth potential Significant Size and Scale: 3rd largest listed net lease REIT by square footage „Ï Access to public capital markets and eligible for index inclusions to support growth(1) „Ï Able to lower cost of capital with investment grade rating „Ï Larger REITs tend to deliver stronger performance, trade at better multiples Financial Flexibility: Low borrowing costs, significant liquidity to fund accretive growth and well-laddered debt maturities Materially Lower Operating Costs: ARCP has a more efficient cost structure, having eliminated acquisition and financing fees, reduced management fees and benefiting from economies of scale Expert Management Team: Experienced, expert management team that assembled and managed the real estate portfolio 1 2 3 4 5 6 (1) ARCP added to the MSCI US REIT Index on May 31, 2013, effective June 3, 2013.

22 Experienced Senior Management • Experience in managing public companies with combined enterprise value over $20 billion • Constructed both ARCP and ARCT III from scratch Best-In-Class Portfolio • High quality properties, ‘Main & Main’ locations, strong tenant roster and brand identity • Stable income with outsized growth potential • Diversified by tenant, industry and geography Value Proposition Durable Dividends, Principal Protection Outsized Growth Potential Strong, Flexible Balance Sheet • Low leverage • Low cost capital • Financial capacity • Financial flexibility ARCP offers a compelling value proposition.

23 ARCP considers funds from operations (“FFO”) and AFFO, which is FFO as adjusted to exclude acquisition-related fees and expenses, amortization of above-market lease assets and liabilities, amortization of deferred financing costs, straight-line rent, noncash mark-to-market adjustments, amortization of restricted stock, non-cash compensation and gains and losses useful indicators of the performance of a real estate investment trust (“REIT”). Because FFO calculations exclude such factors as depreciation and amortization of real estate assets and gains or losses from sales of operating real estate assets (which can vary among owners of identical assets in similar conditions based on historical cost accounting and useful-life estimates), they facilitate comparisons of operating performance between periods and between other REITs in our peer group. Accounting for real estate assets in accordance with generally accepted accounting principles (“GAAP”) implicitly assumes that the value of real estate assets diminishes predictably over time. Since real estate values have historically risen or fallen with market conditions, many industry investors and analysts have considered the presentation of operating results for real estate companies that use historical cost accounting to be insufficient by themselves. FFO and AFFO are not in accordance with, or a substitute for, measures prepared in accordance with GAAP, and may be different from non-GAAP measures used by other companies. In addition, FFO and AFFO are not based on any comprehensive set of accounting rules or principles. Non-GAAP measures, such as FFO and AFFO, have limitations in that they do not reflect all of the amounts associated with ARCP's results of operations that would be reflected in measures determined in accordance with GAAP. These measures should only be used to evaluate ARCP's performance in conjunction with corresponding GAAP measures. Additionally, ARCP believes that AFFO, by excluding acquisition-related fees and expenses, amortization of above-market lease assets and liabilities, amortization of deferred financing costs, straight-line rent, non-cash mark-to-market adjustments, amortization of restricted stock, non-cash compensation and gains and losses, provides information consistent with management's analysis of the operating performance of the properties. By providing AFFO, ARCP believes it is presenting useful information that assists investors and analysts to better assess the sustainability of our operating performance. Further, ARCP believes AFFO is useful in comparing the sustainability of our operating performance with the sustainability of the operating performance of other real estate companies, including exchange-traded and non-traded REITs. As a result, ARCP believes that the use of FFO and AFFO, together with the required GAAP presentations, provide a more complete understanding of our performance relative to our peers and a more informed and appropriate basis on which to make decisions involving operating, financing, and investing activities. Funds from Operations and Adjusted Funds from Operations

Forward-Looking Statements Information set forth herein (including information included or incorporated by reference herein) contains “forward-looking statements” (as defined in Section 21E of the Securities Exchange Act of 1934, as amended), which reflect ARCP's expectations regarding future events. The forward-looking statements involve a number of risks, uncertainties and other factors that could cause actual results to differ materially from those contained in the forward-looking statements. Such forward-looking statements include, but are not limited to, ARCP’s plans, market and other expectations, objectives, intentions, as well as any expectations or projections with respect to ARCP, including regarding future dividends and market valuations, and estimates of growth, including funds from operations and adjusted funds from operations, and other statements that are not historical facts. The following additional factors, among others, could cause actual results to differ from those set forth in the forward-looking statements: market volatility, unexpected costs or unexpected liabilities that may arise from the transaction; the inability to retain key personnel; continuation or deterioration of current market conditions; whether or not ARCP common stock will be included in REIT and public exchange indices; uncertainty regarding the level of demand for ARCP common stock that inclusion in such indices would generate; future regulatory or legislative actions that could adversely affect ARCP; and the business plans of the tenants of ARCP. Additional factors that may affect future results are contained in ARCP's filings with the SEC, which are available at the SEC's website at www.sec.gov. ARCP disclaims any obligation to update and revise statements contained in these materials based on new information or otherwise. 2244