Attached files
| file | filename |
|---|---|
| EX-23.1 - EXHIBIT 23.1 - TECOGEN INC. | v346572_ex23-1.htm |
As filed with the Securities and Exchange Commission on June 3, 2013
Registration No. 333 -
UNITED STATES SECURITIES AND EXCHANGE COMMISSION
Washington, DC 20549
Form S-1
REGISTRATION STATEMENT UNDER THE SECURITIES ACT OF 1933
Tecogen Inc.
(Exact name of registrant as specified in its charter)
| Delaware | 3585 | 04-3536131 |
| (State or other jurisdiction of incorporation or organization) |
(Primary Standard Industrial Classification Code Number) |
(I.R.S. Employer Identification Number) |
| Tecogen Inc. 45 First Avenue Waltham, MA 02451 (781) 622-1120 (Address, including zip code, and telephone number, including area code, of registrant’s principal executive offices) |
John N. Hatsopoulos Chief Executive Officer Tecogen Inc. 45 First Avenue Waltham, MA 02451 (781) 622-1120/Fax: (781) 622-1027 (Name, address, including zip code, and telephone number, including area code, of agent for service) |
Copy to:
|
Edwin L. Miller Jr. Boston, MA 02109 (617) 338-2800/Fax: (617) 338-2880 |
John D. Hogoboom Lowenstein Sandler LLP 1251 Avenue of the Americas New York, NY 10020 (646) 414-6846/Fax: (973) 597-2300 |
Approximate date of commencement of proposed sale to the public: As soon as practicable after the effective date hereof.
If any of the securities being registered on this form are to be offered on a delayed or continuous basis pursuant to Rule 415 under the Securities Act, check the following box. ¨
If this form is filed to register additional securities for an offering pursuant to Rule 462(b) under the Securities Act, check the following box and list the Securities Act registration statement number of the earlier effective registration statement for the same offering. ¨
If this form is a post-effective amendment filed pursuant to Rule 462(c) under the Securities Act, check the following box and list the Securities Act registration statement number of the earlier effective registration statement for the same offering. ¨
If this form is a post-effective amendment filed pursuant to Rule 462(d) under the Securities Act, check the following box and list the Securities Act registration statement number of the earlier effective registration statement for the same offering. ¨
Indicate by check mark whether the registrant is a large accelerated filer, an accelerated filer, a non-accelerated filer, or a smaller reporting company. ¨
| Large accelerated filer: ¨ | Accelerated filer: ¨ | Non-accelerated filer: ¨ | Smaller reporting company:x |
CALCULATION OF REGISTRATION FEE
| Title of
Each Class of Securities to be Registered | Proposed Maximum Aggregate Offering Price(1)(2) | Amount of Registration Fee | ||||||
| Common Stock, par value $0.001 per share | $ | 25,000,000 | $ | 3,410 | ||||
1 Estimated solely for the purpose of calculating the registration fee pursuant to Rule 457(o) under the Securities Act.
2 Including shares of common stock which may be purchased by the underwritters to cover over-allotments, if any.
The registrant hereby amends this registration statement on such date or dates as may be necessary to delay its effective date until the registrant shall file a further amendment which specifically states that this registration statement shall thereafter become effective in accordance with Section 8(a) of the Securities Act of 1933, as amended, or until this registration statement shall become effective on such date as the Commission, acting pursuant to said Section 8(a), may determine.
The information in this preliminary prospectus is not complete and may be changed. We may not sell these securities until the registration statement filed with the Securities and Exchange Commission is effective. This preliminary prospectus is not an offer to sell these securities and it is not soliciting an offer to buy these securities in any state or other jurisdiction where the offer or sale is not permitted.
SUBJECT TO COMPLETION, DATED JUNE 3, 2013
PRELIMINARY PROSPECTUS
Shares

Tecogen Inc.
Common Stock
This is the initial public offering of shares of our common stock. We are offering shares of common stock. Prior to this offering, there has been no public market for our common stock. We expect that the initial public offering price will be between $ and $ per share.
We have applied to list our common stock on the NASDAQ Capital Market under the symbol “TGEN.”
We are an “emerging growth company,” as that term is used in the Jumpstart Our Business Startups Act of 2012, or JOBS Act, and, as such, have elected to comply with certain reduced public company reporting requirements for this prospectus and future filings. See “Prospectus Summary – Implications of Being an Emerging Growth Company.”
Investing in our common stock involves a high degree of risk. See “Risk Factors” beginning on page 7 of this prospectus for a discussion of information that should be considered in connection with an investment in our common stock.
Neither the Securities and Exchange Commission, or the SEC, nor any state securities commission has approved or disapproved these securities or determined if this prospectus is truthful or complete. Any representation to the contrary is a criminal offense.
| Per Share | Total | |||||||
| Initial public offering price | $ | $ | ||||||
| Underwriting discounts and commissions | $ | $ | ||||||
| Proceeds to us (before expenses) | $ | $ | ||||||
See “Underwriting” for a description of the compensation payable to the underwriters.
We have granted a 30-day option to the underwriters to purchase up to additional shares on the same terms and conditions set forth above solely to cover over-allotments, if any.
The underwriters expect to deliver the shares offered hereby through the facilities of the Depository Trust Company on or about , 2013.
Joint Bookrunning Managers
| NORTHLAND CAPITAL MARKETS | SCARSDALE EQUITIES |
The date of this prospectus is , 2013.
TABLE OF CONTENTS
| Page | |
| Prospectus Summary | 1 |
| The Offering | 4 |
| Summary Consolidated Financial Data | 5 |
| Risk Factors | 7 |
| Special Note Regarding Forward-Looking Statements | 17 |
| Use of Proceeds | 18 |
| Dividend Policy | 18 |
| Capitalization | 19 |
| Dilution | 20 |
| Selected Consolidated Financial Data | 21 |
| Management’s Discussion and Analysis of Financial Condition and Results of Operations | 23 |
| Business | 33 |
| Management and Governance | 55 |
| Executive Officer and Director Compensation | 60 |
| Certain Relationships and Related Transactions | 66 |
| Security Ownership of Certain Beneficial Owners and Management | 70 |
| Description of Our Capital Stock | 71 |
| Shares Eligible for Future Sale | 73 |
| Underwriting | 75 |
| Legal Matters | 80 |
| Experts | 80 |
| Where You Can Find Additional Information | 80 |
| Index of Financial Statements | F-1 |
You should rely only on the information contained in this prospectus and any free writing prospectus prepared by or on behalf of us or to which we have referred you. We have not authorized anyone to provide you with information that is different. We are offering to sell our common stock, and seeking offers to buy our common stock, only in jurisdictions where offers and sales are permitted. The information in this prospectus is accurate only as of the date of this prospectus, regardless of the time of delivery of this prospectus or any sale of our common stock.
Until and including , 25 days after the date of this prospectus, all dealers that buy, sell or trade our common stock, whether or not participating in this offering, may be required to deliver a prospectus. This is in addition to the dealer’s obligation to deliver a prospectus when acting as an underwriter and with respect to unsold allotments or subscriptions.
For investors outside of the United States: Neither we nor any of the underwriters have done anything that would permit this offering or possession or distribution of this prospectus in any jurisdiction where action for that purpose is required, other than in the United States. You are required to inform yourselves about and to observe any restrictions relating to this offering and the distribution of this prospectus.
In this prospectus, unless the context otherwise requires, “Tecogen,” “Company,” “we,” “us,” or “our,” refer to Tecogen Inc. and its subsidiary.
This prospectus includes statistical, market, and industry data and forecasts that we obtained from publicly available information and independent industry publications and reports that we believe to be reliable sources. These publicly available industry publications and reports generally state that they obtain their information from sources that they believe to be reliable, but they do not guarantee the accuracy or completeness of the information. Although we believe that these sources are reliable, we have not independently verified the information contained in such publications.
| i |
PROSPECTUS SUMMARY
The following summary highlights information contained elsewhere in this prospectus. It is not complete and does not contain all of the information that you should consider before investing in our common stock. You should read the entire prospectus carefully, especially the risks of investing in our common stock discussed under “Risk Factors” and our consolidated financial statements and accompanying notes.
Company Overview
Tecogen designs, manufactures, sells, and services systems that produce electricity, hot water, and air conditioning for commercial installations and buildings and industrial processes. Our systems, powered by natural gas engines, drive electricity generators or compressors, which reduce the amount of electricity purchased from local utilities. Because our systems are designed to capture waste engine heat, they tend to be more energy efficient since otherwise-wasted energy can be used for water heating, space heating and/or air conditioning. The relative costs of natural gas and electricity at a proposed system site determine whether a system is economically efficient as well as energy efficient. This type of cogeneration technology is referred to as combined heat and power, or CHP.
Tecogen manufactures three types of CHP products:
| · | Cogeneration units that supply electricity and hot water; |
| · | Chillers that provide air-conditioning and hot water; and |
| · | High-efficiency water heaters. |
All of our products are standardized, modular, small-scale CHP products that reduce energy costs, carbon emissions, and dependence on the electric grid. Market drivers include the price of natural gas, local electricity costs, and governmental energy policies, as well as customers’ desire to become more socially responsible. Traditional customers for our cogeneration and chiller systems include hospitals and nursing homes, colleges and universities, health clubs and spas, hotels and motels, office and retail buildings, food and beverage processors, multi-unit residential buildings, laundries, ice rinks, swimming pools, factories, municipal buildings, and military installations; however, the economic feasibility of using our systems is not limited to these customer types. We have shipped approximately 2,000 units, some of which have been operating for almost 25 years. We have 66 full-time employees and 3 part-time employees, including 6 sales and marketing personnel and 39 service personnel.
Our Technology
Our CHP technology uses low-cost, mass-produced engines manufactured by General Motors Company, or GM, or Ford Motor Company, or Ford, which we modify to run on natural gas. Because our systems are fueled by natural gas, they typically produce lower levels of “criteria” air pollutants (those that are regulated by the Environmental Protection Agency, or EPA, because they can harm human health and the environment) compared with systems fueled by propane, gasoline, distillates, or residual fuel oil. We offer our new advanced emission system, Ultra, as an option in our CHP systems. With Ultra, our CHP products have achieved emission levels that qualify under strict existing and proposed California emission standards. Other emerging technologies, such as fuel cells, may also meet those standards, but we are not aware that any appear economically viable at this time.
Our products are designed as compact modular units that are intended to be applied in multiples when utilized for larger CHP plants. Approximately 68% of our CHP modules are installed in multi-unit sites ranging up to 12 units. This approach has significant advantages over utilizing single, larger units, such as building placement in constrained urban settings and redundancy during service outages. Redundancy is particularly relevant in regions where the electric utility has formulated tariff structures that have high “peak demand” charges. Such tariffs are common in many areas of the United States, and are applied by such utilities as Southern California Edison, Pacific Gas and Electric, Consolidated Edison of New York, and National Grid of Massachusetts. Because these tariffs assess customers’ peak monthly demand charge over a very short interval (typically only 15 minutes), a brief service outage for a system comprised of a single unit is highly detrimental to the monthly savings of the system. For multiple unit sites, a full system outage is less likely and consequently these customers have a greater probability of capturing peak demand savings.
Our in-licensed microgrid technology enables our InVerde CHP product to provide backup power in the event of power outages that may be experienced by local, regional, or national grids.
| 1 |
Our 65%-owned subsidiary Ilios, Inc., which does business under the name Ilios Dynamics in Massachusetts, or Ilios, has developed and distributes a line of high-efficiency water heaters. Ilios technology is designed to capture available energy in the environment due to ambient temperature differences. The physical laws of thermodynamics determine the portion of this available energy that can be theoretically captured. If the cost of capturing a portion of that available energy is less than the value of that energy, additional system efficiencies may be obtained. Thus, Ilios systems in certain cases may be more efficient than conventional boilers in commercial installations and industrial processes.
Markets, Customers, and Suppliers
Our CHP products are sold directly to customers by our in-house marketing team and by established sales agents and representatives, including American DG Energy Inc., or American DG Energy, and EuroSite Power Inc., or EuroSite Power, which are affiliated companies. Our principal engine supplier is GM, and the other principal components of our CHP systems are also mass-produced. Other than service revenue, our products generally do not produce recurring revenue as they typically constitute a one-time capital expenditure by a customer. We do not consider ourselves dependent on one or a few customers, including our affiliated customers, American DG Energy and EuroSite Power. We strive to obtain long-term services contracts for the products we manufacture through our factory-owned service centers in California, the Midwest, and the Northeast United States. Between 2007 and 2012, approximately 68% of our installations also included service contracts.
Strategy
While we believe that our products and services provide efficient solutions to customers throughout the United States and around the world, our strategy for increased revenue and profitability is to expand our operations in our existing territories where we perceive the demand for our products and services is strongest, and where our products have particular advantages over our competition. Specifically, our CHP systems provide energy-efficient power with technically superior emissions control, while also serving as backup power that may allow customers in some areas to provide surplus power to an electrical grid. Our sales and technical staff operate from our existing service centers in California and the Northeast. These regions have strict emissions regulations, which favor our products equipped with our Ultra low-emission technology. Also, these regions have high peak demand rates, which favor utilization of our modular units in groups so as to assure redundancy and peak demand savings, as discussed above. Some of these regions also have generous rebates that improve the economic viability of our systems. We will also focus on customers that value our microgrid technology that enables the CHP plant to serve the facility to provide backup power during outages. Our sales staff will support our existing sales channels, but will also focus on selling complete design and installation services for customers in these regions. We believe that these design and build services, or turnkey services, will expand our sales significantly because they increase revenue per unit sale substantially, as they include the portion of the sale related to installation. We believe that turnkey installation services will improve our service contract retention from its current rate of 68% between 2007 and 2012, to a near universal proportion. Moreover, we see the turnkey model as a vehicle to expand our service offering to customers to include portions of the system outside of our factory produced module that may improve the long-term operation of the CHP plant. Such items might include ancillary pumps, controls, and heat exchangers, among other components.
Our business model of establishing satellite service, sales, and installation centers will be our strategy in emerging domestic markets such as the mid-Atlantic region and areas in the Midwest. For our overseas markets we will continue to develop regional allies for sales and service, such as EuroSite Power in the United Kingdom, and our analogous allies in other international markets such as Mexico and Australia.
In markets we have identified to focus our attention, we will continue our strategy of engaging the consulting engineering community through direct contact and also through engineering societies and trade shows. Our sales staff will engage building owners and their management companies to explain the energy-efficient products and solutions we offer with the goal of providing comprehensive turnkey installations.
Risks Associated with Our Business
Our business is subject to a number of risks of which you should be aware before making an investment decision. These risks are discussed more fully in the “Risk Factors” section of this prospectus immediately following this prospectus summary. These risks include, but are not limited to, the following:
History of Operating Losses. For each of our last five fiscal years and prior thereto, we have incurred annual operating losses. We expect this trend to continue until such time that we can sell a sufficient number of systems and achieve a cost structure to become profitable, which may be several years. We may not have adequate cash resources to reach the point of profitability, and we may never become profitable. Even if we do achieve profitability, we may be unable to increase our sales and sustain or increase our profitability in the future.
| 2 |
Dependence on Key Suppliers. We rely on a small number of key suppliers, and the loss one of them could materially and adversely affect our business. Further, from time to time, shipments to us of key system components can be delayed because of industry-wide or other shortages, and the components we receive may not meet our quality or cost requirements.
Dependence on Technology Development. Our products incorporate proprietary technology, and our future success will depend upon our ability to continue to develop and provide innovative products and product enhancements. The introduction of products embodying new technologies, and the shifting of customer demands or changing industry standards, could render our existing products obsolete and unmarketable.
Changes in governmental regulation could adversely affect us. We operate in a highly regulated business environment, and changes in regulation could impose significant costs on us or could make our products less economical.
The economic viability of our projects depends on the price spread between fuel and electricity. Variability of the price spread between fuel and electricity creates a risk that our projects will not be economically viable and that potential customers will avoid such energy price risks.
There has been a material weakness in our disclosure controls and procedures and in our internal control over financial reporting. Although we consider the size of our accounting staff sufficient to meet our business needs, a need for improved controls and procedures surrounding technical accounting practices, information technology, and financial reporting currently exists.
Our chief executive officer and chief financial officer have responsibilities to affiliated companies. Our key executives spend a significant portion of their time performing management functions for one or more of our affiliated companies. John N. Hatsopoulos is the Company’s Chief Executive Officer and is also the Chief Executive Officer of American DG Energy. In the past Mr. Hatsopoulos has spent approximately 50% of his business time on the affairs of the Company. Although such amount varies widely depending on the needs of the business, he has actively fulfilled all his duties as the Company’s CEO and feels confident that he will be able to continue fulfilling such duties in the future. Bonnie Brown is the Company’s Chief Financial Officer and is also Chief Financial Officer of Ilios, the Company’s majority-owned subsidiary.
Implications of Being an Emerging Growth Company
We are an “emerging growth company,” as that term is used in the JOBS Act and, for as long as we continue to be an “emerging growth company,” we may choose to take advantage of exemptions from various reporting requirements applicable to other public companies but not to “emerging growth companies,” including, but not limited to, not being required to comply with the auditor attestation requirements of Section 404 of the Sarbanes-Oxley Act of 2002, or the Sarbanes-Oxley Act, reduced disclosure obligations regarding executive compensation in our periodic reports and proxy statements, and exemptions from the requirements of holding a nonbinding advisory vote on executive compensation and stockholder approval of any golden parachute payments not previously approved. We could be an “emerging growth company” for up to five years, or until the earliest of (i) the last day of the fiscal year during which our total annual gross revenues equal or exceed $1 billion (subject to adjustment for inflation), (ii) the last day of the fiscal year following the fifth anniversary of our initial public offering, (iii) the date on which we have, during the previous three-year period, issued more than $1 billion in non-convertible debt, or (iv) the date on which we are deemed a large accelerated filer under the Securities Exchange Act of 1934, or the Exchange Act. We are choosing to “opt out” of the extended transition periods available under the JOBS Act for complying with new or revised accounting standards, and intend to take advantage of the other exemptions.
Corporate History
Tecogen began in the early 1960s as a research division of Thermo Electron Corporation, now Thermo Fisher Scientific Inc., which is a publicly traded company listed on the NYSE under the symbol TMO. In 2000, Tecogen was sold to private investors including Thermo Electron’s original founders, Dr. George N. Hatsopoulos and John N. Hatsopoulos.
We were incorporated in the State of Delaware on September 15, 2000. Our offices are located at 45 First Avenue, Waltham, Massachusetts 02451. Our telephone number is 781-466-6400. Our Internet address is http://www.tecogen.com. The information on, or that may be accessed through, our website is not incorporated by reference into this prospectus and should not be considered a part of this prospectus.
| 3 |
THE OFFERING
| Common Stock offered by Tecogen: | shares | |
| Common Stock to be outstanding after this offering: | shares | |
| Overallotment Option: | shares | |
| Use of proceeds: |
We estimate that we will receive net proceeds of approximately $ million from the sale of the shares of common stock offered in this offering, or approximately $ million if the underwriters exercise their overallotment option in full, based on an assumed initial public offering price of $ per share (the midpoint of the price range set forth on the cover page of this prospectus) and after deducting the estimated underwriting discount and estimated offering expenses payable by us. We intend to use the net proceeds of this offering to pay off outstanding debt, for working capital and general corporate purposes, including expanding our turnkey business, constructing a dedicated manufacturing facility for Ilios, expanding our low emission technology to other markets, and continuing product development. | |
| Proposed NASDAQ Capital Market symbol: | TGEN |
Unless we indicate otherwise, common stock outstanding after this offering is based on 13,611,974 shares of our common stock outstanding as of March 31, 2013, and excludes as of that date the following:
| · | 1,096,500 shares of common stock issuable upon the exercise of stock options outstanding prior to this offering under our stock incentive plan, at a weighted average exercise price of $1.96 per share; |
| · | 135,183 shares of common stock available for future grants under our stock incentive plan; |
| · | 75,806 shares of common stock issuable pursuant to convertible debentures with an outstanding principal amount of $90,967 and a conversion price of $1.20 per share; and |
| · | shares of common stock issuable if the underwriters exercise their option to purchase additional shares. |
Except as otherwise noted, all information in this prospectus and the number of shares outstanding as of March 31, 2013:
| · | gives retroactive effect to a one-for-four reverse stock split effective May 17, 2013; |
| · | assumes no exercise of outstanding options or warrants or conversion of convertible securities; and |
| · | assumes no exercise by the underwriters of their over-allotment option to purchase additional shares of common stock from us. |
| 4 |
SUMMARY CONSOLIDATED FINANCIAL DATA
The summary consolidated statements of operations data for each of the years ended December 31, 2012, 2011, and 2010 and the summary consolidated balance sheet data as of December 31, 2012, have been derived from our audited consolidated financial statements that are included elsewhere in this prospectus. The summary consolidated statement of operations data for the three months ended March 31, 2013 and 2012, and the consolidated balance sheet data as of March 31, 2013, have been derived from our unaudited condensed consolidated financial statements included elsewhere in this prospectus. The unaudited condensed consolidated financial statements were prepared on the same basis as our audited financial statements. In our opinion, such financial statements include all adjustments, consisting only of normal recurring adjustments that we consider necessary for a fair presentation of the financial information set forth in those statements.
You should read this information together with the consolidated financial statements and related notes and other information under “Management’s Discussion and Analysis of Financial Condition and Results of Operations” included elsewhere in this prospectus.
| Year Ended | Three Months Ended | |||||||||||||||||||
| December 31, | March 31, | |||||||||||||||||||
| Consolidated Statement of Operations Data: | 2012 | 2011 | 2010 | 2013 | 2012 | |||||||||||||||
| (audited) | (audited) | (audited) | (unaudited) | (unaudited) | ||||||||||||||||
| Revenues | $ | 15,253,972 | $ | 11,065,210 | $ | 11,311,229 | $ | 4,046,318 | $ | 3,252,528 | ||||||||||
| Cost of sales | 9,388,898 | 6,179,098 | 6,597,205 | 2,934,354 | 1,837,973 | |||||||||||||||
| Gross profit | 5,865,074 | 4,886,112 | 4,714,024 | 1,111,964 | 1,414,555 | |||||||||||||||
| Operating expenses | ||||||||||||||||||||
| General and administrative | 6,643,120 | 5,986,762 | 4,973,794 | 1,791,703 | 1,684,744 | |||||||||||||||
| Selling | 1,225,580 | 782,252 | 290,505 | 279,370 | 267,929 | |||||||||||||||
| 7,868,700 | 6,769,014 | 5,264,299 | 2,071,073 | 1,952,673 | ||||||||||||||||
| Loss from operations | (2,003,626 | ) | (1,882,902 | ) | (550,275 | ) | (959,109 | ) | (538,118 | ) | ||||||||||
| Other income (expense) | ||||||||||||||||||||
| Interest and other income | 48,397 | 38,402 | 23,574 | 3,946 | 14,772 | |||||||||||||||
| Interest expense | (71,208 | ) | (40,294 | ) | (37,280 | ) | (23,377 | ) | (17,802 | ) | ||||||||||
| (22,811 | ) | (1,892 | ) | (13,706 | ) | (19,431 | ) | (3,030 | ) | |||||||||||
| Loss before income taxes | (2,026,437 | ) | (1,884,794 | ) | (563,981 | ) | (978,540 | ) | (541,148 | ) | ||||||||||
| Consolidated net loss | (2,026,437 | ) | (1,884,794 | ) | (563,981 | ) | (978,540 | ) | (541,148 | ) | ||||||||||
| Less: Loss attributable to the noncontrolling interest | 389,480 | 310,293 | 208,673 | 118,147 | 102,835 | |||||||||||||||
| Net loss attributable to Tecogen Inc. | $ | (1,636,957 | ) | $ | (1,574,501 | ) | $ | (355,308 | ) | $ | (860,393 | ) | $ | (438,313 | ) | |||||
| Net loss per share - basic and diluted | $ | (0.12 | ) | $ | (0.13 | ) | $ | (0.03 | ) | $ | (0.07 | ) | $ | (0.03 | ) | |||||
| Weighted average shares outstanding - | ||||||||||||||||||||
| basic and diluted | 13,135,072 | 12,052,914 | 11,470,658 | 13,212,894 | 13,015,154 | |||||||||||||||
| 5 |
| As of December 31, 2012 | As of March 31, 2013 | |||||||||||||||
| Consolidated Balance Sheet Data: | (audited) | (unaudited) | ||||||||||||||
| Actual | Actual | Pro Forma(1) | Pro Forma As Adjusted(2) | |||||||||||||
| Cash and cash equivalents | $ | 1,572,785 | $ | 680,676 | $ | 680,676 | $ | |||||||||
| Short-term investments | 181,859 | 182,061 | 182,061 | |||||||||||||
| Working capital | 4,078,704 | 2,583,135 | 2,674,102 | |||||||||||||
| Total assets | 9,117,249 | 9,376,689 | 9,376,689 | |||||||||||||
| Total liabilities | 4,334,214 | 5,514,556 | 5,423,589 | |||||||||||||
| Stockholders’ equity | $ | 4,783,035 | $ | 3,862,133 | $ | 3,953,100 | $ | |||||||||
| (1) | The pro forma consolidated balance sheet data in the table above give effect to conversion of convertible debentures with an outstanding principal amount of $90,967 upon the closing of this offering. | |
| (2) | The pro forma as adjusted consolidated balance sheet data in the table above give effect to our receipt of the estimated net proceeds to us from this offering at an assumed initial public offering price of $ per share, which is the midpoint of the range listed on the cover page of this prospectus, after deducting estimated underwriting discounts and commissions and estimated offering expenses payable by us. |
| 6 |
RISK FACTORS
The shares of common stock offered hereby are highly speculative and should be purchased only by persons who can afford to lose their entire investment. You should carefully consider the following risk factors and other information in this prospectus before deciding to purchase our common stock. If any of the following risks actually occur, our business and financial results could be negatively affected to a significant extent.
Risks Relating to Our Business
Our business faces many risks. If any of the events or circumstances described in the following risks occur, our business, financial condition, or results of operations could suffer and the trading price of our common stock (if and when it becomes publicly traded) could decline. Investors and prospective investors should consider the following risks and the information contained under the heading “Special Note Concerning Forward-Looking Statements” before deciding whether to invest in our common stock.
Our operating history is characterized by net losses. We anticipate incurring further losses, and we may never become profitable.
For each of our last five fiscal years and prior thereto, we have incurred annual operating losses. We expect this trend to continue until such time that we can sell a sufficient number of systems and achieve a cost structure to become profitable. We may not have adequate cash resources to reach the point of profitability, and we may never become profitable. Even if we do achieve profitability, we may be unable to increase our sales and sustain or increase our profitability in the future.
We experience significant fluctuations in revenues from quarter to quarter due to a preponderance of one-time sales.
We have low volume, high dollar sales for projects that are generally non-recurring, and therefore our sales have fluctuated significantly from period to period. For example, when compared to the previous quarter, our revenues in 2010 decreased during the first, second and fourth quarters and increased during the third quarter. In 2011, our revenues decreased during the first and fourth quarters and increased during the second and third quarters. In 2012, our revenues increased during the first, second and fourth quarters and decreased during the third quarter. Fluctuations cannot be predicted because they are affected by the purchasing decisions and timing requirements of our customers, which are unpredictable.
We may be unable to fund our future operating requirements, which could force us to curtail our operations.
To the extent that our funds are insufficient to fund our future operating requirements, we would need to raise additional funds through further public or private equity or debt financings depending upon prevailing market conditions. These financings may not be available to us, or if available, may be on terms that are not favorable to us and could result in significant dilution to our stockholders and reduction of the trading price of our stock (if then publicly traded). The state of worldwide capital markets could also impede our ability to raise additional capital on favorable terms or at all. If adequate capital were not available to us, we likely would be required to significantly curtail our operations or possibly even cease our operations.
We believe that our existing resources, including cash and cash equivalents, future cash flows from operations and our working capital line of credit with John N. Hatsopoulos, our Chief Executive Officer, are sufficient to meet the working capital requirements of our existing business through 2013. After that our cash requirements may increase.
If we experience a period of significant growth or expansion, it could place a substantial strain on our resources.
If our cogeneration and chiller products penetrate the market rapidly, we would be required to deliver even larger volumes of technically complex products or components to our customers on a timely basis and at a reasonable costs to us. We have never ramped up our manufacturing capabilities to meet large-scale production requirements. If we were to commit to deliver large volumes of products, we may not be able to satisfy these commitments on a timely and cost-effective basis.
| 7 |
We are dependent on a limited number of third-party suppliers for the supply of key components for our products.
We use third-party suppliers for components in many of our products. Our engine supplier is GM. The generator supplier for our cogeneration products, other than the InVerde, is Marathon Electric. To produce air conditioning, our engines drive a compressor purchased from J&E Hall International. The loss of one of our suppliers could materially and adversely affect our business if we are unable to replace them. While alternate suppliers for the manufacture of our engine, generator, and compressor have been identified, should the need arise, there can be no assurance that alternate suppliers will be available and able to manufacture our engine, generator or compressor on acceptable terms.
From time to time, shipments can be delayed because of industry-wide or other shortages of necessary materials and components from third-party suppliers. A supplier’s failure to supply components in a timely manner, or to supply components that meet our quality, quantity, or cost requirements, or our inability to obtain substitute sources of these components on a timely basis or on terms acceptable to us, could impair our ability to deliver our products in accordance with contractual obligations.
We expect significant competition for our products and services.
Competition for our products is currently limited (see “Competitive Position and Business Conditions” in the “Business” section of this prospectus). Many of our competitors and potential competitors are well established and have substantially greater financial, research and development, technical, manufacturing, and marketing resources than we do. If these larger competitors decide to focus on the development of distributed power or cogeneration, they have the manufacturing, marketing, and sales capabilities to complete research, development, and commercialization of these products more quickly and effectively than we can. There can also be no assurance that current and future competitors will not develop new or enhanced technologies or more cost-effective systems, and therefore, there can be no assurance that we will be successful in this competitive environment.
The Executive Order to accelerate investments in industrial energy efficiency may lead to increased competition.
An Executive Order to accelerate investments in industrial energy efficiency, including CHP, was promulgated in August 2012. The goal of the Executive Order is to supply 40 gigawatts, or GW, of energy by 2020 from greater efficiency sources such as CHP systems. With this Executive Order, it is expected that a number of barriers to CHP development will be removed with effective programs, policies, and financing opportunities resulting in significant new capital investment in CHP. This initiative by the U.S. government may lead to increased competition in the CHP market.
If we are unable to maintain our technological expertise in design and manufacturing processes, we will not be able to successfully compete.
We believe that our future success will depend upon our ability to continue to develop and provide innovative products and product enhancements that meet the increasingly sophisticated needs of our customers.
However, this requires that we successfully anticipate and respond to technological changes in design and manufacturing processes in a cost-effective and timely manner. The development of new, technologically advanced products and enhancements is a complex and uncertain process requiring high levels of innovation, as well as the accurate anticipation of technological and market trends. There can be no assurance that we will successfully identify new product opportunities, develop and bring new or enhanced products to market in a timely manner, successfully lower costs, and achieve market acceptance of our products, or that products and technologies developed by others will not render our products or technologies obsolete or noncompetitive.
The introduction of products embodying new technologies, and the shifting of customer demands or changing industry standards, could render our existing products obsolete and unmarketable. We may experience delays in releasing new products and product enhancements in the future. Material delays in introducing new products or product enhancements may cause customers to forego purchases of our products and purchase those of our competitors.
Our intellectual property may not be adequately protected.
We seek to protect our intellectual property rights through patents, trademarks, copyrights, trade secret laws, confidentiality agreements, and licensing arrangements, but we cannot ensure that we will be able to adequately protect our technology from misappropriation or infringement. We cannot ensure that our existing intellectual property rights will not be invalidated, circumvented, challenged, or rendered unenforceable.
We have applied for and obtained patents on certain key components used in our products. Specifically, the Company holds two patents, both of which are utilized in our products. The first patent, from 2007, protects the incorporation of an inverter into an engine-driven CHP module and applies to our InVerde model. The second patent, also from 2007, pertains to algorithms used for combustion control in our engines. In addition, we have rights to a 2006 University of Wisconsin patent enabling us to use that patent’s microgrid control algorithms for our specific use: engine-based power generation fueled by natural gas and diesel for engines less than 500 kW in electric power output.
| 8 |
Our competitors may successfully challenge the validity of our patents, design non-infringing products, or deliberately infringe our patents. There can be no assurance that other companies are not investigating or developing other similar technologies. In addition, our intellectual property rights may not provide a competitive advantage to us or ensure that our products and technology will be adequately covered by our patents and other intellectual property. Any of these factors or the expiration, termination, or invalidity of one or more of our patents may have a material adverse effect on our business.
We have filed for patents for our Ultra low-emissions technology in the United States, Europe, Australia, Brazil, Canada, China, Costa Rica, India, Israel, Japan, Mexico, New Zealand, Republic of Korea, Singapore, and South Africa. The outcome of the patent office application review is important because this technology will apply to all of our gas engine-driven products and may have licensing application to other natural gas engines. There is no assurance, however, that the Ultra low-emissions patent applications will be approved.
Our control software is protected by copyright laws or under an exclusive license agreement. Further, we rely on treatment of our technology as trade secrets through confidentiality agreements, which our employees and vendors are required to sign. We also rely on non-disclosure agreements with others that have or may have access to confidential information to protect our trade secrets and proprietary knowledge. These agreements may be breached, and we may not have adequate remedies for any breach. Our trade secrets may also be or become known without breach of these agreements or may be independently developed by competitors. Failure to maintain the proprietary nature of our technology and information could harm our results of operations and financial condition.
Others may assert that our technology infringes their intellectual property rights.
We may be subject to infringement claims in the future. The defense of any claims of infringement made against us by third parties could involve significant legal costs and require our management to divert time from our business operations. If we are unsuccessful in defending any claims of infringement, we may be forced to obtain licenses or to pay additional royalties to continue to use our technology. We may not be able to obtain any necessary licenses on commercially reasonable terms or at all. If we fail to obtain necessary licenses or other rights, or if these licenses are costly, our operating results would suffer either from reductions in revenues through our inability to serve customers or from increases in costs to license third-party technologies.
Our success is dependent upon attracting and retaining highly qualified personnel and the loss of key personnel could significantly hurt our business.
To achieve success, we must attract and retain highly qualified technical, operational, and executive employees. The loss of the services of key employees or an inability to attract, train, and retain qualified and skilled employees, specifically engineering, operations, and business development personnel, could result in the loss of business or could otherwise negatively impact our ability to operate and grow our business successfully.
Our business is subject to product liability and warranty claims.
Our business exposes us to potential product liability claims, which are inherent in the manufacturing, marketing, and sale of our products, and we may face substantial liability for damages resulting from the faulty design or manufacture of products or improper use of products by end users. We currently maintain a moderate level of product liability insurance, but there can be no assurance that this insurance will provide sufficient coverage in the event of a claim. Also, we cannot predict whether we will be able to maintain such coverage on acceptable terms, if at all, or that a product liability claim would not harm our business or financial condition. In addition, negative publicity in connection with the faulty design or manufacture of our products would adversely affect our ability to market and sell our products.
We sell our products with warranties. There can be no assurance that the provision in our financial statements for estimated product warranty expense will be sufficient. We cannot ensure that our efforts to reduce our risk through warranty disclaimers will effectively limit our liability. Any significant occurrence of warranty expense in excess of estimates could have a material adverse effect on our operating results, financial condition, and cash flow. Further, we have at times undertaken programs to enhance the performance of units previously sold. These enhancements have at times been provided at no cost or below our cost. If we choose to offer such programs again in the future, such actions could result in significant costs.
| 9 |
Certain businesses and consumers might not consider cogeneration solutions as a means for obtaining their electricity and power needs.
Generating electricity and heat at the customers’ building (on-site CHP) is an established technology, but it is more complex than buying electricity from the utility and using a furnace for heat. Customers have been slow to accept on-site CHP in part because of this complexity. In addition, the development of a larger market for our products will be impacted by many factors that are out of our control, including cost competitiveness, regulatory requirements, and the emergence of newer and potentially better technologies and products. If a larger market for cogeneration technology in general and our products in particular fails to grow substantially, we may be unable to continue our business.
We operate in a highly regulated business environment, and changes in regulation could impose significant costs on us or could make our products less economical, thereby affecting demand for our products.
Several kinds of government regulations – at federal, state, and local levels and in other countries – affect our current and future business (see “Government Regulation and Its Effect on Our Business” in the “Business” section of this prospectus). Our products must comply with various local building codes and must undergo inspection by local authorities. Our products are also certified by a third party to conform to specific standards. These certifications require continuous verification by a company that monitors our processes and design every three months. Our InVerde product is also certified to Europe’s standard CE mark (European Conformity), which is mandatory for products imported into the European Union for commercial sale. If our products ceased to meet the criteria necessary for the applicable certifications, we may lose the ability to sell our products in certain jurisdictions, which may materially and adversely affect our business.
Regulatory agencies may further impose special requirements for the implementation and operation of our products that could significantly affect or even eliminate some of our target markets. We also may incur material costs or liabilities in complying with future government regulations. Furthermore, our potential utility customers must themselves comply with numerous laws and regulations, which may be complicated by further deregulation of the utility industry. We cannot determine how such deregulation may ultimately affect the market for our products. Changes in regulatory standards or policies could reduce the level of investment in the research and development of alternative power sources, including our products. Any reduction or termination of such programs could increase the cost to our potential customers, making our systems less desirable and thereby adversely affect our business and financial condition.
Utilities or governmental entities could hinder our entry into and growth in the marketplace, and we may not be able to effectively sell our products.
Utilities or governmental entities on occasion have placed barriers to the installation of our products or their interconnection with the electric grid, and they may continue to do so. Utilities may charge additional fees to customers who install on-site CHP and rely on the grid for back-up power. These types of restrictions, fees, or charges could make it harder for customers to install our products or use them effectively, as well as increasing the cost to our potential customers. This could make our systems less desirable, thereby adversely affecting our revenue and other operating results.
We may not achieve production cost reductions necessary to competitively price our products, which would adversely affect our sales.
We believe that we will need to reduce the unit production cost of our products over time to maintain our ability to offer competitively priced products. Our ability to achieve cost reductions will depend on our ability to develop low-cost design enhancements, to obtain necessary tooling and favorable supplier contracts, and to increase sales volumes so we can achieve economies of scale. We cannot assure you that we will be able to achieve any such production cost reductions. Our failure to do so could have a material adverse effect on our business and results of operations.
We have granted sales representation rights to an affiliated company, which restricts our distribution.
Our affiliates American DG Energy and EuroSite Power have certain exclusive sales representation rights to our cogeneration products only (not including chillers) and exclusive rights to our Ultra low-emissions technology if it is applied to engines from other CHP manufacturers in projects developed by American DG Energy (see the “Business” section of this prospectus). As a result of these agreements, we have limited control over our distribution of certain products in New England (Connecticut, Rhode Island, Massachusetts, New Hampshire, Vermont, and Maine), and this could have a material adverse effect on our business and results of operations.
| 10 |
Commodity market factors impact our costs and availability of materials.
Our products contain a number of commodity materials, from metals, which include steel, special high temperature alloys, copper, nickel, and molybdenum, to computer components. The availability of these commodities could impact our ability to acquire the materials necessary to meet our requirements. The cost of metals has historically fluctuated. The pricing could impact the costs to manufacture our products. If we are not able to acquire commodity materials at prices and on terms satisfactory to us or at all, our operating results may be materially adversely affected.
Our products involve a lengthy sales cycle and we may not anticipate sales levels appropriately, which could impair our results of operations.
The sale of our products typically involves a significant commitment of capital by customers, with the attendant delays frequently associated with large capital expenditures. For these and other reasons, the sales cycle associated with our products is typically lengthy and subject to a number of significant risks over which we have little or no control. We expect to plan our production and inventory levels based on internal forecasts of customer demand, which is highly unpredictable and can fluctuate substantially. If sales in any period fall significantly below anticipated levels, our financial condition, results of operations, and cash flow would suffer. If demand in any period increases well above anticipated levels, we may have difficulties in responding, incur greater costs to respond, or be unable to fulfill the demand in sufficient time to retain the order, which would negatively impact our operations. In addition, our operating expenses are based on anticipated sales levels, and a high percentage of our expenses are generally fixed in the short term. As a result of these factors, a small fluctuation in timing of sales can cause operating results to vary materially from period to period.
The economic viability of our projects depends on the price spread between fuel and electricity, and the variability of these prices creates a risk that our projects will not be economically viable and that potential customers will avoid such energy price risks.
The economic viability of our CHP products depends on the spread between natural gas fuel and electricity prices. Volatility in one component of the spread, such as the cost of natural gas and other fuels (e.g., propane or distillate oil), can be managed to some extent by means of futures contracts. However, the regional rates charged for both base load and peak electricity may decline periodically due to excess generating capacity or general economic recessions.
Our products could become less competitive if electric rates were to fall substantially in the future. Also, potential customers may perceive the unpredictable swings in natural gas and electricity prices as an increased risk of investing in on-site CHP, and may decide not to purchase CHP products.
We are exposed to credit risks with respect to some of our customers.
To the extent our customers do not advance us sufficient funds to finance our costs during the execution phase of our contracts, we are exposed to the risk that they will be unable to accept delivery or that they will be unable to make payment at the time of delivery.
We may make acquisitions that could harm our financial performance.
To expedite development of our corporate infrastructure, particularly with regard to equipment installation and service functions, we anticipate the future acquisition of complementary businesses. Risks associated with such acquisitions include the disruption of our existing operations, loss of key personnel in the acquired companies, dilution through the issuance of additional securities, assumptions of existing liabilities, and commitment to further operating expenses. If any or all of these problems actually occur, acquisitions could negatively impact our financial performance and future stock value.
Our ability to access capital for the repayment of debts and for future growth is limited because the financial markets are currently in a period of disruption and recession, and we do not expect these conditions to improve in the near future.
Our ability to continue to access capital could be impacted by various factors including general market conditions and the continuing slowdown in the economy interest rates, the perception of our potential future earnings and cash distributions, any unwillingness on the part of lenders to make loans to us, and any deterioration in the financial position of lenders that might make them unable to meet their obligations to us.
| 11 |
Our business is affected by general economic conditions and related uncertainties affecting the markets in which we operate. The current unstable economic conditions including the global recession could adversely impact our business in 2013 and beyond.
The current unstable economic conditions could adversely impact our business in 2013 and beyond, resulting in reduced demand for our products, increased rate of order cancellations or delays, increased risk of supplier bankruptcy, increased rate of supply order cancellation or delays, increased risk of excess and obsolete inventories, increased pressure on the prices for our products and services, and greater difficulty in collecting accounts receivable.
Risks Related to this Offering and Ownership of our Common Stock
No public market for our common stock currently exists, and an active trading market for our common stock may not develop or be sustained following this offering.
Prior to this offering, there has been no public market for our common stock. The initial public offering price for our common stock will be determined through negotiations with the underwriters. This price will not necessarily reflect the price at which investors in the market will be willing to buy and sell our shares following this offering. Although we have applied to list our common stock on the NASDAQ Capital Market, an active trading market for our shares may never develop or, if developed, be maintained following this offering. If an active market for our common stock does not develop or is not maintained, it may be difficult for you to sell shares you purchase in this offering without depressing the market price for the shares or at all. An inactive trading market may also impair our ability to raise capital to continue to fund operations by selling shares and may impair our ability to acquire other companies or technologies by using our shares as consideration.
If securities or industry analysts do not publish research or publish inaccurate or unfavorable research about our business, our share price and trading volume could decline.
The trading market for our common stock will depend on the research and reports that securities or industry analysts publish about us or our business. We do not have any control over these analysts. There can be no assurance that analysts will cover us, or provide favorable coverage. If one or more analysts downgrade our stock or change their opinion of our stock, our share price would likely decline. In addition, if one or more analysts cease coverage of our company or fail to regularly publish reports on us, we could lose visibility in the financial markets, which could cause our share price or trading volume to decline.
Investment in our common stock is subject to price fluctuations and market volatility, which could subject us to securities class action litigation and prevent you from being able to sell your shares at or above the offering price.
Historically, valuations of many small companies have been highly volatile. The securities of many small companies have experienced significant price and trading volume fluctuations, unrelated to the operating performance or the prospects of such companies. The initial public offering price for our shares will be determined by negotiations between us and the representatives of the underwriters and may not be indicative of prices that will prevail in the trading market. The market price of shares of our common stock could be subject to wide fluctuations in response to many risk factors listed in this section, and others beyond our control, including:
| • | results and timing of our product development; |
| • | results of the development of our competitors’ products; |
| • | regulatory actions with respect to our products or our competitors’ products; |
| • | actual or anticipated fluctuations in our financial condition and operating results; |
| • | actual or anticipated changes in our growth rate relative to our competitors; |
| • | actual or anticipated fluctuations in our competitors’ operating results or changes in their growth rate; |
| • | competition from existing products or new products that may emerge; |
| • | announcements by us or our competitors of significant acquisitions, strategic partnerships, joint ventures, collaborations, or capital commitments; |
| • | issuance of new or updated research or reports by securities analysts; |
| • | fluctuations in the valuation of companies perceived by investors to be comparable to us; |
| • | share price and volume fluctuations attributable to inconsistent trading volume levels of our shares; |
| • | additions or departures of key management or personnel; |
| • | disputes or other developments related to proprietary rights, including patents, litigation matters, and our ability to obtain, maintain, defend or enforce proprietary rights relating to our products and technologies; |
| • | announcement or expectation of additional financing efforts; |
| • | sales of our common stock by us, our insiders, or our other stockholders; and |
| • | general economic and market conditions. |
| 12 |
Furthermore, the stock markets have experienced extreme price and volume fluctuations that have affected and continue to affect the market prices of equity securities of many companies. These fluctuations often have been unrelated or disproportionate to the operating performance of those companies. These broad market and industry fluctuations, as well as general economic, political, and market conditions such as recessions, interest rate changes, or international currency fluctuations, may negatively impact the market price of shares of our common stock. In addition, such fluctuations could subject us to securities class action litigation, which could result in substantial costs and divert our management’s attention from other business concerns, which could potentially harm our business. If the market price of shares of our common stock after this offering does not exceed the initial public offering price, you may not realize any return on your investment in us and may lose some or all of your investment.
Purchasers in this offering will experience immediate and substantial dilution in the book value of their investment.
The initial public offering price of the shares offered by this prospectus will be substantially higher than the pro forma as adjusted net tangible book value per share of our common stock based on the total value of our tangible assets less our total liabilities immediately following this offering. Therefore, if you purchase shares of our common stock in this offering, you will experience immediate and substantial dilution of approximately $ per share in the price you pay for shares of our common stock as compared to the pro forma as adjusted net tangible book value per share, based on an assumed initial public offering price of $ per share (the midpoint of the price range set forth on the cover page of this prospectus). To the extent outstanding options to purchase shares of common stock are exercised, there will be further dilution. Investors who purchase shares in this offering will contribute approximately % of the total amount of equity capital raised by us through the date of this offering, but will only own approximately % of the shares outstanding immediately following the completion of this offering. For further information on this calculation, see the “Dilution” section of this prospectus.
We could issue additional common stock, which might dilute the book value of our common stock.
Our Board of Directors has the authority, without action or vote of our stockholders, to issue all or a part of any authorized but unissued shares. Such stock issuances may be made at a price that reflects a discount from the then-current trading price of our common stock. We may issue securities that are convertible into or exercisable for a significant amount of our common stock. These issuances would dilute your percentage ownership interest, which would have the effect of reducing your influence on matters on which our stockholders vote, and might dilute the book value of our common stock. You may incur additional dilution of net tangible book value if holders of stock options, whether currently outstanding or subsequently granted, exercise their options or if warrant holders exercise their warrants to purchase shares of our common stock. There can be no assurance that any future offering will be consummated or, if consummated, will be at a share price equal or superior to the price paid by our investors even if we meet our technological and marketing goals.
We may be subject to securities litigation, which is expensive and could divert management attention.
Our share price may be volatile, and in the past companies that have experienced volatility in the market price of their stock have been subject to an increased incidence of securities class action litigation. We may be the target of this type of litigation in the future. Securities litigation against us could result in substantial costs and divert our management’s attention from other business concerns, which could seriously harm our business.
Our quarterly operating results are subject to fluctuations, and if we fail to meet the expectations of securities analysts or investors, our share price may decrease significantly.
Our annual and quarterly results may vary significantly depending on various factors, many of which are beyond our control. If our earnings do not meet the expectations of securities analysts or investors, the price of our stock could decline. Also, because our sales are primarily made on a purchase order basis, customers may generally cancel, reduce, or postpone orders, resulting in reductions to our net sales and profitability.
Future sales of common stock by our existing stockholders may cause our stock price to fall.
The market price of our common stock could decline as a result of sales by our existing stockholders of shares of common stock in the market or the perception that these sales could occur. These sales might also make it more difficult for us to sell equity securities at a time and price that we deem appropriate and thus inhibit our ability to raise additional capital when it is needed.
| 13 |
Because we do not intend to pay cash dividends, our stockholders will receive no current income from holding our stock.
We have paid no cash dividends on our capital stock to date and we currently intend to retain all of our future earnings, if any, to fund the development and growth of our business. In addition, the terms of any future debt or credit facility may preclude us from paying these dividends. As a result, capital appreciation, if any, of our common stock will be your sole source of gain for the foreseeable future.
We are controlled by a small group of majority stockholders, and our minority stockholders will be unable to effect changes in our governance structure or implement actions that require stockholder approval, such as a sale of the Company.
George N. Hatsopoulos and John N. Hatsopoulos, who are brothers, beneficially own approximately 53.2% of our outstanding shares of common stock. These stockholders have the ability to control various corporate decisions, including our direction and policies, the election of directors, the content of our charter and bylaws, and the outcome of any other matter requiring stockholder approval, including a merger, consolidation and sale of substantially all of our assets, or other change of control transaction. The concurrence of our minority stockholders will not be required for any of these decisions. This concentration of voting power could delay or prevent an acquisition of us on terms that other stockholders may desire. The interests of this group of stockholders may not always coincide with your interests or the interests of other stockholders and they may act in a manner that advances their best interests and not necessarily those of other stockholders, including seeking a premium value for their common stock, which might affect the prevailing market price for our common stock.
We are controlled by our two founding shareholders, George N. Hatsopoulos and John N. Hatsopoulos. These shareholders have registered all of their holdings for resale, and therefore are able to sell all of their common stock.
George N. Hatsopoulos and John N. Hatsopoulos have registered all of their holdings of the Company’s securities for resale primarily for estate planning purposes. For that reason, the timing and the amount of any future sales by them is difficult to predict. George Hatsopoulos is a director but not an officer of the Company. John Hatsopoulos is the Chief Executive Officer and a key employee of the Company. If John Hatsopoulos or George Hatsopoulos were to sell a substantial portion of their shares in the Company, they would no longer have a substantial continuing interest in the Company. If that were to occur, it may have a material adverse effect on their performance as director or Chief Executive Officer, as applicable, and on the business of the Company. Further, substantial sales of their common stock may result in a decline in the market price of our common stock. The Company’s securities held by each of John Hatsopoulos and George Hatsopoulos will be subject to 180-day lock-up periods pursuant to the lock-up agreements described in the “Underwriting” section of this prospectus.
We have broad discretion in the use of net proceeds from this offering and may not use them effectively.
Our management will have broad discretion in the application of the net proceeds from this offering, including for any of the purposes described in the section entitled “Use of Proceeds,” and you will not have the opportunity as part of your investment decision to assess whether the net proceeds are being used appropriately. Because of the number and variability of factors that will determine our use of the net proceeds from this offering, their ultimate use may vary substantially from their intended use. The failure by our management to apply these funds effectively could harm our business. Pending their use, we may invest the net proceeds from this offering in short-term, investment-grade, interest-bearing securities. These investments may not yield a favorable return to our stockholders. Further, we anticipate that a certain portion of the proceeds from this offering will be used to finance Ilios, an entity of which we own only 65%. As such, your investment in our common stock may result in benefits of which you may only experience a portion.
There has been a material weakness in our disclosure controls and procedures and our internal control over financial reporting, which could harm our operating results or cause us to fail to meet our reporting obligations.
As of our fiscal year end, December 31, 2012, our principal executive officer and principal accounting officer performed an evaluation of controls and procedures and concluded that our controls were not effective to provide reasonable assurance that information required to be disclosed by our Company in reports that we file under the Exchange Act is recorded, processed, summarized, and reported as when required. Management conducted an evaluation of our internal control over financial reporting and based on this evaluation, management concluded that the company’s internal control over financial reporting was not effective as of December 31, 2012. The Company currently does not have personnel with a sufficient level of accounting knowledge, experience, and training in the selection, application, and implementation of generally acceptable accounting principles as it relates to complex transactions and financial reporting requirements. The Company also has a small number of employees dealing with general controls over information technology security and user access. This constitutes a material weakness in financial reporting. Any failure to implement effective internal controls could harm our operating results or cause us to fail to meet our reporting obligations. Inadequate internal controls could also cause investors to lose confidence in our reported financial information, which could have a negative effect on the trading price of our common stock, and may require us to incur additional costs to improve our internal control system.
| 14 |
Trading of our common stock may be restricted by the SEC’s “penny stock” regulations, which may limit a stockholder’s ability to buy and sell our stock.
The SEC has adopted regulations that generally define “penny stock” to be any equity security that has a market price less than $5.00 per share or an exercise price of less than $5.00 per share, subject to certain exceptions. Our securities may be covered by the penny stock rules, which impose additional sales practice requirements on broker-dealers who sell to persons other than established customers and accredited investors. The penny stock rules require a broker-dealer, prior to a transaction in a penny stock not otherwise exempt from the rules, to deliver a standardized risk disclosure document in a form prepared by the SEC that provides information about penny stocks and the nature and level of risks in the penny stock market. The broker-dealer also must provide the customer with current bid and other quotations for the penny stock, the compensation of the broker-dealer and its salesperson in the transaction, and monthly account statement showing the market value of each penny stock held in the customer’s account. The bid and offer quotations, and the broker-dealer and salesperson compensation information, must be given to the customer orally or in writing prior to effecting the transaction and must be given to the customer in writing before or with the customer’s confirmation. In addition, the penny stock rules require that prior to a transaction in a penny stock not otherwise exempt from these rules, the broker-dealer must make a special written determination that the penny stock is a suitable investment for the purchaser and receive the purchaser’s written agreement to the transaction. These disclosure and suitability requirements may have the effect of reducing the level of trading activity in the secondary market for a stock that is subject to these penny stock rules. Consequently, these penny stock rules may affect the ability of broker-dealers to trade our securities. We believe that the penny stock rules may discourage investor interest in and limit the marketability of our capital stock. Trading of our capital stock may be restricted by the SEC’s penny stock regulations, which may limit a stockholder’s ability to buy and sell our stock.
The recently enacted JOBS Act will allow us to postpone the date by which we must comply with certain laws and regulations and will reduce the amount of information provided by us in reports filed with the SEC. We cannot be certain if the reduced disclosure requirements applicable to emerging growth companies will make our common stock less attractive to investors.
We are and we will remain an “emerging growth company,” as defined in the JOBS Act, until the earliest to occur of (i) the last day of the fiscal year during which our total annual gross revenues equal or exceed $1 billion (subject to adjustment for inflation; (ii) the last day of the fiscal year following the fifth anniversary of our initial public offering; (iii) the date on which we have, during the previous three-year period, issued more than $1 billion in non-convertible debt; or (iv) the date on which we are deemed a large accelerated filer under the Exchange Act.
For so long as we remain an emerging growth company, we will not be required to:
| • | have an auditor report on our internal controls over financial reporting pursuant to Section 404(b) of the Sarbanes-Oxley Act; |
| • | comply with any requirement that may be adopted by the Public Company Accounting Oversight Board regarding mandatory audit firm rotation or a supplement to the auditor’s report providing additional information about the audit and the financial statements (i.e., an auditor discussion and analysis); |
| • | submit certain executive compensation matters to shareholder non-binding advisory votes; |
| • | submit for shareholder approval golden parachute payments not previously approved; and |
| • | disclose certain executive compensation related items such as the correlation between executive compensation and financial performance and comparisons of the Chief Executive Officer’s compensation to median employee compensation, when such disclosure requirements are adopted. |
In addition, Section 107 of the JOBS Act also provides that an emerging growth company can take advantage of the extended transition period provided in Section 7(a)(2)(B) of the Securities Act of 1933, as amended, or the Securities Act, for complying with new or revised accounting standards. An emerging growth company can therefore delay the adoption of certain accounting standards until those standards would otherwise apply to private companies. However, we are choosing to “opt out” of such extended transition period, and as a result, we will comply with new or revised accounting standards on the relevant dates on which adoption of such standards is required for non-emerging growth companies. Section 107 of the JOBS Act provides that our decision to opt out of the extended transition period for complying with new or revised accounting standards is irrevocable.
| 15 |
We cannot predict if investors will find our common stock less attractive because we may rely on some of these exemptions. If some investors find our common stock less attractive as a result, there may be a less active trading market for our common stock and our stock price may be more volatile. If we avail ourselves of certain exemptions from various reporting requirements, our reduced disclosure may make it more difficult for investors and securities analysts to evaluate us and may result in less investor confidence.
We will incur significantly increased costs and devote substantial management time as a result of operating as a public company particularly after we are no longer an “emerging growth company.”
As a public company, we will incur significant legal, accounting and other expenses that we did not incur as a private company. For example, we will be required to comply with certain of the requirements of the Sarbanes-Oxley Act and the Dodd-Frank Wall Street Reform and Consumer Protection Act, as well as rules and regulations subsequently implemented by the SEC, and the NASDAQ Capital Market, our anticipated stock exchange, including the establishment and maintenance of effective disclosure and financial controls and changes in corporate governance practices. We expect that compliance with these requirements will increase our legal and financial compliance costs and will make some activities more time consuming and costly. In addition, we expect that our management and other personnel will need to divert attention from operational and other business matters to devote substantial time to these public company requirements. In particular, we expect to incur significant expenses and devote substantial management effort toward ensuring compliance with the requirements of Section 404 of the Sarbanes-Oxley Act.
As noted above, for as long as we remain an “emerging growth company” as defined in the JOBS Act, we intend to take advantage of certain exemptions from various reporting requirements that are applicable to other public companies that are not “emerging growth companies.” However, after we are no longer an “emerging growth company,” we expect to incur additional management time and cost to comply with the more stringent reporting requirements applicable to companies that are deemed accelerated filers or large accelerated filers, including complying with the auditor attestation requirements of Section 404 of the Sarbanes-Oxley Act. We cannot predict or estimate the amount of additional costs we may incur as a result of becoming a public company or the timing of such costs.
| 16 |
SPECIAL NOTE REGARDING FORWARD-LOOKING STATEMENTS
This prospectus contains forward-looking statements that involve substantial risks and uncertainties. All statements, other than statements of historical facts, contained in this prospectus, including statements regarding our strategy, future operations, future financial position, future revenues, projected costs, prospects, plans, and objectives of management, are forward-looking statements. The words “anticipate,” “believe,” “estimate,” “expect,” “intend,” “may,” “plan,” “predict,” “project,” “target,” “potential,” “will,” “would,” “could,” “should,” “continue,” and similar expressions are intended to identify forward-looking statements, although not all forward-looking statements contain these identifying words.
The forward-looking statements in this prospectus include, among other things, statements about:
| • | our future financial performance, including our revenue, cost of revenue, operating expenses, and ability to achieve and maintain profitability; |
| • | our ability to market, commercialize, and achieve market acceptance for our combined heat and power systems, or any other product candidates or products that we may develop; |
| • | our ability to innovate and keep pace with changes in technology; |
| • | the success of our marketing and business development efforts; |
| • | our ability to maintain, protect and enhance our intellectual property; |
| • | the effects of increased competition in our market; |
| • | our ability to effectively manage our growth and successfully enter new markets; and |
| • | the attraction and retention of qualified employees and key personnel. |
We may not actually achieve the plans, intentions, or expectations disclosed in our forward-looking statements, and you should not place undue reliance on our forward-looking statements. Actual results or events could differ materially from the plans, intentions, and expectations disclosed in the forward-looking statements we make. We have included important factors in the cautionary statements included in this prospectus, particularly in the “Risk Factors” section, that we believe could cause actual results or events to differ materially from the forward-looking statements that we make. Our forward-looking statements do not reflect the potential impact of any future acquisitions, mergers, dispositions, joint ventures, or investments we may make.
You should read this prospectus and the documents that we reference in this prospectus and have filed as exhibits to the registration statement of which this prospectus is a part completely and with the understanding that our actual future results may be materially different from what we expect. The forward-looking statements contained in this prospectus are made as of the date of this prospectus, and we do not assume any obligation to update any forward-looking statements except as required by applicable law.
| 17 |
USE OF PROCEEDS
We estimate that we will receive net proceeds of approximately $ million from our sale of common stock in this offering, or approximately $ million if the underwriters exercise their overallotment option in full, based on an assumed initial public offering price of $ per share (the midpoint of the price range set forth on the cover page of this prospectus) and after deducting the estimated underwriting discounts and commissions and estimated offering expenses payable by us.
Each $1.00 increase (decrease) in the assumed initial public offering price of $ per share (the midpoint of the price range set forth on the cover page of this prospectus) would increase (decrease), respectively, the amount of cash, cash equivalents and short-term investments, additional paid-in capital, total stockholders’ equity (deficit) and total capitalization by approximately $ million, assuming the number of shares offered by us, as set forth on the cover page of this prospectus, remains the same and after deducting the estimated underwriting discounts and commissions and estimated offering expenses payable by us.
We currently expect to use the net proceeds from this offering to:
| · | Expand our turnkey design and installation contracting services business in our core markets in the Northeast United States and California. Proceeds will be used for additional sales and technical staff to support the business and for working capital to complete these projects. We anticipate expanding our service and turnkey operations to new territories, which will likewise require startup capital. |
| · | Further expand our business into foreign markets. |
| · | Construct a dedicated manufacturing facility for our Ilios subsidiary to increase throughput and decrease product manufacturing costs. |
| · | Expand our low-emissions technology business to other markets, including applying our emissions technology to non-Tecogen engines in a wider range of industrial markets. |
| · | Refine our existing models and develop new products, including additional CHP and Ilios heat pump products that will use the advanced engine developed under the recently completed research contract with the California Energy Commission (see “R&D Capabilities” below). |
| · | Repay amounts owed under our non-convertible debt, including our line of credit with our Chief Executive Officer. |
The remainder of the net proceeds from this offering may be used for working capital and general corporate purposes.
The actual amount we spend for such purposes will depend on then-existing conditions, including our financial condition, operating results, business prospects, and other factors that we may deem relevant. Accordingly, our management will have significant flexibility in applying the net proceeds of this offering. Pending our use of the net proceeds from this offering, we intend to invest the net proceeds in a variety of capital preservation investments, including short-term, investment-grade, interest-bearing instruments, and U.S. government securities.
We have no current understandings, commitments or agreements with respect to any material acquisition of or investment in any technologies, products, or companies.
We have demand notes (i) with an original principal amount of $250,000 issued to John N. Hatsopoulos, our Chief Executive Officer, and Patricia Hatsopoulos, his wife, which bear interest at 5% per year; and (ii) with an aggregate original principal amount of $1,050,000, issued to John N. Hatsopoulos, which bear interest at 6% per year. As of May 29, 2013, the aggregate amount owed under these notes, including interest, was approximately $1,423,428. We also have a line of credit for up to $1 million with John N. Hatsopoulos. As of May 29, 2013, there are no amounts outstanding under the line of credit and the interest rate is equal to 4.75%.
DIVIDEND POLICY
We have never declared or paid any cash dividends on our common stock and do not anticipate paying any cash dividends in the foreseeable future. Payment of cash dividends, if any, in the future will be at the discretion of our Board of Directors.
| 18 |
CAPITALIZATION
The following table sets forth our cash and cash equivalents and our capitalization as of March 31, 2013:
| · | on an actual basis; |
| · | on a pro forma basis to give effect to the voluntary conversion of our outstanding convertible debentures at the closing of the offering into 75,806 shares of common stock; and |
| · | on a pro forma, as adjusted basis, to also give effect to the sale of shares of common stock in this offering at an assumed initial public offering price of $ per share (the midpoint of the price range set forth on the cover page of this prospectus), after deducting estimated underwriting discounts and commissions and estimated offering expenses payable by us. |
You should read this table in conjunction with the sections titled “Selected Consolidated Financial Data” and “Management’s Discussion and Analysis of Financial Condition and Results of Operations” and our financial statements and related notes included elsewhere in this prospectus.
| March 31, 2013 | ||||||||||||
| Actual | Pro Forma (unaudited) | Pro Forma, as adjusted (unaudited) | ||||||||||
| Cash and cash equivalents | $ | 680,676 | $ | 680,676 | ||||||||
| Convertible Debentures | 90,967 | $ | — | $ | ||||||||
| Common Stock, par value $0.001 per share – 100,000,000 shares authorized; 13,611,974 issued shares, actual; 13,687,780 issued shares pro forma; and issued shares, pro forma as adjusted | 54,448 | 54,524 | ||||||||||
| Additional paid-in capital | 16,373,090 | 16,463,981 | ||||||||||
| Accumulated deficit | (12,620,116 | ) | (12,620,116 | ) | ||||||||
| Total shareholders’ equity | 3,807,422 | 3,898,389 | ||||||||||
| Total capitalization | $ | 3,807,422 | $ | 3,898,389 | $ | |||||||
Each $1.00 increase (decrease) in the assumed initial public offering price of $ per share (the midpoint of the price range set forth on the cover page of this prospectus) would increase (decrease), respectively, the amount of cash, cash equivalents and short-term investments, additional paid-in capital, total stockholders’ equity (deficit) and total capitalization by approximately $ million, assuming the number of shares offered by us, as set forth on the cover page of this prospectus, remains the same and after deducting the estimated underwriting discounts and commissions and estimated offering expenses payable by us.
The number of our shares of common stock to be outstanding immediately after this offering excludes:
| · | 1,096,500 shares of common stock issuable upon the exercise of stock options outstanding as of March 31, 2013 under our stock incentive plan, at a weighted average exercise price of $1.96 per share; |
| · | 135,183 shares of common stock available for future grants under our stock incentive plan; and |
| · | shares of common stock issuable if the underwriters exercise their option to purchase additional shares. |
| 19 |
DILUTION
Purchasers of the shares offered by this prospectus will suffer immediate and substantial dilution in the net tangible book value per share of common stock. Our net tangible book value as of March 31, 2013, was approximately $3,176,915, or $0.233 per share. Net tangible book value per share is calculated by subtracting our total liabilities from our total tangible assets, which is total assets less intangible assets, and dividing this amount by the number of shares of common stock outstanding.
Dilution in net tangible book value per share represents the difference between the amount per share paid by purchasers in this offering and the as adjusted pro forma net tangible book value per share of our common stock immediately after this offering. After giving effect to the sale by us of all shares offered in this offering at an assumed initial public offering price of $ per share (the midpoint of the price range set forth on the cover page of this prospectus), and after deducting estimated underwriting discounts and commissions and estimated offering expenses payable by us, our as adjusted net tangible book value as of March 31, 2013, would have been approximately $ , or $ per share. This represents an immediate increase in the net tangible book value of $ per share to our existing shareholders and an immediate dilution in net tangible book value of $ per share to investors in this offering. The following table illustrates this per share dilution:
| Price per share to investors | $ | |||
| Net tangible book value per share as of March 31, 2013 | $ | 0.233 | ||
| Increase in net tangible book value per share attributable to this offering | $ | |||
| As adjusted net tangible book value per share as of March 31, 2013, after giving effect to this offering | $ | |||
| Dilution in net tangible book value per share to investors | $ |
The above table is based on 13,611,974 shares of our common stock outstanding as of March 31, 2013, reflects the one-for-four reverse stock split effective May 17, 2013, and excludes as of March 31, 2013, the following:
| · | 1,096,500 shares of common stock issuable upon the exercise of stock options outstanding under our stock incentive plan, at a weighted average exercise price of $1.96 per share; |
| · | 135,183 shares of common stock available for future grants under our stock incentive plan; |
| · | 75,806 shares of common stock issuable pursuant to convertible debentures with an outstanding principal amount of $90,967 and a conversion price of $1.20 per share; and |
| · | shares of common stock issuable if the underwriters exercise their option to purchase additional shares. |
Each $1.00 increase (decrease) in the assumed initial public offering price of $ per share (the midpoint of the price range set forth on the cover page of this prospectus) would increase (decrease), respectively, the amount of cash, cash equivalents and short-term investments, additional paid-in capital, total stockholders’ equity (deficit) and total capitalization by approximately $ million, assuming the number of shares offered by us, as set forth on the cover page of this prospectus, remains the same and after deducting the estimated underwriting discounts and commissions and estimated offering expenses payable by us.
To the extent that any options are exercised, new options are issued under our stock option or stock incentive plans, or we otherwise issue additional shares of common stock in the future, there will be further dilution to new investors.
| 20 |
SELECTED CONSOLIDATED FINANCIAL DATA
The following selected consolidated financial data should be read together with our financial statements and accompanying notes and “Management’s discussion and analysis of financial condition and results of operations” appearing elsewhere in this prospectus. The selected consolidated financial data in this section are not intended to replace our financial statements and the related notes. Our historical results are not necessarily indicative of our future results.
The selected statement of operations data for the years ended December 31, 2012, 2011, and 2010, and the selected balance sheet data as of December 31, 2012 are derived from our audited financial statements appearing elsewhere in this prospectus. The selected statement of operations data for the three months ended March 31, 2013 and 2012, and the selected balance sheet data as of March 31, 2013 are derived from our unaudited financial statements appearing elsewhere in this prospectus. In our opinion, our interim financial statements include all adjustments, consisting only of normal recurring adjustments that we consider necessary for a fair presentation of the financial information set forth in those statements.
| Year Ended | Three Months Ended | |||||||||||||||||||
| December 31, | March 31, | |||||||||||||||||||
| Consolidated Statement of Operations Data: | 2012 | 2011 | 2010 | 2013 | 2012 | |||||||||||||||
| (audited) | (audited) | (audited) | (unaudited) | (unaudited) | ||||||||||||||||
| Revenues | $ | 15,253,972 | $ | 11,065,210 | $ | 11,311,229 | $ | 4,046,318 | $ | 3,252,528 | ||||||||||
| Cost of sales | 9,388,898 | 6,179,098 | 6,597,205 | 2,934,354 | 1,837,973 | |||||||||||||||
| Gross profit | 5,865,074 | 4,886,112 | 4,714,024 | 1,111,964 | 1,414,555 | |||||||||||||||
| Operating expenses | ||||||||||||||||||||
| General and administrative | 6,643,120 | 5,986,762 | 4,973,794 | 1,791,703 | 1,684,744 | |||||||||||||||
| Selling | 1,225,580 | 782,252 | 290,505 | 279,370 | 267,929 | |||||||||||||||
| 7,868,700 | 6,769,014 | 5,264,299 | 2,071,073 | 1,952,673 | ||||||||||||||||
| Loss from operations | (2,003,626 | ) | (1,882,902 | ) | (550,275 | ) | (959,109 | ) | (538,118 | ) | ||||||||||
| Other income (expense) | ||||||||||||||||||||
| Interest and other income | 48,397 | 38,402 | 23,574 | 3,946 | 14,772 | |||||||||||||||
| Interest expense | (71,208 | ) | (40,294 | ) | (37,280 | ) | (23,377 | ) | (17,802 | ) | ||||||||||
| (22,811 | ) | (1,892 | ) | (13,706 | ) | (19,431 | ) | (3,030 | ) | |||||||||||
| Loss before income taxes | (2,026,437 | ) | (1,884,794 | ) | (563,981 | ) | (978,540 | ) | (541,148 | ) | ||||||||||
| Consolidated net loss | (2,026,437 | ) | (1,884,794 | ) | (563,981 | ) | (978,540 | ) | (541,148 | ) | ||||||||||
| Less: Loss attributable to the noncontrolling interest | 389,480 | 310,293 | 208,673 | 118,147 | 102,835 | |||||||||||||||
| Net loss attributable to Tecogen Inc. | $ | (1,636,957 | ) | $ | (1,574,501 | ) | $ | (355,308 | ) | $ | (860,393 | ) | $ | (438,313 | ) | |||||
| Net loss per share - basic and diluted | $ | (0.12 | ) | $ | (0.13 | ) | $ | (0.03 | ) | $ | (0.07 | ) | $ | (0.03 | ) | |||||
| Weighted average shares outstanding - basic and diluted | 13,135,072 | 12,052,914 | 11,470,658 | 13,212,894 | 13,015,154 | |||||||||||||||
| 21 |
| As of December 31, 2012 | As of March 31, 2013 | |||||||||||||||
| Consolidated Balance Sheet Data: | (audited) | (unaudited) | ||||||||||||||
| Actual | Actual | Pro Forma(1) | Pro Forma As Adjusted(2) | |||||||||||||
| Cash and cash equivalents | $ | 1,572,785 | $ | 680,676 | $ | 680,676 | $ | |||||||||
| Short-term investments | 181,859 | 182,061 | 182,061 | |||||||||||||
| Working capital | 4,078,704 | 2,583,135 | 2,674,102 | |||||||||||||
| Total assets | 9,117,249 | 9,376,689 | 9,376,689 | |||||||||||||
| Total liabilities | 4,334,214 | 5,514,556 | 5,423,589 | |||||||||||||
| Stockholders’ equity | $ | 4,783,035 | $ | 3,862,133 | $ | 3,953,100 | $ | |||||||||
| (1) | The pro forma consolidated balance sheet data in the table above give effect to conversion of convertible
debentures with an outstanding principal amount of $90,967 upon the closing of this offering. |
| (2) | The pro forma as adjusted consolidated balance sheet data in the table above give effect to our receipt of the estimated net proceeds to us from this offering at an assumed initial public offering price of $ per share, which is the midpoint of the range listed on the cover page of this prospectus, after deducting estimated underwriting discounts and commissions and estimated offering expenses payable by us. |
| 22 |
MANAGEMENT’S DISCUSSION AND ANALYSIS OF
FINANCIAL CONDITION AND RESULTS OF OPERATIONS
Overview
Tecogen designs, manufactures, sells, and services industrial and commercial cogeneration systems that produce combinations of electricity, hot water, and air conditioning using automotive engines that have been specially adapted to run on natural gas. Cogeneration systems are efficient because in addition to supplying mechanical energy to power electric generators or compressors – displacing utility-supplied electricity – they provide an opportunity for the facility to incorporate the engine’s waste heat into onsite processes such as space and potable water heating. We produce standardized, modular, small-scale products, with a limited number of product configurations that are adaptable to multiple applications. We refer to these combined heat and power products as CHP (electricity plus heat) and MCHP (mechanical power plus heat).
Our products are sold directly to end-users by our in-house marketing team and by established sales agents and representatives. We have agreements in place with distributors and sales representatives, including American DG Energy and EuroSite Power, which are affiliated companies. Our existing customers include hospitals and nursing homes, colleges and universities, health clubs and spas, hotels and motels, office and retail buildings, food and beverage processors, multi-unit residential buildings, laundries, ice rinks, swimming pools, factories, municipal buildings, and military installations. We have shipped approximately 2,000 units, some of which have been operating for almost 25 years.
In 2009 we created a majority-owned subsidiary, Ilios, to develop and distribute a line of ultra-high-efficiency heating products, including a high efficiency water heater. These products provide twice the efficiency of conventional commercial and industrial boilers (based upon management estimates) utilizing advanced thermodynamic principles. As of the date of this prospectus, we own a 65.0% interest in Ilios.
For each of our last five fiscal years and prior thereto, we have incurred annual operating losses. We expect this trend to continue until such time that we can sell a sufficient number of systems and achieve a cost structure to become profitable. We may not have adequate cash resources to reach the point of profitability, and we may never become profitable. Even if we do achieve profitability, we may be unable to increase our sales and sustain or increase our profitability in the future.
Although we may, from time to time, have one or a few customers who may represent more than 10% of our product revenue for a given year, we are not dependent on the recurrence of revenue from those customers. Our product revenue is such that customers may make a large purchase once and may not ever make a purchase again. Our equipment is built to last 20 or more years; therefore, our product revenue model is not dependent on recurring sales transactions from the same customer. Our service revenue, however, may lend itself to recurring revenue from particular customers, although, we currently do not have any service revenue customers who make up more than 10% of our total revenues on an annual basis. American DG Energy has been considered a major customer in certain years, as disclosed in the accompanying financial statements; however, we do not consider our business dependent upon its recurrence.
For the last two fiscal years, more than half of our revenue was generated from long-term maintenance contracts, or service contracts, which provide us with a somewhat predictable revenue stream, especially during the summer months, when there is a slight increase in service activity on chiller units. Between 2007 and 2012, approximately 68% of customers signed service contracts. Our service revenue has grown nearly 60% from 2005 to 2012, with our New York City/New Jersey, New England, and to some extent California, territories experiencing the majority of the growth. This growth is consistent with the sale of new units into those territories. Our service margins are generally predictable, as we service hundreds of long-term contracts with relatively low dollar, high volume sales. Fluctuations at the job level are to be expected; however, due to the number of jobs, gross margin generally evens out in the aggregate.
Our product revenue is derived from the sale of the various cogeneration modules, such as the InVerde 100, the CM-75 and the CM-60, and the three chiller models, such as the smaller ST, the larger DT and the RT (roof-top) units. The sales cycle for each module varies widely, and can range from as short as a month to as long as a year or more. The length of the sales cycle is generally dependent on the size of the project and the number of decision makers in a customer’s facility. Furthermore, since our products and their installation are costly, they are considered a major capital improvement and customers may be slow in making their buying decisions. Our products sales are high dollar value, low volume transactions. Therefore our product revenue can be difficult to predict and the expected margin, which is based on the various models we offer, varies.
Our cogeneration and chiller modules are built to order, and revenue is recognized upon shipment. The lead time to build and deliver a unit depends on its customized configuration and is approximately 12 to 16 weeks from time of purchase order. As revenue is recognized upon shipment, our work-in-process is an important factor in understanding our financial condition in any given quarter.
| 23 |
Recent Accounting Pronouncements
In May 2011, the Financial Accounting Standards Board, or FASB, issued updated accounting guidance related to fair value measurements and disclosures that result in common fair value measurements and disclosures between U.S. generally accepted accounting principles, or GAAP, and International Financial Reporting Standards. This guidance includes amendments that clarify the application of existing fair value measurement requirements, in addition to other amendments that change principles or requirements for measuring fair value and for disclosing information about fair value measurements. This guidance is effective during interim and annual periods beginning after December 15, 2011. The adoption of this guidance did not have a material effect on our consolidated financial statements.
Critical Accounting Policies
Revenue Recognition
Revenue is recognized when persuasive evidence of an arrangement exists; delivery has occurred or services have been rendered; the price is fixed or determinable; and collectability is reasonably assured. Generally, sales of cogeneration and chiller units and parts are recognized when shipped and services are recognized over the term of the service period. Payments received in advance of services being performed are recorded as deferred revenue.
Infrequently, we recognize revenue in certain circumstances before delivery has occurred (commonly referred to as bill and hold transactions). In such circumstances, among other things, risk of ownership has passed to the buyer; the buyer has made a written fixed commitment to purchase the finished goods; the buyer has requested the finished goods be held for future delivery as scheduled and designated by the buyer; and the Company has no additional performance obligations. For these transactions, the finished goods are segregated from inventory and normal billing and credit terms are granted. For the years ended December 31, 2012 and 2011, no revenues were recorded as bill and hold transactions.
For those arrangements that include multiple deliverables, we first determine whether each service or deliverable meets the separation criteria of FASB ASC 605-25, Revenue Recognition—Multiple-Element Arrangements. In general, a deliverable (or a group of deliverables) meets the separation criteria if the deliverable has stand-alone value to the customer and if the arrangement includes a general right of return related to the delivered item and delivery or performance of the undelivered item(s) is considered probable and substantially in control of the Company. Each deliverable that meets the separation criteria is considered a separate “unit of accounting.” We allocate the total arrangement consideration to each unit of accounting using the relative fair value method. The amount of arrangement consideration that is allocated to a delivered unit of accounting is limited to the amount that is not contingent upon the delivery of another unit of accounting.
When vendor-specific objective evidence or third-party evidence is not available, adopting the relative fair value method of allocation permits us to recognize revenue on specific elements as completed based on the estimated selling price. We generally use internal pricing lists that determine sales prices to external customers in determining its best estimate of the selling price of the various deliverables in multiple-element arrangements. Changes in judgments made in estimating the selling price of the various deliverables could significantly affect the timing or amount of revenue recognition. We enter into sales arrangements with customers to sell our cogeneration and chiller units and related service contracts and occasionally installation services. Based on the fact that we sell each deliverable to other customers on a stand-alone basis, we have determined that each deliverable has a stand-alone value. Additionally, there are no rights of return relative to the delivered items; therefore, each deliverable is considered a separate unit of accounting.
After the arrangement consideration has been allocated to each unit of accounting, we apply the appropriate revenue recognition method for each unit of accounting based on the nature of the arrangement and the services included in each unit of accounting. Cogeneration and chiller units are recognized when shipped. Services are recognized over the term of the applicable agreement, or as provided, when on a time and materials basis.
In some cases, our customers may choose to have the Company provide turnkey services for them rather than simply purchasing the cogeneration and/or chiller units. Turnkey services include site engineering, construction, electrical, plumbing, and installation services. In this case, the Company accounts for revenue, or turnkey revenue, and costs using the percentage-of-completion method of accounting, and this turnkey revenue is included in service revenue in the consolidated statement of operations. Under the percentage-of-completion method of accounting, revenues are recognized by applying percentages of completion to the total estimated revenues for the respective contracts. Costs are recognized as incurred. The percentages of completion are determined by relating the actual cost of work performed to date to the current estimated total cost at completion of the respective contracts. When the estimate on a contract indicates a loss, the Company’s policy is to record the entire expected loss, regardless of the percentage of completion. The excess of contract costs and profit recognized to date on the percentage-of-completion accounting method in excess of billings is recorded as unbilled revenue. Billings in excess of related costs and estimated earnings are recorded as deferred revenue.
| 24 |
Accounts Receivable
Accounts receivable are stated at the amount management expects to collect from outstanding balances. An allowance for doubtful accounts is provided for those accounts receivable considered to be uncollectible based upon historical experience and management’s evaluation of outstanding accounts receivable at the end of the year. Bad debts are written off against the allowance when identified. At March 31, 2013 and December 31, 2012, the allowance for doubtful accounts was $145,500 and $154,400, respectively.
Inventory
Raw materials, work in process, and finished goods inventories are stated at the lower of cost, as determined by the average cost method, or net realizable value. The Company periodically reviews inventory quantities on hand for excess and/or obsolete inventory based primarily on historical usage, as well as based on estimated forecast of product demand. Any reserves that result from this review are charged to cost of sales. As of each of March 31, 2013 and December 31, 2012, there was a reserve against inventory in the amount of $332,000.
Intangible Assets
Intangible assets subject to amortization include costs incurred by the Company to acquire product certifications and certain patent costs. These costs are amortized on a straight-line basis over the estimated economic life of the intangible asset. We review intangible assets for impairment when the circumstances warrant.
Research and Development Costs/Grants
Internal research and development expenditures are expensed as incurred. Proceeds from certain grants and contracts with governmental agencies and their contractors to conduct research and development for new CHP technologies or to improve or enhance existing technology are recorded as an offset to the related research and development expenses. These grants and contracts are paid on a cost reimbursement basis provided in the agreed upon budget. Amounts received totaled $126,500 and $239,000 in fiscal years 2012 and 2011, respectively, which offset the Company’s total research and development expenditures for each of the respective years. For the three months ended March 31, 2013 and 2012, amounts received were $67,144 and $66,019, respectively, which offset the Company’s total research and development expenditures for each of the respective periods. As of March 31, 2013 and December 31, 2012, retainage receivable was $67,775 and $154,700, respectively.
Stock-Based Compensation
Stock-based compensation cost is measured at the grant date, based on the estimated fair value of the award, and is recognized as an expense in the statements of operations over the requisite service period.
Pursuant to ASC 505-50, Equity Based Payments to Non-Employees, the fair value of restricted common stock and stock options issued to non-employees is revalued at each reporting period until the ultimate measurement date, as defined by ASC 505-50. The Company records the value of the instruments at the time services are provided and the instruments vest. Accordingly, the ultimate expense is not fixed until such instruments are fully vested.
The determination of the fair value of share-based payment awards is affected by the Company’s stock price. Since the Company’s common stock was not publicly traded when the awards were issued, we considered the sales price of the common stock in private placements to unrelated third parties as a measure of the fair value of its common stock.
The Company utilizes an estimated forfeiture rate when calculating the expense for the period. Forfeitures are estimated at the time of grant and revised, if necessary, in subsequent periods if actual forfeitures differ from those estimates. Stock-based compensation expense recognized is based on awards that are ultimately expected to vest. The Company evaluates the assumptions used to value awards regularly and if factors change and different assumptions are employed, stock-based compensation expense may differ significantly from what has been recorded in the past. If there are any modifications or cancellations of the underlying unvested securities, the Company may be required to accelerate, increase, or cancel any remaining unearned stock-based compensation expense.
| 25 |
Loss per Common Share
We compute basic loss per share by dividing net loss for the period by the weighted-average number of shares of common stock outstanding during the period. We compute our diluted earnings per common share using the treasury stock method. For purposes of calculating diluted earnings per share, we consider our shares issuable in connection with the convertible debentures, stock options, and warrants to be dilutive common stock equivalents when the exercise/conversion price is less than the average market price of our common stock for the period. All shares issuable for the years ended December 31, 2012 and 2011 were anti-dilutive because of the reported net loss.
Segment Information
We report segment data based on the management approach. The management approach designates the internal reporting that is used by management for making operating and investment decisions and evaluating performance as the source of our reportable segments. We use one measurement of profitability and does not disaggregate its business for internal reporting. We have determined that it operates in one business segment, which is the manufacture and support of highly efficient CHP products based on engines fueled by natural gas.
The following table summarizes net revenue by product line and services for the three months ended March 31, 2013 and 2012:
| 2013 | 2012 | |||||||
| Products: | ||||||||
| Cogeneration | $ | 1,278,156 | $ | 582,250 | ||||
| Chiller | 774,509 | 907,457 | ||||||
| Total Product Revenue | 2,052,665 | 1,489,707 | ||||||
| Services | 1,993,653 | 1,762,821 | ||||||
| $ | 4,046,318 | $ | 3,252,528 | |||||
Income Taxes
We use the asset and liability method of accounting for income taxes. The current or deferred tax consequences of transactions are measured by applying the provisions of enacted tax laws to determine the amount of taxes payable currently or in future years. Deferred tax assets and liabilities are determined based on the difference between the financial statement and tax bases of assets and liabilities and expected future tax consequences of events that have been included in the financial statements or tax returns using enacted tax rates in effect for the years in which the differences are expected to reverse. Under this method, a valuation allowance is used to offset deferred taxes if, based upon the available evidence, it is more likely than not that some or all of the deferred tax assets may not be realized. Management evaluates the recoverability of deferred taxes and the adequacy of the valuation allowance annually.
We have adopted the provisions of the accounting standards relative to accounting for uncertainties in tax positions. These provisions provide guidance on the recognition, de-recognition and measurement of potential tax benefits associated with tax positions. We elected to recognize interest, and penalties related to income tax matters as a component of income tax expense in the statements of operations. There was no impact on the financial statements as a result of this guidance. See Note 15 – Income taxes.
With few exceptions, we are no longer subject to possible income tax examinations by federal, state, or local taxing authorities for tax years before 2009, with the exception of loss carryforwards in the event they are utilized in future years.
Our tax returns are open to adjustment from 2001 forward, as a result of the fact that we have loss carryforwards from those years, which may be adjusted in the year those losses are utilized.
| 26 |
Fair Value of Financial Instruments
Our financial instruments are cash and cash equivalents, certificates of deposit, accounts receivable, accounts payable, capital lease obligations, and notes due from related party convertible debentures. The recorded values of cash and cash equivalents, accounts receivable, and accounts payable approximate their fair values based on their short-term nature. At December 31, 2012, the current value on the consolidated balance sheet of the debentures and capital lease obligations approximates fair value as the terms approximate those available for similar instruments. Certificates of deposit classified as short-term investments are recorded at fair value.
Emerging Growth Company
Section 107 of the JOBS Act provides that an emerging growth company can take advantage of the extended transition period provided in Section 7(a)(2)(B) of the Securities Act for complying with new or revised accounting standards. However, we are choosing to “opt out” of any extended transition period, and as a result we will comply with new or revised accounting standards on the relevant dates on which adoption of such standards is required for non-emerging growth companies. Section 107 of the JOBS Act provides that our decision to opt out of the extended transition period for complying with new or revised accounting standards is irrevocable.
Results of Operations
First Quarter of 2013 Compared to First Quarter of 2012
Revenues
Revenues in the first quarter of 2013 were $4,046,318, compared to $3,252,528 for the same period in 2012, an increase of $793,790, or 24.4%. This increase is due to an increase in the volume of product sales during the period together with an increase in service revenue. Product revenues in the first quarter of 2013 were $2,052,665, compared to $1,489,707 for the same period in 2012, an increase of $562,958, or 37.8%. This increase from the three months ended March 31, 2012 to March 31, 2013 was the aggregate of an increase in cogeneration sales of $695,906 and a decrease in chiller sales of $132,948. Our product mix, as well as product revenue, can vary significantly from period to period as our products are high dollar, low volume sales. As a result, such fluctuation is expected.
Service revenues in the first quarter of 2013 were $1,993,653, compared to $1,762,821 for the same period in 2012, an increase of $230,832, or 13.1%. Our service operation grows along with sales of cogeneration and chiller systems since the majority of our product sales are accompanied by a service contract or time and materials agreement. As a result, the number of units being serviced by our service department naturally grows with product sales.
Cost of Sales
Cost of sales in the first quarter of 2013 was $2,934,354, compared to $1,837,973 for the same period in 2012, an increase of $1,096,381, or 59.7%. During the first quarter of 2013 our gross profit margin was 27.5%, compared to 43.5% for the same period in 2012, a decrease of 16.0%. The decrease in overall gross margin is attributable to the recognition of an anticipated future loss of approximately $300,000 on a turnkey project in process as well as the sale of certain Ilios promotional units at below cost.
Contract Research and Development
Contract research and development income, which is classified as an offset to applicable expenses, for the three months ended March 31, 2013 and March 31, 2012, was $67,144 and $66,019, respectively, an increase of $1,125, or 1.7%.
Operating Expenses
Our general and administrative expenses consist of executive staff, accounting and legal expenses, office space, general insurance, and other administrative expenses. Our general and administrative expenses in the first quarter of March 31, 2013 were $1,791,703, compared to $1,684,744 for the same period in 2012, an increase of $106,959, or 6.3%. This increase was due to internal research and development costs incurred of $76,580 as well as an overall increase in operating costs attributable to being a newly public company.
| 27 |
Our selling expenses consist of sales staff, commissions, marketing, travel, and other selling-related expenses. Our selling expenses for the first quarter of 2013 were $279,370, compared to $267,929 for the same period in 2012, an increase of $11,441, or 4.3%. This increase is due to the increase in costs associated with trade shows, commissions, and royalties during the first quarter of 2013, compared to the same period in 2012.
Loss from Operations
Loss from operations for the first quarter of 2013 was $959,109, compared to $538,118 for the same period in 2012. The increase in the loss of $420,991 was due to the increase in cost of sales and operating expenses discussed above.
Other Income (Expense), net
Other expense, net, for the three months ended March 31, 2013 was $19,431, compared to $3,030 for the same period in 2012. Other income (expense) includes interest income and other income of $3,946, net of interest expense on notes payable of $23,377 for the first quarter of 2013. For the same period in 2012, interest and other income was $14,772 and interest expense was $17,802. The decrease in interest income of $10,826 is the result of short-term investments held during the first quarter of 2012 that were not held during the first quarter of 2013. The increase in interest expense of $5,575 was mainly due to $300,000 of demand notes payable issued during the fourth quarter of 2012.
Provision for Income Taxes
The Company did not record any benefit or provision for income taxes for the three months ended March 31, 2013 and 2012, respectively. As of March 31, 2013 and 2012, the income tax benefits generated from the Company’s net losses have been fully reserved.
Noncontrolling Interest
The noncontrolling interest share in the losses of Ilios was $118,147 for the three months ended March 31, 2013, compared to $102,835 for the same period in 2012, an increase of $15,312, or 14.9%. The increase was due to an increase in selling costs that Ilios incurred first quarter of 2013 associated with bringing the product to market. Noncontrolling interest ownership percentage as of March 31, 2013 and 2012 was 35.0% and 37.6%, respectively.
Year Ended December 31, 2012 Compared to Year Ended December 31, 2011
Revenues
Revenues in 2012 were $15,253,972, compared to $11,065,210 in 2011, an increase of $4,188,762, or 37.9%. This increase is largely due to an increase in the volume of product sales during the year together with an increase in service revenue. Product revenues in 2012 were $7,453,222, compared to $4,569,113 in 2011, an increase of $2,884,109, or 63.1%. This increase from the year ended December 31, 2011 to 2012 was the aggregate of an increase in cogeneration sales of $3,054,251 and a decrease in chiller sales of $170,142. Our product mix, as well as product revenue, can vary significantly from period to period as our products are high dollar, low volume sales. As a result, such fluctuation is expected.
Service revenues in 2012 were $7,800,750, compared to $6,496,097 for the same period in 2011, an increase of $1,304,653, or 20.1%. Our service operation grows along with sales of cogeneration and chiller systems since the majority of our product sales are accompanied by a service contract or time and materials agreement. As a result the number of units being serviced by our service department naturally grows with product sales.
Cost of Sales
Cost of sales in 2012 was $9,388,898, compared to $6,179,098 in 2011, an increase of $3,209,800, or 51.9%. Our gross profit margin was 38.4% in 2012, compared to 44.2% in 2011, a decrease of 5.8%. The decrease in overall gross margin is attributable to the sale of lower margin cogeneration units sold to an affiliated company.
Contract Research and Development
Contract research and development income, which is classified as an offset to applicable expenses, for the years ended December 31, 2012 and 2011 was $126,500 and $239,000, respectively, a decrease of $112,500. The majority of this decrease is due to the conclusion and wrap-up of a research and development contract, which ended on June 30, 2011.
| 28 |
Operating Expenses
Operating expenses increased in 2012 to $7,868,700, compared to $6,769,014 in 2011, an increase of $1,099,686, or 16.2%. This increase was due to a combination of increases in expenses such as salaries, outside labor, and other payroll-related expenses of approximately $570,000 due to the addition of several exempt and non-exempt employees; audit and other professional fees of $115,000; internal research and development of $135,000; attendance at trade shows and the related travel expenses of approximately $200,000; and various other expenses.
Selling expenses within this category increased in 2012 to $1,225,580, compared to $782,252 for the same period in 2011 due to the Company’s efforts in creating a stronger sales and marketing team, which began in 2011. This effort included hiring new personnel for both sales and marketing and hiring a public relations firm. In addition to the above, during the year ended December 31, 2012, the Company invested approximately $200,000 in trade shows and a traveling “road show” where three of the Company’s products were showcased on an enclosed trailer, which traveled up and down the West Coast. During the same period in 2011, the Company incurred approximately $50,000 in trade show expenses.
Loss from Operations
Loss from operations for the year ended December 31, 2012 was $2,003,626, compared to $1,882,902 for the same period in 2011. The increase in the loss of $120,724 was due to the increase in operating expenses discussed above.
Other Income (Expense), net
Other expense, net, for the year ended December 31, 2012 was $22,811, compared to $1,892 for the same period in 2011. Other income (expense) includes interest income and other income of $48,397, net of interest expense on notes payable of $71,208 in 2012. For the same period in 2011, interest and other income was $38,402 and interest expense was $40,294. The increase in interest income of $9,995 is the result of short-term investments held for the majority of 2012 that did not exist for most of 2011. The increase in interest expense of $30,914 was mainly due to $750,000 of demand notes payable issued during the third quarter of 2011.
Provision for Income Taxes
The Company did not record any benefit or provision for income taxes for the years ended December 31, 2012 and 2011, respectively. As of December 31, 2012 and 2011, the income tax benefits generated from the Company’s net losses have been fully reserved.
Noncontrolling Interest
The noncontrolling interest share in the losses of Ilios was $389,480 for the year ended December 31, 2012, compared to $310,293 for the same period in 2011, an increase of $79,187, or 25.5%. The increase was due to additional payroll costs that Ilios incurred in 2012, associated with the hiring of its Chief Operating Officer in June of 2011. Additional expenses included increased stock compensation expense and trade shows and travel-related expenses associated with bringing the product to market. Noncontrolling interest ownership percentage as of December 31, 2012 and 2011 was 35.0% and 32.6%, respectively.
Year Ended December 31, 2011 Compared to Year Ended December 31, 2010
Revenues
Revenues in 2011 were $11,065,210, compared to $11,311,229 in 2010, a decrease of $246,019, or 2.2%. The decrease is due to a combination of an overall decrease in product sales together with an increase in service revenue. Product revenue in 2011 was $4,569,113, compared to $5,543,605 in 2010, a decrease of $974,492, or 17.6%. This decrease from the year ended December 31, 2010 to 2011 was the aggregate of a decrease in cogeneration sales of $2,240,434, net of an increase in chiller sales of $1,265,942.
Our product mix, as well as product revenue, can vary significantly from period to period as our products are high dollar, low volume sales. As a result, such fluctuation is expected. Additionally, during the year ended December 31, 2010, we recognized revenue of approximately $1.4 million from one multi-unit cogeneration project. We did not experience a sale with similar revenue recognition in 2011. Shipments of chiller modules during 2011 accounted for 40.1% of product revenues, which represented an increase of $1,265,942. For the same period in 2010, chiller modules represented only 10.2% due to the $1.4 million sale of cogeneration modules. In addition, work in process as of December 31, 2011 and 2010 was $119,640 and $4,774, respectively. At December 31, 2011, there was a cogeneration unit that was substantially completed but did not ship until the following quarter. In accordance with our revenue recognition policy, the revenue for this unit was not recognized as of December 31, 2011.
| 29 |
Service revenue in 2011 was $6,496,097, compared to $5,767,624 in 2010, an increase of $728,473, or 12.6%. This increase is due to the growth in modules serviced under contract as well as the performance of several large consulting/installation projects during the year. In 2010, there were no consulting/turnkey projects performed. Tecogen offered turnkey installations to its customers up until 2006, and these Tecogen-installed locations have historically been our best sites in terms of run hours and energy generation. In 2011, our service operation went back to the installation business, whereby Tecogen service personnel install our equipment rather than only selling and servicing the modules. We are also offering consulting services whereby Tecogen engineers will support the installation effort.
Cost of Sales
Cost of sales in 2011 was $6,179,098, compared to $6,597,205 in 2010, a decrease of $418,107, or 6.3%. Our gross profit margin was 44.2% in 2011, compared to 41.7% in 2010, an increase of 2.5%. The improvement in gross margin is attributable to the sale of more chillers, which carry a higher margin, in the product mix versus sales of cogeneration devices.
Operating Expenses
Operating expenses were $6,769,014 in 2011, compared to $5,264,299 in 2010, an increase of $1,504,715, or 28.6%. The increase was due to a combination of non-cash compensation expense related to the issuance of restricted stock and option awards to our employees (which increased $247,288), the costs associated with the overhead, development, production, and sale of our subsidiary’s water heating product (approximately $952,000) as well as the addition of personnel to support the sales efforts of the service and installation operations (approximately $279,000).
Selling expenses for the years ended December 31, 2011 and 2010 were $782,252 and $290,505, respectively, an increase of $491,747. Approximately $200,000 of this increase is due to an increase in commission costs in 2011 since the Company experienced more commissionable sales during this period. The balance was due to the Company’s efforts in creating a stronger sales and marketing team, which began during 2011. This effort included hiring new personnel for both sales and marketing and hiring a public relations firm.
Loss from Operations
Loss from operations for the year ended December 31, 2011 was $1,882,902, compared to $550,275 for the year ended December 31, 2010, an increase of $1,332,627. This increase in loss from operations was due to a combination of non-cash compensation expense related to the issuance of restricted stock and option awards to our employees (which increased $247,288), the costs associated with the overhead, development, production, and sale of our subsidiary’s water heating product (approximately $952,000) as well as the addition of personnel to support the sales efforts of the service and installation operations (approximately $279,000).
Contract Research and Development
Contract research and development income, which is classified as an offset to applicable expenses, for the years ended December 31, 2011 and 2010 was $239,158 and $917,148, respectively. This decrease is due to the small engine development contract with the California Energy Commission, which included significant subcontract research work in 2010. This income offset cost of sales of $210,597 and $753,129, respectively, and operating expenses of $13,148 and $10,861, respectively, for the years ended December 31, 2011 and 2010. Total expenses offset by contract research and development grants for the year ended December 31, 2011 were $223,745, providing a net profit of $15,413. Total expenses offset by contract research and development grants for the year ended December 31, 2010 were $763,990, providing a net profit of $153,158.
| 30 |
Other Income (Expense), Net
Other expense, net, for 2011 was $1,892, compared to $13,706 for the same period in 2010. Other expense, net, includes interest income on cash balances and short-term investments and notes receivable from stockholder of $38,402 net of interest expense of $40,294 for 2011. For the same period in 2010, interest income was $23,574 and interest expense was $37,280. The increase in interest income is the result of the interest earned on notes receivable from a stockholder, which existed for twelve months during 2011 and six months during 2010.
Provision for Income Taxes
We did not record any benefit or provision for income taxes for the year ended December 31, 2011 and 2010, respectively. As of December 31, 2011 and 2010, the income tax benefits generated from the Company’s net losses have been fully reserved.
Noncontrolling Interest
The noncontrolling interest share in the losses in Ilios, our majority-owned subsidiary, was $310,293 in 2011, compared to $208,673 in 2010. The increase was due to additional payroll costs incurred by Ilios in 2011 as its Chief Operating Officer was hired in June of 2011. This increase in payroll costs was somewhat offset by the reduction in the noncontrolling interest ownership percentage as it decreased to 32.59% in 2011 from 37% in 2010.
Liquidity and Capital Resources
Consolidated working capital at March 31, 2013 was $2,583,135, compared to $4,078,704 at December 31, 2012, a decrease of $1,495,569. Included in working capital were cash and cash equivalents of $680,676 and short-term investments of $182,061 at March 31, 2013, compared to $1,572,785 in cash and cash equivalents and $181,859 in short-term investments at December 31, 2012. The decrease in working capital is due to increased operating expenses, increases in accounts receivable, and costs in excess of billing from turnkey projects, as well as the lack of any financing activities during the period.
Cash used in operating activities for the three months ended March 31, 2013 was $255,716, compared to $1,788,672 for the same period ended March 31, 2012. Our accounts receivable balance increased to $3,015,992 at March 31, 2013, compared to $2,700,243 at December 31, 2012, using $315,749 of cash due to timing of billing, shipments, and collections. Costs in excess of billing increased by $354,625 as of March 31, 2013, compared to December 31, 2012, using $354,625 of cash due to timing of billing on our turnkey projects. Our inventory increased to $3,405,699 as of March 31, 2013, compared to $3,356,622 as of March 31, 2012, using $49,077 of cash to purchase inventory to build modules in backlog.
Accounts payable increased to $1,461,908 as of March 31, 2013, from $1,151,010 at December 31, 2012, providing $310,898 in cash to purchase inventory. Accrued expenses increased to $1,006,540 as of March 31, 2013, from $807,922 as of December 31, 2012, providing $198,618 of cash for operations.
During the first quarter of 2013 our investing activities used $636,393 of cash and included purchases of property and equipment of $313,002 and expenditures related to intangible assets of $323,391.
At March 31, 2013, our commitments included various leases for office and warehouse facilities of $5,755,073 to be paid over several years through 2024. The source of funds to fulfill these commitments will be provided from cash and short-term investment balances, from operations, or through debt or equity financing.
On March 14, 2013, the Company received a prepayment for future 2013 purchases of modules, parts, and service from American DG Energy in the amount of $827,747. The Company provides a discount on these prepaid purchases equal to 6% per annum on deposit balances. The 6% discount is recorded as interest expense in the accompanying statements of operations. As of March 31, 2013, the outstanding balance on this prepayment was $826,822 and is included in due to related party in the accompanying condensed consolidated balance sheet.
On March 25, 2013, the Company entered into a Revolving Line of Credit Agreement, or the Credit Agreement, with John N. Hatsopoulos, our Chief Executive Officer. Under the terms of the Credit Agreement, Mr. Hatsopoulos has agreed to lend the Company up to an aggregate of $1 million, from time to time, at the written request of the Company. Any amounts borrowed by the Company pursuant to the Credit Agreement will bear interest at the Bank Prime Rate as quoted from time to time in the Wall Street Journal plus 1.5% per year. Interest is due and payable quarterly in arrears. Repayment of the principal amount borrowed pursuant to the Credit Agreement will be due on March 31, 2014, or the Maturity Date. Prepayment of any amounts due under the Credit Agreement may be made at any time without penalty. The Credit Agreement terminates on the Maturity Date. The Company has not yet borrowed any amounts pursuant to the Credit Agreement. Following this offering, the Company plans to evaluate the availability of debt financing through commercial banks.
| 31 |
Based on our current operating plan, we believe existing resources, including our line of credit and cash and cash flows from operations, will be sufficient to meet our working capital requirements for the next twelve months. As we continue to grow our business, our cash requirements may increase. As a result, we may need to raise additional capital through a debt financing or an equity offering to meet our operating and capital needs for future growth.
Our ability to continue to access capital could be impacted by various factors, including general market conditions and the continuing slowdown in the economy, interest rates, the perception of our potential future earnings and cash distributions, any unwillingness on the part of lenders to make loans to us, and any deterioration in the financial position of lenders that might make them unable to meet their obligations to us. If these conditions continue and we cannot raise funds through a public or private debt financing, or an equity offering, our ability to grow our business may be negatively affected and we may need to suspend and significantly reduce our operating costs until market conditions improve.
Seasonality
Our cogeneration and chiller system sales are not generally affected by the seasons, although customer goals will be to have chillers installed and running in the spring. Our service team does experience higher demand in the warmer months when cooling is required. These units are generally shut down in the winter and started up again in the spring. This “busy season” for the service team generally runs from May through the end of September.
Off Balance Sheet Arrangements
The Company currently has no material off balance sheet arrangements and has no plans to enter into any such arrangements.
| 32 |
BUSINESS
Overview
Tecogen designs, manufactures, sells, and services systems that produce electricity, hot water, and air conditioning for commercial installations and buildings and industrial processes. These systems, powered by natural gas engines, are efficient because they drive electric generators or compressors, which reduce the amount of electricity purchased from the utility, plus they use the engine’s waste heat for water heating, space heating, and/or air conditioning at the customer’s building. We call this cogeneration technology CHP for combined heat and power.
Tecogen manufactures three types of CHP products:
| • | Cogeneration units that supply electricity and hot water; |
| • | Chillers that provide air-conditioning and hot water; and |
| • | High-efficiency water heaters. |
All of these are standardized, modular, small-scale CHP products that reduce energy costs, carbon emissions, and dependence on the electric grid. Market drivers include the price of natural gas, local electricity costs, and governmental energy policies, as well as customers’ desire to become more socially responsible. Traditional customers for our cogeneration and chiller systems include hospitals and nursing homes, colleges and universities, health clubs and spas, hotels and motels, office and retail buildings, food and beverage processors, multi-unit residential buildings, laundries, ice rinks, swimming pools, factories, municipal buildings, and military installations; however, the economic feasibility of using our systems is not limited to these customer types. Through our factory-owned service centers in California, New York, Massachusetts, Connecticut, New Jersey, and Michigan our specialized technical staff maintain our products through long-term contracts. We have shipped approximately 2,000 units, some of which have been operating for almost 25 years. We have 66 full-time employees and 3 part-time employees, including 6 sales and marketing personnel and 39 service personnel.
Our CHP technology uses low-cost, mass-produced engines manufactured by GM and Ford, which we modify to run on natural gas. In the case of our mainstay cogeneration and chiller products, the engines have proved to be cost-effective and reliable. In 2009, our research team developed a low-cost process for removing air pollutants from the engine exhaust. Because these systems are fueled by natural gas, they typically produce lower levels of “criteria” air pollutants (those that are regulated by the EPA, because they can harm human health and the environment) compared with systems fueled by propane, gasoline, distillates, or residual fuel oil. We offer our new Ultra low-emissions technology as an option in our CHP systems.
After a successful field test of more than a year, in 2012 we introduced the technology commercially as an option for all of our products under the trade name Ultra (patent pending). The Ultra low-emissions technology repositions our engine-driven products in the marketplace, making them comparable environmentally with emerging technologies such as fuel cells, but at a much lower cost and greater efficiency.
Our products are designed as compact modular units that are intended to be applied in multiples when utilized for larger CHP plants. Approximately 68% of our CHP modules are installed in multi-unit sites ranging up to 12 units. This approach has significant advantages over utilizing single, larger units, such as building placement in constrained urban settings and redundancy during service outages. Redundancy is particularly relevant in regions where the electric utility has formulated tariff structures that have high “peak demand” charges. Such tariffs are common in many areas of the country, and are applied by such utilities as Southern California Edison, Pacific Gas and Electric, Consolidated Edison of New York, and National Grid of Massachusetts. Because these tariffs assess customers’ peak monthly demand charge over a very short interval (typically only 15 minutes), a brief service outage for a system comprised of a single unit is highly detrimental to the monthly savings of the system. For multiple unit sites, a full system outage is less likely and consequently these customers have a greater probability of capturing peak demand savings.
Our in-licensed microgrid technology enables our InVerde CHP products to provide backup power in the event of power outages that may be experienced by local, regional, or national grids.
Our CHP products are sold directly to customers by our in-house marketing team and by established sales agents and representatives, including American DG Energy and EuroSite Power which are affiliated companies. We have shipped approximately 2,000 units, some of which have been operating for almost 25 years. Our principal engine supplier is GM, and our principal generator supplier is Marathon Electric. To produce air conditioning, our engines drive a compressor purchased from J&E Hall International.
| 33 |
In 2009, we created a subsidiary, Ilios, to develop and distribute a line of high-efficiency heating products, starting with a water heater. We believe that these products are much more efficient than conventional boilers in commercial buildings and industrial processes (see “Our Products” below). As of the date of this prospectus, we own a 65.0% interest in Ilios.
Tecogen was formed in the early 1960s as the Research and Development New Business Center of Thermo Electron Corporation, which is now Thermo Fisher Scientific Inc. For the next 20 years, this group performed fundamental and applied research in many energy-related fields to develop new technologies. During the late 1970s, new federal legislation enabled electricity customers to sell power back to their utility. Thermo Electron saw a fit between the technology and know-how it possessed and the market for cogeneration systems.
In 1982, the Research and Development group released its first major product, a 60-kilowatt, or kW, cogenerator. In the late 1980s and early 1990s, they introduced air-conditioning and refrigeration products using the same gas engine-driven technology, beginning with a 150-ton chiller (tons are a measure of air-conditioning capacity). In 1987, Tecogen was spun out as a separate entity by Thermo Electron and, in 1992, Tecogen became a division of the newly formed Thermo Power Corporation.
In 2000, Thermo Power Corporation was dissolved, and Tecogen was sold to private investors including Thermo Electron’s original founders, Dr. George N. Hatsopoulos and John N. Hatsopoulos. Tecogen Inc. was incorporated in the State of Delaware on September 15, 2000. Our business and registered office is located at 45 First Avenue, Waltham, Massachusetts, 02451. Our telephone number is 781-466-6400.
Industry Background
During the 20th century, fossil-fuel power plants worldwide evolved toward large, complex central stations using high-temperature steam turbines. This technology, though steadily refined, reached a maximum efficiency of about 40% that persists to this day. [As used throughout, efficiency means electrical energy output per unit of fuel energy input.] According to the EPA website, the average efficiency of fossil-fuel power plants in the United States is 33% and has remained virtually unchanged for four decades.
According to a 2002 report from the Northwest Power Planning Council, titled “Natural Gas Combined-cycle Gas Turbine Power Plants,” the best efficiency obtainable at the time of the report was about 50% from a combined-cycle steam turbine. More recent reports have expressed that comparable efficiency rates are obtainable from a fuel cell. A combined-cycle system incorporates a second turbine powered by exhaust gases from the first turbine. Large-scale replacement of existing power plants with combined-cycle technology would require considerable capital investment and time. Fuel cells have high capital costs as well.
CHP, which harnesses waste energy from the power generation process and puts it to work on-site, can boost the efficiency of energy conversion to nearly 90%, a better than two-fold improvement over the average efficiency fossil fuel plant.
The implications of the CHP approach are significant. If CHP were applied on a large scale, global fuel usage might be curtailed dramatically. Small on-site power systems, in sizes like boilers and furnaces, would serve customers ranging from homeowners to large industrial plants. This is described as “distributed” energy, in contrast to central power.
CHP became recognized in the late 1970s as a technology important to aiding the reduction of fossil fuel consumption, pollution, and grid congestion. Since then, CHP has been applied increasingly around the world. According to a report by the International Energy Agency, or IEA, titled “Cogeneration and District Energy: Sustainable energy technologies for today...and tomorrow (2009),” the value of CHP technology to customers and policy makers stems from the fact that CHP systems are “inherently energy efficient and produce energy where it is needed.”
According to the IEA report, the benefits of CHP include:
| • | Dramatically increased fuel efficiency; |
| • | Reduced emissions of carbon dioxide (CO2) and other pollutants; |
| • | Cost savings for the energy consumer; |
| • | Reduced need for transmission and distribution networks; and |
| • | Beneficial use of local energy resources, providing a transition to a low-carbon future. |
| 34 |
CHP generates about 10% of the world’s electricity. According to the IEA report, CHP could supply up to 24% of the energy generation of the Group of Eight + Five countries, while meeting 40% of Europe’s target reductions in carbon emissions.
In the United States, CHP represents only about 8% of the generating capacity. A paper issued by the United States Department of Energy, or DOE, in 2012, Combined Heat and Power, A Clean Energy Solution, states that CHP is an underutilized resource. On August 30, 2012, the White House issued an executive order, or the Executive Order, aimed at promoting investments in industrial energy efficiency, including CHP, and established a national goal of deploying 40 GW (or 40,000 megawatts, or MW) of new CHP in the United States by 2020.
On-site CHP not only eliminates the loss of electric power during transmission, but also offsets the capital expense of upgrading or expanding the utility infrastructure. The national electric grid is already challenged to keep up with existing power demand. The grid consists of power generation plants as well as the transmission and distribution network consisting of substations and wires.
Power plants are aging, and plans for new power plants are on the decline (Figure 1). According to the U.S. Energy Information Administration’s “Form EIA-860 Annual Electric Generator Report (2010),” the average age of a U.S. coal-fired power plant is 44 years. Coal plants account for about 40% of the nation’s generation capacity.
Figure 1 – Proposed U.S. New Capacity: Coal, Natural Gas, Wind, and Nuclear
Source: National Energy Technology Laboratory, Tracking New Coal Fired Power Plants (2012).
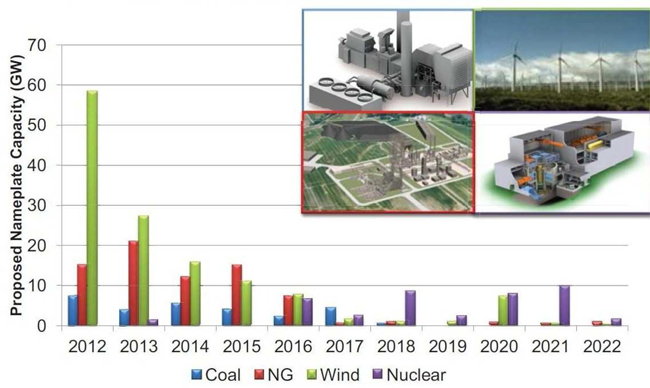
In addition, the transmission and distribution network is operating at capacity in urban areas. Decentralizing power generation by installing equipment at customer sites not only relieves the capacity burden on existing power plants, but also unburdens transmission and distribution lines. This ultimately improves the grid’s reliability and reduces the need for costly upgrades. Consolidated Edison, Inc., the electric utility of New York City and surrounding areas, has identified an opportunity to integrate energy efficiency, distributed generation, and demand response as a way to defer new infrastructure investments, according to the utility’s 2010 long-range plan.
| 35 |
We believe that increasingly favorable economic conditions could improve our business prospects domestically and abroad. Specifically, we believe that natural gas prices might increase from their current depressed values, but only modestly, while electric rates could go up over the long-term as utilities pay for better emission controls, efficiency improvements, and the integration of renewable power sources. The net result of relative gas and electric prices could be greater cost savings and annual rates of return to CHP customers.
Moreover, we believe that natural gas could win favor politically as a domestic fuel with low carbon emissions. Government policy, both here and abroad, might promote CHP as a way to conserve natural resources and reduce carbon and toxic emissions. Renewable wind and solar sources could encounter practical limitations, while nuclear power is likely to be affected by its safety setbacks.
Tecogen’s Strategy for Growth
Target markets and new customers
The traditional markets for CHP systems are buildings with long hours of operation and with coincident demand for electricity and heat. Traditional customers for our cogeneration systems include hospitals and nursing homes, colleges and universities, health clubs and spas, hotels and motels, office and retail buildings, food and beverage processors, multi-unit residential buildings, laundries, ice rinks, swimming pools, factories, municipal buildings, and military installations.
Traditional customers for our chillers overlap with those for our cogeneration systems. Chiller applications include schools, hospitals and nursing homes, office and apartment buildings, hotels, retailers, ice rinks and industrial facilities. Engine-driven chillers are utilized as replacements for aging electric chillers, since they both take up about the same amount of floor space.
The Company believes that the largest number of potential new customers in the U.S. require less than 1,000 kW of electric power and less than 1,200 tons of cooling capacity. We are targeting customers in states with high electricity rates in the commercial sector, such as California, Connecticut, Massachusetts, New Hampshire, New Jersey, and New York. These regions also have high peak demand rates, which favor utilization of our modular units in groups so as to assure redundancy and peak demand savings, as discussed above. Some of these regions also have generous rebates that improve the economic viability of our systems.
As stated earlier, the U.S. government’s goal, according to the Executive Order, is to deploy 40 GW (40,000 MW) of new CHP in the United States by 2020. In order to estimate the share of that new deployment of CHP that is addressable by products in our size range, we reference a study done by ICF International on the California market that breaks down projected market penetration by kW output range. According to the April 2010 Combined Heat and Power Market Assessment, prepared for the California Energy Commission, in 2029, new CHP in the size range of our products (50 kW to 500 kW), is projected to be 476 MW in the base case, or 684 MW if incentives such as carbon credits and power export credits are considered. This size range constitutes 17.4% of the total California market potential in the base case, or 11% in the case with incentives. If we assume California’s apportionment of small size CHP is applicable to the country, and conservatively extend the government’s goal of 40,000 MW to 2029, we can estimate the U.S. market addressable by our products as 17.4% of 40,000 MW in the base case (11% with incentives) which amounts to 6,972 MW (4,416 MW with incentives). If we assume we can capture 30% of the market for CHP products in the size range of 50 kW to 500 kW, we can estimate that our potential for new unit sales over the next twenty years is between 13,250 and 20,920 InVerde (100 kW) units, or approximately $1.5 to $2.4 billion in revenue, at $112,500 per unit.
The largest market sectors identified by ICF that are suitable for our products closely match our sales data from January 2007 through June 2012 (Figure 2).
| 36 |
Figure 2 – Tecogen Customer Distribution (CHP and Engine-Driven Chiller Systems)
From January 2007 through June 2012
Source: Tecogen Inc.
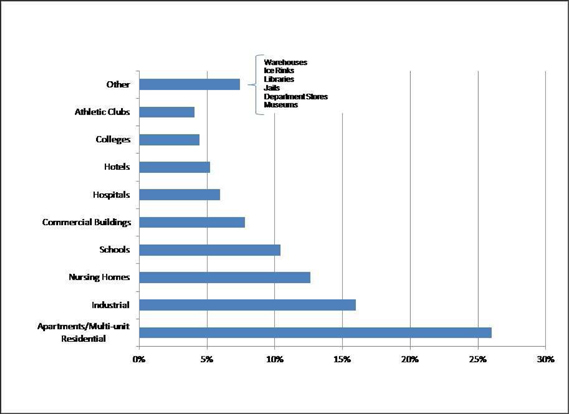
The ICF report reveals CHP’s relatively low existing market penetration in the smaller system sizes. Given that multi-megawatt CHP is already well-established (Table 1), the market opportunity increases as size decreases. Small systems (less than one MW) may grow almost six-fold. The missed opportunity is evident and likely even more disproportionate nationally. Most areas of the country, except the Northeast, are essentially without significant market penetration of small-scale (less than 500 kW) CHP systems.
Table 1 – CHP Market Penetration by Size in California and Potential Through 2029
Source: ICF International, Combined Heat and Power Market Assessment (2010)
| System Size (MW) | <1 | 1-4.9 | 5-19.9 | >20 | ||||||||||||
| 2009 Inventory (MW) | 200 | 350 | 750 | 7,900 | ||||||||||||
| New Potential Through 2029 (MW) | 1,138 | 1,279 | 764 | 3,015 | ||||||||||||
| Relative Growth Potential (%) | 569 | % | 365 | % | 102 | % | 38 | % | ||||||||
The DOE/EPA report confirms that CHP is a “largely untapped resource” and states that there is significant technical market potential for CHP at commercial and institutional facilities at just over 65 GW. This report also indicates that there was a significant decline in CHP in the early 2000s due to deregulation of the power markets that resulted in market uncertainty and delayed energy investments. However, a significant rebound and expansion of the CHP market may occur because of the following emerging drivers:
| · | Changing outlook for natural gas supply and pricing as a result of shale exploration; |
| · | Growing state policymaking and support; and |
| · | Changing market conditions for the power and industrial sectors such as ageing power plants and boilers, as well as more strict air regulations. |
| 37 |
We intend to seek both domestic and international customers in areas where utility pricing and government policy align with our advantages. These areas would include regions that have strict emissions regulations, such as California, or those that reward CHP systems that are especially non-polluting, such as New Jersey. There are currently 23 states that recognize CHP as part of their Renewable Portfolio Standards or Energy Efficiency Resource Standards and several of them, including New York, California, Massachusetts, New Jersey, and North Carolina, have initiated specific incentive programs for CHP (DOE/EPA report).
Our new microgrid capability, where multiple InVerde units can be seamlessly isolated from the main utility grid in the event of an outage and re-connected to it afterward, will likewise be exploited wherever utilities have resisted conventional generator interconnection but have conceded to UL-certified inverters (such as Consolidated Edison in New York and Pacific Gas and Electric Company in California). Because our InVerde systems operate independently from the grid, we also plan to exploit the need for outage security in certain market segments. These segments include military bases, hospitals, nursing homes, and hotels.
As noted above in “Industry Background,” the IEA report estimates that power from CHP produced by the Group of Eight + Five countries, currently at 10%, could increase to 24% under a best-case scenario. We hope to participate in a robust international market, which we believe will be as large as or larger than the domestic market.
Alliances
We continue to forge alliances with utilities, government agencies, universities, research facilities, and manufacturers. We have already succeeded in developing new technologies and products with several entities, including:
• General Motors Company – supplier of raw materials pursuant to a supplier agreement since the development of our cogeneration product in the early 1960s.
• California Energy Commission – research and development contracts since 2004.
• Sacramento Municipal Utility District – has provided test sites for the Company since 2010.
• Southern California Gas Company and San Diego Gas & Electric Company, each a Sempra Energy subsidiary – have granted us research and development contracts since 2004.
• Lawrence Berkeley National Laboratory – research and development contracts since 2005.
• Consortium for Electric Reliability Technology Solutions – research and development contracts and provided a test site to the Company since 2005.
• The AVL California Technology Center – support role in performance of research and development contracts as well as internal research and development on our emission control system from August 2009 to November 2011.
We also have an exclusive licensing agreement from the Wisconsin Alumni Research Foundation (WARF) for its proprietary control software that enables our microgrid system. The software allows our products to be integrated as a microgrid, where multiple InVerde units can be seamlessly isolated from the main utility grid in the event of an outage and re-connected to it afterward. The licensed software allows us to implement such a microgrid with minimal control devices and associated complexity and cost. Tecogen pays WARF a royalty for each cogeneration module sold using the licensed technology. Such royalty payments have been in the range of $5,000 to $20,000 on an annual basis through the year ended December 31, 2012. In addition, WARF reserved the right to grant non-profit research institutions and governmental agencies non-exclusive licenses to practice and use the inventions of the Licensed Patents for Non-Commercial Research Purposes.
Our efforts to forge partnerships continue to focus on utilities, particularly to promote the InVerde, our most utility-friendly product. The nature of these alliances varies by utility, but could include simplified interconnection, joint marketing, ownership options, peak demand mitigation agreements, and customer services. We are currently installing a microgrid with the Sacramento Municipal Utility District at its headquarters in Sacramento, California, where the central plant will incorporate three InVerde systems equipped with our Ultra low-emissions technology. Some expenses for this project are being reimbursed to the utility through a grant from the California Energy Commission.
Certain components of our InVerde product were developed through a grant from the California Energy Commission. This grant includes a requirement that Tecogen pay royalties on all sales of all products related to the grant. As of December 31, 2012, such royalties accrued in accordance with this grant agreement were less than $10,000 on an annual basis.
| 38 |
We also continue to leverage our resources with government and industry funding, which has yielded a number of successful developments. These include the Ultra low-emissions technology, sponsored by the California Energy Commission and Southern California Gas Company, and new 35-kW engine technology we developed with the California Energy Commission’s support.
Pursuant to the terms of the grants from the California Energy Commission, the California Energy Commission has a royalty-free, perpetual, non-exclusive licence to these technologies, for government purposes.
For the years ended December 31, 2012 and 2011, we spent $103,102 and $223,745, respectively, in research and development activities, all of which was reimbursed through from the California Energy Commission and the Consortium for Electric Reliability Technology Solutions.
Tecogen’s Solution
Our CHP products address the inherent efficiency limitation of central power plants by siting generation close to the loads being served. This allows customers with energy-intensive buildings or processes to reduce energy costs and operate with a lower carbon footprint. Furthermore, with technology we have introduced within the last two years, such as our Ultra low-emissions technology our products can now contribute to better air quality at the local level.
According to our estimates and public sources, our cogeneration systems convert nearly 90% of the natural gas fuel to useful energy in the form of electricity and hot water or space heat. This compares to about 40% for central power. Other on-site upgrades such as insulation or lighting can help cut energy use as well, but they do not displace nearly as much low-efficiency electricity. Our engine-driven chillers, when the waste heat is effectively used, offer similar efficiency benefits compared with running an electric chiller plus a furnace or boiler.
Cogeneration and chiller products can often reduce the customer’s operating costs (for the portion of the facility loads to which they are applied) by approximately 30% to 50% based on Company estimates, which provides an excellent rate of return on the equipment’s capital cost in many areas of the country with high electricity rates. Our chillers are especially suited to regions where utilities impose extra charges during times of peak usage, commonly called “demand” charges. In these cases, the gas-fueled chiller reduces the use of electricity during the summer, the most costly time of year.
Our water heater product, recently introduced by Ilios, operates like an electric heat pump but uses a natural gas engine instead of an electric motor to power the system (see “Our Products” for an explanation of the heat pump). The gas engine’s waste heat is recovered and used in the process, unlike its electric counterpart, which runs on power that has already lost its waste heat. As of the date of this prospectus, we have shipped four Ilios water heaters and have an additional four in production to fulfill current orders.
The net effect is that our heat pump’s efficiency far surpasses that of conventional boilers for water heating. Similarly, if used for space heating, the engine-powered heat pump would be more efficient than an electric heat pump, again because heat is recovered and used. The product’s higher efficiency translates directly to lower fuel consumption and, for heavy use customers, significantly lower operating costs.
Our products also address the global objective of reducing greenhouse gas emissions. When burned to generate power, natural gas produces lower carbon emissions per unit of energy than any fossil fuel (Table 2), according to the EPA combined heat and power emissions calculator.
Table 2 – Fossil Fuel Carbon Emissions
Source: EPA Emissions Calculator
| Fuel | CO2 emissions, lbs/million Btu | |||
| Natural Gas | 116.7 | |||
| Distillate Oil | 160.9 | |||
| Coal | 206.7 |
Our products, in addition to using the lowest amount of carbon fuel, further reduce CO2 emissions (greenhouse gases) because of CHP’s higher efficiency. Figure 3 compares the CO2 output of our products to that of the national electric grid and other generation technologies. Our products are far superior to the grid and even outperform the CHP technologies of fuel cells and microturbines.
| 39 |
Figure 3 – Comparison of Carbon Emissions (GHG) for Various Sources
Including Tecogen’s CHP and Chiller Products
Source: Tecogen Inc.
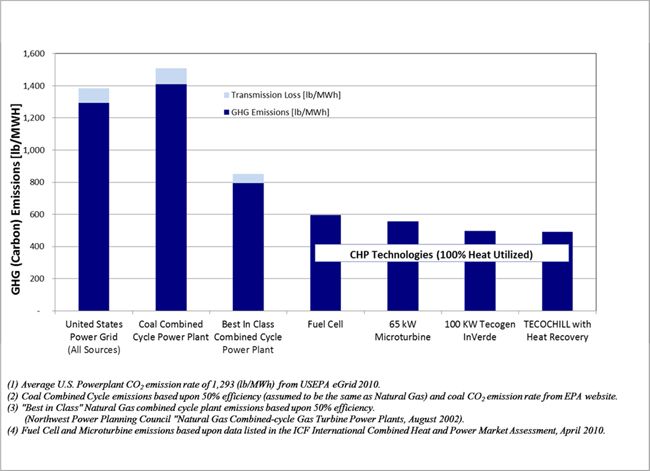
Furthermore, one Tecogen 100-kW CHP unit will reduce carbon emissions by 390 tons per year (based on 8,000 run-hours), which, according to the EPA website’s calculator, is the equivalent of 64 cars on the road. A microturbine of the same size would reduce carbon emissions by only 245 tons per year, the equivalent of 41 cars, which is less than two-thirds the emissions reduction of our CHP product. Our Ilios water heater also reduces CO2 emissions in proportion to its fuel savings.
In addition to reducing greenhouse gases, our products with Ultra low-emission controls can improve air quality by reducing such pollutants as NOx and CO. Figure 4 presents the annual output of emissions of the InVerde unit equipped with the Ultra technology and compares it to alternative energy technologies producing the equivalent energy output on an annual basis (100 kW, 670,000 Btu/hr). Thus, for example, in lieu of an InVerde, a building would obtain electricity from a power plant and heat energy from a boiler. As Figure 4 shows, the Ultra CHP system’s emissions are significantly less than the combined emissions of the power plant and boiler for the same energy output.
Figure 5 presents the criteria pollutant levels of the Ultra system versus alternative CHP sources of microturbines, fuel cells, and conventional reciprocating engines. Microturbines and fuel cells, newer CHP technologies typically considered low-emission alternatives to engines, produce more NOx than an Ultra engine CHP unit. Moreover, when compared to a conventional engine’s “best available control technology” (BACT) as defined by the EPA for natural gas engines, both NOx and CO are reduced by nearly tenfold. Consequently, the Ultra low-emissions technology is potentially transformative to the engine’s reputation in the energy marketplace, allowing it to now be characterized as a source of clean power.
| 40 |
Figure 4 – Comparison of Emissions
Levels of Tecogen’s Ultra
Low-Emissions Technology to Conventional Energy Sources
(Based on 6,000 hrs/year of operation at 100 kW and 670,000 Btu/hr)
Source: Tecogen Inc.
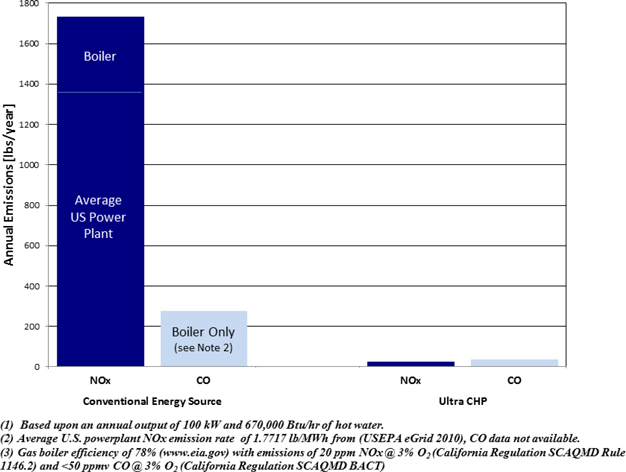
| 41 |
Figure 5 – Comparison of Tecogen Ultra Low-Emissions Technology to Other Technologies
Source: Tecogen Inc.
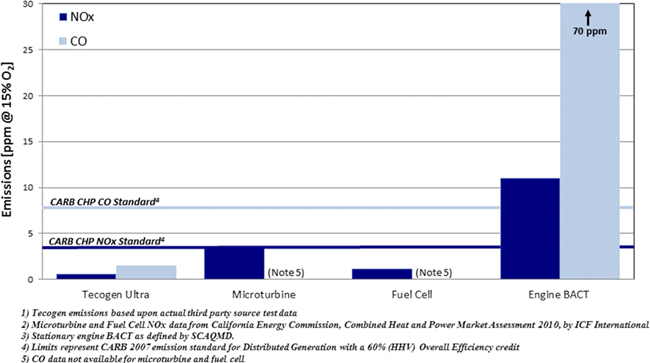
Our Products
We manufacture natural gas engine-driven cogeneration systems and chillers, all of which are CHP products that deliver more than one form of energy. We have simplified CHP technology for inexperienced customers. Our cogeneration products are all standard, modular units that come pre-packaged from the factory. They include everything the customer needs to minimize the cost and complexity of installing the equipment at a site. The package incorporates the engine, generator, heat-recovery equipment, system controls, electrical switchgear, emission controls, and modem for remote monitoring and data logging.
All of our cogeneration systems and most of our chillers use the same engine, the TecoDrive 7400 model supplied by GM and modified by us to use natural gas fuel. The small 25-ton chiller uses a similar GM engine, the 3000 model. We worked closely with GM and the gas industry (including the Gas Research Institute) in the 1980s and 1990s to modify the engine and validate its durability. For the Ilios water heater, we introduced a more modern Ford engine that is enhanced for industrial applications. As of the date of this prospectus, we have shipped four Ilios water heaters and have an additional four in production to fulfill current orders.
Our commercial product line includes:
| • | The InVerde® and TECOGEN® cogeneration units; |
| • | TECOCHILL® chillers; |
| • | Ilios high-efficiency water heaters; and |
| • | Ultra low-emissions technology. |
| 42 |
InVerde Cogeneration Units
Our premier cogeneration product is the InVerde, a 100-kW CHP system that not only provides electricity and hot water, but also satisfies the growing customer demand for operation during a utility outage, commonly referred to as “black-start” capability. The InVerde incorporates an inverter, which converts direct current, or DC, electricity to alternating current, or AC. With an inverter, the engine and generator can run at variable speeds, which maximize efficiency at varying loads. The inverter then converts the generator’s variable output to the constant-frequency power required by customers (50 or 60 Hertz), as shown in Figure 6.
This inverter technology was developed originally for solar and wind power generation. The company believes that the InVerde is the first commercial engine-based CHP system to use an inverter. Electric utilities accept inverter technology as “safe” by virtue of its certification to the Underwriters Laboratory interconnection standard (1741) – a status that the InVerde has acquired. This qualifies our product for a much simpler permitting process nationwide and is mandatory in some areas such as New York City and California. The inverter also improves the CHP system’s efficiency at partial load, when less heat and power are needed by the customer.
The InVerde’s black-start feature addresses a crucial demand from commercial and institutional customers who are increasingly concerned about utility grid blackouts and brownouts, natural disasters, security threats, and antiquated utility infrastructure. Multiple InVerde units can operate collectively as a standalone microgrid, which is a group of interconnected loads served by one or more power sources. The InVerde is equipped with software that allows a cluster of units to seamlessly share the microgrid load without complex controls.
The InVerde CHP system was developed in 2007, and we began shipping it in 2008. Our largest InVerde installation utilizes 12 units, which supply 1.2 MW of on-site power and about 8.5 million Btu/hr of heat (700,000 Btu/hr per unit).
Figure 6 – Diagram of InVerde CHP System
Source: Tecogen Inc.
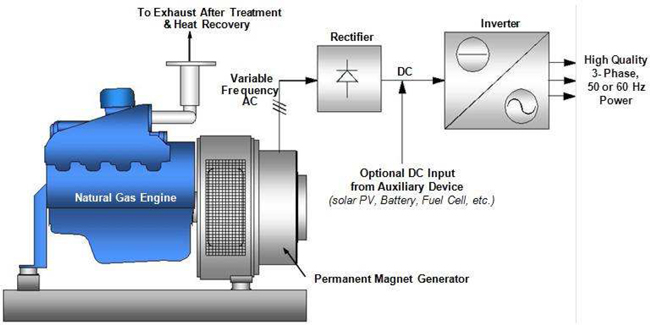
TECOGEN Cogeneration Units
The TECOGEN cogeneration system is the original model introduced in the 1980s, which is available in sizes of 60 kW and 75 kW, producing up to 500,000 Btu/hr of hot water. This technology is based on a conventional single-speed generator. It is meant only for grid-connected operation and is not universally accepted by utilities for interconnection, in contrast to the InVerde. Although this cogeneration product has the longest legacy and largest population, much of its production volume has been supplanted by the InVerde.
| 43 |
TECOCHILL Chillers
Our TECOCHILL natural gas engine-driven chillers are available in capacities ranging from 25 to 400 tons, with the smaller units air-cooled and the larger ones water-cooled. This technology was developed in 1987. The engine drives a compressor that makes chilled water, while the engine’s free waste heat can be recovered to satisfy the building’s needs for hot water or heat. This process is sometimes referred to as “mechanical” cogeneration, as it generates no electrical power, and the equipment does not have to be connected to the utility grid.
A gas-fueled chiller provides enough air conditioning to avoid most of the utility’s seasonal peak charges for electric usage and capacity. In summer when electric rates are at their highest, natural gas is “off-peak” and quite affordable. Gas-fueled chillers also free up the building’s existing electrical capacity to use for other loads.
Ilios High-Efficiency Water Heaters
Our newest product, the Ilios high-efficiency water heater, uses a heat pump, which captures warmth from outdoor air even if it is moderately cool outside. Heat pumps work somewhat like a refrigerator, but in reverse. Refrigerators extract heat from inside the refrigerator and move it outside the refrigerator. Heat pumps extract heat from outside and move it indoors. In both cases, fluids move the heat around by flowing through heat exchangers. At various points the fluids are compressed or expanded, which absorbs or releases heat.
In the Ilios water heater, the heat pump moves heat from outdoors to the water being heated in the customer’s building. The heat pump water heater serves as a boiler, producing hot water for drinking and washing or for space heating, swimming pools, or other building loads. Energy cost savings to the customer depend on the climate. Heat pumps in general (whether gas or electric) perform best in moderate weather conditions.
In a conventional electric heat pump, the compressor is driven by an electric motor. In the Ilios design, a natural gas-fueled engine drives the compressor. This means that the heat being captured from outdoors is supplemented by the engine’s waste heat, which increases the efficiency of the process. According to scientific studies, gas engine heat pumps can deliver efficiencies in excess of 200%.
Ultra Low-Emissions Technology
All of our CHP products are available with the Ultra low-emissions technology. This breakthrough technology was developed in 2009 and 2010 as part of a research effort funded by the California Energy Commission and Southern California Gas Company. The objective was to bring our emission control systems into compliance with California’s standards, which are the most stringent in the United States.
We were able to meet or exceed the standards with an emission control system that is cost-effective, robust, and reliable. The Ultra low-emissions technology keeps our CHP systems compliant with air quality regulations over the long term. Given the proprietary nature of this work, we filed patents that are pending in the United States, Europe, Australia, Brazil, Canada, China, Costa Rica, India, Israel, Japan, Mexico, New Zealand, Republic of Korea, Singapore, and South Africa. We shipped the first commercial CHP units equipped with Ultra low-emissions technology to a California utility in 2011.
We conducted three validation programs for this technology:
1. Third-party laboratory verification. The AVL California Technology Center, a long-standing research and technology partner with the international automotive industry, confirmed our results in their state-of-the-art dynamometer test cell, which was outfitted with sophisticated emissions measurement equipment.
2. Verifying longevity and reliability in the field. We did so by equipping one of our TECOGEN 75-kW units, already operating at a customer location in Southern California, with the Ultra low-emissions technology and a device to monitor emissions continuously. To date, the Ultra low-emissions system has operated successfully for more than 20,000 hours (approximately 3 years) and has consistently complied with California’s emission standards. This field test is ongoing.
3. Additional independent tests. During the field test, two companies licensed in California to test emissions each verified our results at different times. The results from one of these tests (obtained in August 2011) enabled us to qualify for New Jersey’s fast-track permitting. Virtually every state nationwide requires some kind of permit related to local air quality, but New Jersey allows an exemption for systems such as ours that demonstrate superior emissions performance. This certification was granted in November 2011, and since then we have sold Ultra low-emissions systems to several customers.
| 44 |
In 2012, a 75 kW CHP unit equipped with the Ultra system became our first unit to obtain a conditional air permit (i.e. pending a third party source test to verify compliance) in Southern California since the strict regulations went into place in 2009. A state-certified source test, administered in January 2013, verified that our emissions levels were well below the new permitting requirements so we expect the final permit version to be granted imminently. To date, we have shipped over thirty units fitted with the Ultra system to sites in the Northeast, as well as California.
Contribution to Revenue
The following table summarizes net revenue by product line and services for the years ended December 31, 2012, 2011, and 2010 and the three months ended March 31, 2013 and 2012:
| December 31, | March 31, | |||||||||||||||||||
| 2012 | 2011 | 2010 | 2013 | 2012 | ||||||||||||||||
| Products: | ||||||||||||||||||||
| Cogeneration | $ | 5,791,412 | $ | 2,737,161 | $ | 4,997,595 | $ | 1,278,156 | $ | 582,250 | ||||||||||
| Chiller | 1,661,810 | 1,831,952 | 566,010 | 774,509 | 907,457 | |||||||||||||||
| Total Product Revenue | 7,453,222 | 4,569,113 | 5,543,605 | 2,052,665 | 1,489,707 | |||||||||||||||
| Services | 7,800,750 | 6,496,097 | 5,767,524 | 1,993,653 | 1,762,821 | |||||||||||||||
| Total Revenue | $ | 15,253,972 | $ | 11,065,210 | $ | 11,311,229 | $ | 4,046,318 | $ | 3,252,528 | ||||||||||
Product Reliability
Our product lines have a long history of reliable operation. Since 1995, we have had a remote monitoring system in place that connects to hundreds of units daily and reports their “availability,” which is the amount of time a unit is running or is ready to run (% of hours). Figure 7 shows cumulative data for an installed base of 365 units. More than 80% of them operate above 90% availability, with the average being 93.5%. By comparison, the average availability for all fossil-fueled power plants in the United States was 87.5% during 2006-2010, according to a report by the North American Electric Reliability Corporation.
Figure 7 – Tecogen Product Reliability
Source: Tecogen Inc.
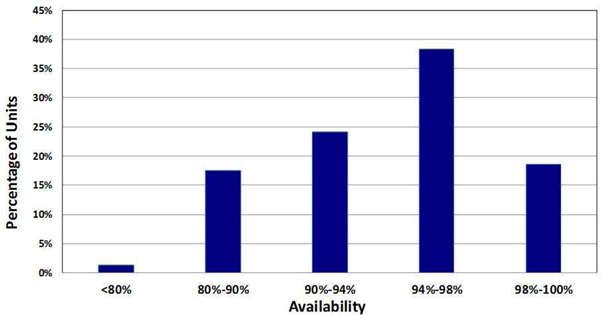
| 45 |
Product Service
We provide long-term maintenance contracts, parts sales, and turnkey installation through a network of eight well-established field service centers in California, the Midwest, and the Northeast. These centers are staffed by full-time Tecogen technicians, working from local leased facilities. The facilities provide offices and warehouse space for inventory. We encourage our customers to provide Internet or phone connections to our units so that we can maintain communications, in which case we contact the machines daily, download their status, and provide regular operational reports (daily, monthly, and quarterly) to our service managers. This communication link is used to support the diagnosis effort of our service staff and to send messages to preprogrammed phones that a unit has experienced an unscheduled shutdown.
Our service managers, supervisors, and technicians work exclusively on our products. Because we manufacture our own equipment, our service technicians bring hands-on experience and competence to their jobs. They are trained at our manufacturing facility in Waltham, Massachusetts.
Most of our service revenue is in the form of annual service contracts, which are typically of an all-inclusive “bumper-to-bumper” type, with billing amounts proportional to achieved operating hours for the period. Customers are thus invoiced in level, predictable amounts without unforeseen add-ons for such items as unscheduled repairs or engine replacements. We strive to maintain these contracts for many years, so that the integrity and performance of the machine are maintained. Between 2007 and 2012, approximately 68% of customers signed service contracts.
R&D Capabilities
Our research and development tradition and ongoing programs have allowed us to cultivate deep engineering expertise and maintain continuity over several decades. We have strong core technical knowledge that is critical to product support and enhancements. Our TecoDrive engine, cogeneration and chiller products, InVerde, and most recently the InVerde Ultra and Ilios heat pump water heater were all created and optimized with both public and private funding support.
In March 2013, we successfully completed a $1 million program with the California Energy Commission, which was awarded in 2009, to develop a small CHP engine (about 35 kW) that uses advanced automotive technology. The engine achieves a nearly 20% fuel efficiency gain over our current TecoDrive technology. The program included an endurance test to qualify the engine for the CHP duty cycle. Final development work to transition to the 2012 model year advanced engine will occur in 2013 with rollout on the Ilios water heating product in early 2014. In 2015, we plan to develop a smaller InVerde unit (~35 kW) around this engine platform
In October 2012, Tecogen was awarded a contract for a demonstration project to retrofit a natural-gas powered municipal water pump engine with Tecogen’s proprietary Ultra low-emissions technology. This project, co-sponsored by Southern California Gas Co.(SoCalGas), DE Solutions, and the Eastern Municipal Water District (EMWD) will be the first application of Tecogen’s emission control technology on a non-Tecogen engine, and an important proof of concept for its wider application. This system is scheduled to be commissioned in June 2013.
Tecogen also continues to support a contract with the DOE’s Lawrence Berkeley National Laboratory, awarded in 2012, for microgrid development work related to the InVerde.
Distribution Methods
Our products are sold directly to end-users by our sales team and by established sales agents and representatives. Various agreements are in place with distributors and outside sales representatives, who are compensated by commissions, including American DG Energy and EuroSite Power which are affiliated companies, for certain territories and product lines. For example, we have sales representatives for the chiller market in the New York City/New Jersey territory, but we do not have a sales representative for our cogeneration products in this territory. Sales through our in-house team or sales that are not covered by a representative’s territory carry no commission or only a fractional one.
In New England, our affiliate, American DG Energy, has exclusive sales representation rights to our cogeneration products only (not including chillers). In other words, when Tecogen sells its cogeneration products in New England, Tecogen pays a commission to American DG Energy. American DG Energy also has exclusive rights to our Ultra low-emissions technology if it is applied to engines from other CHP manufacturers in projects developed by American DG Energy. This means that American DG Energy could purchase CHP products from suppliers other than us and license that supplier to incorporate our Ultra low-emissions technology as long as the CHP system is owned and operated American DG Energy.
| 46 |
Summary of our Products’ Advantages
| • | Our CHP products provide an efficient on-site solution to power generation as the market seeks cost savings and clean alternatives to centralized grid power. | |
| • | Our CHP products are all standard, modular units that come pre-packaged from the factory to simplify installation and grid connection. The systems are supported in the field by a nationwide network of experienced professional staff. Standardized CHP units, as opposed to custom-designed systems, achieve lower cost, better quality control, higher reliability, and easier service. Emission controls are integrated, and complete system warranty and maintenance are available. | |
| • | Our Ultra low-emissions technology eliminates the air quality concerns associated with engines. Our units comply with the most rigorous air quality regulations, including California’s. | |
| • | Our cogeneration systems and chillers use standard, well-proven equipment made by reputable, well-established manufacturers. These components include rugged automotive engines, certified inverters, commercial generators, and conventional compressors. Certain key components are proprietary and have patent protection. Most notably, all control software is either proprietary (and copyright protected) or under an exclusive license agreement. Suppliers of the InVerde’s inverter and generator hold certain related patent protection. | |
| • | All of our CHP products can be designed for installation of multiple units at a single site, depending on the customer’s particular needs. This enhances the ability of our products to meet the building’s varying demand for electricity, heat, and/or air conditioning throughout the day and from season to season. Also, multiple units operate more efficiently throughout the range of a customer’s high and low energy requirements. | |
| • | Our InVerde product is opening new market opportunities and expanding our reach to customers beyond our traditional market segments. The InVerde’s black-start feature addresses a crucial demand from customers concerned about utility blackouts and brownouts, natural disasters, security threats, and antiquated grid infrastructure. The InVerde also provides premium-quality power, which is required by operators of computer server farms and precision instrumentation, for example. | |
| • | The InVerde overcomes barriers related to grid interconnection, since the product is UL-certified as utility-safe. In microgrids, InVerde units can help prevent brownouts by maximizing their power output when utilities approach peak capacity. Unlike standby diesel generators, the InVerde can operate without hourly limits because its emissions are so low, and it can serve as a stable anchor in hybrid microgrids that incorporate solar power. | |
| • | Our extensive use of standardized components lets us manufacture CHP products at competitive prices, even at relatively low production volumes. Proven, well-understood hardware increases the reliability and durability of the equipment and reduces the cost of servicing in the field. We are also able to minimize spare parts inventories and simplify training requirements. | |
| • | The Ilios heat pump water heater roughly doubles the efficiency of conventional water heating systems. The Ilios heat pump targets a large international market that is characterized by heavy, year-round use. This will increase fuel savings and maximize return on investment for the customer. Also, such applications are mostly central heating and cooling systems, rather than units distributed throughout the building, so it is easier to integrate new equipment. The heat pump water heater product competes only against other gas-fueled water heaters, which could expand our market beyond areas with high electric rates, and regulatory issues should be minimal. |
Competitive Position and Business Conditions
Our products fall into the broad market category of distributed generation systems that produce electric power on-site to mitigate the drawbacks of traditional central power and the low efficiency of conventional heating processes.
Renewable power sources, such as wind and solar, do not improve heating inefficiencies as CHP systems do, so they do not compete with our products. That is, CHP utilization is based on the redirection of fuel from an onsite boiler to an engine (or other device) for the production of electricity; the waste heat from the engine meets the heating load of the site with only a small incremental fuel consumption increase, but with the benefit of a significant amount of electricity production. As the boiler output cannot be displaced by renewable electricity production — the output of which is far more valuable displacing utility electric power, than used for water heating — the CHP opportunity remains available even in sites fully exploited relative to their renewable potential.
| 47 |
Cogeneration Systems
The ICF report breaks down the CHP market by technology as provided in Figure 8 below. We believe the California data applies to the domestic and international CHP market as a whole.
Figure 8 – Technology Size and Market Position
Source: ICF International, Combined Heat and Power Market Assessment (2010)
(Data from 2004)
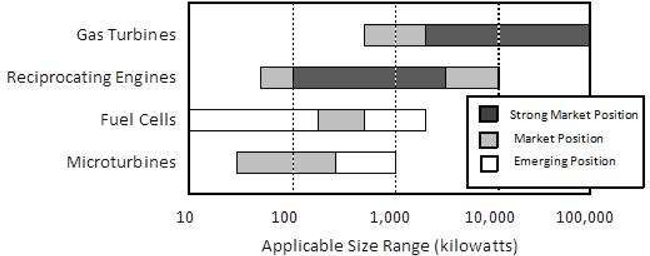
Our CHP products use automotive reciprocating engines originally designed for gasoline fuel and modified to run on natural gas. Diesel-fueled reciprocating engines will remain prominent in the CHP market, but only in larger, custom-designed systems (one MW or more), so these products do not compete with ours.
In smaller CHP sizes, competitors have duplicated our older design, coupling an automotive engine to a single-speed generator and adding controls and heat recovery. To be competitive with our designs, however, they would have to acquire comparable experience in the equipment and technology, installation contracting, maintenance and operation, economic evaluation of candidate sites, project financing, and energy sales, as well as the ability to cover broad regions. They would also have to meet the price of our products, which is low because we use standardized components.
We believe that no other company has developed a product that competes with our inverter-based InVerde, which offers UL-certified grid connection, outage capability, and variable-speed operation. We anticipate that an inverter-based product with at least some of these features will be introduced by others, but we believe that they will face serious challenges in duplicating the InVerde. Product development time and costs would be significant, and we expect that our patents and license for microgrid software will keep others from offering certain important functions.
If our patent application relating to the Ultra low-emissions technology is approved, it will make the development of alternative technologies difficult. If this is the case, we could retain a strong competitive advantage for all our products in markets where severe emissions limits are imposed or where very clean power is favored, such as New Jersey, California, and Massachusetts.
| 48 |
Newer technologies, such as fuel cells and microturbines, pose limited competition to our CHP products. ICF International’s 2010 CHP market assessment provides a comparison of the various small CHP technologies (50 - 500 kW), and a summary of this study is presented in Table 3. As shown, reciprocating engine CHP enjoys an economic advantage, as it has just over one-third the installed cost of a fuel cell and costs 20% less than a microturbine. With regard to operation and maintenance (O&M) costs, engine O&M costs are slightly less than those of microturbines, and just over half those of fuel cells. Although fuel cells have the highest electric efficiency (36%), they also have the lowest thermal output, so often fuel cells cannot recover enough heat to serve building loads effectively. Microturbines also recover less heat than engine CHP and have a lower electric efficiency. As a result, typical reciprocating engine CHP has the most favorable overall efficiency, at 79%, compared to 72% for microturbines and 67% for fuel cells.
With regard to pollutant emissions, Figure 5, above, compares all three technologies, along with the Tecogen engine CHP equipped with the Ultra technology. This figure illustrates that although fuel cells and microturbines are cleaner than conventional engine CHP (i.e., BACT), an engine equipped with Ultra technology now has comparable emissions to these other two technologies.
In the growing microgrid segment, neither fuel cells nor microturbines can respond to changing energy loads when the system is disconnected from the utility grid. Engines inherently have a fast dynamic response to step load changes, which is why they are the primary choice for emergency generators. Fuel cells and microturbines would require an additional energy storage device to be utilized in off-grid operation.
Most manufacturers of microturbines have refocused on other markets. We believe that Capstone Turbine Corporation is the only microturbine manufacturer with a commercial presence in CHP. Figure 9 reveals the modest impact of both microturbines and fuel cells in California’s CHP space.
| 49 |
Table 3 – Comparison of CHP Technologies
Source: ICF International, Combined Heat and Power Market Assessment (2010)
| Microturbine 50-500 kW | Fuel Cell 50-500 kW | Generic Engine 100 kW | ||||||||
| Installed Costs, $/kW | 2,739 | 6,310 | 2,210 | |||||||
| O&M Costs, $/kWh | 0.022 | 0.038 | 0.020 | |||||||
| Electric Efficiency, % | 25.2% | 36.0% | 28.4% | |||||||
| Thermal Output, Btu/kWh | 6,277 | 2,923 | 6,100 | |||||||
| Overall Efficiency, % | 72% | 67% | 79% |
Figure 9 – Share of Installed CHP by Prime Mover in California
Source: ICF International Combined Heat and Power Market Assessment (2010) - (Data from 2008)
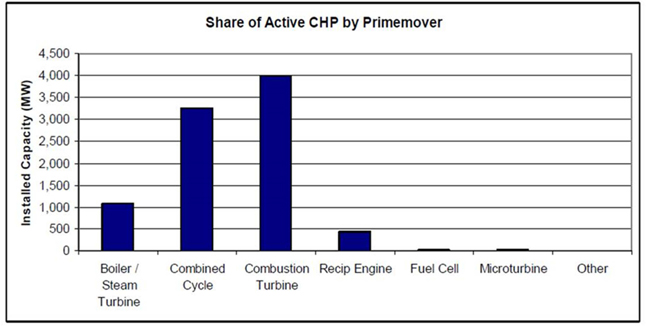
Engine Driven Chillers (TECOCHILL)
According to the Energy Solutions Center (a non-profit consortium), three companies make gas-engine-driven chillers that compete with our products: Trane, a division of Ingersoll-Rand plc, York, a division of Johnson Controls, Inc. and Alturdyne. Natural gas can also fuel absorption chillers, which use fluids to transfer heat without an engine drive.
Today’s low natural gas prices in the United States improve the economics of gas-fueled chillers, so more competition could emerge. However, engine chillers will continue to have an efficiency advantage over absorption machines. Chiller performance is measured in terms of cooling energy output per unit of fuel input. This industry standard is called the coefficient of performance, or COP. Absorption chillers achieve COPs of about 1.2 (see, for example, The Chartered Institution of Building Services Engineers’ Datasheet 07, Absorption Cooling, February 2012). Our TECOCHILL products reach efficiencies well above that level (COPs ranging from 1.6 to 2.6).
| 50 |
Ilios Engine-Driven Heat Pump
Although a few companies manufacture gas-engine heat pumps, their products are not directly comparable to the Ilios. The Ilios water heater and other heat pump products compete in both the high-efficiency water heating market and the CHP market. In a typical building, the Ilios heat pump would be added on to an existing heating/water heating system, but would be operated as many hours as possible. The conventional boiler would be left in place, but would serve mainly as a backup when the heat pump’s engine is down for maintenance or when the heat pump cannot meet the building’s peak heating load.
The best customers for the Ilios heat pump water heater would be very similar to those for traditional CHP – heavy consumers of hot water and process heat. In areas where low electric rates make CHP not economical, the Ilios heat pump could be a financially attractive alternative because its economics depend only on natural gas rates. In some areas with high electric rates, the Ilios option could have advantages over CHP. For example, where it is hard to connect to the utility grid or where the building’s need for electricity is too low for CHP to work economically. As of the date of this prospectus, we have shipped four Ilios water heaters and have an additional four in production to fulfill current orders.
Intellectual Property
We currently hold two United States patents for our technologies, both granted in 2007 and listed below:
| · | 7,239,034: “Engine driven power inverter system with cogeneration”. This patent pertains to the utilization of an engine-driven CHP module combined with an inverter and applies to our InVerde product specifically. |
| · | 7,243,017: “Method for controlling internal combustion engine emissions”. This patent applies to the specific algorithms used in our engine controller for metering the fuel usage to obtain the correct combustion mixture. It applies to most of our engines. |
In addition, we have licensed specific rights to microgrid algorithms developed by University of Wisconsin researchers for which we pay royalties to the assignee, The Wisconsin Alumni Research Foundation (WARF). The specific patent named in our agreement is “Control of small distributed energy resources” (7,116,010), granted in 2006. Our specific rights are valid for engine-driven systems utilizing natural gas or diesel fuel in the application of power generation where the per unit output is less than 500 kW.
We consider our patents and license to be important in the present operation of our business. The expiration, termination, or invalidity of one or more of these patents may have a material adverse effect on our business. Our earliest patent, that licensed from WARF, was issued in 2006 and expires in 2022. Most of our patents expire between 2022 and 2025.
We believe that no other company has developed a product that competes with our inverter-based InVerde. We anticipate that an inverter-based product with at least some of these features will be introduced by others, but we believe that competitors will face serious challenges in duplicating the InVerde. Product development time and costs would likely be significant, and we expect that our patent for the inverter-based CHP system (7,239,034) would offer significant protection, especially in key features. Likewise, we consider the microgrid license with WARF to be a key feature of our InVerde product, and one that would be difficult to duplicate outside the patent.
We have recently filed for patents in the United States, Europe, Australia, Brazil, Canada, China, Costa Rica, India, Israel, Japan, Mexico, New Zealand, Republic of Korea, Singapore, and South Africa for our Ultra low-emissions technology to keep its use exclusive to us. The outcome of the patent office application review is important because this technology will apply to all of our gas engine-driven products and may have licensing application to other natural gas engines. There is no assurance, however, that the Ultra low-emissions patent applications will be approved.
Government Regulation and Its Effect on Our Business
Several kinds of government regulations affect our current and future business, such as:
| • | Product safety certifications and interconnection requirements; |
| • | Air pollution regulations, which govern the emissions allowed in engine exhaust; |
| • | State and federal incentives for CHP technology; and |
| • | Electric utility pricing and related regulations. |
| 51 |
Regulations that control air quality and greenhouse gases might increasingly favor our low-emission products. Regulations related to utility rates and interconnection, which are burdensome today, could evolve to embrace CHP because of its efficiency benefits.
Product Safety Certifications and Interconnection Requirements
Our products must comply with various local building codes and must undergo inspection by local authorities. Our products are also certified by a third party to conform to specific standards. These certifications require continuous verification by a company that monitors our processes and design every three months. Our InVerde product is also certified to Europe’s standard CE mark (European Conformity), which is mandatory for products imported into the European Union for commercial sale.
Our cogeneration CHP products are also certified to a particular group of standards specific to the distributed power industry, which are used in the utility interconnection permitting process. These unique certifications were developed by various manufacturers, utilities, and government regulators to standardize the process of getting the utility’s permission to jointly power a facility.
In essence, manufacturers of standard products are allowed to submit a sample unit to be “type-tested” by a Nationally Recognized Testing Laboratory. This test proves that the product adheres to safety requirements and that its design is fail-safe. The product then becomes eligible for a fast-track interconnection, after passing simple site-specific screens. Under state-mandated regulations, such as California Rule 21 and Massachusetts Interconnection Tariff 09-03, most utilities must accept the fast-track process, which includes the certification.
Simplified utility interconnection is important to CHP projects, so our interconnect certification, Underwriters Laboratory Standard 1741, or UL Certification, is a significant competitive advantage. Obtaining the UL Certification was a major reason for us to develop the inverter-based CHP product. As with our other product certifications, we plan to maintain the certification through routine processes when modest design changes occur. When complete recertification is required, such as when a new revision to the standard is applicable or when the design undergoes a major upgrade, the company will follow the normal procedures for first-time certification (third party design review and test verification). The company does not anticipate any changes to the standard that would preclude recertification, as the underlying content is carefully administered by balanced committees (representing utilities, inverter suppliers, and academia). In addition, the standard and its utilization as the criterion for systems to qualify for simplified interconnection programs, is important for the solar PV industry. The company believes that this importance to the solar industry will help assure the long-term relevance in interconnection of distributed generation devices.
Air Pollution Regulations
Stationary natural gas engines are subject to strict emissions regulations that are part of a complex hierarchy of regional, state, and federal regulations. The EPA establishes technology-specific standards that are based on cost-benefit analysis for emission control strategies. These standards, termed BACT (best available control technology), are imposed in regions that fail to meet federal clean air standards. Local regulators can and do restrict engine emissions to lower levels.
In some instances, regional standards in our key markets have become sufficiently strict, presenting a challenge in controlling pollution from natural gas engines. However, our development of the Ultra low-emissions technology has addressed this issue, allowing us to permit our equipment in the strictest region of Southern California. In January 2013, a state-certified source test at a new customer’s site verified that our emissions levels were well below the new permitting requirements. Since we have now successfully removed this barrier, we are not only competitive in the California market, but have an advantage as a cleaner CHP technology. Likewise, in the Northeast where emissions regulations are trending towards California levels, we have already established our Ultra CHP as a certified technology in New Jersey, exempt from the air permitting process and subsequent testing, a unique status that separates us from the competition.
On the East Coast, important CHP territories are also moving toward limits below federal BACT levels. Effective in 2012, Massachusetts, Rhode Island, and Connecticut require 3.6 ppm NOx and about 56 ppm CO, which is on par with California’s BACT standard. New Jersey also emulates California’s BACT, but allows the project to side-step the air permit process if the CHP device is “emissions certified” through third-party testing to 10 ppm NOx and 10 ppm CO. Our Ultra low-emissions technology has qualified for New Jersey’s “clean” certification, as noted earlier. In New York, clean power is encouraged through state grants that exclude products, or reduce the grant amount, unless low emissions are demonstrated.
| 52 |
Air emissions regulations also affect our air conditioning and Ilios heat pump products, though the effects are muted. TECOCHILL rebates are not common, and none has been tied to a specific emissions level. The heat pump’s small size often exempts it from regulations, and the market for heat pump products could lie in lightly regulated regions (those with low electric rates). Nevertheless, the Ultra low-emissions technology can be applied to these products if required to meet regulatory standards.
State and Federal Incentives
On August 30, 2012, the White House released an Executive Order to accelerate investments in industrial energy efficiency, including CHP. The goal of the Executive Order is to supply 40 GW of energy by 2020 from greater efficiency sources such as CHP systems. The DOE, Commerce, and Agriculture, and the Environmental Protection Agency, or EPA, in coordination with the National Economic Council, the Domestic Policy Council, the Council on Environmental Quality, and the Office of Science and Technology Policy, shall coordinate policies to encourage investment in industrial efficiency in order to reduce costs for industrial users, improve U.S. competitiveness, create jobs, and reduce harmful air pollution. With this Executive Order, it is expected that barriers to CHP development will be removed with effective programs, policies, and financing opportunities, resulting in $40 - $80 billion in new capital investment in CHP. This initiative by the U.S. government may boost CHP awareness and stimulate market activity.
In addition, some states offer incentives to CHP systems. As mentioned above, California rebates a significant portion of the CHP project cost, while incentives of similar value exist in New Jersey, New York and Massachusetts, albeit with different structures and terms. Massachusetts has an additional CHP incentive in the form of an annual rebate proportional to the carbon savings versus conventional technology.
Our products are also eligible for the bonus depreciation included in the 2009 American Recovery and Reinvestment Act. Also, the Energy Improvement and Extension Act of 2008 provides a 10% investment tax credit for CHP in our size range, which applies to the total project cost. Our TECOCHILL and heat pump products also qualify for the credit when heat recovery achieves a minimum 60% efficiency.
Electric Utility Pricing and Related Regulations
Electricity prices, rate structures, and tariffs are another form of government incentive or disincentive. Utility pricing is administered through state agencies, typically public utility commissions, through formal proceedings involving the public, utilities, and various affected parties. Often, direct legislative mandates apply to specific issues. How these rules are structured and interpreted has a significant impact on the economic viability of CHP. These rules have hurt the CHP industry in the past, but we have designed our products to undermine their impact.
Demand Charges. Many electric utilities structure their commercial rates such that part of the customer’s bill is fixed charges such as meter fees, and part is peak demand charges, which are a much larger line-item based on the building’s maximum short-term usage (typically 15 minutes). Fixed charges, usually small, are not addressed by CHP technology. Avoidance of peak demand charges requires a CHP system to always operate at extremely high efficiency, which is difficult to achieve in practice.
Our CHP products, being small and modular, are often installed as multiple units. This protects the customer to some degree from incurring peak demand charges at the full system rating by providing equipment redundancy. The customer would then have to buy more electricity to make up for it, possibly incurring a large demand charge. With a modular, multi-unit CHP system, all the units would have to fail simultaneously to incur an equivalent charge.
Our TECOCHILLs are highly effective in eliminating not only summertime electricity usage, but also peak demand charges. The chiller’s operation is confined to the cooling season, allowing maintenance to be scheduled for other times. Outages during the cooling season can be managed to minimize their impact.
Avoided-Cost Penalties. In some regions, utilities have argued that CHP customers, by reducing their electric usage, have avoided paying their fair share of the costs associated with grid infrastructure. To correct this perceived inequity, some utilities have successfully petitioned their state commissions to impose a “departing load charge.” Utilities have also been allowed to add a “standby” surcharge to compensate for the cost of utility power being available when the CHP system is down.
These types of charges are not prevalent in East Coast states, but both standby and departing load charges are well-established in California. Although our CHP products are affected, our chillers and heat pumps are not.
Technology-Specific Net Metering. Interconnection issues are safety-related and should be product-neutral, but technology bias is common. In many states, CHP is excluded from net metering while other technologies are eligible. Under net metering, utilities must pay on-site generators for excess electricity that is fed into the grid. Net metering makes it easier to manage the operation of a CHP system or other generator.
| 53 |
Other Utility-Related Regulations. Another category of utility regulation that might affect our business is Renewable Portfolio Standards, or RPS. As of December 2012, some form of portfolio standards had been established in 42 states and the District of Columbia. According to the EPA, out of these states, 26—Arizona, Connecticut, Delaware, Colorado, Hawaii, Illinois, Indiana, Louisiana, Maine, Massachusetts, Michigan, Minnesota, Nevada, New Hampshire, New York, North Carolina, North Dakota, Ohio, Oklahoma, Pennsylvania, Rhode Island, South Dakota, Utah, Vermont, Washington and West Virginia—specifically mention CHP and/or waste heat-to-power as eligible under their RPS (or related efficiency/clean energy program guidelines). RPS-type mechanisms have been adopted in several other countries, including Britain, Italy, Poland, Sweden, Belgium, and Chile.
Overall, RPS appears to be a positive policy for Tecogen and CHP. Program structures, if fair and balanced, encourage less fossil fuel use by offering financial incentives to improve efficiency. Electric power generated from renewable sources would tend to increase overall electric rates and improve CHP investment returns. Since these programs are in their early stages, their impact is yet to be determined.
A national carbon “cap and trade” program is not anticipated in the foreseeable future. Cap and trade programs seek to reduce carbon emissions by putting a price on them. Of possible impact to Tecogen is the cap and trade bill moving forward in the California legislature. The program’s details are still being reviewed and negotiated by various government and advocacy groups.
Employees
As of the date of this prospectus, we employed 66 full-time employees and 3 part-time employees. We believe that our relationship with our employees is satisfactory. None of our employees are represented by a collective bargaining agreement; however, a few of our New Jersey service employees have been in contact with a labor union, and we are currently negotiating with this labor union.
Properties
Our headquarters is located in Waltham, Massachusetts, and consists of approximately 27,000 square feet of manufacturing, storage, and office space that is shared with Ilios, American DG Energy, and other tenants. Our lease, with an original expiration date of March 31, 2014, was renewed for an additional ten years and will expire March 31, 2024. We believe that our facilities are appropriate and adequate for our current needs.
Legal Proceedings
From time to time, we may become party to litigation or other legal proceedings that we consider to be a part of the ordinary course of our business. We are not currently involved in legal proceedings that could reasonably be expected to have a material adverse effect on our business, prospects, financial condition, or results of operations. We may become involved in material legal proceedings in the future.
| 54 |
MANAGEMENT AND GOVERNANCE
Directors and Executive Officers
The following table lists the current members of our Board of Directors and our executive officers. The address for our directors and officers is c/o Tecogen Inc., 45 First Avenue, Waltham, Massachusetts 02451.
| Name | Age | Position(s) | ||
| Angelina M. Galiteva | 46 | Chairperson of the Board of Directors | ||
| John N. Hatsopoulos | 79 | Chief Executive Officer and Director | ||
| Robert A. Panora | 59 | Chief Operating Officer and President | ||
| Bonnie J. Brown | 50 | Chief Financial Officer, Treasurer, and Secretary | ||
| George N. Hatsopoulos | 86 | Director | ||
| Ahmed F. Ghoniem | 61 | Director | ||
| Charles T. Maxwell | 81 | Director | ||
| Joseph E. Aoun | 60 | Director |
Angelina M. Galiteva, age 46, has been our Chairperson of the Board of Directors since 2005. She is founder and Chair of the Board for the Renewables 100 Policy Institute, a non-profit entity dedicated to the global advancements of renewable energy solutions since 2008. Ms. Galiteva is also Chairperson at the World Council for Renewable Energy (WCRE), which focuses on the development of legislative and policy initiatives to facilitate the introduction and growth of renewable energy technologies since 2003. Since 2011, Ms. Galiteva has served on the Board of Governors of the California Independent System Operator (CA ISO), providing direction and oversight for the CA ISO, which operates the California electricity grid. Also, Ms. Galiteva is a principal at New Energy Options, Inc., a company focusing on advancing the integration of sustainable energy solutions since 2006. Ms. Galiteva has also been a strategic consultant with Renewable Energy Policy and Strategy Consulting, since 2004. Ms. Galiteva holds a Master’s degree in Environmental and Energy Law, a law degree from Pace University School of Law, and a bachelor’s degree from Sofia University in Bulgaria.
Our Board of Directors has determined that Ms. Galiteva’s prior experience in the energy field qualifies her to be a member of the Board of Directors in light of the Company’s business and structure.
John N. Hatsopoulos, age 79, has been the Chief Executive Officer of the Company since the organization of the Company in 2000. He has also been the Chief Executive Officer of American DG Energy, (NYSE MKT: ADGE), a publicly traded company in the On-Site Utility business since 2000, and the Chairman of EuroSite Power, a subsidiary of American DG Energy, since 2009. Mr. Hatsopoulos is a co-founder of Thermo Electron Corporation, which is now Thermo Fisher Scientific (NYSE: TMO), and the retired President and Vice Chairman of the Board of Directors of that company. He is a member of the Board of Directors of Ilios, GlenRose Instruments Inc., or GlenRose Instruments, Agenus Inc. (NASDAQ: AGEN), American CareSource Holdings, Inc. (NASDAQ: ANCI), and TEI Biosciences Inc., and is a former Member of the Corporation of Northeastern University. The Company, American DG Energy, EuroSite Power, and GlenRose Instruments, are affiliated companies by virtue of common ownership. Mr. Hatsopoulos graduated from Athens College in Greece, and holds a bachelor’s degree in history and mathematics from Northeastern University, as well as honorary doctorates in business administration from Boston College and Northeastern University.
Mr. Hatsopoulos is the Company’s Chief Executive Officer and is also the Chief Executive Officer of American DG Energy and the Chairman of GlenRose Instruments. On average, Mr. Hatsopoulos spends approximately 50% of his business time on the affairs of the Company; however, such amount varies widely depending on the needs of the business and is expected to increase as the business of the Company develops.
Our Board of Directors has determined that Mr. Hatsopoulos’ prior experience as co-founder, president and Chief Financial Officer of Thermo Electron Corporation, where he demonstrated leadership capability and gained extensive expertise involving complex financial matters, and his extensive knowledge of complex financial and operational issues qualify him to be a member of the Board of Directors in light of the Company’s business and structure.
| 55 |
Robert A. Panora, age 59, has been our Chief Operating Officer and President since the organization of the Company in 2000 and the Chief Operating Officer of Ilios since its inception in 2009. He had been General Manager of Tecogen’s Product Group since 1990 and Manager of Product Development, Engineering Manager, and Operations Manager of the Company since 1984. Over his 27-year tenure with Tecogen, Mr. Panora has been responsible for sales and marketing, engineering, service, and manufacturing. Mr. Panora contributed to the development of Tecogen’s first product, the CM-60 cogeneration system, and was Program Manager for the cogeneration and chiller projects that followed. Mr. Panora has had considerable influence on many aspects of Tecogen’s business, from building the employee team, to conceptualizing product designs and authoring many of the original business documents, sales tools, and product literature pieces. Mr. Panora has a bachelor’s and master’s degrees in Chemical Engineering from Tufts University.
Bonnie J. Brown, age 50, has been our Chief Financial Officer since 2007, our Secretary since 2010, and our Treasurer as of January 1, 2013. Ms. Brown joined the Company in 2005 as Controller. She has also been the Chief Financial Officer of Ilios since its inception in 2009. Prior to joining Tecogen, Ms. Brown was a partner at Sullivan Bille PC, a regional accounting firm, for 15 years, where she provided financial, accounting, audit, tax, and business consulting services for mid-sized companies. Ms. Brown has also worked at Enterprise Bank and Trust (NASDAQ: EBTC) as project manager for special assignments, including branch acquisitions and information systems transitions in the trust department eventually serving as Internal Audit Director, establishing an in-house audit function. She has also provided independent contractor services for a wide variety of publicly traded and closely held companies, including consulting, internal control, and Sarbanes-Oxley compliance services. Ms. Brown is a CPA and holds a B.S. in Accountancy from Bentley College and an M.S. in Computer Information Systems from Boston University.
George N. Hatsopoulos, age 86, has been a member of our Board since the organization of the Company in 2000. He is the founder and Chief Executive Officer of Pharos, LLC, or Pharos, an organization devoted to the creation of leading edge business ventures and he is a member of the Board of Directors of American DG Energy, an affiliated company by virtue of common ownership. He is the founder and chairman emeritus of Thermo Electron Corporation and served as Chairman and Chief Executive Officer since its founding in 1956 until his retirement from those positions in 1999. Dr. Hatsopoulos has served on the board of the Federal Reserve Bank of Boston, including a term as chairman. He was a member of the SEC Advisory Committee on Capital Formation and Regulatory Process, the Advisory Committee of the U.S. Export-Import Bank, and the boards of various corporations and institutions. Dr. Hatsopoulos is a fellow of the American Academy of Arts and Sciences, the American Society of Mechanical Engineers, and other scientific and technical organizations. He is the recipient of numerous honors and awards in engineering, science, industry, and academics; has authored over 60 articles in professional journals; and is the principal author of textbooks on thermodynamics and thermionic energy conversion. Dr. Hatsopoulos has been a faculty member and senior lecturer at Massachusetts Institute of Technology, or MIT, and continues his association with MIT as a Life Member of the Corporation. Dr. Hatsopoulos holds bachelors, masters and doctorate degrees from MIT, all in mechanical engineering.
Our Board of Directors has determined that Dr. Hatsopoulos’ prior experience as founder, Chairman, and Chief Executive Officer of Thermo Electron Corporation, where he demonstrated leadership capability and gained extensive expertise involving complex financial matters, and his extensive knowledge of complex financial and operational issues qualify him to be a member of the Board of Directors in light of the Company’s business and structure.
Ahmed H. Ghoniem, age 61, has been a member of our Board since 2008. He is the Ronald C. Crane Professor of Mechanical Engineering at MIT. He is also the director of the Center for 21st Century Energy, and the head of Energy Science and Engineering at MIT, where he plays a leadership role in many energy-related activities, initiatives and programs. Mr. Ghoniem joined MIT as an assistant professor in 1983. He is an associate fellow of the American Institute of Aeronautics and Astronautics, and Fellow of American Society of Mechanical Engineers. Recently, he was granted the KAUST Investigator Award. He is a member of the Board of Directors of EuroSite Power, and Ilios, which are affiliated companies by virtue of common ownership. Mr. Ghoniem holds a Ph.D. in Mechanical Engineering from the University of California, Berkeley, and an M.S. and B.S. in Mechanical Engineering from Cairo University.
Our Board of Directors has determined that Dr. Ghoniem’s prior experience as a Professor of Mechanical Engineering at MIT and his prior experience in the energy sector qualify him to be a member of our Board of Directors in light of our business and structure.
Charles T. Maxwell, age 81, has been a member of our Board since 2001. He is a widely recognized expert in the energy sector, with over 40 years of experience with major oil companies and investment banking firms. From 1999, until his retirement in 2012, Mr. Maxwell was a Senior Energy Analyst with Weeden & Co. of Greenwich, Connecticut, since 1999, where he develops strategic data and forecasts on oil, gas, and power markets. Mr. Maxwell is a member of the Board of Directors of American DG Energy, an affiliated company by virtue of common ownership. Since the early 1980s, he has been an active member of an Oxford-based organization comprised of present or past OPEC-county oil ministers and other oil industry executives from 30 countries who meet twice annually to analyze trends in global energy markets. He is a member of the board of directors of Daleco Resources Corporation (OTCQB: DLOV) and Lescarden Inc. (OTC: LCAR). Mr. Maxwell holds a bachelor’s degree in political science from Princeton University and holds a B.A. from Oxford University as a Marshall Scholar in Middle East literature and history.
| 56 |
Our Board of Directors has determined that Mr. Maxwell’s prior experience in the energy sector and his extensive experience as a director of public companies qualifies him to be a member of the Board of Directors in light of the Company’s business and structure.
Joseph E. Aoun, age 60, has been a member of our Board since 2011. He has been President of Northeastern University since 2006. President Aoun is recognized as a leader in higher education policy and serves on the board of directors of the American Council on Education as well as the Boston Private Industry Council, Boston World Partnerships, Jobs for Mass, and the New England Council. He is a member of the Executive Committee of the Greater Boston Chamber of Commerce, a member of the Massachusetts Business Roundtable and Massachusetts Math & Science Initiative, and serves on the Leadership Council for the Mass Life Sciences Collaborative and as co-chair of the City to City Boston initiative. President Aoun is the recipient of numerous honors and awards and is an internationally known scholar in linguistics. President Aoun holds a master’s degree in Oriental Languages and Literature from Saint Joseph University, Beirut, Lebanon; Diploma of Advanced Study General and Theoretical Linguistics, University of Paris VIII, Paris, France; and a Ph.D. Linguistics and Philosophy from MIT.
Our Board of Directors has determined that Dr. Aoun’s prior experience as the President of Northeastern University and his prior experience in the energy sector qualify him to be a member of our Board of Directors in light of our business and structure.
Each executive officer is elected or appointed by, and serves at the discretion of, our Board of Directors. The elected officers of the Company will hold office until their successors are duly elected and qualified, or until their earlier resignation or removal.
Family Relationships
There are no family relationships among members of our Board of Directors and executive officers other than George N. Hatsopoulos and John N. Hatsopoulos, who are brothers.
Board Composition
The number of directors of the Company is established by the Board of Directors in accordance with our bylaws. The exact number of directors is currently set at six by resolution of the Board of Directors. The directors are elected to serve for one year terms, with the term of directors expiring each year at the annual meeting of stockholders; provided further, that the term of each director shall continue until the election and qualification of a successor and be subject to such director’s earlier death, resignation or removal.
Our certificate of incorporation and bylaws provide that the authorized number of directors may be changed only by resolution of the Board of Directors, and also provide that our directors may be removed only for cause by the affirmative vote of the holders of at least 75% of the votes that all our stockholders would be entitled to cast in an annual election of directors, and that any vacancy on our Board of Directors, including a vacancy resulting from an enlargement of our Board of Directors, may be filled only by vote of a majority of our directors then in office.
We have no formal policy regarding board diversity. Our priority in selection of board members is identification of members who will further the interests of our stockholders through his or her established record of professional accomplishment, the ability to contribute positively to the collaborative culture among board members, knowledge of our business, and understanding of the competitive landscape.
Board Committees
Our Board of Directors directs the management of our business and affairs and conducts its business through meetings of the Board of Directors and our committees: the Audit Committee, the Compensation Committee, and the Nominating and Governance Committee.
The members of the Audit Committee are Dr. Ghoniem, Ms. Galiteva, and Mr. Maxwell. The members of the Compensation Committee are Dr. Aoun, Ms. Galiteva, and Dr. Ghoniem. The members of our Nominating and Governance Committee are Dr. Aoun, Dr. Ghoniem and Mr. Maxwell. All committee members have been determined to be independent by our Board of Directors in accordance with the rules of the NASDAQ Capital Market rules. The Board of Directors has also determined that Mr. Maxwell qualifies as an Audit Committee financial expert. In addition, from time to time, other committees may be established under the direction of the Board of Directors when necessary to address specific issues.
| 57 |
The functions of the Audit Committee include reviewing and supervising the financial controls of the Company; appointing, compensating, and overseeing the work of the independent auditors; reviewing the books and accounts of the Company; meeting with the officers of the Company regarding the Company’s financial controls; acting upon recommendations of the independent auditors; and taking such further actions as the Audit Committee deems necessary to complete an audit of the books and accounts of the Company. The charter of the Audit Committee will be available on the Company’s website at www.tecogen.com.
The Compensation Committee’s functions include reviewing with management cash and other compensation policies for employees, making recommendations to the Board of Directors regarding compensation matters and determining compensation for the Chief Executive Officer. Our Chief Executive Officer has been instrumental in the design and recommendation to the Compensation Committee of compensation plans and awards for our directors and executive officers including our President, Chief Operating Officer and Chief Financial Officer. All compensation decisions for the Chief Executive Officer and all other executive officers are reviewed and approved by the Compensation Committee, subject to ratification by the Board of Directors. The charter of the Compensation Committee will be available on the Company’s website at www.tecogen.com.
The Nominating and Governance Committee functions are to identify persons qualified to serve as members of the Board of Directors, to recommend to the Board of Directors persons to be nominated by the Board of Directors for election as directors at the annual meeting of stockholders and persons to be elected by the board to fill any vacancies, and recommend to the Board of Directors persons to be appointed to each of its committees. In addition, the Nominating and Governance Committee is responsible for developing and recommending to the Board of Directors a set of corporate governance guidelines applicable to the Company (as well as reviewing and reassessing the adequacy of such guidelines as it deems appropriate from time to time) and overseeing the annual self-evaluation of the Board of Directors. The charter of the Nominating and Governance Committee is available on the Company’s website at www.tecogen.com.
Director Compensation
Each director who is not also one of our employees will receive a fee of $500 per day for service on those days that our Board of Directors and/or each of the Audit, Compensation, or Nominating and Governance Committees hold meetings, or otherwise conduct business. Non-employee directors also will be eligible to receive stock or options awards under our 2011 Stock Incentive Plan, as amended, or the Stock Plan. We reimburse all of our non-employee directors for reasonable travel and other expenses incurred in attending Board of Directors and committee meetings. Any director who is also one of our employees receives no additional compensation for serving as a director. Our non-employee directors did not receive any compensation in cash prior to or during 2010. Until December 2011, the compensation of directors was only in stock awards.
Board Leadership Structure
We separate the roles of Chief Executive Officer and Chairman in recognition of the differences between the two roles. Our Chief Executive Officer is responsible for setting the strategic direction for the Company and the overall leadership and performance of the Company. Our Chairman provides guidance to the Chief Executive Officer, sets the agenda for Board of Director meetings, presides over meetings of the full Board of Directors, and leads all executive meetings of the independent directors. We are a small company with a small management team, and we feel the separation of these roles enhances high-level attention to our business.
Our Board of Directors’ Role in Risk Oversight
Our Board of Directors oversees our risk management processes directly and through its committees. Our management is responsible for risk management on a day-to-day basis. The Audit Committee assists the Board of Directors in fulfilling its oversight responsibilities with respect to risk management in the areas of financial reporting, internal controls, and compliance with legal and regulatory requirements, and discusses policies with respect to risk assessment and risk management, including guidelines and policies to govern the process by which the Company’s exposure to risk is handled. The Compensation Committee assists the Board of Directors in fulfilling its oversight responsibilities with respect to the management of risks arising from our compensation policies and programs. The Nominating and Governance Committee assists the Board of Directors in fulfilling its oversight responsibilities with respect to the management of risks associated with board organization, membership and structure, succession planning for our directors, and corporate governance.
| 58 |
Code of Business Conduct and Ethics
The Company has adopted a code of business conduct and ethics that applies to the Company’s directors, officers, and employees. The Company’s code of business conduct and ethics is intended to promote honest and ethical conduct, including the ethical handling of actual or apparent conflicts of interest between personal and professional relationships; full, fair, accurate, timely and understandable disclosure in reports and documents that the Company files with, or submits to, the SEC and in other public communications made by the Company; compliance with applicable governmental laws, rules and regulations; prompt internal reporting of violations of the code of business conduct and ethics to an appropriate person or persons identified in the code of business conduct and ethics; and accountability for adherence to the code of business conduct and ethics. The Company’s code of business conduct and ethics is available on the Company’s website at www.tecogen.com.
| 59 |
EXECUTIVE OFFICER AND DIRECTOR COMPENSATION
Executive Compensation
The Compensation Committee and Board of Directors construct policies and guidelines regarding executive compensation. The major components of executive compensation will be base salary, annual incentive bonuses, equity incentive awards, and customary employee benefits. Among the factors likely to be relevant are:
| • | the executive officer’s skills and experience; |
| • | the particular importance of the executive officer’s position to us; |
| • | the executive officer’s individual performance; |
| • | the executive officer’s growth in his or her position; and |
| • | base salaries for comparable positions within our Company and at other companies. |
Our Compensation Committee performs evaluations of our executive officers’ compensation at least annually and may solicit the input of a compensation consulting firm and peer group benchmarking data in making any adjustments believed to be appropriate.
The following table sets forth information with respect to the compensation of our executive officers as of December 31, 2012:
Summary Compensation Table
| Name and principal position | Year | Salary ($) | Bonus ($) | Stock awards ($) | Option awards ($)(1) | All other compensation ($) | Total ($) | |||||||||||||||||||
| John N. Hatsopoulos | 2012 | 1 | — | — | — | — | 1 | |||||||||||||||||||
| Chief Executive Officer | 2011 | 1 | — | — | — | — | 1 | |||||||||||||||||||
| (Principal Executive Officer) | ||||||||||||||||||||||||||
| Robert A. Panora (2)(3) | 2012 | 163,770 | — | — | — | 1,032 | 164,802 | |||||||||||||||||||
| Chief Operating Officer and President | 2011 | 163,770 | — | — | 123,408 | 1,032 | 288,210 | |||||||||||||||||||
| Bonnie J. Brown (4) | 2012 | 156,000 | — | — | — | 360 | 156,360 | |||||||||||||||||||
| Chief Financial Officer and Secretary | 2011 | 156,000 | — | — | — | 360 | 156,360 | |||||||||||||||||||
| (Principal Financial Officer) | ||||||||||||||||||||||||||
| Anthony S. Loumidis (5)(6) | 2012 | 25,091 | — | — | — | — | 25,091 | |||||||||||||||||||
| Vice President and Treasurer | 2011 | 12,994 | 10,000 | — | 37,022 | — | 60,016 | |||||||||||||||||||
| (1) | The amounts in the “Stock Option Awards” column reflect the aggregate grant date fair value of the awards computed in accordance with FASB ASC Topic 718. The assumptions used by us with respect to the valuation of stock and option awards are set forth in Note 10 – Stockholders’ Equity to our financial statements included elsewhere in this registration statement. |
| (2) | Includes stock option award to purchase 125,000 shares of common stock at a purchase price of $2.60 per share granted on February 15, 2011, with 31,250 of the shares vesting on February 15, 2012, and then an additional 31,250 shares on each of the subsequent three anniversaries, subject to acceleration of vesting upon a change in control. |
| (3) | Includes group life insurance of $1,032 for 2012 and 2011, respectively. |
| (4) | Includes group life insurance of $360 for 2012 and 2011. |
| (5) | Includes stock option award to purchase 37,500 shares of common stock at a purchase price of $2.60 per share granted on February 15, 2011, with 9,375 of the shares vesting on February 15, 2012, and then an additional 9,375 shares on each of the subsequent three anniversaries, subject to acceleration of vesting upon a change in control. |
| (6) | Mr. Loumidis resigned as Vice President and Treasurer of the Company effective December 31, 2012. |
| 60 |
Outstanding Equity Awards at Fiscal Year-End
The following table sets forth information with respect to outstanding equity awards held by our executive officers as of December 31, 2012:
| Option awards | Stock awards | |||||||||||||||||||||||
| Name | Number of securities underlying unexercised options (#) exercisable | Number of securities underlying unexercised options (#) unexercisable | Option exercise price ($) | Option expiration date | Number of shares of stock that have not vested (#) | Market value of shares of stock that have not vested ($)(1) | ||||||||||||||||||
| John N. Hatsopoulos | — | — | — | — | — | — | ||||||||||||||||||
| Robert A. Panora (2)(3) | — | 125,000 | 2.60 | 2/14/2021 | 138,350 | 110,680 | ||||||||||||||||||
| Bonnie J. Brown (4)(5) | 25,000 | — | 1.20 | 2/13/2018 | 12,500 | 10,000 | ||||||||||||||||||
| Bonnie J. Brown (6) | 37,500 | 12,500 | 2.00 | 3/11/2019 | — | — | ||||||||||||||||||
| Bonnie J. Brown (7) | 12,500 | 12,500 | 2.60 | 2/18/2020 | — | — | ||||||||||||||||||
| Anthony S. Loumidis (8)(9) | 5,000 | — | 1.20 | 2/24/2014 | 7,500 | 6,000 | ||||||||||||||||||
| Anthony S. Loumidis (10) | 25,000 | — | 1.20 | 9/29/2015 | — | — | ||||||||||||||||||
| Anthony S. Loumidis (11) | 18,750 | — | 1.20 | 2/13/2015 | — | — | ||||||||||||||||||
| Anthony S. Loumidis (12) | 9,375 | 28,125 | 2.60 | 2/14/2021 | — | — | ||||||||||||||||||
| (1) | Market value of shares of stock that have not vested is computed on the last private placement price of the Company’s common stock on November 30, 2011, which was $3.20 per share. |
| (2) | Includes stock option award granted on February 15, 2011, with 25% of the shares vesting on February 15, 2012, and then an additional 25% of the shares vesting on each of the subsequent three anniversaries, subject to Mr. Panora’s continued employment and subject to acceleration of vesting upon a change in control. |
| (3) | Includes 138,350 shares of restricted common stock at a purchase price of $.004 per share granted on December 4, 2006, with 100% of the shares vesting one year after the Company’s initial public offering, subject to acceleration of vesting upon a change in control prior to a termination event. |
| (4) | Includes stock option award granted on February 13, 2008, with 25% of the shares vesting on February 13, 2009, and then an additional 25% of the shares vesting on each of the subsequent three anniversaries, subject to Ms. Brown’s continued employment and subject to acceleration of vesting upon a change in control. |
| (5) | Includes 12,500 shares of restricted common stock at a purchase price of $.004 per share granted on December 13, 2006, with 100% of the shares vesting one year after the Company’s initial public offering, subject to acceleration of vesting upon a change in control prior to a termination event. |
| (6) | Includes stock option award granted on March 11, 2009, with 25% of the shares vesting on March 11, 2010, and then an additional 25% of the shares vesting on each of the subsequent three anniversaries, subject to Ms. Brown’s continued employment and subject to acceleration of vesting upon a change in control. |
| (7) | Includes stock option award granted on February 28, 2010, with 25% of the shares vesting on February 28, 2011, and then an additional 25% of the shares vesting on each of the subsequent three anniversaries, subject to Ms. Brown’s continued employment and subject to acceleration of vesting upon a change in control. |
| (8) | Includes stock option award granted on February 24, 2004, with 25% of the shares vesting on February 24, 2005, and then an additional 25% of the shares vesting on each of the subsequent three anniversaries, subject to the continued employment of Mr. Loumidis and subject to acceleration of vesting upon a change in control. |
| (9) | Includes 7,500 shares of restricted common stock at a purchase price of $.004 per share granted on December 13, 2006, with 100% of the shares vesting one year after the Company’s initial public offering, subject to acceleration of vesting upon a change in control prior to a termination event. |
| (10) | Includes stock option award granted on September 29, 2005, with 25% of the shares vesting on September 29, 2006, and then an additional 25% of the shares vesting on each of the subsequent three anniversaries, subject to the continued employment of Mr. Loumidis and subject to acceleration of vesting upon a change in control. |
| (11) | Includes stock option award granted on February 13, 2008, with 25% of the shares vesting on February 13, 2009, and then an additional 25% of the shares vesting on each of the subsequent three anniversaries, subject to the continued employment of Mr. Loumidis and subject to acceleration of vesting upon a change in control. |
| (12) | Includes stock option award granted on February 15, 2011, with 25% of the shares vesting on February 15, 2012, and then an additional 25% of the shares vesting on each of the subsequent three anniversaries, subject to the continued employment of Mr. Loumidis and subject to acceleration of vesting upon a change in control. |
| 61 |
Director Compensation
Each director who is not also one of our employees will receive a fee of $500 per day for service on those days that our Board of Directors and/or each of the Audit, Compensation, or Nominating and Governance Committees hold meetings, or otherwise conduct business. Non-employee directors also will be eligible to receive stock or options awards under our equity incentive plan. We reimburse all of our non-employee directors for reasonable travel and other expenses incurred in attending Board and committee meetings. Any director who is also one of our employees receives no additional compensation for serving as a director.
The following table sets forth information with respect to the compensation of our directors as of December 31, 2012:
| Name | Fees earned or paid in cash ($) | Stock awards ($) | Option awards ($) | All other compensation ($) | Total ($) | |||||||||||||||
| Angelina M. Galiteva | 1,000 | — | — | — | 1,000 | |||||||||||||||
| John N. Hatsopoulos | — | — | — | — | — | |||||||||||||||
| George N. Hatsopoulos | — | — | — | — | — | |||||||||||||||
| Ahmed F. Ghoniem | 1,000 | — | — | — | 1,000 | |||||||||||||||
| Charles T. Maxwell | 1,000 | — | — | — | 1,000 | |||||||||||||||
| Joseph E. Aoun | 1,000 | — | — | — | 1,000 | |||||||||||||||
Outstanding Equity Awards at Fiscal Year-End Table
The following table summarizes the outstanding equity awards held by each director as of December 31, 2012:
| Option awards | Stock awards | |||||||||||||||||||||||
| Name | Number of securities underlying unexercised options (#) exercisable | Number of securities underlying unexercised options (#) unexercisable | Option exercise price ($) | Option expiration date | Number of shares of stock that have not vested (#) | Market value of shares of stock that have not vested ($) (1) | ||||||||||||||||||
| Angelina M. Galiteva (2)(3) | 25,000 | — | 0.12 | 10/20/2013 | 25,000 | 80,000 | ||||||||||||||||||
| Angelina M. Galiteva (4) | 6,250 | 18,750 | 2.60 | 2/14/2021 | — | — | ||||||||||||||||||
| John N. Hatsopoulos | — | — | — | — | — | — | ||||||||||||||||||
| George N. Hatsopoulos | — | — | — | — | — | — | ||||||||||||||||||
| Ahmed F. Ghoniem (5)(6) | 6,250 | 18,750 | 2.60 | 2/14/2021 | 25,000 | 80,000 | ||||||||||||||||||
| Charles T. Maxwell (7)(8) | 6,250 | 18,750 | 2.60 | 2/14/2021 | 25,000 | 80,000 | ||||||||||||||||||
| Joseph E. Aoun | — | — | — | — | — | — | ||||||||||||||||||
| (1) | Market value of shares of common stock that have not vested is computed by the Company’s most recent private placement of common stock on November 30, 2011, which was $3.20 per share. |
| (2) | Includes stock option award granted on October 20, 2003, with 100% of the shares vesting on the date of the option grant. |
| (3) | Includes 25,000 shares of restricted common stock at a purchase price of $.004 per share granted on December 13, 2006, with 100% of the shares vesting one year after the Company’s initial public offering. |
| (4) | Includes stock option award granted on February 15, 2011, with 25% of the shares vesting on February 15, 2012, and then an additional 25% of the shares vesting on each of the subsequent three anniversaries, provided that Ms. Galiteva serves as a director or consultant to the Company. |
| (5) | Includes stock option award granted on February 15, 2011, with 25% of the shares vesting on February 15, 2012, and then an additional 25% of the shares vesting on each of the subsequent three anniversaries, provided that Mr. Ghoniem serves as a director or consultant to the Company. |
| (6) | Includes 25,000 shares of restricted common stock at a purchase price of $.004 per share granted on October 1, 2008, with 100% of the shares vesting 180 days after the Company’s initial public offering. |
| (7) | Includes stock option award granted on February 15, 2011, with 25% of the shares vesting on February 15, 2012, and then an additional 25% of the shares vesting on each of the subsequent three anniversaries, provided that Mr. Maxwell serves as a director or consultant to the Company. |
| (8) | Includes 25,000 shares of restricted common stock at a purchase price of $.004 per share granted on October 1, 2008, with 100% of the shares vesting 180 days after the Company’s initial public offering. |
There have been no other stock awards granted to date and none of such options have been exercised.
| 62 |
2006 Stock Incentive Plan
The Company’s 2006 Stock Incentive Plan, or Stock Plan, provides for the grant of stock-based awards to employees, officers and directors of, and consultants or advisors to, the Company and its subsidiaries. The Stock Plan is included as Exhibit 10.4 hereto.
Under the Stock Plan, the Company may grant stock options, restricted stock and other stock-based awards. As of March 31, 2013, a total of 1,096,500 shares of common stock may be issued upon the exercise of options or other awards granted under the Stock Plan.
The Stock Plan is administered by the Board of Directors and the Compensation Committee. Subject to the provisions of the Stock Plan, the Board of Directors and the Compensation Committee each has the authority to select the persons to whom awards are granted and determine the terms of each award, including the number of shares of common stock subject to the award. Payment of the exercise price of an award may be made in cash, in a “cashless exercise” through a broker, or if the applicable stock option agreement permits, shares of common stock or by any other method approved by the Board of Directors or Compensation Committee. Unless otherwise permitted by the Company, awards are not assignable or transferable except by will or the laws of descent and distribution.
Upon the consummation of an acquisition of the business of the Company, by merger or otherwise, the Board of Directors shall, as to outstanding awards (on the same basis or on different bases as the Board of Directors shall specify), make appropriate provision for the continuation of such awards by the Company or the assumption of such awards by the surviving or acquiring entity and by substituting on an equitable basis for the shares then subject to such awards either (a) the consideration payable with respect to the outstanding shares of common stock in connection with the acquisition; (b) shares of stock of the surviving or acquiring corporation; or (c) such other securities or other consideration as the Board of Directors deems appropriate, the fair market value of which (as determined by the Board of Directors in its sole discretion) shall not materially differ from the fair market value of the shares of common stock subject to such awards immediately preceding the acquisition. In addition to or in lieu of the foregoing, with respect to outstanding stock options, the Board of Directors may, on the same basis or on different bases as the Board of Directors shall specify, upon written notice to the affected optionees, provide that one or more options then outstanding must be exercised, in whole or in part, within a specified number of days of the date of such notice, at the end of which period such options shall terminate, or provide that one or more options then outstanding, in whole or in part, shall be terminated in exchange for a cash payment equal to the excess of the fair market value (as determined by the Board of Directors in its sole discretion) for the shares subject to such options over the exercise price thereof. Unless otherwise determined by the Board of Directors (on the same basis or on different bases as the Board of Directors shall specify), any repurchase rights or other rights of the Company that relate to a stock option or other award shall continue to apply to consideration, including cash, that has been substituted, assumed, or amended for a stock option or other award pursuant to these provisions. The Company may hold in escrow all or any portion of any such consideration in order to effectuate any continuing restrictions.
The Board of Directors may at any time provide that any stock options shall become immediately exercisable in full or in part; that any restricted stock awards shall be free of some or all restrictions; or that any other stock-based awards may become exercisable in full or in part or free of some or all restrictions or conditions, or otherwise realizable in full or in part, as the case may be.
| 63 |
The Board of Directors or Compensation Committee may, in its sole discretion, amend, modify, or terminate any award granted or made under the Stock Plan, so long as such amendment, modification, or termination would not materially and adversely affect the participant.
Securities Authorized for Issuance Under Equity Compensation Plans
The following table provides information as of March 31, 2013, regarding common stock that may be issued under the Company’s equity compensation plans.
| Plan category | Number of securities to be issued upon exercise of outstanding options, warrants and rights | Weighted-average exercise price of outstanding options, warrants and rights | Number of securities remaining available for future issuance under equity compensation plans (excluding securities reflected in second column) | |||||||||
| Equity compensation plans approved by security holders | 1,096,500 | $ | 1.96 | 135,183 | ||||||||
| Equity compensation plans not approved by security holders | — | — | — | |||||||||
| Total | 1,096,500 | $ | 1.96 | 135,183 | ||||||||
In February 2011, our management conducted an assessment of the risks associated with our compensation policies and practices. This process included a review of our compensation programs, a discussion of the types of practices that could be reasonably likely to create material risks, and an analysis of the potential effects on the Company on related risks as a whole.
Although we reviewed all of our compensation programs, we paid particular attention to programs involving incentive-based payouts and programs that involve our executive officers. During the course of our assessment, we consulted with the Compensation Committee of our Board of Directors.
We believe that our compensation programs are designed to create appropriate incentives without encouraging excessive risk taking by our employees. In this regard, our compensation structure contains various features intended to mitigate risk. For example:
| • | None of our executive officers receives any performance-based compensation or incentive payments. |
| • | A portion of the compensation package for our sales-based employees consists of commissions for shares sold and installed, which package is designed to link an appropriate portion of compensation to long-term performance, while providing a balanced compensation model overall. |
| • | The Compensation Committee oversees our compensation policies and practices and is responsible for reviewing and approving executive compensation, annual incentive compensation plans applicable to sales employees and other compensation plans. |
Our Compensation Committee, in its evaluation, determined that it does not believe that the Company employs any compensation plans or practices that create incentives for employees to deliver short-term profits at the expense of generating systematic risks for the Company. Based on this and the assessment described above, we have concluded that the risks associated with our compensation policies and practices are not reasonably likely to have material adverse effect on the Company.
Compensation Committee Interlocks and Insider Participation
None of our executive officers serve as a member of the board of directors or compensation committee, or other committee serving an equivalent function, of any other entity that has one or more of its executive officers serving as a member of our Board of Directors or Compensation Committee. None of the current members of the Compensation Committee of our Board of Directors has ever been one of our employees.
Employment Contracts and Termination of Employment and Change-in-Control Arrangements
None of our executive officers has an employment contract or change-in-control arrangement, other than stock and option awards that contain certain change-in-control provisions such as accelerated vesting due to acquisition. In the event an acquisition that is not a private transaction occurs while the optionee maintains a business relationship with the Company and the option has not fully vested, the option will become exercisable for 100% of the then number of shares as to which it has not vested and such vesting to occur immediately prior to the closing of the acquisition.
| 64 |
The stock and option awards that would vest for each named executive if a change-in-control were to occur are disclosed under our Outstanding Equity Awards at Fiscal Year-End Table. Specifically, as of December 31, 2012, Robert A. Panora, our Chief Operating Officer and President, had 125,000 stock options and 138,350 shares of restricted stock that had not vested; Bonnie J. Brown, our Chief Financial Officer, had 25,000 stock options and 12,500 shares of restricted stock that had not vested; and Anthony S. Loumidis, our former Vice President and Treasurer, had 28,125 stock options and 7,500 shares of restricted stock that had not vested.
Our stock and option awards contain certain change-in-control provisions. Descriptions of those provisions are set forth below:
Stock Awards Change-in-Control Definition
Change-in-Control shall mean (a) the acquisition in a transaction or series of transactions by any person (such term to include anyone deemed a person under Section 13(d)(3) of the Exchange Act), other than the Company or any of its subsidiaries, or any employee benefit plan or related trust of the Company or any of its subsidiaries, of beneficial ownership (within the meaning of Rule 13d-3 promulgated under the Exchange Act) of 50% or more of the combined voting power of the then outstanding voting securities of the Company entitled to vote generally in the election of directors; provided a Change-in-Control shall not occur solely as the result of an initial public offering or (b) the sale or other disposition of all or substantially all of the assets of the Company in one transaction or series of related transactions.
Option Awards Change-in-Control Definition
In the event an acquisition that is not a private transaction occurs while the optionee maintains a business relationship with the Company and this option has not fully vested, this option shall become exercisable for 100% of the then number of shares as to which it has not vested, such vesting to occur immediately prior to the closing of the acquisition.
Definitions. The following definitions shall apply to certain terms used in this section:
Acquisition means (i) the sale of the Company by merger in which the stockholders of the Company in their capacity as such no longer own a majority of the outstanding equity securities of the Company (or its successor); (ii) any sale of all or substantially all of the assets or capital stock of the Company (other than in a spin-off or similar transaction); or (iii) any other acquisition of the business of the Company, as determined by the Board. Business relationship means service to the Company or its successor in the capacity of an employee, officer, director or consultant.
Private transaction means any acquisition where the consideration received or retained by the holders of the then outstanding capital stock of the Company does not consist of (i) cash or cash equivalent consideration; (ii) securities which are registered under the Securities Act, or any successor statute; or (iii) securities for which the Company or any other issuer thereof has agreed, including pursuant to a demand, to file a registration statement within 90 days of completion of the transaction for resale to the public pursuant to the Securities Act.
Director Independence
Under Rule 5605(b)(1) of the Nasdaq Marketplace Rules, independent directors must comprise a majority of a listed company’s board of directors within one year of listing. In addition, Nasdaq Marketplace Rules require that, subject to specified exceptions, each member of a listed company’s audit, compensation, and nominating and governance committees be independent. Audit committee members must also satisfy the independence criteria set forth in Rule 10A-3 under the Exchange Act. Under Nasdaq Marketplace Rule 5605(a)(2), a director will only qualify as an “independent director” if, in the opinion of that company’s board of directors, that person does not have a relationship that would interfere with the exercise of independent judgment in carrying out the responsibilities of a director. In order to be considered to be independent for purposes of Rule 10A-3, a member of an audit committee of a listed company may not, other than in his or her capacity as a member of the audit committee, the board of directors, or any other board committee: (1) accept, directly or indirectly, any consulting, advisory, or other compensatory fee from the listed company or any of its subsidiaries; or (2) be an affiliated person of the listed company or any of its subsidiaries.
Our Board of Directors intends to review its composition, the composition of its committees and the independence of each director according to the independence standards established by applicable SEC rules and the Nasdaq Marketplace Rules. As part of its review, our Board of Directors will consider the relationships that each non-employee director has with our company and all other facts and circumstances our Board of Directors deems relevant in determining their independence, including the beneficial ownership of our capital stock by each non-employee director.
| 65 |
CERTAIN RELATIONSHIPS AND RELATED TRANSACTIONS
The Company has five affiliated companies: (a) American DG Energy, a publicly traded company that distributes, owns and operates on-site energy systems that produce electricity, hot water, heat, and cooling in the United States; (b) EuroSite Power, a publicly traded company that distributes, owns, and operates on-site energy systems that produce electricity, hot water, heat, and cooling in the United Kingdom and Europe; (c) GlenRose Instruments, a company that provides radiological services, operates a radiochemistry laboratory network, and provides radiological characterization and analysis, hazardous, radioactive, and mixed waste management, facility, environmental, safety, and industrial hygiene health management; (d) Pharos, a private company that offers investment services in the healthcare sector; and (e) Levitronix Technologies LLC, or Levitronix, a worldwide leader in magnetically levitated bearingless motor technology, specializing in supplying medical blood pumps to the medical community and ultra-pure fluid handling devices for microelectronics, life science, and industrial applications.
These companies are affiliates because several of the major stockholders of those companies have a significant ownership position in the Company. American DG Energy, EuroSite Power, GlenRose Instruments, Pharos, and Levitronix do not own any shares of the Company, and the Company does not own any shares of American DG Energy, EuroSite Power, GlenRose Instruments, Pharos, or Levitronix. The businesses of GlenRose Instruments, Pharos, and Levitronix are not related to the business of the Company.
American DG Energy, EuroSite Power, GlenRose Instruments, Pharos, and Levitronix are affiliated companies by virtue of common ownership. The common stockholders include:
| • | John N. Hatsopoulos, the Company’s Chief Executive Officer, who is also: (a) the Chief Executive Officer and a director of American DG Energy and holds 10.8% of that company’s common stock; (b) the Chairman of EuroSite Power; (c) a director of Ilios and holds 7% of that company’s common stock; and (d) the Chairman of GlenRose Instruments and holds 15.7% of that company’s common stock. |
| • | Dr. George N. Hatsopoulos, who is John N. Hatsopoulos’ brother, is also: (a) a director of American DG Energy and holds 14.3% of that company’s common stock; (b) an investor in Ilios and holds 3.1% of that company’s common stock; (c) an investor in GlenRose Instruments and holds 15.7% of that company’s common stock; (d) an investor in Pharos and holds 24.4% of that company’s common stock; and (e) an investor in Levitronix and holds 21.4% of that company’s common stock. |
Additionally, the following related persons had or may have a direct or indirect material interest in our transactions with our affiliated companies:
| • | Barry J. Sanders, who is: (a) the President and Chief Operating Officer of American DG Energy; (b) the Chief Executive Officer and a director of EuroSite Power; and (c) the Chairman of Ilios. |
| • | Anthony S. Loumidis, the Company’s former Vice President and Treasurer, who is: (a) the Chief Financial Officer, Secretary, and Treasurer of American DG Energy; (b) the Chief Financial Officer, Secretary, and Treasurer of EuroSite Power; (c) the Chief Financial Officer, Secretary, and Treasurer of GlenRose Instruments; and (d) the Treasurer of Ilios. |
American DG Energy has sales representation rights to the Company’s products and services in New England. Revenue from sales of cogeneration and chiller systems, parts and service to American DG Energy during the years ended December 31, 2012 and 2011, amounted to $3,795,666 and $713,267, respectively.
On October 20, 2009, American DG Energy, in the ordinary course of its business, signed a Sales Representative Agreement with Ilios to promote, sell, and service the Ilios high-efficiency heating products, such as the high efficiency water heater, in the marketing territory of the New England states, including Connecticut, Rhode Island, Massachusetts, New Hampshire, Vermont, and Maine. The marketing territory also includes all of the nations in the European Union. The initial term of this Agreement is for five years, after which it may be renewed for successive one-year terms upon mutual written agreement. American DG Energy has not yet sold any products under this agreement and, therefore, no amounts have been required to be paid.
On September 24, 2001, the Company entered into subscription agreements with investors for the sale of convertible debentures. The primary investors were George N. Hatsopoulos, who subscribed for debentures having an initial principal amount of $200,000; the John N. Hatsopoulos 1989 Family Trust for the benefit of Nia Marie Hatsopoulos, or the Nia Hatsopoulos Trust, which subscribed for debentures having an initial principal amount of $50,000; and the John N. Hatsopoulos 1989 Family Trust for the benefit of Alexander John Hatsopoulos, or the Alexander Hatsopoulos Trust, which subscribed for debentures having an initial principal amount of $50,000. Nia Hatsopoulos and Alexander Hatsopoulos are John N. Hatsopoulos’s adult children. John N. Hatsopoulos disclaims beneficial ownership of the shares held by these trusts. The debentures accrue interest at a rate of 6% per annum and were due on September 24, 2007. The debentures are convertible, at the option of the holder, into shares of common stock at a conversion price of $1.20 per share.
| 66 |
On September 24, 2007, George N. Hatsopoulos, the Nia Hatsopoulos Trust and the Alexander Hatsopoulos Trust, holding debentures representing a majority of the then-outstanding principal amount of the debentures, agreed to extend the debenture term to September 24, 2011.
On May 11, 2009, George N. Hatsopoulos, the Nia Hatsopoulos Trust and the Alexander Hatsopoulos Trust converted a portion of the principal amount under the debentures held by each of them into shares of common stock of Ilios, the Company’s then newly-formed subsidiary, at a conversion price of $0.50 per share. Specifically, George N. Hatsopoulos converted principal in the amount of $109,033, together with accrued interest in the amount of $90,967, into 400,000 shares of Ilios common stock; the Nia Hatsopoulos Trust converted principal in the amount of $213,716, together with interest in the amount of $36,284, into 500,000 shares of Ilios common stock; and Nia Hatsopoulos Trust converted principal in the amount of $213,716, together with interest in the amount of $36,284, into 500,000 shares of Ilios common stock. The difference between the Company’s purchase price of the Ilios shares and the amount of debt forgiveness was recorded as additional paid-in capital.
On September 30, 2009, Joseph J. Ritchie elected to convert the outstanding principal amount under the debenture held by him, $30,000, together with accrued interest of $14,433, into 37,028 shares of the Company’s common stock at a conversion price of $1.20 per share.
On September 24, 2011, George N. Hatsopoulos, the Nia Hatsopoulos Trust and the Alexander Hatsopoulos Trust, holding debentures representing a majority of the then-outstanding principal amount of the debentures, agreed to extend the term of the debentures to September 24, 2013 and requested that accrued interest in the aggregate amount of approximately $72,960 be converted into the Company’s common stock at $2.00 per share (which was the average price of the Company’s stock between September 24, 2001 and September 24, 2011). As a result, the Company issued 6,474 shares of common stock to George N. Hatsopoulos, 15,003 shares of common stock to the Nia Hatsopoulos Trust and 15,003, shares of common stock to the Alexander Hatsopoulos Trust.
On September 30, 2012, the remaining principal amount under the debentures held by the Nia Hatsopoulos Trust and the Alexander Hatsopoulos Trust, including the applicable accrued interest, was converted into 42,620 shares of common stock issued to each of the Nia Hatsopoulos Trust and the Alexander Hatsopoulos Trust.
On September 10, 2008, the Company entered into a demand note agreement with John N. Hatsopoulos in the principal amount of $250,000 at an annual interest rate of 5%. On September 7, 2011, the Company entered into an additional demand note agreement with John N. Hatsopoulos, in the principal amount of $750,000 at an annual interest rate of 6%. On November 30, 2012, the Company entered into an additional demand note agreement with John N. Hatsopoulos in the principal amount of $300,000 at an annual interest rate of 6%. Unpaid principal and interest on the demand notes are due upon demand.
Additional disclosure on the Company’s debt is set forth in Note 7 – Demand notes payable and convertible debentures – related party to our financial statements included in this prospectus.
John N. Hatsopoulos’ salary is $1.00 per year. On average, Mr. Hatsopoulos spends approximately 50% of his business time on the affairs of the Company; however, such amount varies widely depending on the needs of the business and is expected to increase as the business of the Company develops.
On January 1, 2006, the Company signed a Facilities and Support Services Agreement with American DG Energy for a period of one year, renewable annually on January 1st, by mutual agreement. That agreement was amended on July 1, 2012. Under this agreement, the Company provides American DG Energy with certain office and business support services and also provides pricing based on a volume discount depending on the level of American DG Energy purchases of cogeneration and chiller products. For certain sites, American DG Energy hires the Company to service its chiller and cogeneration products. The Company also provides office space and certain utilities to American DG Energy based on a monthly rate set at the beginning of each year. The monthly rate from January 1, 2013 to December 31, 2013 is $6,733. Also, under this agreement, American DG Energy has sales representation rights to the Company’s products and services in New England.
| 67 |
Revenue from sales of cogeneration and chiller systems, parts, and service to American DG Energy during the years ended December 31, 2012 and 2011 amounted to $3,795,666 and $713,267, respectively. In addition, Tecogen pays certain operating expenses, including benefits and insurance, on behalf of American DG Energy. Tecogen was reimbursed for these costs. As of December 31, 2012 and 2011, the total amount due from American DG Energy was $70,811 and $299,739, respectively. In March 2013, American DG Energy made a prepayment for purchases of modules, parts, and service from a related party in the amount of $827,747. As provided in the Facilities and Support Services Agreement, Tecogen will provide a discount on these prepaid purchases equal to 6% per annum on deposit balances.
On March 25, 2013, the Company entered into a Revolving Line of Credit Agreement, or the Credit Agreement, with John N. Hatsopoulos, our Chief Executive Officer. Under the terms of the Credit Agreement, Mr. Hatsopoulos has agreed to lend the Company up to an aggregate of $1 million, from time to time, at the written request of the Company. Any amounts borrowed by the Company pursuant to the Credit Agreement will bear interest at the Bank Prime Rate as quoted from time to time in the Wall Street Journal plus 1.5% per year. Interest is due and payable quarterly in arrears. Repayment of the principal amount borrowed pursuant to the Credit Agreement will be due on March 31, 2014, or the Maturity Date. Prepayment of any amounts due under the Credit Agreement may be made at any time without penalty. The Credit Agreement terminates on the Maturity Date. The Company has not yet borrowed any amounts pursuant to the Credit Agreement.
The Company subleases portions of its corporate offices and manufacturing facility to sub-tenants under annual sublease agreements. For the years ended December 31, 2012 and 2011, the Company received $158,898 and $185,596, respectively, from American DG Energy, Levitronix, and Alexandros Partners LLC, or Alexandros Partners. In addition, for the years ended December 31, 2012 and 2011, the Company received from the same companies $101,218 and $224,700, respectively, to offset common operating expenses incurred in the administration and maintenance of its corporate office and warehouse facility.
Alexandros Partners LLC is a financial advisory firm providing consulting services to early stage entrepreneurial ventures. John N. Hatsopoulos, the Company’s Chief Executive Officer, was a Managing Partner of Alexandros Partners from September 2000 until his resignation on December 31, 2011. Also, Anthony S. Loumidis, the Company’s former Vice President and Treasurer, was the President of Alexandros Partners from September 2000 until his resignation on December 31, 2011. As of December 31, 2011, John N. Hatsopoulos and Anthony S. Loumidis do not hold any position nor are they owners of Alexandros Partners.
The Company’s headquarters is located in Waltham, Massachusetts, and consists of 27,000 square feet of office and storage space that are shared with American DG Energy and other tenants. The lease expires on March 31, 2024. We believe that our facilities are appropriate and adequate for our current needs.
For additional disclosure related to our related parties and related party transactions see Note 13 - Related party transactions to our financial statements included in this prospectus.
Policies and Procedures for Related Person Transactions
Our Board of Directors will adopt a written related person transaction policy to set forth the policies and procedures for the review and approval or ratification of related person transactions. This policy will cover any transaction, arrangement, or relationship, or any series of similar transactions, arrangements, or relationships, in which we were or are to be a participant where the amount involved exceeds $120,000, and a related person had or will have a direct or indirect material interest, including, without limitation, purchases of goods or services by or from the related person or entities in which the related person has a material interest, indebtedness, guarantees of indebtedness, and employment by us of a related person.
Any related person transaction proposed to be entered into by us will be required to be reported to our Chief Financial Officer and will be reviewed and approved by the Audit Committee in accordance with the terms of the policy, prior to effectiveness or consummation of the transaction, whenever practicable. If our Chief Financial Officer determines that advance approval of a related person transaction is not practicable under the circumstances, the Audit Committee will review and, in its discretion, may ratify the related person transaction at the next meeting of the Audit Committee, or at the next meeting following the date that the related person transaction comes to the attention of our Chief Financial Officer. Our Chief Financial Officer, however, may present a related person transaction arising in the time period between meetings of the Audit Committee to the chair of the Audit Committee, who will review and may approve the related person transaction, subject to ratification by the Audit Committee at the next meeting of the Audit Committee.
In addition, any related person transaction previously approved by the Audit Committee or otherwise already existing that is ongoing in nature will be reviewed by the Audit Committee annually to ensure that such related person transaction has been conducted in accordance with the previous approval granted by the Audit Committee, if any, and that all required disclosures regarding the related person transaction are made.
| 68 |
Transactions involving compensation of executive officers will be reviewed and approved by the Compensation Committee in the manner specified in the charter of the Compensation Committee.
A related person transaction reviewed under this policy will be considered approved or ratified if it is authorized by the Audit Committee in accordance with the standards set forth in our related person transaction policy after full disclosure of the related person’s interests in the transaction. As appropriate for the circumstances, the Audit Committee will review and consider:
| • | the related person’s interest in the related person transaction; |
| • | the approximate dollar value of the amount involved in the related person transaction; |
| • | the approximate dollar value of the amount of the related person’s interest in the transaction without regard to the amount of any profit or loss; |
| • | whether the transaction was undertaken in the ordinary course of business; |
| • | whether the transaction with the related person is proposed to be, or was, entered into on terms no less favorable to us than terms that could have been reached with an unrelated third party; |
| • | the purpose of, and the potential benefits to us of, the transaction; and |
| • | any other information regarding the related person transaction or the related person in the context of the proposed transaction that would be material to stockholders in light of the circumstances of the particular transaction. |
The Audit Committee will review all relevant information available to it about the related person transaction. The Audit Committee may approve or ratify the related person transaction only if the Audit Committee determines that, under all of the circumstances, the transaction is in, or is not inconsistent with, our best interests. The Audit Committee may, in its sole discretion, impose conditions as it deems appropriate on us or the related person in connection with approval of the related person transaction.
| 69 |
SECURITY OWNERSHIP OF CERTAIN BENEFICIAL OWNERS AND MANAGEMENT
The following table sets forth, as of May 29, 2013, certain information with respect to the beneficial ownership of the Company’s common stock by (1) any person, including any “group” as set forth in Section 13(d)(3) of the Exchange Act, known by us to be the beneficial owner of more than 5% of our common stock; (2) each director; (3) each of our executive officers; and (4) all of our current directors and executive officers as a group. The percentages in the following table are based on 13,611,974 shares of common stock issued and outstanding as of May 29, 2013.
| Amount and Nature of | Percent of Class |
||||||||||
| Name and address of beneficial owner (1) | Beneficial Ownership | Before Offering | After Offering |
||||||||
| 5% Stockholders: | |||||||||||
| John N. Hatsopoulos (2) | 3,718,839 | 27.3 | % | ||||||||
| George N. Hatsopoulos (3) | 3,551,520 | 25.9 | % | ||||||||
| RBC cees Nominees Limited (4) | 904,105 | 6.6 | % | ||||||||
| Joseph J. Ritchie (5) | 896,613 | 6.6 | % | ||||||||
| Directors and Officers: | |||||||||||
| John N. Hatsopoulos (2) | 3,718,839 | 27.3 | % | ||||||||
| George N. Hatsopoulos (3) | 3,551,520 | 25.9 | % | ||||||||
| Robert A. Panora (6) | 225,850 | 1.7 | % | ||||||||
| Bonnie J. Brown (7) | 106,250 | 0.8 | % | ||||||||
| Charles T. Maxwell (8) | 87,500 | 0.6 | % | ||||||||
| Angelina M. Galiteva (9) | 62,500 | 0.5 | % | ||||||||
| Ahmed F. Ghoniem (10) | 37,500 | 0.3 | % | ||||||||
| Joseph E. Aoun | — | — | % | ||||||||
| All executive officers and directors as a group (8 persons) | 7,789,959 | 57.1 | % | ||||||||
| (1) | The address of the directors and officers listed in the table above is: c/o Tecogen Inc., 45 First Avenue, Waltham, Massachusetts 02451. |
| (2) | Includes: (a) 2,135,210 shares of common stock held by J&P Enterprises LLC for the benefit of: (1) John N. Hatsopoulos and (2) Patricia L. Hatsopoulos. John N. Hatsopoulos is the Executive Member of J&P Enterprises LLC and has voting and investment power; (b) 593,770 shares of common stock held by John N. Hatsopoulos and his wife, Patricia L. Hatsopoulos, as joint tenants with rights of survivorship, each of whom share voting and investment power; and (c) 989,859 shares of common stock held by The John N. Hatsopoulos Family Trust 2007 for the benefit of: (1) Patricia L. Hatsopoulos, (2) Alexander J. Hatsopoulos, and (3) Nia Marie Hatsopoulos, for which Dr. George N. Hatsopoulos and Ms. Patricia L. Hatsopoulos are the trustees. |
| (3) | Includes: (a) 1,492,126 shares of common stock, directly held by Dr. George N. Hatsopoulos; (b) 1,983,588 shares of common stock held by Dr. Hatsopoulos and his wife, Daphne Hatsopoulos, as joint tenants, each of whom share voting and investment power; and (c) 75,806 shares of common stock issuable upon conversion of $90,967 principal amount of 6% convertible debentures. This amount does not include (a) 234,049 shares of common stock held by the 1994 Hatsopoulos Family Trust for the benefit of Nicolas Hatsopoulos, for which Ms. Daphne Hatsopoulos and Mr. Gordon Erhlich are the trustees, and (b) 334,049 shares of common stock held by the 1994 Hatsopoulos Family Trust for the benefit of Marina Hatsopoulos Bornhorst, for which Ms. Daphne Hatsopoulos and Mr. Gordon Erhlich are the trustees. These trusts are for the benefit of Dr. Hatsopoulos’s adult children. Dr. Hatsopoulos disclaims beneficial ownership of the shares held by these trusts. |
| (4) | Includes 904,105 shares of common stock purchased in August 2010 and November 2011 held by RBC cees Nominees Ltd. The address of RBC cees Nominees Ltd. is 19-21 Broad Street, St. Hellier, Jersey JE1 3PB, Channel Islands. |
| (5) | Includes 896,613 shares of common stock, directly held by Mr. Ritchie. The address of Mr. Ritchie is 2100 Enterprise Avenue, Geneva, IL 60134. |
| (6) | Includes: (a) 163,350 shares of common stock, directly held by Mr. Panora, and (b) options to purchase 62,500 shares of common stock exercisable within 60 days of the date of this prospectus. |
| (7) | Includes: (a) 12,500 shares of common stock, directly held by Ms. Brown, and (b) options to purchase 93,750 shares of common stock exercisable within 60 days of the date of this prospectus. |
| (8) | Includes: (a) 75,000 shares of common stock, directly held by Mr. Maxwell, and (b) options to purchase 12,500 shares of common stock exercisable within 60 days of the date of this prospectus. |
| (9) | Includes: (a) 25,000 shares of common stock, directly held by Ms. Galiteva, and (b) options to purchase 37,500 shares of common stock exercisable within 60 days of the date of this prospectus. |
| (10) | Includes: (a) 25,000 shares of common stock, directly held by Mr. Ghoniem, and (b) options to purchase 12,500 shares of common stock exercisable within 60 days of the date of this prospectus. |
| 70 |
DESCRIPTION OF OUR CAPITAL STOCK
General
The following description of our capital stock and provisions of our amended and restated certificate of incorporation and bylaws are summaries and are qualified by reference to the charter and the bylaws, which are filed as exhibits hereto.
Our authorized capital stock consists of 100,000,000 shares of common stock, par value $0.001 per share.
The following description summarizes information about our capital stock. You can obtain more comprehensive information about our capital stock by reviewing our certificate of incorporation and bylaws, as well as the Delaware General Corporation Law.
Common Stock
General. As of March 31, 2013, there were 13,611,974 shares of our common stock outstanding, held of record by 110 stockholders.
Voting Rights. Each holder of common stock is entitled to one vote per share on all matters properly submitted to a vote of the stockholders, including the election of directors. Our charter will not provide for cumulative voting rights. Because of this, but subject to the rights of any then outstanding shares of preferred stock, the holders of a majority of the shares of common stock entitled to vote in any election of directors can elect all of the directors standing for election, if they should so choose. An election of directors by our stockholders is determined by a plurality of the votes cast by stockholders entitled to vote on the election.
Dividends. Subject to preferences that may be applicable to any then outstanding preferred stock, the holders of our outstanding shares of common stock are entitled to receive dividends, if any, as may be declared from time to time by our Board of Directors out of legally available funds.
Liquidation. In the event of our liquidation, dissolution or winding up, holders of common stock will be entitled to share ratably in the net assets legally available for distribution to stockholders after the payment of all of our debts and other liabilities, subject to the satisfaction of any liquidation preference granted to the holders of any outstanding shares of preferred stock.
Rights and Preferences. Holders of our common stock have no preemptive, conversion or subscription rights, and there are no redemption or sinking fund provisions applicable to our common stock. The rights, preferences, and privileges of holders of common stock are subject to and may be adversely affected by the rights of the holders of shares of any series of preferred stock that we may designate and issue in the future.
Stock Options
As of March 31, 2013, we had options to purchase 1,096,500 shares outstanding under our Stock Plan, with a weighted average exercise price of $1.96 per share.
Warrants
As of March 31, 2013, there were no warrants outstanding.
Registration Rights
The Company is not a party to any registration rights agreements.
Delaware Anti-Takeover Law and Charter and Bylaws Provisions
Delaware Anti-Takeover Law. We are subject to Section 203 of the Delaware General Corporation Law. Section 203 of that law generally prohibits a public Delaware corporation from engaging in a “business combination” with an “interested stockholder” for a period of three years after the date of the transaction in which the person became an interested stockholder, unless the interested stockholder attained such status with the approval of our Board of Directors, the business combination is approved in a prescribed manner or the interested stockholder acquired at least 85% of our outstanding voting stock in the transaction in which it became an interested stockholder. A “business combination” includes, among other things, a merger or consolidation involving us and the “interested stockholder” and the sale of more than 10% of our assets. In general, an “interested stockholder” is any entity or person beneficially owning 15% or more of our outstanding voting stock and any entity or person affiliated with or controlling or controlled by such entity or person.
| 71 |
Certificate of Incorporation and Bylaws. Provisions of our certificate of incorporation and bylaws may delay or discourage transactions involving an actual or potential change of control or change in our management, including transactions in which stockholders might otherwise receive a premium for their shares, or transactions that our stockholders might otherwise deem to be in their best interests. Therefore, these provisions could adversely affect the price of our common stock if and when it becomes tradable. Among other things, our charter and bylaws:
| • | authorize the issuance of “blank check” preferred stock, the terms of which may be established and shares of which may be issued without stockholder approval; |
| • | eliminate the ability of stockholders to call a special meeting of stockholders; and |
| • | establish advance notice requirements for nominations for election to the Board of Directors or for proposing matters that can be acted upon at stockholder meetings. |
The amendment of any provisions of our charter by the stockholders would require the approval of the holders at least two-thirds of our then outstanding common stock. Our bylaws may be amended or repealed by a majority vote of our Board of Directors or by the affirmative vote of the holders of at least two-thirds of our then outstanding common stock.
Stock Exchange Listing
We have applied to have our common stock listed on the NASDAQ Capital Market under the symbol “TGEN.”
Authorized but Unissued Shares
The authorized but unissued shares of common stock and preferred stock are available for future issuance without stockholder approval, subject to any limitations imposed by regulatory authorities. These additional shares may be used for a variety of corporate finance transactions, acquisitions, and employee benefit plans. The existence of authorized but unissued and unreserved common stock and preferred stock could make it more difficult or discourage an attempt to obtain control of us by means of a proxy contest, tender offer, merger, or otherwise.
Transfer Agent and Registrar
The transfer agent and registrar for our common stock will be VStock Transfer LLC.
| 72 |
Shares Eligible for Future Sale
Immediately prior to this offering, there has been no public market for our common stock. Future sales of substantial amounts of common stock in the public market could adversely affect prevailing market prices. Furthermore, since only a limited number of shares will be available for sale shortly after this offering because of contractual and legal restrictions on resale described below, sales of substantial amounts of common stock in the public market after the restrictions lapse could adversely affect the prevailing market price for our common stock as well as our ability to raise equity capital in the future.
All of the shares sold in this offering will be freely tradable except for any shares purchased by one of our affiliates.
Based on the number of shares of common stock outstanding as of March 31, 2013, immediately prior to the closing of this offering, 13,611,974 shares of common stock will be outstanding, assuming no exercise of options since that date. Except as set forth below, of these shares will be restricted as a result of securities laws or lock-up agreements. These remaining shares will generally become available for sale in the public market as follows:
| · | restricted shares will be eligible for immediate sale upon the closing of this offering; and |
| · | up to restricted shares will be eligible for sale under Rule 144 or Rule 701 upon expiration of lock-up restrictions 180 days after the date of this offering. |
Rule 144
In general, subject to lock-up restrictions, under Rule 144 as currently in effect, beginning , which is 90 days after the Company first became subject to the Exchange Act, any person who is not an affiliate of ours and has held his or her shares for at least six months, including the holding period of any prior owner other than one of our affiliates, may sell shares without restriction, provided current public information about us is available. In addition, subject to lock-up restrictions, under Rule 144, any person who is not an affiliate of ours and has held his or her shares for at least one year, including the holding period of any prior owner other than one of our affiliates, would be entitled to sell an unlimited number of shares immediately upon the closing of this offering without regard to whether current public information about us is available. Beginning , a person who is an affiliate of ours and who has beneficially owned restricted shares for at least six months, including the holding period of any prior owner other than one of our affiliates, is entitled to sell a number of restricted shares within any three-month period that does not exceed the greater of:
| · | 1% of the number of shares of our common stock then outstanding, which will equal approximately shares immediately after this offering; or |
| · | the average weekly trading volume of our common stock on the NASDAQ Capital Market during the four calendar weeks preceding the filing of a notice on Form 144 with respect to the sale. |
Sales of restricted shares under Rule 144 held by our affiliates are also subject to requirements regarding the manner of sale, notice, and the availability of current public information about us. Rule 144 also provides that affiliates relying on Rule 144 to sell shares of our common stock that are not restricted shares must nonetheless comply with the same restrictions applicable to restricted shares, other than the holding period requirement.
Notwithstanding the availability of Rule 144, the holders of substantially all of our restricted shares have entered into lock-up agreements as described below and their restricted shares will become eligible for sale at the expiration of the restrictions set forth in those agreements.
Rule 701
Under Rule 701, shares of our common stock acquired upon the exercise of currently outstanding options or pursuant to other rights granted under our equity incentive plans may be resold by:
| · | persons other than affiliates, beginning , subject only to the manner-of-sale provisions of Rule 144; and |
| · | our affiliates, beginning , subject to the manner-of-sale and volume limitations, current public information and filing requirements of Rule 144, in each case, without compliance with the six-month holding period requirement of Rule 144. |
As of March 31, 2013, options to purchase a total of 1,096,500 shares of common stock were outstanding, of which 812,313 were vested. Of the total number of shares of our common stock issuable under these options, all are subject to contractual lock-up agreements with us or the underwriters described below under “Underwriting” and will become eligible for sale at the expiration of those agreements unless held by an affiliate of ours.
| 73 |
Lock-up Agreements.
We, along with our directors, our officers, and the holders of our convertible notes, have agreed that for a period of 180 days after the date of this prospectus, subject to specified exceptions, we or they will not offer, sell, contract to sell, pledge, or otherwise dispose of, directly or indirectly, any shares of our common stock or securities convertible into or exchangeable or exercisable for any shares of our common stock. Certain of our other stockholders and optionholders have agreed to similar obligations for a period of 180 days after the date of this prospectus, such that approximately 100% of our stockholders and option holders are subject to the lock-up agreements.
Registration Rights
The Company is not a party to any registration rights agreements.
Equity Incentive Plans
We have an effective Form S-8 registration statement with the SEC registering the shares issued or issuable under our equity incentive plans. Accordingly, shares registered under the registration statement will be available for sale in the open market, subject to the lock-up agreements described above, if applicable.
| 74 |
UNDERWRITING
We have entered into an underwriting agreement with Northland Securities, Inc. and Scarsdale Equities LLC with respect to the shares of common stock subject to this offering. Subject to certain conditions, we have agreed to sell to the underwriters, and the underwriters have severally agreed to purchase, the number of shares of common stock provided below opposite their respective names.
| Underwriters | Number of Shares | |||
| Northland Securities, Inc. | ||||
| Scarsdale Equities LLC | ||||
| Total | ||||
The underwriters are offering the shares of common stock subject to their acceptance of the shares of common stock from us and subject to prior sale. The underwriting agreement provides that the obligations of the several underwriters to pay for and accept delivery of the shares of common stock offered by this prospectus are subject to the approval of certain legal matters by their counsel and to certain other conditions. The underwriters are obligated to take and pay for all of the shares of common stock if any such shares are taken. However, the underwriters are not required to take or pay for the shares of common stock covered by the underwriters’ over-allotment option described below.
Over-Allotment Option
We have granted the underwriters an option, exercisable for 30 days from the date of this prospectus, to purchase up to an aggregate of additional shares of common stock to cover over-allotments, if any, at the initial public offering price set forth on the cover page of this prospectus, less underwriting discounts and commissions. The underwriters may exercise this option solely for the purpose of covering over-allotments, if any, made in connection with the offering of the shares of common stock offered by this prospectus. If the underwriters exercise this option, each underwriter will be obligated, subject to certain conditions, to purchase a number of additional shares proportionate to that underwriter’s initial purchase commitment as indicated in the table above for which the option has been exercised.
Discounts, Commissions and Expenses
The underwriters have advised us that they propose to offer the shares of common stock to the public at the initial public offering price set forth on the cover page of this prospectus and to certain dealers at that price less a concession not in excess of $ per share. The underwriters may allow, and certain dealers may reallow, a discount from the concession not in excess of $ per share to certain brokers and dealers. After this offering, the initial public offering price, concession, and reallowance to dealers may be changed by the underwriters. No such change shall change the amount of proceeds to be received by us as set forth on the cover page of this prospectus. The shares of common stock are offered by the underwriters as stated herein, subject to receipt and acceptance by them and subject to their right to reject any order in whole or in part. The underwriters have informed us that they do not intend to confirm sales to any accounts over which they exercise discretionary authority.
The following table shows the underwriting discounts and commissions payable to the underwriters by us in connection with this offering. Such amounts are shown assuming both no exercise and full exercise of the underwriters’ over-allotment option to purchase additional shares.
| Per share | Total Without Exercise of Over-Allotment Option | Total With | ||||||||||
| Initial public offering price | $ | $ | $ | |||||||||
| Underwriting discounts and commissions payable by us | $ | $ | $ | |||||||||
| 75 |
We estimate that expenses payable by us in connection with this offering, other than the underwriting discounts and commissions referred to above, will be approximately $ . We have agreed to reimburse the underwriters for certain out-of-pocket expenses not to exceed $ .
No Public Market
Prior to this offering, there has not been a public market for our common stock, and the initial public offering price for our common stock will be determined through negotiations between us and the underwriters. Among the factors to be considered in these negotiations will be prevailing market conditions, our financial information, market valuations of other companies that we and the underwriters believe to be comparable to us, estimates of our business potential, the present state of our development, and other factors deemed relevant.
No assurance can be given that the initial public offering price will correspond to the price at which our common stock will trade in the public market subsequent to this offering or that an active trading market for our common stock will develop and continue after this offering.
Indemnification
We have agreed to indemnify the underwriters against certain liabilities, including liabilities under the Securities Act, and liabilities arising from breaches of representations and warranties contained in the underwriting agreement, or to contribute to payments that the underwriters may be required to make in respect of those liabilities.
Lock-up Agreements
We, our officers, our directors, and certain of our stockholders have agreed, subject to limited exceptions, for a period of 180 days after the date of the underwriting agreement, not to offer, sell, contract to sell, pledge, grant any option to purchase, make any short sale, or otherwise dispose of, directly or indirectly any shares of common stock or any securities convertible into or exchangeable for our common stock either owned as of the date of the underwriting agreement or thereafter acquired without the prior written consent of the underwriters. This 180-day period may be extended if (1) during the last 17 days of the 180-day period, we issue an earnings release or material news or a material event regarding us occurs or (2) prior to the expiration of the 180-day period, we announce that we will release earnings results during the 16-day period beginning on the last day of the 180-day period, then the period of such extension will be 18 days, beginning on the issuance of the earnings release or the occurrence of the material news or material event. If after any announcement described in clause (2) of the preceding sentence, we announce that we will not release earnings results during the 16-day period, the lock-up period shall expire the later of the expiration of the 180-day period and the end of any extension of such period made pursuant to clause (1) of the preceding sentence. The underwriters may, in their sole discretion and at any time or from time to time before the termination of the lock-up period release all or any portion of the securities subject to lock-up agreements; provided, however, that, subject to limited exceptions, at least two business days before the release or waiver or any lock-up agreement, the underwriters must notify us of the impending release or waiver and announce the impending release or waiver through a major news service.
Price Stabilization, Short Positions and Penalty Bids
In connection with the offering the underwriters may engage in stabilizing transactions, over-allotment transactions, syndicate covering transactions and penalty bids in accordance with Regulation M under the Exchange Act:
• Stabilizing transactions permit bids to purchase the underlying security so long as the stabilizing bids do not exceed a specified maximum.
• Over-allotment involves sales by the underwriters of shares in excess of the number of shares the underwriters are obligated to purchase, which creates a syndicate short position. The short position may be either a covered short position or a naked short position. In a covered short position, the number of shares over-allotted by the underwriters is not greater than the number of shares that they may purchase in the over-allotment option. In a naked short position, the number of shares involved is greater than the number of shares in the over-allotment option. The underwriters may close out any covered short position by either exercising their over-allotment option and/or purchasing shares in the open market.
| 76 |
• Syndicate covering transactions involve purchases of shares of the common stock in the open market after the distribution has been completed in order to cover syndicate short positions. In determining the source of shares to close out the short position, the underwriters will consider, among other things, the price of shares available for purchase in the open market as compared to the price at which it may purchase shares through the over-allotment option. If the underwriters sell more shares than could be covered by the over-allotment option, a naked short position, the position can only be closed out by buying shares in the open market. A naked short position is more likely to be created if the underwriters are concerned that there could be downward pressure on the price of the shares in the open market after pricing that could adversely affect investors who purchase in the offering.
• Penalty bids permit the underwriters to reclaim a selling concession from a syndicate member when the common stock originally sold by the syndicate member is purchased in a stabilizing or syndicate covering transaction to cover syndicate short positions.
These stabilizing transactions, syndicate covering transactions, and penalty bids may have the effect of raising or maintaining the market price of our common stock or preventing or retarding a decline in the market price of the common stock. As a result, the price of our common stock may be higher than the price that might otherwise exist in the open market. Neither we nor the underwriters make any representation or prediction as to the direction or magnitude of any effect that the transactions described above may have on the price of the common stock. In addition, neither we nor the underwriters make any representations that the underwriters will engage in these stabilizing transactions or that any transaction, once commenced, will not be discontinued without notice.
Listing and Transfer Agent
We have applied to list our common stock on the NASDAQ Capital Market under the trading symbol “TGEN.” The transfer agent of our common stock will be VStock Transfer LLC.
Electronic Distribution
This prospectus in electronic format may be made available on websites or through other online services maintained by one or more of the underwriters, or by their affiliates. Other than this prospectus in electronic format, the information on any underwriter’s website and any information contained in any other website maintained by an underwriter is not part of this prospectus or the registration statement of which this prospectus forms a part, has not been approved and/or endorsed by us or any underwriter in its capacity as underwriter, and should not be relied upon by investors.
Other
From time to time, the underwriters and/or their affiliates have provided, and may in the future provide, various investment banking and other financial services for us, for which services they have received, and may in the future receive, customary fees. Except for services provided in connection with this offering, no underwriter has provided any investment banking or other financial services during the 180-day period preceding the date of this prospectus and we do not expect to retain any underwriter to perform any investment banking or other financial services for at least 90 days after the date of this prospectus.
Certain Relationships
Francis A. Mlynarczyk, Jr., the Registered Principal and Managing Partner of Scarsdale Equities LLC, which is one of the managing underwriters in this offering, is also a director of American DG Energy, one of our affiliated entities. In addition, Scarsdale Equities LLC has engaged in, and may in the future engage in, investment banking, advisory, and other commercial dealings in the ordinary course of business with us or our affiliated entities. Scarsdale Equities LLC has received, and may in the future receive, customary fees and commissions for these transactions.
Notice to Investors
European Economic Area
In relation to each Member State of the European Economic Area that has implemented the Prospectus Directive (each, a “Relevant Member State”), an offer to the public of any common stock that is the subject of the offering contemplated herein may not be made in that Relevant Member State, except that an offer to the public in that Relevant Member State of any common stock may be made at any time under the following exemptions under the Prospectus Directive, if they have been implemented in that Relevant Member State:
| • | to legal entities that are qualified investors as defined under the Prospectus Directive; |
| 77 |
| • | by the underwriters to fewer than 100 or, if the Relevant Member State has implemented the relevant provisions of the 2010 PD Amending Directive, 150, natural or legal persons (other than qualified investors as defined in the Prospectus Directive), as permitted under the Prospectus Directive, subject to obtaining the prior consent of the representatives of the underwriters for any such offer; or |
| • | in any other circumstances falling within Article 3(2) of the Prospectus Directive; |
provided that no such offer of common stock shall result in a requirement for us or any underwriter to publish a prospectus pursuant to Article 3 of the Prospectus Directive or supplement a prospectus pursuant to Article 16 of the Prospectus Directive.
Each person in a Relevant Member State who receives any communication in respect of, or who acquires any common stock under, the offers contemplated here in this prospectus will be deemed to have represented, warranted and agreed to and with each underwriter and us that:
| • | it is a qualified investor as defined under the Prospectus Directive; and |
| • | in the case of any common stock acquired by it as a financial intermediary, as that term is used in Article 3(2) of the Prospectus Directive, (i) the common stock acquired by it in the offering has not been acquired on behalf of, nor has it been acquired with a view to its offer or resale to, persons in any Relevant Member State other than qualified investors, as that term is defined in the Prospectus Directive, or in the circumstances in which the prior consent of the representatives of the underwriters has been given to the offer or resale or (ii) where common stock has been acquired by it on behalf of persons in any Relevant Member State other than qualified investors, the offer of such common stock to it is not treated under the Prospectus Directive as having been made to such persons. |
For the purposes of this representation and the provision above, the expression an “offer of common stock to the public” in relation to any common stock in any Relevant Member State means the communication in any form and by any means of sufficient information on the terms of the offer and any common stock to be offered so as to enable an investor to decide to purchase or subscribe for the common stock, as the same may be varied in that Relevant Member State by any measure implementing the Prospectus Directive in that Relevant Member State; the expression “Prospectus Directive” means Directive 2003/71/EC (and amendments thereto, including the 2010 PD Amending Directive, to the extent implemented in the Relevant Member State) and includes any relevant implementing measure in each Relevant Member State; and the expression “2010 PD Amending Directive” means Directive 2010/73/EU.
United Kingdom
This prospectus has only been communicated or caused to have been communicated and will only be communicated or caused to be communicated as an invitation or inducement to engage in investment activity (within the meaning of Section 21 of the Financial Services and Markets Act of 2000 (the “FSMA”)) as received in connection with the issue or sale of the common stock in circumstances in which Section 21(1) of the FSMA does not apply to us. All applicable provisions of the FSMA will be complied with in respect to anything done in relation to the common stock in, from, or otherwise involving the United Kingdom.
Switzerland
This document, as well as any other material relating to the shares that are the subject of the offering contemplated by this prospectus, does not constitute an issue prospectus pursuant to Article 652a and/or 1156 of the Swiss Code of Obligations. The shares will not be listed on the SIX Swiss Exchange and, therefore, the documents relating to the shares, including, but not limited to, this document, do not claim to comply with the disclosure standards of the listing rules of the SIX Swiss Exchange and corresponding prospectus schemes annexed to the listing rules of the SIX Swiss Exchange. The shares are being offered in Switzerland by way of a private placement, i.e., to a small number of selected investors only, without any public offer and only to investors who do not purchase the shares with the intention to distribute them to the public. The investors will be individually approached by the issuer from time to time. This document, as well as any other material relating to the shares, is personal and confidential and does not constitute an offer to any other person. This document may only be used by those investors to whom it has been handed out in connection with the offering described herein and may neither directly nor indirectly be distributed or made available to other persons without express consent of the issuer. It may not be used in connection with any other offer and shall in particular not be copied and/or distributed to the public in (or from) Switzerland.
| 78 |
Hong Kong
The shares may not be offered or sold by means of any document other than (i) in circumstances that do not constitute an offer to the public within the meaning of the Companies Ordinance (Cap.32, Laws of Hong Kong), or (ii) to “professional investors” within the meaning of the Securities and Futures Ordinance (Cap.571, Laws of Hong Kong) and any rules made thereunder, or (iii) in other circumstances that do not result in the document being a “prospectus” within the meaning of the Companies Ordinance (Cap.32, Laws of Hong Kong), and no advertisement, invitation, or document relating to the shares may be issued or may be in the possession of any person for the purpose of issue (in each case whether in Hong Kong or elsewhere) that is directed at, or the contents of which are likely to be accessed or read by, the public in Hong Kong (except if permitted to do so under the laws of Hong Kong), other than with respect to shares that are or are intended to be disposed of only to persons outside Hong Kong or only to “professional investors” within the meaning of the Securities and Futures Ordinance (Cap. 571, Laws of Hong Kong) and any rules made thereunder.
Singapore
This prospectus has not been registered as a prospectus with the Monetary Authority of Singapore. Accordingly, this prospectus and any other document or material in connection with the offer or sale, or invitation for subscription or purchase, of the shares may not be circulated or distributed, nor may the shares be offered or sold, or be made the subject of an invitation for subscription or purchase, whether directly or indirectly, to persons in Singapore other than (i) to an institutional investor under Section 274 of the Securities and Futures Act, Chapter 289 of Singapore (the “SFA”), (ii) to a relevant person, or any person pursuant to Section 275(1A), and in accordance with the conditions specified in Section 275 of the SFA, or (iii) otherwise pursuant to, and in accordance with the conditions of, any other applicable provision of the SFA.
Where the shares are subscribed or purchased under Section 275 by a relevant person that is: (i) a corporation (which is not an accredited investor) the sole business of which is to hold investments and the entire share capital of which is owned by one or more individuals, each of whom is an accredited investor; or (ii) a trust (where the trustee is not an accredited investor) whose sole purpose is to hold investments and each beneficiary is an accredited investor, shares, debentures, and units of shares and debentures of that corporation or the beneficiaries’ rights and interest in that trust shall not be transferable for 6 months after that corporation or that trust has acquired the shares under Section 275 except: (1) to an institutional investor under Section 274 of the SFA or to a relevant person, or any person pursuant to Section 275(1A), and in accordance with the conditions specified in Section 275 of the SFA; (2) where no consideration is given for the transfer; or (3) by operation of law.
Japan
The securities have not been and will not be registered under the Financial Instruments and Exchange Law of Japan (the Financial Instruments and Exchange Law) and each underwriter has agreed that it will not offer or sell any securities, directly or indirectly, in Japan or to, or for the benefit of, any resident of Japan (which term as used herein means any person resident in Japan, including any corporation or other entity organized under the laws of Japan), or to others for re-offering or resale, directly or indirectly, in Japan or to a resident of Japan, except pursuant to an exemption from the registration requirements of, and otherwise in compliance with, the Financial Instruments and Exchange Law and any other applicable laws, regulations, and ministerial guidelines of Japan.
| 79 |
LEGAL MATTERS
The validity of the securities offered hereby will be passed upon for us by our counsel, Sullivan & Worcester LLP, Boston, Massachusetts. Lowenstein Sandler LLP, New York, New York, has acted as counsel to the underwriters in connection with this offering.
EXPERTS
The consolidated financial statements as of and for the periods ended December 31, 2012, 2011, and 2010, appearing in this registration statement and prospectus have been audited by McGladrey LLP (formerly McGladrey & Pullen, LLP), an independent registered public accounting firm, as stated in their report appearing elsewhere herein, and are included in reliance upon such report and upon the authority of such firm as experts in accounting and auditing.
No expert or counsel named in this prospectus as having prepared or certified any part of this prospectus or having given an opinion upon the validity of the securities being registered or upon other legal matters in connection with the registration or offering of the common stock was employed on a contingency basis, or had, or is to receive, any interest, directly or indirectly, in the Company or any of our parents or subsidiaries. Nor was any such person connected with us or any of our parents or subsidiaries, if any, as a promoter, managing or principal underwriter, voting trustee, director, officer, or employee.
WHERE YOU CAN FIND MORE INFORMATION
We have filed with the SEC a registration statement on Form S-1, including exhibits and schedules, under the Securities Act with respect to the shares of common stock to be sold in this offering. This prospectus, which constitutes a part of the registration statement, does not contain all of the information set forth in the registration statement or the exhibits and schedules that are part of the registration statement. For further information about us and our securities, you should refer to the registration statement.
We are subject to the information and reporting requirements of the Exchange Act and are required to file annual, quarterly, and current reports, proxy statements, and other information with the SEC. You may read, without charge, and copy, at prescribed rates, all or any portion of the registration statement or any reports, statements, or other information in the files at the public reference room at the SEC’s principal office at 100 F Street NE, Washington, D.C., 20549, Room 1580. You may request copies of these documents, for a copying fee, by writing to the SEC. You may call the SEC at 1-800-SEC-0330 for further information on the operation of its public reference room. Our filings, including the registration statement, are also available to you on the Internet website maintained by the SEC at http://www.sec.gov.
| 80 |
INDEX TO CONSOLIDATED FINANCIAL STATEMENTS
The Financial Statements included below are stated in U.S. dollars and are prepared in accordance with U.S. Generally Accepted Accounting Principles. The following table summarizes the relevant financial data for our business and should be read with our financial statements, which are included in this registration statement.
| Audited Financial Statements | |
| Report of Independent Registered Public Accounting Firm McGladrey LLP | F-2 |
| Consolidated Balance Sheets as of December 31, 2012 and 2011 | F-3 |
| Consolidated Statements of Operations for the years ended December 31, 2012, 2011, and 2010 | F-4 |
| Consolidated Statements of Changes in Stockholders’ Equity for the years ended December 31, 2012, 2011, and 2010 | F-5 |
| Consolidated Statements of Cash Flows for the years ended December 31, 2012, 2011, and 2010 | F-6 |
| Notes to Consolidated Financial Statements | F-7 |
| Unaudited Interim Financial Statements | |
| Condensed Consolidated Balance Sheets as of March 31, 2013 (unaudited) and December 31, 2012 (audited) | F-27 |
| Condensed Consolidated Statements of Operations for the three months ended March 31, 2013 and 2012 | F-28 |
| Consolidated Statements of Changes in Stockholders’ Equity for the three months ended March 31, 2013 and 2012 | F-29 |
| Consolidated Statements of Cash Flows for the three months ended March 31, 2013 and 2012 | F-30 |
| Notes to Condensed Consolidated Financial Statements | F-31 |
All other schedules for which provision is made in the applicable accounting regulations of the SEC are not required under the related instructions, or are inapplicable, and therefore have been omitted.
| F-1 |
Report of Independent Registered Public Accounting Firm
To the Board of Directors and Stockholders of Tecogen Inc.
We have audited the accompanying consolidated balance sheets of Tecogen Inc. as of December 31, 2012 and 2011, and the related consolidated statements of operations, stockholders’ equity, and cash flows for the years ended December 31, 2012, 2011 and 2010. These financial statements are the responsibility of the Company’s management. Our responsibility is to express an opinion on these financial statements based on our audits.
We conducted our audits in accordance with the standards of the Public Company Accounting Oversight Board (United States). Those standards require that we plan and perform the audit to obtain reasonable assurance about whether the financial statements are free of material misstatement. The Company is not required to have, nor were we engaged to perform, an audit of its internal control over financial reporting. Our audits included consideration of internal control over financial reporting as a basis for designing audit procedures that are appropriate in the circumstances, but not for the purpose of expressing an opinion on the effectiveness of the Company’s internal control over financial reporting. Accordingly, we express no such opinion. An audit also includes examining, on a test basis, evidence supporting the amounts and disclosures in the financial statements, assessing the accounting principles used and significant estimates made by management, as well as evaluating the overall financial statement presentation. We believe that our audits provide a reasonable basis for our opinion.
In our opinion, the consolidated financial statements referred to above present fairly, in all material respects, the financial position of Tecogen Inc. as of December 31, 2012 and 2011, and the results of its operations and its cash flows for the years ended December 31, 2012, 2011 and 2010, in conformity with U.S. generally accepted accounting principles.
| /s/ McGladrey LLP | |
| McGladrey LLP |
Boston, Massachusetts
March 27, 2013, except for the reverse stock split disclosed in the fourth paragraph of Note 16, as to which is dated May 17, 2013.
| F-2 |
Audited Financial Statements
TECOGEN INC.
CONSOLIDATED BALANCE SHEETS
As of December 31, 2012 and 2011
| 2012 | 2011 | |||||||
| ASSETS | ||||||||
| Current assets: | ||||||||
| Cash and cash equivalents | $ | 1,572,785 | $ | 3,018,566 | ||||
| Short-term investments-restricted | 181,859 | 683,428 | ||||||
| Accounts receivable, net | 2,700,243 | 1,399,232 | ||||||
| Inventory, net | 3,356,622 | 2,568,986 | ||||||
| Due from related party | 55,837 | 299,739 | ||||||
| Prepaid and other current assets | 402,846 | 112,716 | ||||||
| Total current assets | 8,270,192 | 8,082,667 | ||||||
| Property, plant and equipment, net | 435,612 | 385,779 | ||||||
| Intangible assets, net | 372,020 | 241,621 | ||||||
| Other assets | 39,425 | 35,425 | ||||||
| TOTAL ASSETS | $ | 9,117,249 | $ | 8,745,492 | ||||
| LIABILITIES AND STOCKHOLDERS’ EQUITY | ||||||||
| Current liabilities: | ||||||||
| Demand notes payable, related party | $ | 1,337,500 | $ | 1,037,500 | ||||
| Current portion of convertible debentures, related party | 90,967 | - | ||||||
| Accounts payable | 1,151,010 | 812,214 | ||||||
| Accrued expenses | 807,922 | 727,463 | ||||||
| Deferred revenue | 677,919 | 509,283 | ||||||
| Interest payable, related party | 126,170 | 61,062 | ||||||
| Total current liabilities | 4,191,488 | 3,147,522 | ||||||
| Long-term liabilities: | ||||||||
| Deferred revenue, net of current portion | 142,726 | 183,839 | ||||||
| Convertible debentures, related party, net of current portion | - | 190,967 | ||||||
| Total liabilities | 4,334,214 | 3,522,328 | ||||||
| Commitments and contingencies (Note 8) | - | - | ||||||
| Redeemable Common stock, $0.001 par value | - | - | ||||||
| Stockholders’ equity: | ||||||||
| Tecogen Inc. shareholders’ equity: | ||||||||
| Common stock, $0.001 par value; 100,000,000 shares authorized; 13,611,974, 13,498,471 and 12,232,762 issued and outstanding at December 31, 2012, 2011 and 2010, respectively | 54,448 | 53,994 | ||||||
| Additional paid-in capital | 16,319,985 | 15,486,775 | ||||||
| Common stock subscription | - | - | ||||||
| Receivable from shareholder | - | (345,000 | ) | |||||
| Accumulated deficit | (11,759,723 | ) | (10,122,766 | ) | ||||
| Total Tecogen Inc. stockholders’ equity | 4,614,710 | 5,073,003 | ||||||
| Noncontrolling interest | 168,325 | 150,161 | ||||||
| Total stockholders’ equity | 4,783,035 | 5,223,164 | ||||||
| TOTAL LIABILITIES AND STOCKHOLDERS’ EQUITY | $ | 9,117,249 | $ | 8,745,492 | ||||
The accompanying notes are an integral part of these consolidated financial statements.
| F-3 |
TECOGEN INC.
CONSOLIDATED STATEMENTS OF OPERATIONS
For the Years Ended December 31, 2012, 2011, and 2010
| 2012 | 2011 | 2010 | ||||||||||
| Revenues | ||||||||||||
| Products | $ | 7,453,222 | $ | 4,569,113 | $ | 5,543,605 | ||||||
| Services | 7,800,750 | 6,496,097 | 5,767,624 | |||||||||
| 15,253,972 | 11,065,210 | 11,311,229 | ||||||||||
| Cost of sales | ||||||||||||
| Products | 5,290,535 | 3,005,698 | 3,801,485 | |||||||||
| Services | 4,098,363 | 3,173,400 | 2,795,720 | |||||||||
| 9,388,898 | 6,179,098 | 6,597,205 | ||||||||||
| Gross profit | 5,865,074 | 4,886,112 | 4,714,024 | |||||||||
| Operating expenses | ||||||||||||
| General and administrative | 6,643,120 | 5,986,762 | 4,973,794 | |||||||||
| Selling | 1,225,580 | 782,252 | 290,505 | |||||||||
| 7,868,700 | 6,769,014 | 5,264,299 | ||||||||||
| Loss from operations | (2,003,626 | ) | (1,882,902 | ) | (550,275 | ) | ||||||
| Other income (expense) | ||||||||||||
| Interest and other income | 48,397 | 38,402 | 23,574 | |||||||||
| Interest expense | (71,208 | ) | (40,294 | ) | (37,280 | ) | ||||||
| (22,811 | ) | (1,892 | ) | (13,706 | ) | |||||||
| Loss before income taxes | (2,026,437 | ) | (1,884,794 | ) | (563,981 | ) | ||||||
| Consolidated net loss | (2,026,437 | ) | (1,884,794 | ) | (563,981 | ) | ||||||
| Less: Loss attributable to the noncontrolling interest | 389,480 | 310,293 | 208,673 | |||||||||
| Net loss attributable to Tecogen Inc. | $ | (1,636,957 | ) | $ | (1,574,501 | ) | $ | (355,308 | ) | |||
| Net loss per share - basic and diluted | $ | (0.12 | ) | $ | (0.13 | ) | $ | (0.03 | ) | |||
| Weighted average shares outstanding - basic and diluted | 13,135,071 | 12,052,914 | 11,470,658 | |||||||||
The accompanying notes are an integral part of these consolidated financial statements.
| F-4 |
TECOGEN INC.
CONSOLIDATED STATEMENTS OF STOCKHOLDERS’ EQUITY
For the Years Ended December 31, 2012, 2011, and 2010
| Tecogen Inc. Shareholders | ||||||||||||||||||||||||||||
| Common | ||||||||||||||||||||||||||||
| Stock | Additional | Common | ||||||||||||||||||||||||||
| $0.001 | Paid-In | Stock | Shareholder | Accumulated | Noncontrolling | |||||||||||||||||||||||
| Par Value | Capital | Subscription | Receivable | Deficit | Interest | Total | ||||||||||||||||||||||
| Balance at December 31, 2009 | $ | 46,516 | $ | 10,058,287 | $ | - | $ | - | $ | (8,192,957 | ) | $ | 388,084 | $ | 2,299,930 | |||||||||||||
| Sale of common stock, net of costs | 1,863 | 1,209,386 | - | - | - | - | 1,211,249 | |||||||||||||||||||||
| Issuance of restricted stock | 77 | 49,871 | (53 | ) | - | - | - | 49,895 | ||||||||||||||||||||
| Note receivable from shareholder | - | - | - | (345,000 | ) | - | - | (345,000 | ) | |||||||||||||||||||
| Exercise of warrants | 475 | 142,025 | - | - | - | - | 142,500 | |||||||||||||||||||||
| Stock based compensation expense | - | 192,947 | - | - | - | 4,139 | 197,086 | |||||||||||||||||||||
| Net loss | - | - | - | - | (355,308 | ) | (208,673 | ) | (563,981 | ) | ||||||||||||||||||
| Balance at December 31, 2010 | $ | 48,931 | $ | 11,652,516 | $ | (53 | ) | $ | (345,000 | ) | $ | (8,548,265 | ) | $ | 183,550 | $ | 2,991,679 | |||||||||||
| Sale of common stock, net of costs | 4,717 | 3,606,276 | - | - | - | - | 3,610,993 | |||||||||||||||||||||
| Conversion of accrued interest on related party convertible notes to common stock | 146 | 72,813 | - | - | - | - | 72,959 | |||||||||||||||||||||
| Issuance of restricted stock | 200 | - | 53 | - | - | - | 253 | |||||||||||||||||||||
| Issuance of subsidiary restricted stock | - | - | - | - | - | 200 | 200 | |||||||||||||||||||||
| Purchase of subsidiary common stock | - | (261,174 | ) | - | - | - | 261,174 | - | ||||||||||||||||||||
| Purchase of stock options | - | (12,500 | ) | - | - | - | - | (12,500 | ) | |||||||||||||||||||
| Stock based compensation expense | - | 428,844 | - | - | - | 15,530 | 444,374 | |||||||||||||||||||||
| Net loss | - | - | - | - | (1,574,501 | ) | (310,293 | ) | (1,884,794 | ) | ||||||||||||||||||
| Balance at December 31, 2011 | $ | 53,994 | $ | 15,486,775 | $ | - | $ | (345,000 | ) | $ | (10,122,766 | ) | $ | 150,161 | $ | 5,223,164 | ||||||||||||
| Sale of subsidiary common stock | - | 289,606 | - | - | - | 210,394 | 500,000 | |||||||||||||||||||||
| Purchase of subsidiary common stock | - | (174,958 | ) | - | - | - | 174,958 | - | ||||||||||||||||||||
| Sale of common stock | 850 | 679,150 | - | - | - | - | 680,000 | |||||||||||||||||||||
| Conversion of related party convertible notes to common stock | 333 | 99,667 | - | - | - | - | 100,000 | |||||||||||||||||||||
| Conversion of accrued interest on related party convertible notes to common stock | 8 | 6,092 | - | - | - | - | 6,100 | |||||||||||||||||||||
| Settlement receivable from shareholder (Note 10) | (400 | ) | (239,600 | ) | - | 345,000 | - | - | 105,000 | |||||||||||||||||||
| Purchase of restricted stock | (337 | ) | - | - | - | - | - | (337 | ) | |||||||||||||||||||
| Stock based compensation expense | - | 173,253 | - | - | - | 22,292 | 195,545 | |||||||||||||||||||||
| Net loss | - | - | - | - | (1,636,957 | ) | (389,480 | ) | (2,026,437 | ) | ||||||||||||||||||
| Balance at December 31, 2012 | $ | 54,448 | $ | 16,319,985 | $ | - | $ | - | $ | (11,759,723 | ) | $ | 168,325 | $ | 4,783,035 | |||||||||||||
The accompanying notes are an integral part of these consolidated financial statements.
| F-5 |
TECOGEN INC.
CONSOLIDATED STATEMENTS OF CASH FLOWS
For the Years Ended December 31, 2012, 2011, and 2010
| 2012 | 2011 | 2010 | ||||||||||
| CASH FLOWS FROM OPERATING ACTIVITIES: | ||||||||||||
| Net loss | $ | (2,026,437 | ) | $ | (1,884,794 | ) | $ | (563,981 | ) | |||
| Adjustments to reconcile net loss to net cash used in operating activities: | ||||||||||||
| Depreciation and amortization | 203,775 | 158,286 | 88,656 | |||||||||
| Provision for losses on accounts receivable | 57,600 | 20,600 | 6,658 | |||||||||
| Provision for inventory reserve | (26,800 | ) | 3,300 | (66,500 | ) | |||||||
| Stock-based compensation | 195,545 | 444,374 | 197,086 | |||||||||
| Changes in operating assets and liabilities | ||||||||||||
| (Increase) decrease in: | ||||||||||||
| Short-term investments | (4,776 | ) | (3,428 | ) | - | |||||||
| Accounts receivable | (1,358,611 | ) | 368,491 | 331,581 | ||||||||
| Inventory | (760,836 | ) | (1,247,871 | ) | 154,351 | |||||||
| Due from related party | 243,902 | (201,509 | ) | (98,230 | ) | |||||||
| Prepaid and other current assets | (290,130 | ) | (27,613 | ) | 6,465 | |||||||
| Other assets | (4,000 | ) | - | (2,481 | ) | |||||||
| Increase (decrease) in: | ||||||||||||
| Accounts payable | 338,796 | 106,808 | 417,376 | |||||||||
| Accrued expenses | 80,459 | (95,462 | ) | (22,138 | ) | |||||||
| Deferred revenue | 127,523 | (18,137 | ) | (76,439 | ) | |||||||
| Interest payable, related party | 71,208 | (32,665 | ) | (26,401 | ) | |||||||
| Due to related party | - | - | (4,133 | ) | ||||||||
| Net cash provided by (used in) operating activities | (3,152,782 | ) | (2,409,620 | ) | 341,870 | |||||||
| CASH FLOWS FROM INVESTING ACTIVITIES: | ||||||||||||
| Purchases of property and equipment | (219,711 | ) | (115,186 | ) | (195,955 | ) | ||||||
| Purchases of intangible assets | (164,296 | ) | (38,747 | ) | (113,499 | ) | ||||||
| Purchases of short-term investments | - | (680,000 | ) | - | ||||||||
| Sale of short-term investments | 506,345 | 85,000 | 679,747 | |||||||||
| Net cash provided by (used in) investing activities | 122,338 | (748,933 | ) | 370,293 | ||||||||
| CASH FLOWS FROM FINANCING ACTIVITIES: | ||||||||||||
| Payments from issuance of receivable from shareholder | - | - | (345,000 | ) | ||||||||
| Payments made on demand notes payable, related party | - | - | (422,568 | ) | ||||||||
| Proceeds from payments on receivable from shareholder | 105,000 | - | - | |||||||||
| Proceeds from issuance of demand notes payable | 300,000 | 750,000 | - | |||||||||
| Proceeds from sale of common stock, net of costs | 680,000 | 3,610,993 | 1,211,249 | |||||||||
| Proceeds from issuance of restricted stock | - | 453 | 49,895 | |||||||||
| Purchase of stock options | - | (12,500 | ) | - | ||||||||
| Purchase of restricted stock | (337 | ) | - | - | ||||||||
| Proceeds from exercise of warrants | - | - | 142,500 | |||||||||
| Proceeds from sale of subsidiary common stock | 500,000 | - | - | |||||||||
| Net cash provided by financing activities | 1,584,663 | 4,348,946 | 636,076 | |||||||||
| Net increase (decrease) in cash and cash equivalents | (1,445,781 | ) | 1,190,393 | 1,348,239 | ||||||||
| Cash and cash equivalents, beginning of the period | 3,018,566 | 1,828,173 | 479,934 | |||||||||
| Cash and cash equivalents, end of the period | $ | 1,572,785 | $ | 3,018,566 | $ | 1,828,173 | ||||||
| Supplemental disclosures of cash flows information: | ||||||||||||
| Non-cash investing and financing activities: | ||||||||||||
| Conversion of redeemable common stock to common stock | $ | - | $ | 500,000 | $ | - | ||||||
| Conversion of accrued convertible debenture interest to common stock | $ | 6,100 | $ | 72,959 | $ | - | ||||||
| Conversion of related party notes to common stock | $ | 100,000 | $ | - | $ | - | ||||||
| Settlement of shareholder receivable | $ | 240,000 | $ | - | $ | - | ||||||
| Interest paid | $ | - | $ | - | $ | 63,139 | ||||||
The accompanying notes are an integral part of these consolidated financial statements.
| F-6 |
Notes to Audited Consolidated Financial Statements
Note 1 – Nature of business and operations
Tecogen Inc. (the “Company”) (a Delaware Corporation) was organized on November 15, 2000, and acquired the assets and liabilities of the Tecogen Products division of Thermo Power Corporation. The Company produces commercial and industrial, natural-gas-fueled engine-driven, combined heat and power (CHP) products that reduce energy costs, decrease greenhouse gas emissions, and alleviate congestion on the national power grid. Tecogen’s products supply electric power or mechanical power for cooling, while heat from the engine is recovered and purposefully used at a facility. The majority of Company’s customers are located in regions with the highest utility rates, typically California, the Midwest, and the Northeast.
On May 4, 2009, the Company invested $8,400 in exchange for 8,400,000 shares of a newly established corporation, Ilios Inc., or Ilios. The investment gave the Company a controlling financial interest in Ilios, whose business focus is advanced heating systems for commercial and industrial applications. On May 11, 2009, the Company sold 1,400,000 shares in Ilios at $0.50 per share to two of its existing stockholders in exchange for the extinguishment of $700,000 in demand notes payable, convertible debentures, and accrued interest (see Note 7 – Demand notes payable and convertible debentures – related party). On July 24, 2009, Ilios sold 2,710,000 shares of common stock to accredited investors at $0.50 per share and raised $1,352,500. On June 3, 2011, Ilios sold 500,000 shares of common stock to Tecogen at $0.50 per share and raised $250,000 and on December 29, 2011, Ilios sold 1 million shares of common stock to Tecogen at $0.50 per share and raised $500,000. On January 19, 2012, Ilios sold 1 million shares of common stock to an accredited investor and raised $500,000. On December 28, 2012, Ilios sold 1 million shares of common stock to Tecogen at $0.50 per share and raised $500,000. As of December 31, 2012, the Company owns a 65.0% interest in Ilios and has consolidated Ilios into its financial statements.
The accompanying consolidated financial statements include the accounts of the Company and its majority-owned subsidiary, Ilios, whose business focus is on advanced heating systems for commercial and industrial applications.
The Company’s operations are comprised of one business segment. Our business is to manufacture and support highly efficient CHP products based on engines fueled by natural gas.
On March 25, 2013, the Company entered into a Revolving Line of Credit Agreement, or the Credit Agreement, with John N. Hatsopoulos, our Chief Executive Officer. Under the terms of the Credit Agreement, Mr. Hatsopoulos has agreed to lend the Company up to an aggregate of $1 million, from time to time, at the written request of the Company. Any amounts borrowed by the Company pursuant to the Credit Agreement will bear interest at the Bank Prime Rate as quoted from time to time in the Wall Street Journal plus 1.5% per year. Interest is due and payable quarterly in arrears. Repayment of the principal amount borrowed pursuant to the Credit Agreement will be due on March 31, 2014, or the Maturity Date. Prepayment of any amounts due under the Credit Agreement may be made at any time without penalty. The Credit Agreement terminates on the Maturity Date. The Company has not yet borrowed any amounts pursuant to the Credit Agreement.
Note 2 – Summary of significant accounting policies
Principles of Consolidation and Basis of Presentation
The financial statements have been prepared in accordance with accounting standards set by the Financial Accounting Standards Board (FASB). The FASB sets generally accepted accounting principles (GAAP) to ensure financial condition, results of operations, and cash flows are consistently reported. References to GAAP issued by the FASB in these footnotes are to the FASB Accounting Standards Codification (ASC). The Company adopted the presentation requirements for noncontrolling interests required by ASC 810 Consolidation. Under ASC 810, earnings or losses attributed to the noncontrolling interests are reported as part of the consolidated earnings and not a separate component of income or expense. Noncontrolling interests in the net assets and operations of Ilios are reflected in the caption “Noncontrolling interest” in the accompanying consolidated financial statements. All intercompany transactions have been eliminated.
Use of Estimates
The preparation of financial statements in conformity with accounting principles generally accepted in the United States of America requires management to make estimates and assumptions that affect the reported amounts of assets and liabilities and disclosure of contingent assets and liabilities at the date of the financial statements and the reported amounts of revenues and expenses during the reporting period. Actual results could differ from those estimates.
| F-7 |
Concentration of Credit Risk
The Company’s financial instruments that are exposed to concentrations of credit risk consist primarily of cash and cash equivalents, short-term investments, and accounts receivable. The Company maintains its cash balances in bank accounts, which at times may exceed the Federal Deposit Insurance Corporation’s (“FDIC”) general deposit insurance limits. The amount on deposit at December 31, 2012, 2011, and 2010 that exceeded the $250,000 federally insured limit was approximately $1,070,000, $3,200,000, and $1,167,000, respectively. The Company has not experienced any losses in such accounts and thus believes that it is not exposed to any significant credit risk on cash and cash equivalents.
There were no customers that represented more than 10% of revenues for the year ended December 31, 2011. The Company has one customer that represented 24.9% and 14.6% of revenues for the years ended December 31, 2012 and 2010, respectively. Included in trade accounts receivable are amounts from one customer that represents 16% and 17% of the trade accounts receivable balance as of December 31, 2012 and 2011, respectively.
Cash and Cash Equivalents
The Company considers all highly liquid instruments with an original maturity date, at date of purchase, of three months or less to be cash and cash equivalents.
Short-Term Investments
Short-term investments consist of certificates of deposit with maturities of greater than three months but less than one year. Certificates of deposits are recorded at fair value.
On October 26, 2011, the Company entered into an agreement with Digital Energy Corp., a customer of the Company, whereby the Company provided a letter of credit in the amount of $180,000, for the benefit of Digital Energy Corp., to satisfy a requirement of the New York Independent System Operator, Inc. A certificate of deposit for $180,000 secures the letter of credit. In exchange for providing this letter of credit, Digital Energy Corp. provided a promissory note to the Company for $180,000 with interest at 6%, payable in monthly installments of interest only. Principal would only be owed if the letter of credit was drawn upon and would become due and payable on the first anniversary date of the note. On February 19, 2013, this letter of credit was cancelled and the certificate of deposit was released from restriction.
On June 13, 2011, the Southern California Gas Company entered into an agreement with the Company to invest $500,000 in the Company’s common stock. The agreement included certain stockholder rights and a redemption right whereby the investor may redeem the shares for cash until the earlier of the initiation of a public offering of the Company by filing a registration statement with the SEC or 5 years. A letter of credit, secured by a Certificate of Deposit, for the amount of the investment has been put in place to satisfy the contingency of the redemption right. The Certificate of Deposit is classified as a short-term investment in the accompanying balance sheet. Since the Company filed a registration statement with the Securities and Exchange Commission on December 23, 2011, the redemption right is no longer valid. The Certificate of Deposit was converted to cash in 2012.
Accounts Receivable
Accounts receivable are stated at the amount management expects to collect from outstanding balances. An allowance for doubtful accounts is provided for those accounts receivable considered to be uncollectible based upon historical experience and management’s evaluation of outstanding accounts receivable at the end of the year. Bad debts are written off against the allowance when identified. At December 31, 2012 and 2011, the allowance for doubtful accounts was $154,400 and $96,800, respectively.
Inventory
Raw materials, work in process, and finished goods inventories are stated at the lower of cost, as determined by the average cost method, or net realizable value. The Company periodically reviews inventory quantities on hand for excess and/or obsolete inventory based primarily on historical usage, as well as based on estimated forecast of product demand. Any reserves that result from this review are charged to cost of sales.
| F-8 |
Property, Plant and Equipment
Property, plant and equipment are recorded at cost. Depreciation is provided using the straight-line method over the estimated useful lives of the asset, which range from three to seven years. Leasehold improvements are amortized using the straight-line method over the lesser of the estimated useful lives of the assets or the term of the related leases. Expenditures for maintenance and repairs are expensed currently, while renewals and betterments that materially extend the life of an asset are capitalized.
Intangible Assets
Intangible assets subject to amortization include costs incurred by the Company to acquire product certifications and certain patent costs. These costs are amortized on a straight-line basis over the estimated economic life of the intangible asset. The Company reviews intangible assets for impairment when the circumstances warrant.
Loss per Common Share
The Company computes basic loss per share by dividing net loss for the period by the weighted-average number of shares of common stock outstanding during the period. The Company computes its diluted earnings per common share using the treasury stock method. For purposes of calculating diluted earnings per share, the Company considers its shares issuable in connection with the convertible debentures, stock options and warrants to be dilutive common stock equivalents when the exercise/conversion price is less than the average market price of our common stock for the period. All shares issuable for the years ended December 31, 2012, 2011, and 2010 were anti-dilutive because of the reported net loss.
Other Comprehensive Net Loss
The comprehensive net loss for the years ended December 31, 2012, 2011, and 2010 does not differ from the reported loss.
Segment Information
The Company reports segment data based on the management approach. The management approach designates the internal reporting that is used by management for making operating and investment decisions and evaluating performance as the source of the Company’s reportable segments. The Company uses one measurement of profitability and does not disaggregate its business for internal reporting. The Company has determined that it operates in one business segment, which is the manufacture and support of highly efficient CHP products based on engines fueled by natural gas.
The following table summarizes net revenue by product line and services for the years ended December 31, 2012, 2011, and 2010:
| 2012 | 2011 | 2010 | ||||||||||
| Products: | ||||||||||||
| Cogeneration | $ | 5,791,412 | $ | 2,737,161 | $ | 4,977,595 | ||||||
| Chiller | 1,661,810 | 1,831,952 | 566,010 | |||||||||
| Total Product Revenue | 7,453,222 | 4,569,113 | 5,543,605 | |||||||||
| Services | 7,800,750 | 6,496,097 | 5,767,624 | |||||||||
| $ | 15,253,972 | $ | 11,065,210 | $ | 11,311,229 | |||||||
Income Taxes
The Company uses the asset and liability method of accounting for income taxes. The current or deferred tax consequences of transactions are measured by applying the provisions of enacted tax laws to determine the amount of taxes payable currently or in future years. Deferred tax assets and liabilities are determined based on the difference between the financial statement and tax bases of assets and liabilities and expected future tax consequences of events that have been included in the financial statements or tax returns using enacted tax rates in effect for the years in which the differences are expected to reverse. Under this method, a valuation allowance is used to offset deferred taxes if, based upon the available evidence, it is more likely than not that some or all of the deferred tax assets may not be realized. Management evaluates the recoverability of deferred taxes and the adequacy of the valuation allowance annually.
| F-9 |
The Company has adopted the provisions of the accounting standards relative to accounting for uncertainties in tax positions. These provisions provide guidance on the recognition, de-recognition and measurement of potential tax benefits associated with tax positions. The Company elected to recognize interest and penalties related to income tax matters as a component of income tax expense in the statements of operations. There was no impact on the financial statements as a result of this guidance. See Note 15 – Income taxes.
With few exceptions, the Company is no longer subject to possible income tax examinations by federal, state, or local taxing authorities for tax years before 2009, with the exception of loss carryforwards in the event they are utilized in future years.
The Company’s tax returns are open to adjustment from 2001 forward because the Company has loss carryforwards from those years, which may be adjusted in the year those losses are utilized.
Fair Value of Financial Instruments
The Company’s financial instruments are cash and cash equivalents, certificates of deposit, accounts receivable, accounts payable, capital lease obligations, and notes due from related party convertible debentures. The recorded values of cash and cash equivalents, accounts receivable and accounts payable approximate their fair values based on their short-term nature. At December 31, 2012, the current value on the consolidated balance sheet of the debentures and capital lease obligations approximates fair value as the terms approximate those available for similar instruments. Certificates of deposit classified as short-term investments are recorded at fair value.
Revenue Recognition
Revenue is recognized when persuasive evidence of an arrangement exists, delivery has occurred or services have been rendered, the price is fixed or determinable, and collectability is reasonably assured. Generally, sales of cogeneration and chiller units and parts are recognized when shipped and services are recognized over the term of the service period. Payments received in advance of services being performed are recorded as deferred revenue.
Infrequently, the Company recognizes revenue in certain circumstances before delivery has occurred (commonly referred to as bill and hold transactions). In such circumstances, among other things, risk of ownership has passed to the buyer, the buyer has made a written fixed commitment to purchase the finished goods, the buyer has requested the finished goods be held for future delivery as scheduled and designated by the buyer, and the Company has no additional performance obligations. For these transactions, the finished goods are segregated from inventory and normal billing and credit terms are granted. For the years ended December 31, 2012, 2011, and 2010, no revenues were recorded as bill and hold transactions.
For those arrangements that include multiple deliverables, the Company first determines whether each service or deliverable meets the separation criteria of FASB ASC 605-25, Revenue Recognition—Multiple-Element Arrangements. In general, a deliverable (or a group of deliverables) meets the separation criteria if the deliverable has stand-alone value to the customer and if the arrangement includes a general right of return related to the delivered item and delivery or performance of the undelivered item(s) is considered probable and substantially in control of the Company. Each deliverable that meets the separation criteria is considered a separate ‘‘unit of accounting.” The Company allocates the total arrangement consideration to each unit of accounting using the relative fair value method. The amount of arrangement consideration that is allocated to a delivered unit of accounting is limited to the amount that is not contingent upon the delivery of another unit of accounting.
When vendor-specific objective evidence or third-party evidence is not available, adopting the relative fair value method of allocation permits the Company to recognize revenue on specific elements as completed based on the estimated selling price. The Company generally uses internal pricing lists that determine sales prices to external customers in determining its best estimate of the selling price of the various deliverables in multiple-element arrangements. Changes in judgments made in estimating the selling price of the various deliverables could significantly affect the timing or amount of revenue recognition. The Company enters into sales arrangements with customers to sell its cogeneration and chiller units and related service contracts and occasionally installation services. Because the Company sells each deliverable to other customers on a stand-alone basis, the company has determined that each deliverable has a stand-alone value. Additionally, there are no rights of return relative to the delivered items; therefore, each deliverable is considered a separate unit of accounting.
| F-10 |
After the arrangement consideration has been allocated to each unit of accounting, the Company applies the appropriate revenue recognition method for each unit of accounting based on the nature of the arrangement and the services included in each unit of accounting. Cogeneration and chiller units are recognized when shipped. Services are recognized over the term of the applicable agreement, or as provided, when on a time and materials basis.
In some cases, our customers may choose to have the Company provide turnkey services for them rather than simply purchasing the cogeneration and/or chiller units. Turnkey services include site engineering, construction, electrical, plumbing and installation services. In this case, the Company accounts for revenue, or turnkey revenue, and costs using the percentage-of-completion method of accounting and is included in service revenue in the consolidated statement of operations. Under the percentage-of-completion method of accounting, revenues are recognized by applying percentages of completion to the total estimated revenues for the respective contracts. Costs are recognized as incurred. The percentages of completion are determined by relating the actual cost of work performed to date to the current estimated total cost at completion of the respective contracts. When the estimate on a contract indicates a loss, the Company’s policy is to record the entire expected loss, regardless of the percentage of completion. The excess of contract costs and profit recognized to date on the percentage-of-completion accounting method in excess of billings is recorded as unbilled revenue. Billings in excess of related costs and estimated earnings are recorded as deferred revenue.
Presentation of Sales Taxes
The Company reports revenues net of any revenue-based taxes assessed by governmental authorities that are imposed on and concurrent with specific revenue-producing transactions.
Shipping and Handling Costs
The Company classifies freight billed to customers as sales revenue and the related freight costs as cost of sales.
Advertising Costs
The Company expenses the costs of advertising as incurred. For the years ended December 31, 2012, 2011, and 2010, advertising expense was approximately $187,500, $86,700, and $14,900, respectively.
Research and Development Costs
Internal research and development expenditures are expensed as incurred. Proceeds from certain grants and contracts with governmental agencies and their contractors to conduct research and development for new CHP technologies or to improve or enhance existing technology is recorded as an offset to the related research and development expenses. These grants and contracts are paid on a cost reimbursement basis provided in the agreed upon budget. Amounts received totaled $126,500, $239,000, and $917,000 in fiscal years 2012, 2011, and 2010, respectively, which offset the Company’s total R&D expenditures for each of the respective years.
Stock-Based Compensation
Stock-based compensation cost is measured at the grant date, based on the estimated fair value of the award, and is recognized as an expense in the statements of operations over the requisite service period.
Pursuant to ASC 505-50, Equity Based Payments to Non-Employees, the fair value of restricted common stock and stock options issued to non-employees is revalued at each reporting period until the ultimate measurement date, as defined by ASC 505-50. The Company records the value of the instruments at the time services are provided and the instruments vest. Accordingly, the ultimate expense is not fixed until such instruments are fully vested.
The determination of the fair value of share-based payment awards is affected by the Company’s stock price. Since the Company was not publicly traded when the awards were issued, the Company considered the sales price of the common stock in private placements to unrelated third parties as a measure of the fair value of its common stock.
| F-11 |
The Company utilizes an estimated forfeiture rate when calculating the expense for the period. Forfeitures are estimated at the time of grant and revised, if necessary, in subsequent periods if actual forfeitures differ from those estimates. Stock-based compensation expense recognized is based on awards that are ultimately expected to vest. The Company evaluates the assumptions used to value awards regularly and if factors change and different assumptions are employed, stock-based compensation expense may differ significantly from what has been recorded in the past. If there are any modifications or cancellations of the underlying unvested securities, the Company may be required to accelerate, increase, or cancel any remaining unearned stock-based compensation expense.
Common Stock Subscriptions
Outstanding proceeds for common stock transaction appear as common stock subscriptions in the accompanying consolidated balance sheets and consolidated statements of changes in stockholders’ equity until received.
Reclassifications
Certain prior period balances have been reclassified to conform with current period presentation.
Note 3 – Loss per common share
Basic and diluted earnings per share for the years ended December 31, 2012, 2011, and 2010, respectively, were as follows:
| 2012 | 2011 | 2010 | ||||||||||
| Loss available to stockholders | $ | (1,636,957 | ) | $ | (1,574,501 | ) | $ | (355,308 | ) | |||
| Weighted average shares outstanding - Basic and diluted | 13,135,072 | 12,052,914 | 11,470,658 | |||||||||
| Basic and diluted loss per share | $ | (0.12 | ) | $ | (0.13 | ) | $ | (0.03 | ) | |||
| Anti-dilutive shares underlying stock options outstanding | 1,096,500 | 1,095,250 | 620,000 | |||||||||
| Anti-dilutive shares underlying convertible debentures | 75,806 | 159,140 | 159,140 | |||||||||
Note 4 – Inventory
Inventories at December 31, 2012 and 2011 consisted of the following:
| 2012 | 2011 | |||||||
| Gross raw materials | $ | 3,574,620 | $ | 2,701,496 | ||||
| Less - reserves | (332,000 | ) | (358,800 | ) | ||||
| Net raw materials | 3,242,620 | 2,342,696 | ||||||
| Work-in-process | 114,002 | 119,640 | ||||||
| Finished goods | — | 106,650 | ||||||
| $ | 3,356,622 | $ | 2,568,986 | |||||
| F-12 |
Note 5 – Intangible assets
The Company capitalized $17,314 and $22,036 of product certification costs during the years ended December 31, 2012 and 2011, respectively. Also included in intangible assets are the costs incurred by the Company to acquire certain patents. These patents, once in service, will be amortized on a straight-line basis over the estimated economic life of the associated products, which range from approximately 7 to 10 years. The Company capitalized $146,981 and $16,712 of patent-related costs during the years ended December 31, 2012 and 2011, respectively. Intangible assets at December 31, 2012 and 2011 consist of the following:
| Product Certifications | Patents | Total | ||||||||||
| Balance at December 31, 2012 | ||||||||||||
| Intangible assets | $ | 235,482 | $ | 214,883 | $ | 450,365 | ||||||
| Less - accumulated amortization | (57,798 | ) | (20,547 | ) | (78,345 | ) | ||||||
| $ | 177,684 | $ | 194,336 | $ | 372,020 | |||||||
| Balance at December 31, 2011 | ||||||||||||
| Intangible assets | $ | 218,168 | $ | 67,902 | $ | 286,070 | ||||||
| Less - accumulated amortization | (38,254 | ) | (6,195 | ) | (44,449 | ) | ||||||
| $ | 179,914 | $ | 61,707 | $ | 241,621 | |||||||
Amortization expense was $33,896, $23,992, and $11,309 during the years ended December 31, 2012, 2011, and 2010, respectively. Estimated amortization expense at December 31 for each of the five succeeding years is as follows:
| 2013 | $ | 39,879 | ||
| 2014 | 54,246 | |||
| 2015 | 54,246 | |||
| 2016 | 54,246 | |||
| 2017 | 54,246 | |||
| Thereafter | 115,157 | |||
| $ | 372,020 |
Note 6 – Property and equipment
Property and equipment at December 31, 2012 and 2011 consisted of the following:
| Estimated Useful Life (in Years) | 2012 | 2011 | ||||||||
| Machinery and equipment | 5 - 7 years | $ | 478,290 | $ | 355,985 | |||||
| Furniture and fixtures | 5 years | 54,058 | 48,157 | |||||||
| Computer software | 3 - 5 years | 56,935 | 46,355 | |||||||
| Leasehold improvements | * | 326,366 | 245,441 | |||||||
| 915,649 | 695,938 | |||||||||
| Less - accumulated depreciation and amortization | (480,037 | ) | (310,159 | ) | ||||||
| Net property, plant and equipment | $ | 435,612 | $ | 385,779 | ||||||
* Lesser of estimated useful life of asset or lease term
| F-13 |
Depreciation and amortization expense on property and equipment for the years ended December 31, 2012, 2011, and 2010 was $169,878, $134,295, and $77,346, respectively.
Note 7 – Demand notes payable and convertible debentures – related party
Demand notes payable to related parties consist of various demand notes outstanding to stockholders totaling $1,337,500 and $1,037,500 at December 31, 2012 and 2011, respectively. The primary lender is John N. Hatsopoulos, the company’s Chief Executive Officer, who held $1.3 million and $1 million of the demand notes as of December 31, 2012 and 2011, respectively. The demand notes accrue interest annually at rates ranging from 5% to 6%. Unpaid principal and interest on the demand notes is due upon demand by the lender.
On September 24, 2001, the Company entered into subscription agreements with three investors for the sale of convertible debentures in the aggregate principal amount of $330,000. The primary investors were George N. Hatsopoulos, who subscribed for debentures having an initial principal amount of $200,000; the John N. Hatsopoulos 1989 Family Trust for the benefit of Nia Marie Hatsopoulos, or the Nia Hatsopoulos Trust, which subscribed for debentures having an initial principal amount of $50,000; and the John N. Hatsopoulos 1989 Family Trust for the benefit of Alexander John Hatsopoulos, or the Alexander Hatsopoulos Trust, which subscribed for debentures having an initial principal amount of $50,000. Nia Hatsopoulos and Alexander Hatsopoulos are the adult children of John N. Hatsopoulos’s adult children. The debentures accrue interest at a rate of 6% per annum and are due six years from issuance date. The debentures are convertible, at the option of the holder, into a number of shares of common stock as determined by dividing the original principal amount plus accrued and unpaid interest by a conversion price of $1.20. On September 24, 2011, holders of debentures representing a majority of the then-outstanding principal amount of the Company’s convertible debentures, agreed to amend the terms of the debentures to extend the due date from September 24, 2011 to September 24, 2013.
On May 11, 2009, the Company sold 1,400,000 shares in Ilios at $0.50 per share to George N. Hatsopoulos and John N. Hatsopoulos in exchange for the extinguishment of $427,432 in demand notes payable, $109,033 in convertible debentures and $163,535 in accrued interest. The difference between the Company’s purchase price of the Ilios shares and the amount of debt forgiveness was recorded as additional paid-in capital.
On September 30, 2012, certain holders of the debentures converted the principal amount of $100,000 and accrued interest in the amount of $6,100 into 85,240 shares of the Company’s common stock. At December 31, 2012, 2011, and 2010, there were 75,806, 159,140, and 159,140 shares of common stock issuable upon conversion of the Company’s outstanding convertible debentures. At December 31, 2012, 2011, and 2010, the principal amount of the Company’s convertible debentures was $90,967, $190,967, and $190,967, respectively, which is due on September 24, 2013.
On March 25, 2013, the Company entered into the Credit Agreement with John N. Hatsopoulos, our Chief Executive Officer. Under the terms of the Credit Agreement, Mr. Hatsopoulos has agreed to lend the Company up to an aggregate of $1 million, from time to time, at the written request of the Company. Any amounts borrowed by the Company pursuant to the Credit Agreement will bear interest at the Bank Prime Rate as quoted from time to time in the Wall Street Journal plus 1.5% per year. Interest is due and payable quarterly in arrears. Repayment of the principal amount borrowed pursuant to the Credit Agreement will be due on March 31, 2014, or the Maturity Date. Prepayment of any amounts due under the Credit Agreement may be made at any time without penalty. The Credit Agreement terminates on the Maturity Date. The Company has not yet borrowed any amounts pursuant to the Credit Agreement.
Note 8 – Commitments and contingencies
Operating Lease Obligations
The Company leases office space and warehouse facilities under various lease agreements that expire through March 2024. The Company subleases portions of its corporate offices and manufacturing facility to sub-tenants under annual sublease agreements, on a calendar year basis (see Note 13 – Related party transactions). Total rent expense for the years ended December 31, 2012, 2011, and 2010 amounted to $595,851, $579,836, and $535,092, offset by $173,898, $185,596, and $196,466 in rent paid by sub-lessees for a net amount of $421,953, $394,240, and $338,626.
The Company leased one service vehicle under a lease agreement that expired in January 2012. Vehicle rent expense amounted to $387, $4,639, and $4,639 during the years ended December 31, 2012, 2011, and 2010, respectively.
| F-14 |
Future minimum lease payments under all non-cancelable operating leases as of December 31, 2012, consist of the following:
| Years Ending December 31, | Amount | |||
| 2013 | $ | 584,442 | ||
| 2014 | 557,993 | |||
| 2015 | 526,690 | |||
| 2016 | 485,040 | |||
| 2017 | 491,920 | |||
| 2018 and thereafter | 3,241,340 | |||
| Total | $ | 5,887,425 | ||
On October 26, 2011, the Company entered into an agreement with Digital Energy Corp., a customer of the Company, whereby the Company provided a letter of credit in the amount of $180,000, for the benefit of Digital Energy Corp., to satisfy a requirement of the New York Independent System Operator, Inc. A certificate of deposit for $180,000 secures the letter of credit. In exchange for providing this letter of credit, Digital Energy Corp. provided a promissory note to the Company for $180,000, with interest at 6%, payable in monthly installments of interest only. Principal would only be owed if the letter of credit was drawn upon and would become due and payable on the first anniversary date of the note. On February 19, 2013, this letter of credit and certificate of deposit restriction was released.
Legal Proceedings
From time to time the Company may be involved in various claims and other legal proceedings that arise in the normal course of business. Such matters are subject to many uncertainties and outcomes that are not predictable. Based on the information available to the Company and after discussions with legal counsel, the Company does not believe any such proceedings will have a material adverse effect on the business, results of operations, financial position, or liquidity.
Note 9 – Product warranty
The Company reserves an estimate of its exposure to warranty claims based on both current and historical product sales data and warranty costs incurred. The majority of the Company’s products carry a one-year warranty. The Company assesses the adequacy of its recorded warranty liability annually and adjusts the amount as necessary. The warranty liability is included in accrued expenses on the accompanying consolidated balance sheets.
Changes in the Company’s warranty reserve were as follows:
| Warranty reserve, December 31, 2010 | $ | 82,600 | ||
| Warranty provision for units sold | 42,847 | |||
| Costs of warranty incurred | (72,447 | ) | ||
| Warranty reserve, December 31, 2010 | $ | 53,000 | ||
| Warranty provision for units sold | 76,637 | |||
| Costs of warranty incurred | (72,637 | ) | ||
| Warranty reserve, December 31, 2011 | 57,000 | |||
| Warranty provision for units sold | 160,684 | |||
| Costs of warranty incurred | (127,484 | ) | ||
| Warranty reserve, December 31, 2012 | $ | 90,200 |
| F-15 |
Note 10 – Stockholders’ equity
Common Stock
In 2012, 2011, and 2010 the Company raised additional funds through private placements of common stock to a limited number of accredited investors. In connection with the 2012 private placements the Company sold an aggregate of 212,500 shares of common stock at a purchase price of $3.20 per share, resulting in net cash proceeds of $680,000. In connection with the 2011 private placements the Company sold an aggregate of 1,179,230 shares of common stock at a purchase price ranging from $2.60 per share, for the shares sold during the first half of the year, to $3.20 per share, for the shares sold during the last half of the year, resulting in net cash proceeds of $3,610,993. In connection with the 2010 private placements the Company sold an aggregate of 465,866 shares of common stock at a purchase price of $2.60 per share, resulting in net cash proceeds of $1,211,249.
On June 13, 2011, the Southern California Gas Company entered into an agreement with the Company to invest $500,000 in the Company’s common stock. The agreement included certain stockholder rights and a redemption right whereby the investor may redeem the shares for cash until the earlier of the initiation of a public offering of the Company by filing a registration statement with the SEC or five years. A letter of credit, secured by a certificate of deposit, for the amount of the investment has been put in place to satisfy the contingency of the redemption right. The certificate of deposit is classified as a short-term investment in the accompanying balance sheet as of December 31, 2011. The common stock was classified outside of permanent equity because of the redemption right, as initially recorded. The filing of our registration statement on Form S-1 on December 22, 2011, resulted in the expiration of the rights and preferences of the Southern California Gas Company; therefore we do not have any rights or preferences outstanding. As a result, as of December 31, 2011, we have reclassified this investment from redeemable common stock, to permanent equity in the accompanying consolidated balance sheets.
The holders of common stock have the right to vote their interest on a per share basis. At December 31, 2012, 2011 and 2010 there were 13,611,974, 13,498,471, and 12,232,762 shares of common stock outstanding, respectively.
Receivable from Shareholder
On June 3, 2010, the Company issued a promissory note to an investor in the amount of $345,000. The note was due in full on June 3, 2012, and bears interest at the Bank Prime Rate plus three percent. Accrued interest is paid on a quarterly basis. The note was secured by 287,500 shares of Tecogen common stock. The note was repaid with cash of $105,000 and return of 100,000 shares of common stock at a value of $2.40 per share, which were retired by the Company on December 7, 2012.
Warrants
During the year ended December 31, 2010, investors exercised 118,750 warrants, providing gross proceeds to the Company of $142,500. During 2010, 6,250 warrants expired. As of December 31, 2012, 2011, and 2010, there were no warrants outstanding.
Stock-Based Compensation
In 2006, the Company adopted the 2006 Stock Option and Incentive Plan (the “Plan”), under which the Board of Directors may grant incentive or non-qualified stock options and stock grants to key employees, directors, advisors, and consultants of the Company. The Plan was amended at various dates by the board to increase the reserved shares of common stock issuable under the Plan from 1 million to 1,838,750 as of December 31, 2012 (the “Amended Plan”).
Stock options vest based upon the terms within the individual option grants, with an acceleration of the unvested portion of such options upon a change in control event, as defined in the Amended Plan. The options are not transferable except by will or domestic relations order. The option price per share under the Amended Plan cannot be less than the fair market value of the underlying shares on the date of the grant. The number of shares remaining available for future issuance under the Amended Plan as of December 31, 2012, 2011, and 2010, was 135,183, 161,433, and 721,683, respectively.
In 2010, the Company granted nonqualified options to purchase an aggregate of 25,000 shares of common stock at $2.60 per share. These options have a vesting schedule of four years and expire in ten years. The fair value of the options issued in 2010 was $24,446. The weighted-average grant date fair value of stock options granted during 2010 was $0.96 per option.
| F-16 |
In 2011, the company granted nonqualified options to purchase an aggregate of 480,250 shares of common stock at $2.60 per share and 31,250 shares of common stock at $2.80 per share. These options have a vesting schedule of four years and expire in ten years. The fair value of the options issued in 2011 was $508,586. The weighted-average grant date fair value of stock options granted during 2011 was $1.00 and $1.12 per option.
In 2012, the company granted nonqualified options to purchase an aggregate of 17,500 shares of common stock at $3.20 per share. These options have a vesting schedule of four years and expire in ten years. The fair value of the options issued in 2012 was $20,223. The weighted-average grant date fair value of stock options granted during 2012 was $1.16 per option. Stock option activity for the year ended December 31, 2012, 2011, and 2010, was as follows:
| Common Stock Options | Number of Options | Exercise Price Per Share | Weighted Average Exercise Price | Weighted Average Remaining Life | Aggregate Intrinsic Value | |||||||||||||
| Outstanding, December 31, 2009 | 595,000 | $0.12-$2.00 | $ | 1.28 | 4.27 years | $ | 793,500 | |||||||||||
| Granted | 25,000 | $ | 2.60 | $ | 2.60 | |||||||||||||
| Exercised | ||||||||||||||||||
| Canceled and forfeited | ||||||||||||||||||
| Repurchased | ||||||||||||||||||
| Expired | ||||||||||||||||||
| Outstanding, December 31, 2010 | 620,000 | $0.12-$2.60 | $ | 1.20 | 3.30 years | $ | 793,500 | |||||||||||
| Exercisable, December 31, 2010 | 307,500 | $ | 1.12 | $ | 451,000 | |||||||||||||
| Vested and expected to vest, December 31, 2010 | 620,000 | $ | 1.20 | $ | 793,500 | |||||||||||||
| Outstanding, December 31, 2010 | 620,000 | $0.12-$2.60 | $ | 1.28 | 3.30 years | $ | 793,500 | |||||||||||
| Granted | 511,500 | $2.60-$2.80 | $ | 2.60 | ||||||||||||||
| Exercised | — | — | — | |||||||||||||||
| Canceled and forfeited | — | — | — | |||||||||||||||
| Repurchased | (12,500 | ) | $ | 1.00 | $ | 1.00 | ||||||||||||
| Expired | (23,750 | ) | $1.20-$2.60 | $ | 1.48 | |||||||||||||
| Outstanding, December 31, 2011 | 1,095,250 | $0.12-$2.80 | $ | 1.92 | 5.53 years | $ | 1,387,150 | |||||||||||
| Exercisable, December 31, 2011 | 418,438 | $ | 1.24 | $ | 815,125 | |||||||||||||
| Vested and expected to vest, December 31, 2011 | 1,025,250 | $ | 1.92 | $ | 1,387,150 | |||||||||||||
| Outstanding, December 31, 2011 | 1,095,250 | $0.12-$2.80 | $ | 1.92 | 5.53 years | $ | 1,387,150 | |||||||||||
| Granted | 17,500 | $ | 3.20 | $ | 3.20 | |||||||||||||
| Exercised | — | — | — | |||||||||||||||
| Canceled and forfeited | (15,938 | ) | $1.20-$2.60 | $ | 1.28 | |||||||||||||
| Expired | (313 | ) | $ | 2.60 | $ | 2.60 | ||||||||||||
| Outstanding, December 31, 2012 | 1,096,500 | $0.12-$3.20 | $ | 1.96 | 4.66 years | $ | 1,356,400 | |||||||||||
| Exercisable, December 31, 2012 | 662,563 | $ | 1.56 | $ | 1,096,225 | |||||||||||||
| Vested and expected to vest, December 31, 2012 | 1,096,500 | $ | 1.96 | $ | 1,356,400 | |||||||||||||
| F-17 |
The Company does not expect any forfeitures and the table above represents all stock options expected to vest. The Company uses the Black-Scholes option pricing model to determine the fair value of stock options granted. Use of a valuation model requires management to make certain assumptions with respect to selected model inputs. Expected volatility was calculated based on the average volatility of four comparable publicly traded companies. The average expected life was estimated using the simplified method to determine the expected life based on the vesting period and contractual terms, since it does not have the necessary historical exercise data to determine an expected life for stock options. The Company uses a single weighted-average expected life to value option awards and recognizes compensation on a straight-line basis over the requisite service period for each separately vesting portion of the awards. The risk-free interest rate is based on U.S. Treasury zero-coupon issues with a remaining term that approximates the expected life assumed at the date of grant.
In 2011, the Company purchased 12,500 options from a consultant at $1.00 per share. These options were due to expire on December 10, 2011 and would have allowed the holder to purchase shares of common stock of Tecogen for $1.00. The Company had no obligation to repurchase these shares. At December 10, 2011, the fair value of Tecogen’s common stock was $3.20. Since these options were purchased at below their estimated fair value, the price paid by Tecogen of $12,500 was charged to stockholders’ equity.
The weighted average assumptions used in the Black-Scholes option pricing model for options granted in 2012, 2011, and 2010 are as follows:
| 2012 | 2011 | 2010 | ||||||||||
| Stock option awards: | ||||||||||||
| Expected life | 6.25 years | 6.25 years | 5 years | |||||||||
| Risk-free interest rate | 0.70% | 2.46% | 2.46% | |||||||||
| Expected volatility | 35.9%-36.0% | 33.8%-35.5% | 33.3% | |||||||||
In 2011, the Company made restricted stock grants to certain employees by permitting them to purchase an aggregate of 50,000 shares of common stock at a price of $0.001 per share. These shares vest over four years beginning six months after an initial public offering. The related compensation expense is recorded based on initial public offering date.
| F-18 |
Restricted stock activity for the years ended December 31, 2012 and 2011 was as follows:
| Number of Restricted Stock | Weighted Average Grant Date Fair Value | |||||||
| Unvested, December 31, 2009 | 414,106 | $ | 1.24 | |||||
| Granted | 19,211 | 2.60 | ||||||
| Vested | — | — | ||||||
| Forfeited | — | — | ||||||
| Unvested, December 31, 2010 | 433,317 | $ | 1.28 | |||||
| Unvested, December 31, 2010 | 433,317 | $ | 1.28 | |||||
| Granted | 50,000 | 2.60 | ||||||
| Vested | — | — | ||||||
| Forfeited | — | — | ||||||
| Unvested, December 31, 2011 | 483,317 | $ | 1.44 | |||||
| Unvested, December 31, 2011 | 483,317 | $ | 1.44 | |||||
| Granted | — | — | ||||||
| Vested | — | — | ||||||
| Forfeited | (84,247 | ) | 1.36 | |||||
| Unvested, December 31, 2012 | 399,070 | $ | 1.44 | |||||
During the years ended December 31, 2012, 2011, and 2010, the Company recognized stock-based compensation of $136,184, $396,724, and $185,901, respectively, related to the issuance of stock options and restricted stock. No tax benefit was recognized related to the stock-based compensation recorded during the years. At December 31, 2012 and 2011 there were 399,070, 483,317, and 433,317 unvested shares of restricted stock outstanding, respectively. At December 31, 2012, 2011, and 2010, the total compensation cost related to unvested restricted stock awards and stock option awards not yet recognized is $183,230, $537,540, and $141,859, respectively. This amount will be recognized over a weighted average period of 1.56 years.
Stock Based Compensation - Ilios
In 2009, Ilios adopted the 2009 Stock Incentive Plan (the “2009 Plan”) under which the Board of Directors may grant incentive or non-qualified stock options and stock grants to key employees, directors, advisors and consultants of the company. The maximum number of shares allowable for issuance under the Plan is 2 million shares of common stock.
Stock options vest based upon the terms within the individual option grants, with an acceleration of the unvested portion of such options upon a change in control event, as defined in the Plan. The options are not transferable except by will or domestic relations order. The option price per share under the Plan cannot be less than the fair market value of the underlying shares on the date of the grant.
In 2011, Ilios granted nonqualified options to purchase an aggregate of 225,000 shares of common stock to certain employees at $0.50 per share. These options have a vesting schedule of four years and expire in ten years. The total fair value of the options issued in 2011 was $42,065. The weighted-average grant date fair value of stock options granted during 2011 was $0.19.
In 2012, Ilios granted nonqualified options to purchase 50,000 shares of common stock to a director at $0.50 per share. These options have a vesting schedule of four years and expire in ten years. The total fair value of the options issued in 2012 was $9,750. The weighted-average grant date fair value of stock options granted during 2012 was $0.20.
| F-19 |
During the years ended December 31, 2012, 2011, and 2010, Ilios recognized stock-based compensation of $59,361, $47,648, and $11,135, related to the issuance of stock options and restricted stock, respectively. No tax benefit was recognized related to the stock-based compensation recorded during the year. At December 31, 2012, 2011, and 2010, there were 510,000, 560,000, and 360,000 unvested shares of restricted stock outstanding, respectively. At December 31, 2012, 2011, and 2010, the total compensation cost related to unvested restricted stock awards and stock option awards not yet recognized is $67,493, $122,056, and $27,839, respectively. This amount will be recognized over the weighted average period of 1.67 years.
Stock option activity relating to Ilios for the year ended December 31, 2012, 2011, and 2010 was as follows:
| Common Stock Options | Number of Options | Exercise Price Per Share | Weighted Average Exercise Price | Weighted Average Remaining Life | Aggregate Intrinsic Value | |||||||||||||
| Outstanding, December 31, 2009 | 300,000 | $ | 0.10 | $ | 0.10 | 9.34 years | $ | 120,000 | ||||||||||
| Granted | — | — | — | |||||||||||||||
| Exercised | — | — | — | |||||||||||||||
| Canceled and forfeited | — | — | — | |||||||||||||||
| Expired | — | — | — | |||||||||||||||
| Outstanding, December 31, 2010 | 300,000 | $ | 0.10 | $ | 0.10 | 8.34 years | $ | 120,000 | ||||||||||
| Exercisable, December 31, 2010 | — | $ | — | $ | — | |||||||||||||
| Vested and expected to vest, December 31, 2010 | 300,000 | $ | 0.10 | $ | 120,000 | |||||||||||||
| Outstanding, December 31, 2010 | 300,000 | $ | 0.10 | $ | 0.10 | 9.34 years | $ | 120,000 | ||||||||||
| Granted | 225,000 | 0.50 | 0.50 | |||||||||||||||
| Exercised | — | — | — | |||||||||||||||
| Canceled and forfeited | — | — | — | |||||||||||||||
| Expired | — | — | — | |||||||||||||||
| Outstanding, December 31, 2011 | 525,000 | $0.10-$0.50 | $ | 0.27 | 8.23 years | $ | 120,000 | |||||||||||
| Exercisable, December 31, 2011 | — | $ | — | $ | — | |||||||||||||
| Vested and expected to vest, December 31, 2011 | 525,000 | $ | 0.27 | $ | 120,000 | |||||||||||||
| Outstanding, December 31, 2011 | 525,000 | $0.10-$0.50 | $ | 0.27 | 8.23 years | $ | 120,000 | |||||||||||
| Granted | 50,000 | 0.50 | 0.50 | |||||||||||||||
| Exercised | — | — | — | |||||||||||||||
| Canceled and forfeited | — | — | — | |||||||||||||||
| Expired | — | — | — | |||||||||||||||
| Outstanding, December 31, 2012 | 575,000 | $0.10-$0.50 | $ | 0.29 | 7.44 years | $ | 120,000 | |||||||||||
| Exercisable, December 31, 2012 | — | $ | 0.50 | $ | — | |||||||||||||
| Vested and expected to vest, December 31, 2012 | 575,000 | $ | 0.29 | $ | 120,000 | |||||||||||||
Ilios does not expect any forfeitures and the table above represents all stock options expected to vest. Ilios uses the Black-Scholes option pricing model to determine the fair value of stock options granted. Expected volatility was calculated based on the average volatility of comparable publicly traded companies, the expected life of the options was calculated using the simplified method, and the risk-free interest rate is based on U.S. Treasury zero-coupon issues with a remaining term which approximates the expected life assumed at the date of grant. The Company uses a single weighted-average expected life to value option awards and recognizes compensation on a straight-line basis over the requisite service period for each separately vesting portion of the awards.
| F-20 |
For the Ilios awards, the weighted average assumptions used in the Black-Scholes option pricing model for options granted in 2012 and 2011 are as follows:
| 2012 | 2011 | |||||||
| Stock option awards: | ||||||||
| Expected life | 6.25 years | 6.25 years | ||||||
| Risk-free interest rate | 2.03 | % | 2.03 | % | ||||
| Expected volatility | 36.1 | % | 34.2 | % | ||||
In 2011, Ilios made restricted stock grants to a certain Ilios employee by permitting him to purchase an aggregate of 200,000 shares of common stock at a price of $0.001 per share. These shares vest 25% 180 days after an initial public offering of Ilios and 25% for 3 years thereafter. The related compensation expense is being recorded based on an anticipated initial public offering date.
Restricted stock activity for the Ilios awards, for the years ended December 31, 2012, 2011, and 2010 was as follows:
| Number of Restricted Stock | Weighted Average Grant Date Fair Value | |||||||
| Unvested, December 31, 2009 | 360,000 | $ | 0.10 | |||||
| Granted | — | — | ||||||
| Vested | — | — | ||||||
| Forfeited | — | — | ||||||
| Unvested, December 31, 2010 | 360,000 | $ | 0.10 | |||||
| Unvested, December 31, 2010 | 360,000 | $ | 0.10 | |||||
| Granted | 200,000 | 0.50 | ||||||
| Vested | — | — | ||||||
| Forfeited | — | — | ||||||
| Unvested, December 31, 2011 | 560,000 | $ | 0.24 | |||||
| Unvested, December 31, 2011 | 560,000 | $ | 0.24 | |||||
| Granted | — | — | ||||||
| Vested | — | — | ||||||
| Forfeited | (50,000 | ) | 0.10 | |||||
| Unvested, December 31, 2012 | 510,000 | $ | 0.26 | |||||
Note 11 – Noncontrolling interests
As of December 31, 2010, Tecogen owned 63.0% of Ilios. During the year ended December 31, 2011, Tecogen purchased 1.5 million shares of Ilios common stock at $0.50 per share for an aggregate amount of $750,000, which increased Tecogen’s ownership interest to 67.4%.
During the year ended December 31, 2012, Ilios sold 1 million shares of common stock to an accredited investor at $0.50 per share for an aggregate amount of $500,000. Also during the year ended December 31, 2012, Tecogen purchased 1 million shares of Ilios common stock at $0.50 per share for an aggregate amount of $500,000. The net result decreased Tecogen’s ownership interest to 65.0%. The table below presents the changes in equity resulting from net loss attributable to Tecogen and transfers to or from noncontrolling interests for the years ended December 31, 2012, 2011, and 2010.
| F-21 |
Net loss attributable to Tecogen Inc. and
Transfers (to) from the Noncontrolling Interest
Years ended December 31,
| 2012 | 2011 | 2010 | ||||||||||
| Net loss attributable to Tecogen Inc. | $ | (1,636,957 | ) | $ | (1,574,501 | ) | $ | (355,308 | ) | |||
| Transfers (to) from the noncontrolling interest | ||||||||||||
| Decrease in Tecogen’s paid-in capital for purchase of 1,000,000 and 1,500,000 Ilios common shares in 2012 and 2011, respectively | (174,958 | ) | (261,174 | ) | ||||||||
| Increase in Tecogen’s paid-in capital upon the sale of 1,000,000 Ilios common shares | 289,606 | |||||||||||
| Net transfers to noncontrolling interest | 114,648 | (261,174 | ) | – | ||||||||
| Change from net loss attributable to Tecogen Inc. and transfers to noncontrolling interest | $ | (1,522,309 | ) | $ | (1,835,675 | ) | $ | (355,308 | ) | |||
Note 12 – Retirement plans
The Company has a defined contribution retirement plan (the “Plan”), which qualifies under Section 401(k) of the Internal Revenue Code (IRC). Under the Plan, employees meeting certain requirements may elect to contribute a percentage of their salary up to the maximum allowed by the IRC. The Company matches a variable amount based on participant contributions up to a maximum of 4.5% of each participant’s salary. The Company contributed approximately $116,850, $115,120, and $111,100 to the Plan for the years ended December 31, 2012, 2011, and 2010.
Note 13 – Related party transactions
The Company has five affiliated companies, namely American DG Energy, EuroSite Power, GlenRose Instruments, Pharos, and Levitronix. These companies are affiliates because several of the major stockholders of those companies, have a significant ownership position in the Company. American DG Energy, EuroSite Power, GlenRose Instruments, Pharos, and Levitronix do not own any shares of the Company, and the Company does not own any shares of American DG Energy, EuroSite Power, GlenRose Instruments, Pharos, or Levitronix. The businesses of GlenRose Instruments, Pharos, and Levitronix are not related to the business of the Company.
American DG Energy, EuroSite Power, GlenRose Instruments, Pharos, and Levitronix are affiliated companies by virtue of common ownership. The common stockholders include:
| • | John N. Hatsopoulos, the Company’s Chief Executive Officer, who is also: (a) the Chief Executive Officer and a director of American DG Energy and holds 10.8% of that company’s common stock; (b) the Chairman of EuroSite Power; (c) a director of Ilios and holds 7% of that company’s common stock; and (d) the Chairman of GlenRose Instruments and holds 15.7% of that company’s common stock. |
| • | Dr. George N. Hatsopoulos, who is John N. Hatsopoulos’ brother, and is also: (a) a director of American DG Energy and holds 14.3% of that company’s common stock; (b) an investor in Ilios and holds 3.1% of that company’s common stock; (c) an investor in GlenRose Instruments and holds 15.7% of that company’s common stock; (d) an investor in Pharos and holds 24.4% of that company’s common stock; and (e) an investor in Levitronix and holds 21.4% of that company’s common stock. |
Additionally, the following related persons had or may have a direct or indirect material interest in our transactions with our affiliated companies:
| • | Barry J. Sanders, who is: (a) the President and Chief Operating Officer of American DG Energy; (b) the Chief Executive Officer and a director of EuroSite Power; and (c) the Chairman of Ilios. |
| • | Anthony S. Loumidis, the Company’s former Vice President and Treasurer, who is: (a) the Chief Financial Officer, Secretary, and Treasurer of American DG Energy; (b) the Chief Financial Officer, Secretary, and Treasurer of EuroSite Power; (c) the Chief Financial Officer, Secretary, and Treasurer of GlenRose Instruments; and (d) the Treasurer of Ilios. |
| F-22 |
American DG Energy has sales representation rights to the Company’s products and services in New England. Revenue from sales of cogeneration and chiller systems, parts, and service to American DG Energy during the years ended December 31, 2012, 2011, and 2010, amounted to $3,795,666, $713,267, and $1,658,471, respectively.
On October 20, 2009, American DG Energy, in the ordinary course of its business, signed a Sales Representative Agreement with Ilios to promote, sell, and service the Ilios high-efficiency heating products, such as the high efficiency water heater, in the marketing territory of the New England states, including Connecticut, Rhode Island, Massachusetts, New Hampshire, Vermont, and Maine. The marketing territory also includes all of the nations in the European Union. The initial term of this Agreement is for five years, after which it may be renewed for successive one-year terms upon mutual written agreement. American DG Energy has not yet sold any products under this agreement and, therefore, no amounts have been required to be paid.
On September 24, 2001, the Company entered into subscription agreements with investors for the sale of convertible debentures. The primary investors were George N. Hatsopoulos, who subscribed for debentures having an initial principal amount of $200,000; the Nia Hatsopoulos Trust, which subscribed for debentures having an initial principal amount of $50,000; and the Alexander Hatsopoulos Trust, which subscribed for debentures having an initial principal amount of $50,000. Nia Hatsopoulos and Alexander Hatsopoulos are John N. Hatsopoulos’s adult children. John N. Hatsopoulos disclaims beneficial ownership of any shares held by these trusts. The debentures accrue interest at a rate of 6% per annum and were due on September 24, 2007. The debentures are convertible, at the option of the holder, into shares of common stock at a conversion price of $1.20 per share.
On September 24, 2007, George N. Hatsopoulos, the Nia Hatsopoulos Trust and the Alexander Hatsopoulos Trust, holding debentures representing a majority of the then-outstanding principal amount of the debentures, agreed to extend the debenture term to September 24, 2011.
On May 11, 2009, George N. Hatsopoulos, the Nia Hatsopoulos Trust and the Alexander Hatsopoulos Trust converted a portion of the principal amount under the debentures held by each of them into shares of common stock of Ilios, the Company’s then newly-formed subsidiary, at a conversion price of $0.50 per share. Specifically, George N. Hatsopoulos converted principal in the amount of $109,033, together with accrued interest in the amount of $90,967, into 400,000 shares of Ilios common stock; the Nia Hatsopoulos Trust converted principal in the amount of $213,716, together with interest in the amount of $36,284, into 500,000 shares of Ilios common stock; and Nia Hatsopoulos Trust converted principal in the amount of $213,716, together with interest in the amount of $36,284, into 500,000 shares of Ilios common stock. The difference between the Company’s purchase price of the Ilios shares and the amount of debt forgiveness was recorded as additional paid-in capital.
On September 30, 2009, Joseph J. Ritchie elected to convert the outstanding principal amount under the debenture held by him, $30,000, together with accrued interest of $14,433, into 37,028 shares of the Company’s common stock at a conversion price of $1.20 per share.
On September 24, 2011, George N. Hatsopoulos, the Nia Hatsopoulos Trust and the Alexander Hatsopoulos Trust, holding debentures representing a majority of the then-outstanding principal amount of the debentures, agreed to extend the term of the debentures to September 24, 2013 and requested that accrued interest in the aggregate amount of approximately $72,960 be converted into the Company’s common stock at $2.00 per share (which was the average price of the Company’s stock between September 24, 2001 and September 24, 2011). In connection with this, the Company issued 6,474 shares of common stock to George N. Hatsopoulos, 15,003 shares of common stock to the Nia Hatsopoulos Trust and 15,003, shares of common stock to the Alexander Hatsopoulos Trust.
On September 30, 2012, the remaining principal amount under the debentures held by the Nia Hatsopoulos Trust and the Alexander Hatsopoulos Trust, including the applicable accrued interest, was converted into 42,620 shares of common stock issued to each of the Nia Hatsopoulos Trust and the Alexander Hatsopoulos Trust.
On September 10, 2008, the Company entered into a demand note agreement with John N. Hatsopoulos, in the principal amount of $250,000 and at an annual interest rate of 5%. On September 7, 2011, the Company entered into an additional demand note agreement with John N. Hatsopoulos, in the principal amount of $750,000 and at an annual interest rate of 6%. On November 30, 2012, the Company entered into an additional demand note agreement with John N. Hatsopoulos in the principal amount of $300,000 at an annual interest rate of 6%. Unpaid principal and interest on the demand notes are due upon demand.
| F-23 |
For additional disclosure on the Company’s debt see Note 7 – Demand notes payable and convertible debentures – related party.
John N. Hatsopoulos’ salary is $1.00 per year. On average, Mr. Hatsopoulos spends approximately 20% of his business time on the affairs of the Company; however, such amount varies widely depending on the needs of the business and is expected to increase as the business of the Company develops.
On January 1, 2006, the Company signed a Facilities and Support Services Agreement with American DG Energy for a period of one year, renewable annually, on January 1st, by mutual agreement. That agreement was amended on July 1, 2012. Under this agreement, the Company provides American DG Energy with certain office and business support services and also provides pricing based on a volume discount depending on the level of American DG Energy purchases of cogeneration and chiller products. For certain sites, American DG Energy hires the Company to service its chiller and cogeneration products. The Company also provides office space and certain utilities to American DG Energy based on a monthly rate set at the beginning of each year. Also, under this agreement, American DG Energy has sales representation rights to the Company’s products and services in New England.
The Company subleases portions of its corporate offices and manufacturing facility to sub-tenants under annual sublease agreements. For the years ended December 31, 2012, 2011, and 2010, the Company received $158,898, $185,596, and $196,466, respectively, from American DG Energy, Levitronix, and Alexandros Partners LLC. In addition, for the years ended December 31, 2012, 2011, and 2010, the Company received from the same companies, $101,218, $224,700, and $142,050, respectively, to offset common operating expenses incurred in the administration and maintenance of its corporate office and warehouse facility.
The Company’s headquarters are located in Waltham, Massachusetts, and consist of 27,000 square feet of office and storage space that are shared with American DG Energy and other tenants. The lease expires on March 31, 2024. We believe that our facilities are appropriate and adequate for our current needs.
Revenue from sales of cogeneration and chiller systems, parts and service to American DG Energy during the years ended December 31, 2012, 2011, and 2010 amounted to $3,795,666, $713,267, and $1,658,471, respectively. In addition, Tecogen pays certain operating expenses, including benefits and insurance, on behalf of American DG Energy. Tecogen was reimbursed for these costs. As of December 31, 2012, 2011, and 2010, the total amount due from American DG Energy was $70,811, $299,739, and $98,230, respectively.
See Note 16 - Subsequent events for additional related party disclosure.
Note 14 – Fair value measurements
The Company has categorized its financial assets and liabilities, based on the priority of the inputs to the valuation technique, into a three-level fair value hierarchy as set forth below. If the inputs used to measure the financial instruments fall within different levels of the hierarchy, the categorization is based on the lowest level input that is significant to the fair value measurement the instrument. The three levels of the hierarchy are defined as follows:
Level 1 - Unadjusted quoted prices in active markets for identical assets or liabilities. We currently do not have any Level 1 financial assets or liabilities.
Level 2 - Observable inputs other than quoted prices included in Level 1. Level 2 inputs include quoted prices for identical assets or liabilities in non-active markets, quoted prices for similar assets or liabilities in active markets and inputs other than quoted prices that are observable for substantially the full-term of the asset or liability.
Level 3 - Unobservable inputs reflecting management’s own assumptions about the input used in pricing the asset or liability. We currently do not have any Level 3 financial assets or liabilities.
| F-24 |
The following table presents the input level used to determine the fair values of the Company’s financial instruments measured at fair value on a recurring basis for the years ended December 31, 2012, 2011, and 2010:
| December 31, 2012 | Quoted Prices in Active Markets (Level 1) | Significant Other Observable Inputs (Level 2) | Significant Unobservable Inputs (Level 3) | |||||||||||||
| Assets | ||||||||||||||||
| Certificates of deposit | 181,859 | — | 181,859 | — | ||||||||||||
| Total Assets | $ | 181,859 | $ | — | $ | 181,859 | $ | — | ||||||||
| December 31, 2011 | Quoted Prices in Active Markets (Level 1) | Significant Other Observable Inputs (Level 2) | Significant Unobservable Inputs (Level 3) | |||||||||||||
| Assets | ||||||||||||||||
| Certificates of deposit | 683,428 | — | 683,428 | — | ||||||||||||
| Total Assets | $ | 683,428 | $ | — | $ | 683,428 | $ | — | ||||||||
| December 31, 2010 | Quoted Prices in Active Markets (Level 1) | Significant Other Observable Inputs (Level 2) | Significant Unobservable Inputs (Level 3) | |||||||||||||
| Assets | ||||||||||||||||
| Certificates of deposit | 85,000 | — | 85,000 | — | ||||||||||||
| Total Assets | $ | 85,000 | $ | — | $ | 85,000 | $ | — | ||||||||
The Company determines the fair value of certificates of deposits using information provided by the issuing bank which includes discounted expected cash flow estimates using current market rates offered for deposits with similar remaining maturities. The Company has no assets or liabilities that are measured at fair value on a non-recurring basis.
Note 15 – Income taxes
A reconciliation of the federal statutory income tax provision to the Company’s actual provision for the years ended December 31, 2012, 2011, and 2010 is as follows:
| 2012 | 2011 | 2010 | ||||||||||
| Benefit at federal statutory tax rate | $ | 680,000 | $ | 648,000 | $ | 185,000 | ||||||
| Unbenefited operating losses | (680,000 | ) | (648,000 | ) | (185,000 | ) | ||||||
| Income tax provision | $ | — | $ | — | $ | — | ||||||
| F-25 |
The components of net deferred tax assets recognized in the accompanying consolidated balance sheets at December 31, 2012 and 2011 are as follows:
| 2012 | 2011 | 2010 | ||||||||||
| Net operating loss carryforwards | $ | 3,380,000 | $ | 2,896,000 | $ | 2,867,000 | ||||||
| Accrued expenses and other | 676,000 | 588,000 | 30,000 | |||||||||
| Accounts receivable | 60,000 | 37,000 | — | |||||||||
| Inventory | 130,000 | 139,000 | — | |||||||||
| Depreciation | 94,000 | 184,000 | 13,000 | |||||||||
| 4,340,000 | 3,844,000 | 2,910,000 | ||||||||||
| Valuation allowance | (4,340,000 | ) | (3,844,000 | ) | (2,910,000 | ) | ||||||
| Net deferred tax asset | $ | — | $ | — | $ | — | ||||||
As of December 31, 2012, the company has federal loss carryforwards of approximately $8,500,000, which expire beginning in 2021 through 2032. In addition, the Company has varying amounts of state net operating losses, expiring at various dates starting in 2012 through 2032. The federal net operating losses include approximately $1,900,000 attributable to the Company’s majority-owned subsidiary, which can only be used against income of that entity.
Management has determined that it is more likely than not that the company will not recognize the benefits of the federal and state deferred tax assets and as a result has recorded a valuation allowance against the entire net deferred tax asset. The valuation allowance has increased by $496,000 during the year ended December 31, 2012. If the company should generate sustained future taxable income, against which these tax attributes may be recognized, some portion or all of the valuation allowance would be reversed.
The Company did not record a benefit for income taxes related to its operating losses for the years ended December 31, 2012, 2011, and 2010.
The Company has analyzed its current tax return compliance positions and has determined that no uncertain tax positions have been taken that would require recognition.
Note 16 – Subsequent events
On January 9, 2013, the Company purchased the assets, both tangible and intangible, required to manufacture the permanent magnet generator (PMG) used in its InVerde product. Prior to this purchase of assets from a vendor, Danotek Motion Technologies, Inc. manufactured our PMG.
On March 14, 2013, the Company received a prepayment for future 2013 purchases of modules, parts and service from a related party in the amount of $827,747. The Company will provide a discount on these prepaid purchases equal to 6% per annum on deposit balances.
On March 25, 2013, the Company secured a working capital line of credit with John Hatsopoulos, the Company’s Chief Executive Officer, in the amount of $1 million.
The Company’s common stock was split one-for-four effective May 17, 2013. All per share data and common stock information have been restated to reflect this split. The par value of the Company’s common stock remains $0.001 per share.
The Company has evaluated subsequent events through the date of this prospectus and determined that no additional subsequent events occurred that would require recognition in the consolidated financial statements or disclosure in the notes thereto.
| F-26 |
Unaudited Interim Financial Statements
TECOGEN INC.
CONDENSED CONSOLIDATED BALANCE SHEETS
As of March 31, 2013 and December 31, 2012
(unaudited)
| March 31, 2013 | December 31, 2012 | |||||||
| ASSETS | ||||||||
| Current assets: | ||||||||
| Cash and cash equivalents | $ | 680,676 | $ | 1,572,785 | ||||
| Short-term investments | 182,061 | 181,859 | ||||||
| Accounts receivable, net | 3,015,992 | 2,700,243 | ||||||
| Inventory, net | 3,405,699 | 3,356,622 | ||||||
| Costs in excess of billing | 354,625 | — | ||||||
| Due from related party | — | 55,837 | ||||||
| Prepaid and other current assets | 310,043 | 402,846 | ||||||
| Total current assets | 7,949,096 | 8,270,192 | ||||||
| Property, plant and equipment, net | 702,950 | 435,612 | ||||||
| Intangible assets, net | 685,218 | 372,020 | ||||||
| Other assets | 39,425 | 39,425 | ||||||
| TOTAL ASSETS | $ | 9,376,689 | $ | 9,117,249 | ||||
| LIABILITIES AND STOCKHOLDERS’ EQUITY | ||||||||
| Current liabilities: | ||||||||
| Demand notes payable, related party | $ | 1,337,500 | $ | 1,337,500 | ||||
| Current portion of convertible debentures, related party | 90,967 | 90,967 | ||||||
| Accounts payable | 1,461,908 | 1,151,010 | ||||||
| Accrued expenses | 1,006,540 | 807,922 | ||||||
| Deferred revenue | 561,539 | 677,919 | ||||||
| Due to related party | 760,535 | — | ||||||
| Interest payable, related party | 146,972 | 126,170 | ||||||
| Total current liabilities | 5,365,961 | 4,191,488 | ||||||
| Long-term liabilities: | ||||||||
| Deferred revenue, net of current portion | 148,595 | 142,726 | ||||||
| Total liabilities | 5,514,556 | 4,334,214 | ||||||
| Commitments and contingencies (Note 5) | — | — | ||||||
| Stockholders’ equity: | ||||||||
| Tecogen Inc. shareholders’ equity: | ||||||||
| Common stock, $0.001 par value; 100,000,000 shares authorized; 13,611,974 issued and outstanding at March 31, 2013 and December 31, 2012 | 54,448 | 54,448 | ||||||
| Additional paid-in capital | 16,373,090 | 16,319,985 | ||||||
| Accumulated deficit | (12,620,116 | ) | (11,759,723 | ) | ||||
| Total Tecogen Inc. stockholders’ equity | 3,807,422 | 4,614,710 | ||||||
| Noncontrolling interest | 54,711 | 168,325 | ||||||
| Total stockholders’ equity | 3,862,133 | 4,783,035 | ||||||
| TOTAL LIABILITIES AND STOCKHOLDERS’ EQUITY | $ | 9,376,689 | $ | 9,117,249 | ||||
The accompanying notes are an integral part of these consolidated financial statements.
| F-27 |
TECOGEN INC.
CONDENSED CONSOLIDATED STATEMENTS OF OPERATIONS
For the Three Months Ended March 31, 2013 and 2012
(unaudited)
| 2013 | 2012 | |||||||
| Revenues | ||||||||
| Products | $ | 2,052,665 | $ | 1,489,707 | ||||
| Services | 1,993,653 | 1,762,821 | ||||||
| 4,046,318 | 3,252,528 | |||||||
| Cost of sales | ||||||||
| Products | 1,588,668 | 982,848 | ||||||
| Services | 1,345,686 | 855,125 | ||||||
| 2,934,354 | 1,837,973 | |||||||
| Gross profit | 1,111,964 | 1,414,555 | ||||||
| Operating expenses | ||||||||
| General and administrative | 1,791,703 | 1,684,744 | ||||||
| Selling | 279,370 | 267,929 | ||||||
| 2,071,073 | 1,952,673 | |||||||
| Loss from operations | (959,109 | ) | (538,118 | ) | ||||
| Other income (expense) | ||||||||
| Interest and other income | 3,946 | 14,772 | ||||||
| Interest expense | (23,377 | ) | (17,802 | ) | ||||
| (19,431 | ) | (3,030 | ) | |||||
| Loss before income taxes | (978,540 | ) | (541,148 | ) | ||||
| Consolidated net loss | (978,540 | ) | (541,148 | ) | ||||
| Less: Loss attributable to the noncontrolling interest | 118,147 | 102,835 | ||||||
| Net loss attributable to Tecogen Inc. | $ | (860,393 | ) | $ | (438,313 | ) | ||
| Net loss per share - basic and diluted | $ | (0.07 | ) | $ | (0.03 | ) | ||
| Weighted average shares outstanding - basic and diluted | 13,212,894 | 13,015,154 | ||||||
The accompanying notes are an integral part of these consolidated financial statements.
| F-28 |
TECOGEN INC.
CONDENSED CONSOLIDATED STATEMENTS OF STOCKHOLDERS' EQUITY
For the Three Months Ended March 31, 2013
(unaudited)
| Tecogen Inc. | ||||||||||||||||||||
| Common Stock 0.001 Par Value | Additional Paid-In Capital | Accumulated Deficit | Noncontrolling Interest | Total | ||||||||||||||||
| Balance at December 31, 2012 | $ | 54,448 | $ | 16,319,985 | $ | (11,759,723 | ) | $ | 168,325 | $ | 4,783,035 | |||||||||
| Stock based compensation expense | — | 53,105 | — | 4,533 | 57,638 | |||||||||||||||
| Net loss | — | — | (860,393 | ) | (118,147 | ) | (978,540 | ) | ||||||||||||
| Balance at March 31, 2013 | $ | 54,448 | $ | 16,373,090 | $ | (12,620,116 | ) | $ | 54,711 | $ | 3,862,133 | |||||||||
The accompanying notes are an integral part of these consolidated financial statements.
| F-29 |
TECOGEN INC.
CONDENSED CONSOLIDATED STATEMENTS OF CASH FLOWS
For the Three Months Ended March 31, 2013 and 2012
(unaudited)
| 2013 | 2012 | |||||||
| CASH FLOWS FROM OPERATING ACTIVITIES: | ||||||||
| Net loss | $ | (978,540 | ) | $ | (541,148 | ) | ||
| Adjustments to reconcile net loss to net cash provided by (used in) operating activities: | ||||||||
| Depreciation and amortization | 55,857 | 47,892 | ||||||
| Provision for losses on accounts receivable | (8,900 | ) | — | |||||
| Provision (recovery) for inventory reserve | — | 3,800 | ||||||
| Stock-based compensation | 57,638 | 95,053 | ||||||
| Changes in operating assets and liabilities | ||||||||
| (Increase) decrease in: | ||||||||
| Short-term investments | (202 | ) | (1,997 | ) | ||||
| Accounts receivable | (306,849 | ) | (797,309 | ) | ||||
| Inventory | (49,077 | ) | (586,570 | ) | ||||
| Costs in excess of billing | (354,625 | ) | — | |||||
| Due from related party | 55,837 | (49,958 | ) | |||||
| Prepaid expenses and other current assets | 92,803 | (78,806 | ) | |||||
| Increase (decrease) in: | ||||||||
| Accounts payable | 310,898 | 201,889 | ||||||
| Accrued expenses | 198,618 | 17,731 | ||||||
| Deferred revenue | (110,511 | ) | (99,249 | ) | ||||
| Due to related party | 760,535 | — | ||||||
| Interest payable, related party | 20,802 | 17,802 | ||||||
| Net cash used in operating activities | (255,716 | ) | (1,770,870 | ) | ||||
| CASH FLOWS FROM INVESTING ACTIVITIES: | ||||||||
| Purchases of property and equipment | (313,002 | ) | (68,244 | ) | ||||
| Purchases of intangible assets | (323,391 | ) | (19,658 | ) | ||||
| Net cash used in investing activities | (636,393 | ) | (87,902 | ) | ||||
| CASH FLOWS FROM FINANCING ACTIVITIES: | ||||||||
| Proceeds from sale of subsidiary common stock | — | 500,000 | ||||||
| Net cash provided by financing activities | — | 500,000 | ||||||
| Net increase (decrease) in cash and cash equivalents | (892,109 | ) | (1,358,772 | ) | ||||
| Cash and cash equivalents, beginning of the period | 1,572,785 | 3,018,566 | ||||||
| Cash and cash equivalents, end of the period | $ | 680,676 | $ | 1,659,794 | ||||
| Supplemental disclosures of cash flows information: | ||||||||
| Non-cash investing and financing activities: | ||||||||
| Interest paid | $ | — | $ | — | ||||
The accompanying notes are an integral part of these consolidated financial statements.
| F-30 |
Notes to Interim Unaudited Condensed Consolidated Financial Statements for the three months ended March 31, 2013
Note 1 – Description of business and summary of significant accounting policies
Description of business
Tecogen Inc. (the “Company”) (a Delaware Corporation) was organized on November 15, 2000, and acquired the assets and liabilities of the Tecogen Products division of Thermo Power Corporation. The Company produces commercial and industrial, natural-gas-fueled engine-driven, combined heat and power (CHP) products that reduce energy costs, decrease greenhouse gas emissions and alleviate congestion on the national power grid. The Company’s products supply electric power or mechanical power for cooling, while heat from the engine is recovered and purposefully used at a facility. The majority of the Company’s customers are located in regions with the highest utility rates, typically California, the Midwest and the Northeast.
Basis of Presentation
The accompanying unaudited consolidated financial statements have been prepared in accordance with the instructions for Form 10-Q and therefore do not include all information and notes necessary for a complete presentation of our financial position, results of operations and cash flows, in conformity with generally accepted accounting principles. We filed audited financial statements which included all information and notes necessary for such presentation for the two years ended December 31, 2012 in conjunction with our notes to the audited financial statements contained on pages F-31 to F-42 in this registration statement.
The accompanying unaudited consolidated balance sheets, statements of operations and statements of cash flows reflect all adjustments (consisting only of normal recurring items) which are, in the opinion of management, necessary for a fair presentation of financial position at March 31, 2013, and of operations and cash flows for the interim periods ended March 31, 2013 and 2012.
The results of operations for the interim period ended March 31, 2013 are not necessarily indicative of the results to be expected for the year.
The accompanying consolidated financial statements include the accounts of the Company and its 65.0% owned subsidiary, Ilios, whose business focus is on advanced heating systems for commercial and industrial applications.
The Company’s operations are comprised of one business segment. Our business is to manufacture and support highly efficient CHP products based on engines fueled by natural gas.
Use of Estimates
The preparation of financial statements in conformity with accounting principles generally accepted in the United States of America requires management to make estimates and assumptions that affect the reported amounts of assets and liabilities and disclosure of contingent assets and liabilities at the date of the financial statements and the reported amounts of revenues and expenses during the reporting period. Actual results could differ from those estimates.
Revenue Recognition
Revenue is recognized when persuasive evidence of an arrangement exists, delivery has occurred or services have been rendered, the price is fixed or determinable and collectability is reasonably assured. Generally, sales of cogeneration and chiller units and parts are recognized when shipped and services are recognized over the term of the service period. Payments received in advance of services being performed are recorded as deferred revenue.
Infrequently, the Company recognizes revenue in certain circumstances before delivery has occurred (commonly referred to as bill and hold transactions). In such circumstances, among other things, risk of ownership has passed to the buyer; the buyer has made a written fixed commitment to purchase the finished goods; the buyer has requested the finished goods be held for future delivery as scheduled and designated by the buyer; and the Company has no additional performance obligations. For these transactions, the finished goods are segregated from inventory and normal billing and credit terms are granted. For the three months ended March 31, 2013 and 2012, no revenues were recorded as bill and hold transactions.
| F-31 |
For those arrangements that include multiple deliverables, the Company first determines whether each service or deliverable meets the separation criteria of FASB ASC 605-25, Revenue Recognition—Multiple-Element Arrangements. In general, a deliverable (or a group of deliverables) meets the separation criteria if the deliverable has stand-alone value to the customer and if the arrangement includes a general right of return related to the delivered item and delivery or performance of the undelivered item(s) is considered probable and substantially in control of the Company. Each deliverable that meets the separation criterion is considered a separate ‘‘unit of accounting.” The Company allocates the total arrangement consideration to each unit of accounting using the relative fair value method. The amount of arrangement consideration that is allocated to a delivered unit of accounting is limited to the amount that is not contingent upon the delivery of another unit of accounting.
When vendor-specific objective evidence or third-party evidence is not available, adopting the relative fair value method of allocation permits the Company to recognize revenue on specific elements as completed based on the estimated selling price. The Company generally uses internal pricing lists that determine sales prices to external customers in determining its best estimate of the selling price of the various deliverables in multiple-element arrangements. Changes in judgments made in estimating the selling price of the various deliverables could significantly affect the timing or amount of revenue recognition. The Company enters into sales arrangements with customers to sell its cogeneration and chiller units and related service contracts and occasionally installation services. Because the Company sells each deliverable to other customers on a stand-alone basis, the company has determined that each deliverable has a stand-alone value. Additionally, there are no rights of return relative to the delivered items; therefore, each deliverable is considered a separate unit of accounting.
After the arrangement consideration has been allocated to each unit of accounting, the Company applies the appropriate revenue recognition method for each unit of accounting based on the nature of the arrangement and the services included in each unit of accounting. Cogeneration and chiller units are recognized when shipped. Services are recognized over the term of the applicable agreement, or as provided when on a time and materials basis.
In some cases, our customers may choose to have the Company provide turnkey services for them rather than simply purchasing the cogeneration and/or chiller units. Turnkey services include site engineering, construction, electrical, plumbing and installation services. In this case, the Company accounts for revenue, or turnkey revenue, and costs using the percentage-of-completion method of accounting. Under the percentage-of-completion method of accounting, revenues are recognized by applying percentages of completion to the total estimated revenues for the respective contracts. Costs are recognized as incurred. The percentages of completion are determined by relating the actual cost of work performed to date to the current estimated total cost at completion of the respective contracts. When the estimate on a contract indicates a loss, the Company’s policy is to record the entire expected loss, regardless of the percentage of completion. During the three months ended March 31, 2013, a loss of approximately $300,000. The excess of contract costs and profit recognized to date on the percentage-of-completion accounting method in excess of billings is recorded as unbilled revenue. Billings in excess of related costs and estimated earnings are recorded as deferred revenue.
Presentation of Sales Taxes
The Company reports revenues net of any revenue-based taxes assessed by governmental authorities that are imposed on and concurrent with specific revenue-producing transactions.
Shipping and Handling Costs
The Company classifies freight billed to customers as sales revenue and the related freight costs as cost of sales.
Advertising Costs
The Company expenses the costs of advertising as incurred. For the three months ended March 31, 2013 and 2012, advertising expense was approximately $29,000 and $36,000, respectively.
Cash and Cash Equivalents
The Company considers all highly liquid instruments with an original maturity date, at date of purchase, of three months or less to be cash and cash equivalents. The Company has cash balances in certain financial institutions in amounts which occasionally exceed current federal deposit insurance limits. The financial stability of these institutions is continually reviewed by senior management. The Company believes it is not exposed to any significant credit risk on cash and cash equivalents.
| F-32 |
Concentration of Credit Risk
Financial instruments, which potentially subject the Company to concentrations of credit risk consist primarily of cash and cash equivalents, short-term investments and accounts receivable. The Company's cash equivalents are placed with certain financial institutions and issuers. As of March 31, 2013, the Company had a balance of $362,737 in cash and cash equivalents and short-term investments that exceeded the FDIC’s general deposit insurance limit of $250,000.
Short-Term Investments
Short-term investments consist of certificates of deposit with maturities of greater than three months but less than one year. Certificates of deposits are recorded at fair value.
Accounts Receivable
Accounts receivable are stated at the amount management expects to collect from outstanding balances. An allowance for doubtful accounts is provided for those accounts receivable considered to be uncollectible based upon historical experience and management’s evaluation of outstanding accounts receivable at the end of the year. Bad debts are written off against the allowance when identified. At March 31, 2013 and December 31, 2012, the allowance for doubtful accounts was $145,500 and $154,400, respectively.
Inventory
Raw materials, work in process, and finished goods inventories are stated at the lower of cost, as determined by the average cost method, or net realizable value. The Company periodically reviews inventory quantities on hand for excess and/or obsolete inventory based primarily on historical usage, as well as based on estimated forecast of product demand. Any reserves that result from this review are charged to cost of sales.
Property, Plant and Equipment
Property, plant and equipment are recorded at cost. Depreciation is provided using the straight-line method over the estimated useful lives of the asset, which range from three to seven years. Leasehold improvements are amortized using the straight-line method over the lesser of the estimated useful lives of the assets or the term of the related leases. Expenditures for maintenance and repairs are expensed currently, while renewals and betterments that materially extend the life of an asset are capitalized.
Intangible Assets
Intangible assets subject to amortization include costs incurred by the Company to acquire product certifications and certain patent costs. These costs are amortized on a straight-line basis over the estimated economic life of the intangible asset. The Company reviews intangible assets for impairment when the circumstances warrant.
Research and Development Costs/Grants
Internal research and development expenditures are expensed as incurred. Proceeds from certain grants and contracts with governmental agencies and their contractors to conduct research and development for new CHP technologies or to improve or enhance existing technology is recorded as an offset to the related research and development expenses. These grants and contracts are paid on a cost reimbursement basis provided in the agreed upon budget, with 10% retainage held to the end of the contract period. For the three months ended March 31, 2013 and 2012, amounts received were $67,144 and $66,019, respectively, which offset the Company’s total research and development expenditures for each of the respective periods. As of March 31, 2013 and December 31, 2012, retainage receivable was $67,775 and $154,700, respectively.
| F-33 |
Stock-Based Compensation
Stock based compensation cost is measured at the grant date based on the estimated fair value of the award and is recognized as an expense in the consolidated statements of operations over the requisite service period. The fair value of stock options granted is estimated using the Black-Scholes option pricing valuation model. The Company recognizes compensation on a straight-line basis for each separately vesting portion of the option award. Use of a valuation model requires management to make certain assumptions with respect to selected model inputs. The determination of the fair value of share-based payment awards is affected by the Company’s stock price. Since the Company is not publicly traded, the Company considered the sales price of the common stock in private placements to unrelated third parties as a measure of the fair value of its common stock. The average expected life is estimated using the simplified method for “plain vanilla” options. The simplified method determines the expected life in years based on the vesting period and contractual terms as set forth when the award is made. The Company uses the simplified method for awards of stock-based compensation since it does not have the necessary historical exercise and forfeiture data to determine an expected life for stock options. The risk-free interest rate is based on U.S. Treasury zero-coupon issues with a remaining term which approximates the expected life assumed at the date of grant. When options are exercised the Company normally issues new shares (see “Note 4 – Stock-based compensation”).
Loss per Common Share
The Company computes basic loss per share by dividing net loss for the period by the weighted-average number of shares of common stock outstanding during the period. The Company computes its diluted earnings per common share using the treasury stock method. For purposes of calculating diluted earnings per share, the Company considers its shares issuable in connection with the convertible debentures, stock options and warrants to be dilutive common stock equivalents when the exercise/conversion price is less than the average market price of our common stock for the period.
Other Comprehensive Net Loss
The comprehensive net loss for the three months ended March 31, 2013 and 2012 does not differ from the reported loss.
Segment Information
The Company reports segment data based on the management approach. The management approach designates the internal reporting that is used by management for making operating and investment decisions and evaluating performance as the source of the Company's reportable segments. The Company uses one measurement of profitability and does not disaggregate its business for internal reporting. The Company has determined that it operates in one business segment, which is the manufacture and support of highly efficient CHP products based on engines fueled by natural gas.
The following table summarizes net revenue by product line and services for the three months ended March 31, 2013 and 2012:
| 2013 | 2012 | |||||||
| Products: | ||||||||
| Cogeneration | $ | 1,278,156 | $ | 582,250 | ||||
| Chiller | 774,509 | 907,457 | ||||||
| Total Product Revenue | 2,052,665 | 1,489,707 | ||||||
| Services | 1,993,653 | 1,762,821 | ||||||
| $ | 4,046,318 | $ | 3,252,528 | |||||
Income Taxes
The Company uses the asset and liability method of accounting for income taxes. The current or deferred tax consequences of transactions are measured by applying the provisions of enacted tax laws to determine the amount of taxes payable currently or in future years. Deferred tax assets and liabilities are determined based on the difference between the financial statement and tax bases of assets and liabilities and expected future tax consequences of events that have been included in the financial statements or tax returns using enacted tax rates in effect for the years in which the differences are expected to reverse. Under this method, a valuation allowance is used to offset deferred taxes if, based upon the available evidence, it is more likely than not that some or all of the deferred tax assets may not be realized. Management evaluates the recoverability of deferred taxes and the adequacy of the valuation allowance annually.
| F-34 |
The Company follows the provisions of the accounting standards relative to accounting for uncertainties in tax positions. These provisions provide guidance on the recognition, de-recognition and measurement of potential tax benefits associated with tax positions. The Company elected to recognize interest and penalties related to income tax matters as a component of income tax expense in the statements of operations. There was no impact on the financial statements as a result of this guidance.
Note 2 – Loss per common share
The Company computes basic loss per share by dividing net loss for the period by the weighted-average number of shares of common stock outstanding during the period. The Company computes its diluted earnings per common share using the treasury stock method. For purposes of calculating diluted loss per share, the Company considers its shares issuable in connection with convertible debentures, stock options and warrants to be dilutive common stock equivalents when the exercise/conversion price is less than the average market price of the common stock for the period. All shares issuable for both periods were anti-dilutive because of the reported net loss. Basic and diluted earnings per share for the three months ended March 31, 2013 and 2012, respectively, were as follows:
| 2013 | 2012 | |||||||
| Loss available to stockholders | $ | (860,393 | ) | $ | (438,313 | ) | ||
| Weighted average shares outstanding - Basic and diluted | 13,212,894 | 13,015,154 | ||||||
| Basic and diluted loss per share | $ | (0.07 | ) | $ | (0.03 | ) | ||
| Anti-dilutive shares underlying stock options outstanding | 1,096,500 | 1,095,250 | ||||||
| Anti-dilutive convertible debentures | 75,806 | 159,140 | ||||||
Note 3 – Demand notes payable, convertible debentures and credit agreement – related party
Demand notes payable to related parties consist of various demand notes outstanding to stockholders totaling $1,337,500 at March 31, 2013 and December 31, 2012. The primary lender is John N. Hatsopoulos, the company’s Chief Executive Officer, who holds $1,300,000 of the demand notes. The demand notes accrue interest annually at rates ranging from 5% to 6%. Unpaid principal and interest on the demand notes is due upon demand.
On September 24, 2001, the Company entered into subscription agreements with three investors for the sale of convertible debentures in the aggregate principal amount of $330,000. The primary investors were George N. Hatsopoulos, a member of the board of directors, who subscribed for $200,000 of the debentures and John N. Hatsopoulos, the Company’s Chief Executive Officer, who subscribed for $100,000 of the debentures. The debentures accrue interest at a rate of 6% per annum and are due six years from issuance date. The debentures are convertible, at the option of the holder, into a number of shares of common stock as determined by dividing the original principal amount plus accrued and unpaid interest by a conversion price of $1.20.
On May 11, 2009 the Company sold 1,400,000 shares in Ilios at $0.50 per share to George Hatsopoulos and John Hatsopoulos in exchange for the extinguishment of $427,432 in demand notes payable, $109,033 in convertible debentures and $163,535 in accrued interest. The difference between the Company’s purchase price of the Ilios shares and the amount of debt forgiveness was recorded as additional paid-in capital.
On March 25, 2013, the Company entered into a Revolving Line of Credit Agreement, or the Credit Agreement, with John N. Hatsopoulos, our Chief Executive Officer. Under the terms of the Credit Agreement, Mr. Hatsopoulos has agreed to lend the Company up to an aggregate of $1 million, from time to time, at the written request of the Company. Any amounts borrowed by the Company pursuant to the Credit Agreement will bear interest at the Bank Prime Rate as quoted from time to time in the Wall Street Journal plus 1.5% per year. Interest is due and payable quarterly in arrears. Repayment of the principal amount borrowed pursuant to the Credit Agreement will be due on March 31, 2014, or the Maturity Date. Prepayment of any amounts due under the Credit Agreement may be made at any time without penalty. The Credit Agreement terminates on the Maturity Date. The Company has not yet borrowed any amounts pursuant to the Credit Agreement.
| F-35 |
At March 31, 2013 and December 31, 2012, there were 75,806 shares of common stock issuable upon conversion of the Company’s outstanding convertible debentures. At March 31, 2013 and December 31, 2012, the principal amount of the Company’s convertible debentures was $90,967, which is due on September 24, 2013.
Note 4 - Stock-based compensation
Stock-Based Compensation
In 2006, the Company adopted the 2006 Stock Option and Incentive Plan (the “Plan”), under which the board of directors may grant incentive or non-qualified stock options and stock grants to key employees, directors, advisors and consultants of the Company. The Plan was most recently amended on November 10, 2011 to increase the reserved shares of common stock issuable under the Plan to 1,838,750 (the “Amended Plan”).
Stock options vest based upon the terms within the individual option grants, with an acceleration of the unvested portion of such options upon a change in control event, as defined in the Amended Plan. The options are not transferable except by will or domestic relations order. The option price per share under the Amended Plan cannot be less than the fair market value of the underlying shares on the date of the grant. The number of shares remaining available for future issuance under the Amended Plan as of March 31, 2013 was 135,183.
Stock option activity for the three months ended March 31, 2013 was as follows:
| Common Stock Options | Number of Options | Exercise Price Per Share | Weighted Average Exercise Price | Weighted Average Remaining Life | Aggregate Intrinsic Value | |||||||||||||||
| Outstanding, December 31, 2012 | 1,096,500 | $0.12-$3.20 | $ | 1.96 | 4.66 years | $ | 1,356,400 | |||||||||||||
| Granted | — | — | — | |||||||||||||||||
| Exercised | — | — | — | |||||||||||||||||
| Canceled and forfeited | — | — | — | |||||||||||||||||
| Expired | — | — | — | |||||||||||||||||
| Outstanding, March 31, 2013 | 1,096,500 | $0.12-$3.20 | $ | 1.96 | 4.41 years | $ | 1,356,400 | |||||||||||||
| Exercisable, March 31, 2013 | 812,313 | $ | 1.72 | $ | 1,201,075 | |||||||||||||||
| Vested and expected to vest, March 31, 2013 | 1,096,500 | $ | 1.96 | $ | 1,356,400 | |||||||||||||||
Restricted stock activity for the three months ended March 31, 2013 as follows:
| Number of Restricted Stock | Weighted Average Grant Date Fair Value | |||||||
| Unvested, December 31, 2012 | 399,070 | $ | 1.44 | |||||
| Granted | — | — | ||||||
| Vested | — | — | ||||||
| Forfeited | — | — | ||||||
| Unvested, March 31, 2013 | 399,070 | $ | 1.44 | |||||
Stock Based Compensation - Ilios
In 2009, Ilios adopted the 2009 Stock Incentive Plan (the “2009 Plan”) under which the board of directors may grant incentive or non-qualified stock options and stock grants to key employees, directors, advisors and consultants of the company. The maximum number of shares allowable for issuance under the 2009 Plan is 2 million shares of common stock. Stock options vest based upon the terms within the individual option grants, with an acceleration of the unvested portion of such options upon a change in control event, as defined in the Plan. The options are not transferable except by will or domestic relations order. The option price per share under the 2009 Plan cannot be less than the fair market value of the underlying shares on the date of the grant.
| F-36 |
Stock option activity relating to Ilios for the three months ended March 31, 2013 was as follows:
| Common Stock Options | Number of Options | Exercise Price Per Share | Weighted Average Exercise Price | Weighted Average Remaining Life | Aggregate Intrinsic Value | |||||||||||||||
| Outstanding, December 31, 2012 | 575,000 | $0.10-$0.50 | $ | 0.29 | 7.44 years | $ | 120,000 | |||||||||||||
| Granted | — | — | — | |||||||||||||||||
| Exercised | — | — | ||||||||||||||||||
| Canceled and forfeited | — | — | ||||||||||||||||||
| Expired | — | — | ||||||||||||||||||
| Outstanding, March 31, 2013 | 575,000 | $0.10-$0.50 | $ | 0.29 | 7.19 years | $ | 120,000 | |||||||||||||
| Exercisable, March 31, 2013 | 56,250 | $ | 0.50 | $ | — | |||||||||||||||
| Vested and expected to vest, March 31, 2013 | 575,000 | $ | 0.29 | $ | 120,000 | |||||||||||||||
Restricted stock activity for the Ilios awards, for the three months ended March 31, 2013 was as follows:
| Number of Restricted Stock | Weighted Average Grant Date Fair Value | |||||||
| Unvested, December 31, 2012 | 510,000 | $ | 0.26 | |||||
| Granted | — | — | ||||||
| Vested | — | — | ||||||
| Forfeited | — | — | ||||||
| Unvested, March 31, 2013 | 510,000 | $ | 0.26 | |||||
Total stock-based compensation expense for the three months ended March 31, 2013 and 2012 was $57,638 and $95,053, respectively. At March 31, 2013, the total compensation cost related to unvested restricted stock awards and stock option awards not yet recognized is $195,718. This amount will be recognized over a weighted average period of 2.57 years. No tax benefit was recognized related to the stock-based compensation recorded during the periods.
Note 5 – Commitments and contingencies
Future minimum lease payments under all non-cancelable operating leases as of March 31, 2013 consist of the following:
| Years Ending December 31, | Amount | |||
| 2013 | $ | 440,840 | ||
| 2014 | 566,993 | |||
| 2015 | 528,940 | |||
| 2016 | 485,040 | |||
| 2017 | 491,920 | |||
| 2018 and thereafter | 3,241,340 | |||
| Total | $ | 5,755,073 | ||
For the three months ended March 31, 2013 and 2012, rent expense was $116,159 and $41,132, respectively.
On October 26, 2011, the Company entered into an agreement with Digital Energy Corp., a customer of the Company, whereby the Company provided a letter of credit in the amount of $180,000, for the benefit of Digital Energy Corp., to satisfy a requirement of the New York Independent System Operator, Inc. A certificate of deposit for $180,000 secures the letter of credit. In exchange for providing this letter of credit, Digital Energy Corp. provided a promissory note to the Company for $180,000, with interest at 6%, payable in monthly installments of interest only. Principal would only be owed if the letter of credit was drawn upon and would become due and payable on the first anniversary date of the note. On February 19, 2013, this letter of credit and certificate of deposit restriction was released.
| F-37 |
Note 6 – Noncontrolling interests
As of December 31, 2010, Tecogen owned 63.0% of Ilios. During the year ended December 31, 2011, Tecogen purchased 1.5 million shares of Ilios common stock at $0.50 per share for an aggregate amount of $750,000 which increased Tecogen's ownership interest to 67.4%.
During the year ended December 31, 2012, Ilios sold 1 million shares of common stock to an accredited investor at $0.50 per share for an aggregate amount of $500,000. Also during the year ended December 31, 2012, Tecogen purchased 1 million shares of Ilios common stock at $0.50 per share for an aggregate amount of $500,000. The net result decreased Tecogen’s ownership interest to 65.0%.
The table below presents the changes in equity resulting from net loss attributable to Tecogen and transfers to or from noncontrolling interests for the three months ended March 31, 2013 and 2012.
Net loss attributable to Tecogen Inc. and
Transfers (to) from the Noncontrolling Interest
Three Months Ended March 31,
| 2013 | 2012 | |||||||
| Net loss attributable to Tecogen Inc. | $ | (860,393 | ) | $ | (438,313 | ) | ||
| Transfers (to) from the noncontrolling interest | ||||||||
| Increase in Tecogen's paid-in capital upon the sale of 1 million Ilios common shares | — | 289,606 | ||||||
| Net transfers to noncontrolling interest | — | 289,606 | ||||||
| Change from net loss attributable to Tecogen Inc. and transfers to noncontrolling interest | $ | (860,393 | ) | $ | (148,707 | ) | ||
Note 7 – Related party transactions
The Company has five affiliated companies, namely American DG Energy, EuroSite Power, GlenRose Instruments Inc., or GlenRose Instruments, Pharos LLC, or Pharos, and Levitronix Technologies LLC, or Levitronix. These companies are affiliates because several of the major stockholders of those companies, have a significant ownership position in the Company. None of American DG Energy, EuroSite Power, GlenRose Instruments, Pharos, and Levitronix own any shares of the Company, and the Company does not own any shares of American DG Energy, EuroSite Power, GlenRose Instruments, Pharos or Levitronix. The businesses of GlenRose Instruments, Pharos, and Levitronix are not related to the business of the Company.
American DG Energy, EuroSite Power, GlenRose Instruments, Pharos, and Levitronix are affiliated companies by virtue of common ownership. The common stockholders include:
| • | John N. Hatsopoulos, the Company’s Chief Executive Officer, who is also: (a) the Chief Executive Officer and a director of American DG Energy and holds 10.7% of that company’s common stock; (b) the Chairman of EuroSite Power; (c) a director of Ilios and holds 7% of that company’s common stock; and (d) the Chairman of GlenRose Instruments and holds 15.7% of that company’s common stock. |
| • | Dr. George N. Hatsopoulos, who is John N. Hatsopoulos’ brother, and is also: (a) a director of American DG Energy and holds 14.0% of that company’s common stock; (b) an investor in Ilios and holds 3.1% of that company’s common stock; (c) an investor in GlenRose Instruments and holds 15.7% of that company’s common stock; (d) an investor in Pharos and holds 24.4% of that company’s common stock; and (e) an investor in Levitronix and holds 21.4% of that company’s common stock. |
On May 11, 2009, the Company sold 1,400,000 shares in Ilios at $0.50 per share to George Hatsopoulos and John Hatsopoulos in exchange for the extinguishment of $427,432 in demand notes payable, $109,033 in convertible debentures, and $163,535 in accrued interest. The difference between the Company’s purchase price of the Ilios shares and the amount of debt forgiveness was recorded as additional paid-in capital.
| F-38 |
On October 20, 2009, American DG Energy, in the ordinary course of its business, signed a Sales Representative Agreement with Ilios to promote, sell, and service the Ilios high-efficiency heating products, such as the high efficiency water heater, in the marketing territory of the New England states, including Connecticut, Rhode Island, Massachusetts, New Hampshire, Vermont, and Maine. The marketing territory also includes all of the nations in the European Union. The initial term of this Agreement is for five years, after which it may be renewed for successive one-year terms upon mutual written agreement. American DG Energy has not yet sold any products under this agreement and, therefore, no amounts have been required to be paid.
On September 24, 2001, the Company entered into subscription agreements with investors for the sale of convertible debentures. The primary investors were George N. Hatsopoulos, who subscribed for debentures having an initial principal amount of $200,000; the John N. Hatsopoulos 1989 Family Trust for the benefit of Nia Marie Hatsopoulos, or the Nia Hatsopoulos Trust, which subscribed for debentures having an initial principal amount of $50,000; and the John N. Hatsopoulos 1989 Family Trust for the benefit of Alexander John Hatsopoulos, or the Alexander Hatsopoulos Trust, which subscribed for debentures having an initial principal amount of $50,000. Nia Hatsopoulos and Alexander Hatsopoulos are John N. Hatsopoulos’s adult children. John N. Hatsopoulos disclaims beneficial ownership of the shares held by these trusts. The debentures accrue interest at a rate of 6% per annum and were due on September 24, 2007. The debentures are convertible, at the option of the holder, into shares of common stock at a conversion price of $1.20 per share.
On September 24, 2007, George N. Hatsopoulos, the Nia Hatsopoulos Trust and the Alexander Hatsopoulos Trust, holding debentures representing a majority of the then-outstanding principal amount of the debentures, agreed to extend the debenture term to September 24, 2011.
On May 11, 2009, George N. Hatsopoulos, the Nia Hatsopoulos Trust and the Alexander Hatsopoulos Trust converted a portion of the principal amount under the debentures held by each of them into shares of common stock of Ilios, the Company’s then newly-formed subsidiary, at a conversion price of $0.50 per share. Specifically, George N. Hatsopoulos converted principal in the amount of $109,033, together with accrued interest in the amount of $90,967, into 400,000 shares of Ilios common stock; the Nia Hatsopoulos Trust converted principal in the amount of $213,716, together with interest in the amount of $36,284, into 500,000 shares of Ilios common stock; and Nia Hatsopoulos Trust converted principal in the amount of $213,716, together with interest in the amount of $36,284, into 500,000 shares of Ilios common stock. The difference between the Company’s purchase price of the Ilios shares and the amount of debt forgiveness was recorded as additional paid-in capital.
On September 30, 2009, Joseph J. Ritchie elected to convert the outstanding principal amount under the debenture held by him, $30,000, together with accrued interest of $14,433, into 37,028 shares of the Company’s common stock at a conversion price of $1.20 per share.
On September 24, 2011, George N. Hatsopoulos, the Nia Hatsopoulos Trust and the Alexander Hatsopoulos Trust, holding debentures representing a majority of the then-outstanding principal amount of the debentures, agreed to extend the term of the debentures to September 24, 2013 and requested that accrued interest in the aggregate amount of approximately $72,960 be converted into the Company’s common stock at $2.00 per share (which was the average price of the Company’s stock between September 24, 2001 and September 24, 2011). In connection with this, the Company issued 6,474 shares of common stock to George N. Hatsopoulos, 15,003 shares of common stock to the Nia Hatsopoulos Trust and 15,003, shares of common stock to the Alexander Hatsopoulos Trust.
On September 30, 2012, the remaining principal amount under the debentures held by the Nia Hatsopoulos Trust and the Alexander Hatsopoulos Trust, including the applicable accrued interest, was converted into 42,620 shares of common stock issued to each of the Nia Hatsopoulos Trust and the Alexander Hatsopoulos Trust.
On September 10, 2008, the Company entered into a demand note agreement with John N. Hatsopoulos, in the principal amount of $250,000 at an annual interest rate of 5%. On September 7, 2011, the Company entered into an additional demand note agreement with John N. Hatsopoulos, in the principal amount of $750,000 at an annual interest rate of 6%. On November 30, 2012, the Company entered into an additional demand note agreement with John N. Hatsopoulos, in the principal amount of $300,000 at an annual interest rate of 6%. Unpaid principal and interest on the demand notes are due upon demand.
| F-39 |
On March 25, 2013, the Company entered into a Revolving Line of Credit Agreement, or the Credit Agreement, with John N. Hatsopoulos, our Chief Executive Officer. Under the terms of the Credit Agreement, Mr. Hatsopoulos has agreed to lend the Company up to an aggregate of $1 million, from time to time, at the written request of the Company. Any amounts borrowed by the Company pursuant to the Credit Agreement will bear interest at the Bank Prime Rate as quoted from time to time in the Wall Street Journal plus 1.5% per year. Interest is due and payable quarterly in arrears. Repayment of the principal amount borrowed pursuant to the Credit Agreement will be due on March 31, 2014, or the Maturity Date. Prepayment of any amounts due under the Credit Agreement may be made at any time without penalty. The Credit Agreement terminates on the Maturity Date. The Company has not yet borrowed any amounts pursuant to the Credit Agreement.
John N. Hatsopoulos’ salary is $1.00 per year. On average, Mr. Hatsopoulos spends approximately 50% of his business time on the affairs of the Company; however such amount varies widely depending on the needs of the business and is expected to increase as the business of the Company develops.
On January 1, 2006, the Company entered into a Facilities and Support Services Agreement with American DG Energy for a period of one year, renewable annually on January 1st, by mutual agreement. That agreement was replaced by the Facilities, Support Services and Business Agreement between the Company and American DG Energy, effective July 1, 2012. Under this agreement, the Company provides American DG Energy with certain office and business support services and also provides pricing based on a volume discount depending on the level of American DG Energy purchases of cogeneration and chiller products. For certain sites, American DG Energy hires the Company to service its chiller and cogeneration products. The Company also provides office space and certain utilities to American DG Energy based on a monthly rate set at the beginning of each year. Also, under this agreement, American DG Energy has sales representation rights to the Company's products and services in New England.
The Company subleases portions of its corporate offices and manufacturing facility to sub-tenants under annual sublease agreements. For the three months ended March 31, 2013 and 2012, the Company received $36,275 and $148,197, respectively, from American DG Energy, Levitronix, and Alexandros Partners. In addition, for the three months ended March 31, 2013 and 2012 the Company received from the same companies, $22,833 and $165,755, respectively, to offset common operating expenses incurred in the administration and maintenance of its corporate office and warehouse facility.
The Company’s headquarters are located in Waltham, Massachusetts, and consist of 27,000 square feet of office and storage space that are shared with American DG Energy and other tenants. The lease expires on March 31, 2024. We believe that our facilities are appropriate and adequate for our current needs.
Revenue from sales of cogeneration and chiller systems, parts and service to American DG Energy during the three months ended March 31, 2013 and 2012 amounted to $225,605 and $357,360, respectively. In addition, Tecogen pays certain operating expenses, including benefits and insurance, on behalf of American DG Energy. Tecogen was reimbursed for these costs. As of March 31, 2013, the total amount due to American DG Energy was $760,535. As of December 31, 2012 the total amount due from American DG Energy was $70,811.
On March 14, 2013, the Company received a prepayment for future 2013 purchases of modules, parts, and service from American DG Energy in the amount of $827,747. The Company will provide a discount on these prepaid purchases equal to 6% per annum on deposit balances. As of March 31, 2013, the principal balance on this prepayment was $826,822 and is included in due to related party in the accompanying condensed consolidated balance sheet.
Note 8 – Fair value measurements
The fair value topic of the FASB Accounting Standards Codification defines fair value as the exchange price that would be received for an asset or paid to transfer a liability (an exit price) in the principal or most advantageous market for the asset or liability in an orderly transaction between market participants on the measurement date. The accounting guidance also establishes a fair value hierarchy, which requires an entity to maximize the use of observable inputs, where available, and minimize the use of unobservable inputs when measuring fair value. There are three levels of inputs that may be used to measure fair value:
Level 1 - Unadjusted quoted prices in active markets for identical assets or liabilities. We currently do not have any Level 1 financial assets or liabilities.
| F-40 |
Level 2 - Observable inputs other than quoted prices included in Level 1. Level 2 inputs include quoted prices for identical assets or liabilities in non-active markets, quoted prices for similar assets or liabilities in active markets and inputs other than quoted prices that are observable for substantially the full-term of the asset or liability.
Level 3 - Unobservable inputs reflecting management’s own assumptions about the input used in pricing the asset or liability. We currently do not have any Level 3 financial assets or liabilities.
The Company determines the fair value of certificates of deposits using information provided by the issuing bank, which includes discounted expected cash flow estimates using current market rates offered for deposits with similar remaining maturities.
| March 31, 2013 | Quoted Prices in Active Markets (Level 1) | Significant Other Observable Inputs (Level 2) | Significant Unobservable Inputs (Level 3) | |||||||||||||
| Assets | ||||||||||||||||
| Certificates of deposit | $ | 182,061 | — | $ | 182,061 | — | ||||||||||
| Total Assets | $ | 182,061 | $ | — | $ | 182,061 | $ | — | ||||||||
The Company’s financial instruments that are not recorded at fair value on a recurring basis include cash and cash equivalents, accounts receivable, accounts payable, capital lease obligations, and notes due from related party convertible debentures. The recorded values of cash and cash equivalents, accounts receivable, and accounts payable approximate their fair values based on their short-term nature. At March 31, 2013, the carrying value on the consolidated balance sheet of the debentures and capital lease obligations approximates fair value based on current market rates for instruments with similar maturities adjusted for applicable credit risk, which are Level 2 inputs.
Note 9 - Asset acquisition
On January 9, 2013, the Company purchased certain assets, both tangible and intangible, required to manufacture the generator used in its InVerde product from Danotek Motion Technologies. The aggregate consideration paid by the Company was $497,500, of which $199,230 represents the estimated fair value of machinery and equipment, which is depreciated over useful lives ranging from five to fifteen years. The fair value of the machinery and equipment was estimated utilizing a replacement cost method. The balance of $298,270 is included in intangible assets, net, in the accompanying condensed consolidated balance sheet. Acquisition related costs were not material to the financial statements and were expensed as incurred to general and administrative expenses.
This transaction was accounted for under the purchase method of accounting in accordance with FASB ASC Topic 805, Business Combinations. Under the purchase method of accounting, the total preliminary purchase price has been allocated to the net tangible and intangible assets acquired based on various preliminary estimates of their values by the Company's management. Management's estimates and assumptions are subject to change upon the finalization of the valuation and may be adjusted. The purchase price allocation is not finalized. Valuations of intangible assets, intellectual property, and know-how have not been completed. There is one reporting unit within the Company.
Under the purchase method of accounting, an acquisition is recorded as of the closing date, reflecting the purchased assets at their acquisition date fair values. Intangible assets that are identifiable are recognized separately from goodwill, which is measured and recognized as the excess of the fair value, as a whole, over the net amount of the recognized identifiable assets acquired.
The preliminary allocation of the purchase price for accounting purposes was based upon preliminary estimates and assumptions that are subject to change upon the finalization of the valuations.
Note 10 – Subsequent events
The Company’s common stock was split one-for-four effective May 17, 2013. All per share data and common stock information have been restated to reflect this split.
The Company has evaluated subsequent events through the date of this report and determined that no additional subsequent events occurred that would require recognition in the consolidated financial statements or disclosure in the notes thereto.
| F-41 |
PART II - INFORMATION NOT REQUIRED IN PROSPECTUS
| ITEM 13. | OTHER EXPENSES OF ISSUANCE AND DISTRIBUTION. |
The following table sets forth our expenses in connection with this registration statement. All such amounts are estimates, other than the fees payable to the SEC, the Financial Industry Regulatory Authority, Inc. (“FINRA”), and the NASDAQ Capital Market.
| Amount | ||||
| SEC registration fee | $ | 3,410 | ||
| FINRA filing fee | 4,250 | |||
| NASDAQ Capital Market listing fee | 5,000 | |||
| Legal fees and expenses | * | |||
| Accounting fees and expenses | * | |||
| Blue Sky fees and expenses | * | |||
| Transfer Agent’s fees and expenses | * | |||
| Printing and miscellaneous | * | |||
| Total | $ | * | ||
* To be filed by amendment.
| ITEM 14. | INDEMNIFICATION OF DIRECTORS AND OFFICERS. |
Section 102 of the Delaware General Corporation Law allows a corporation to eliminate the personal liability of directors of a corporation to the corporation or its stockholders for monetary damages for a breach of fiduciary duty as a director, except where the director breached his duty of loyalty, failed to act in good faith, engaged in intentional misconduct or knowingly violated a law, authorized the payment of a dividend or approved a stock repurchase in violation of Delaware corporate law, or obtained an improper personal benefit. We have included such a provision in our amended and restated charter.
Section 145 of the Delaware General Corporation Law provides that a corporation has the power to indemnify a director, officer, employee, or agent of the corporation and certain other persons serving at the request of the corporation in related capacities against amounts paid and expenses incurred in connection with an action or proceeding to which he or she is or is threatened to be made a party by reason of such position, if such person shall have acted in good faith and in a manner he reasonably believed to be in or not opposed to the best interests of the corporation, and, in any criminal proceeding, if such person had no reasonable cause to believe his conduct was unlawful; provided that, in the case of actions brought by or in the right of the corporation, no indemnification shall be made with respect to any matter as to which such person shall have been adjudged to be liable to the corporation unless and only to the extent that the adjudicating court determines that such indemnification is proper under the circumstances.
Our amended and restated charter includes a provision that eliminates the personal liability of our directors for monetary damages for breach of fiduciary duty as a director, except for liability:
| • | for any breach of the director’s duty of loyalty to the Company or its stockholders; |
| • | for acts or omissions not in good faith or that involve intentional misconduct or a knowing violation of law; |
| • | under section 174 of the Delaware General Corporation Law regarding unlawful dividends and stock purchases; or |
| • | for any transaction from which the director derived an improper personal benefit. |
Our amended and restated charter also provides that:
| • | we must indemnify our directors and officers to the fullest extent permitted by Delaware law; |
| • | we may, to the extent authorized from time to time by our Board of Directors, indemnify our other employees and agents to the same extent that we indemnified our officers and directors; and |
| • | in the event we do not assume the defense in a legal proceeding, we must advance expenses, as incurred, to our directors and executive officers in connection with a legal proceeding to the fullest extent permitted by Delaware law. |
| II - 1 |
The indemnification provisions contained in our amended and restated charter and bylaws are not exclusive of any other rights to which a person may be entitled by law, agreement, vote of stockholders, or disinterested directors or otherwise.
In addition to the indemnification provided for in our restated charter and bylaws, we intend to enter into indemnification agreements with each of our directors and executive officers. Each indemnification agreement will provide that we will indemnify the director or executive officer to the fullest extent permitted by law for claims arising in his or her capacity as our director, officer, employee, or agent, provided that he or she acted in good faith and in a manner that he or she reasonably believed to be in, or not opposed to, our best interests and, with respect to any criminal proceeding, had no reasonable cause to believe that his or her conduct was unlawful. In the event that we do not assume the defense of a claim against a director or executive officer, we are required to advance his or her expenses in connection with his or her defense, provided that he or she undertakes to repay all amounts advanced if it is ultimately determined that he or she is not entitled to be indemnified by us.
Insofar as indemnification for liabilities arising under the Securities Act may be permitted to directors, officers, or persons controlling our Company pursuant to the foregoing provisions, the opinion of the SEC is that such indemnification is against public policy as expressed in the Securities Act and is therefore unenforceable.
In addition, we may maintain insurance on behalf of our directors and executive officers insuring them against any liability asserted against them in their capacities as directors or officers or arising out of such status.
| ITEM 15. | RECENT SALES OF UNREGISTERED SECURITIES. |
Set forth below is information regarding common stock issued, warrants issued, and stock options granted by the Company during fiscal years 2010 through 2012. Also included is the consideration, if any, we received and information relating to the section of the Securities Act, or rule of the SEC, under which exemption from registration was claimed.
Common Stock and Warrants
On March 26, 2010, the Company raised $142,500 through the exercise of 118,750 warrants of common stock at a price of $1.20 per share. The warrant exercise was done by three accredited investors representing 1.0% of the total shares then outstanding. Prior to this transaction the company had 11,628,936 shares of common stock outstanding. Included in those shares are 56,250 shares to George N. Hatsopoulos, 56,250 shares to John N. Hatsopoulos, and 6,250 shares to Ravinder K. Sakhuja. Such transactions were exempt from registration under Section 4(a)(2) of the Securities Act and/or under Rule 506 of Regulation D.
On October 20, 2010, the Company raised $1,211,250 in a private placement of 466,866 shares of common stock at a price of $2.60 per share. The private placement was done exclusively by eight accredited investors, representing 4.0% of the total shares then outstanding. Prior to this transaction the company had 11,747,686 shares of common stock outstanding. Included in those shares are 192,308 shares to Nettlestone Enterprises Limited, 192,308 shares to RBC cees Nominees Ltd, 37,500 shares to Stephen B. Brodeaur, 25,000 shares to Kenneth G. Eisner, 6,250 shares to Ernest Aloi and Joseph Aloi, 6,250 shares to Ernest Aloi and Catherine Aloi, and 6,250 shares to Ernest Aloi and Karen Mauro. Such transactions were exempt from registration under Section 4(a)(2) of the Securities Act and/or under Rule 506 of Regulation D.
On June 10, 2011, the Company raised $666,075 in a private placement of 256,183 shares of common stock at a price of $2.60 per share. The private placement was done exclusively by twelve accredited investors, representing 2.1% of the total shares then outstanding. Prior to this transaction the company had 12,232,762 shares of common stock outstanding. Included in those shares are 192,308 shares to the Southern California Gas Company, 25,000 shares to Giordano Venzi, 5,000 shares to Ioannis Retsos, 5,000 shares Vasileios Kakoulidis, 5,000 shares to Sandro Reginelli, 5,000 shares to Jean Skeparnias, 3,750 shares to Franco Venzi, 3,750 shares to Nicola Bianchi, 3,750 shares to Charlotte Maier, 3,750 shares to Fermin Alou, 2,500 shares to Stephano Venzi, and 1,375 shares to Athanasios Kyranis. Such transactions were exempt from registration under Section 4(a)(2) of the Securities Act and/or under Rule 506 of Regulation D.
On May 31, 2011, the Company raised $14,000 in a private placement of 5,000 shares of common stock at a price of $2.80 per share. The private placement was done by Michael Zuk, Jr. & Gayle Line Zuk JTWROS, an accredited investor representing 0.04% of the total shares then outstanding. Prior to this transaction the company had 12,488,945 shares of common stock outstanding. Such transaction was exempt from registration under Section 4(a)(2) of the Securities Act and/or under Rule 506 of Regulation D.
| II - 2 |
On September 24, 2011, holders of the Company’s convertible debentures elected to convert accrued interest of $72,959, into 36,480 shares of common stock at a conversion price of $2.00 per share. The conversion was done exclusively by three accredited investors, representing 0.3% of the total shares then outstanding. Prior to this transaction the company had 12,543,945 shares of common stock outstanding. Included in those shares are 6,474 shares to George N. Hatsopoulos, 15,003 shares to Paris and Aliki Nikolaidis, trustees for the John N. Hatsopoulos 1989 Family Trust for the benefit of Nia Marie Hatsopoulos, and 15,003 shares to Paris and Aliki Nikolaidis, trustees for the John N. Hatsopoulos 1989 Family Trust for the benefit of Alexander John Hatsopoulos. Such transaction was exempt from registration under Section 3(a)(9) of the Securities Act and/or under Rule 506 of Regulation D.
On November 30, 2011, the Company raised $2,937,750 in a private placement of 918,047 shares of common stock at a price of $3.20 per share. The private placement represented 7.3% of the total shares then outstanding and was sold exclusively to three accredited investors. Prior to this transaction the company had 12,580,424 shares of common stock outstanding. Included in those shares are 711,797 shares to RBC cees Nominees Limited, 156,250 shares to Nettlestone Enterprises Limited, and 50,000 shares to Jeremy Benjamin. Such transactions were exempt from registration under Section 4(a)(2) of the Securities Act and/or under Rule 506 of Regulation D.
On May 24, 2012, the Company raised $480,000 in a private placement of 150,000 shares of common stock at a price of $3.20 per share. The private placement represented 1.1% of the total shares then outstanding and was sold exclusively to three accredited investors. Prior to this transaction the company had 13,498,471 shares of common stock outstanding. Included in those shares are 62,500 shares to Bruno Meier, 25,000 shares to Hans Schopper, and 62,500 shares to Pictet Bank & Trust. Such transactions were exempt from registration under Section 4(a)(2) of the Securities Act and/or under Rule 506 of Regulation D.
On September 30, 2012, certain holders of the debentures converted the principal amount of $100,000 and accrued interest in the amount of $6,100 into 85,240 shares of the Company’s common stock. The conversion was done by a related party representing 0.6% of the total shares then outstanding. Prior to this transaction the company had 13,648,471 shares of common stock outstanding. Included in those shares are 42,620 shares to Paris and Aliki Nikolaidis, trustees for the John N. Hatsopoulos Family Trust for the benefit of Nia Marie Hatsopoulos and 42,620 shares to Paris and Aliki Nikolaidis, trustees for the John N. Hatsopoulos Family Trust for the benefit of Alexander John Hatsopoulos. Such transaction was exempt from registration under Section 3(a)(9) of the Securities Act and/or under Rule 506 of Regulation D.
On December 3, 2012, the Company raised $200,000 in a private placement of 62,500 shares of common stock at a price of $3.20 per share. The private placement was done by Bruno Meier, an accredited investor representing 0.5% of the total shares then outstanding. Prior to this transaction the company had 13,733,711 shares of common stock outstanding. Such transaction was exempt from registration under Section 4(a)(2) of the Securities Act and/or under Rule 506 of Regulation D.
Restricted Stock Grants
On September 15, 2010, the Company made restricted stock grants to three employees, permitting them to purchase an aggregate of 19,211 shares of common stock at a price of $0.004 per share. Such transactions were exempt from registration under Section 4(a)(2) of the Securities Act.
On June 20, 2011, the Company made a restricted stock grant to an employee, granting him the right to purchase an aggregate of 50,000 shares of common stock at a price of $0.004 per share. Such transaction was exempt from registration under the Securities Act under Section 4(a)(2).
Stock Options
On February 18, 2010, the Company granted nonqualified options to purchase 25,000 shares of common stock to one employee at $2.60 per share. The grant of such options was exempt from registration under Rule 701 under the Securities Act.
On February 15, 2011, the Company granted nonqualified options to purchase 480,250 shares of the common stock to 28 employees at $2.60 per share. The grant of such options was exempt from registration under Rule 701 under the Securities Act.
No underwriters were involved in the foregoing sales of securities. All purchasers represented to us in connection with their purchase that they were accredited investors and made other customary investment representations. All of the foregoing securities were deemed restricted securities when granted for purposes of the Securities Act.
| II - 3 |
| ITEM 16. | EXHIBITS. |
The exhibits to the Registration Statement are listed in the Exhibit Index attached hereto and incorporated by reference herein.
| ITEM 17. | UNDERTAKINGS. |
| (h) | Insofar as indemnification for liabilities arising under the Securities Act may be permitted to directors, officers, and controlling persons of the registrant pursuant to the foregoing provisions, or otherwise, the registrant has been advised that in the opinion of the SEC such indemnification is against public policy as expressed in the Securities Act and is, therefore, unenforceable. In the event that a claim for indemnification against such liabilities (other than the payment by the registrant of expenses incurred or paid by a director, officer, or controlling person of the registrant in the successful defense of any action, suit or proceeding) is asserted by such director, officer, or controlling person in connection with the securities being registered, the registrant will, unless in the opinion of its counsel the matter has been settled by controlling precedent, submit to a court of appropriate jurisdiction the question whether such indemnification by it is against public policy as expressed in the Securities Act and will be governed by the final adjudication of such issue. |
| (i) | The undersigned registrant hereby undertakes that: |
| (1) | For purposes of determining any liability under the Securities Act, the information omitted from the form of prospectus filed as part of this registration statement in reliance upon Rule 430A and contained in a form of prospectus filed by the registrant pursuant to Rule 424(b)(1) or (4) or 497(h) under the Securities Act shall be deemed to be part of this registration statement as of the time it was declared effective. |
| (2) | For the purpose of determining any liability under the Securities Act, each post-effective amendment that contains a form of prospectus shall be deemed to be a new registration statement relating to the securities offered therein, and the offering of such securities at that time shall be deemed to be the initial bona fide offering thereof. |
| II - 4 |
SIGNATURES
Pursuant to the requirements of the Securities Act of 1933, the registrant has duly caused this registration statement on Form S-1 to be signed on its behalf by the undersigned, thereunto duly authorized, in Waltham, Massachusetts, on June 3, 2013.
| TECOGEN INC. | |
| By: /s/ John N. Hatsopoulos | |
| John N. Hatsopoulos | |
| Chief Executive Officer |
POWER OF ATTORNEY AND SIGNATURES
The undersigned officers and directors of the Company hereby constitute and appoint John N. Hatsopoulos and Bonnie J. Brown, and each of them singly, with full power of substitution, our true and lawful attorneys-in-fact and agents to take any actions to enable the Company to comply with the Securities Act and any rules, regulations, and requirements of the SEC in connection with this registration statement on Form S-1, including the power and authority to sign for us in our names in the capacities indicated below any and all further amendments to this registration statement and any other registration statement filed pursuant to the provisions of Rule 462 under the Securities Act.
Pursuant to the requirements of the Securities Act of 1933, this registration statement on Form S-1 has been signed by the following persons in the capacities and on the dates indicated.
| Signature | Title | Date | ||
| /s/ Angelina M. Galiteva | Chairman of the Board | June 3, 2013 | ||
| Angelina M. Galiteva | ||||
| /s/ John N. Hatsopoulos | Chief Executive Officer (Principal Executive Officer) | June 3, 2013 | ||
| John N. Hatsopoulos | & Director | |||
| /s/ Bonnie J. Brown | Chief Financial Officer (Principal Financial | June 3, 2013 | ||
| Bonnie J. Brown | and Accounting Officer) | |||
| /s/ George N. Hatsopoulos | Director | June 3, 2013 | ||
| George N. Hatsopoulos | ||||
| /s/ Charles T. Maxwell | Director | June 3, 2013 | ||
| Charles T. Maxwell | ||||
| /s/ Ahmed F. Ghoniem | Director | June 3, 2013 | ||
| Ahmed F. Ghoniem | ||||
| /s/ Joseph E. Aoun | Director | June 3, 2013 | ||
| Joseph E. Aoun |
EXHIBIT INDEX
| Exhibit | ||
| Number | Description | |
| 1.1** | Underwriting Agreement. | |
| 3.1 | Amended and Restated Certificate of Incorporation (incorporated by reference to the registrant’s Registration Statement on Form S-1, as amended, originally filed with the SEC on December 22, 2011 (Registration No. 333 178697)). | |
| 3.2 | Certificate of Amendment to Amended and Restated Certificate of Incorporation (incorporated by reference to the registrant’s Current Report on Form 8-K, dated May 17, 2013). | |
| 3.3 | Amended and Restated Bylaws (incorporated by reference to the registrant’s Registration Statement on Form S-1, as amended, originally filed with the SEC on December 22, 2011 (Registration No. 333 178697)). | |
| 4.1 | Specimen Common Stock Certificate of Tecogen Inc. (incorporated by reference to the registrant’s Registration Statement on Form S-1, as amended, originally filed with the SEC on December 22, 2011 (Registration No. 333 178697)). | |
| 4.2 | Form of Restricted Stock Purchase Agreement (incorporated by reference to the registrant’s Registration Statement on Form S-1, as amended, originally filed with the SEC on December 22, 2011 (Registration No. 333 178697)). | |
| 4.3+ | Form of Stock Option Agreement (incorporated by reference to the registrant’s Registration Statement on Form S-1, as amended, originally filed with the SEC on December 22, 2011 (Registration No. 333 178697)). | |
| 4.4+ | Indenture and Form of 6% Convertible Debenture Due 2004, dated September 24, 2001 (incorporated by reference to the registrant’s Registration Statement on Form S-1, as amended, originally filed with the SEC on December 22, 2011 (Registration No. 333 178697)). | |
| 5.1** | Opinion of Sullivan & Worcester LLP. | |
| 10.4+ | Tecogen Inc. 2006 Stock Incentive Plan, as amended on November 10, 2011 (incorporated by reference to the registrant’s Registration Statement on Form S-1, as amended, originally filed with the SEC on December 22, 2011 (Registration No. 333 178697)). | |
| 10.5 | Form of Tecogen Inc. Subscription Agreement for private placement of Common Stock (incorporated by reference to the registrant’s Registration Statement on Form S-1, as amended, originally filed with the SEC on December 22, 2011 (Registration No. 333 178697)). | |
| 10.6# | Facilities and Support Services Agreement between American DG Energy Inc. and Tecogen Inc., dated July 1, 2012 (incorporated by reference to the registrant’s Registration Statement on Form S-1, as amended, originally filed with the SEC on December 22, 2011 (Registration No. 333 178697)). | |
| 10.7# | General Motors LLC, Customer Care and Aftersales Agreement, dated November 15, 2011 (incorporated by reference to the registrant’s Registration Statement on Form S-1, as amended, originally filed with the SEC on December 22, 2011 (Registration No. 333 178697)). | |
| 10.8 | Lease Agreement between Atlantic-Waltham Investment II, LLC, and Tecogen Inc., dated May 14, 2008 (incorporated by reference to the registrant’s Registration Statement on Form S-1, as amended, originally filed with the SEC on December 22, 2011 (Registration No. 333 178697)). | |
| 10.9+ | Demand Note Agreement with John N. Hatsopoulos (incorporated by reference to the registrant’s Registration Statement on Form S-1, as amended, originally filed with the SEC on December 22, 2011 (Registration No. 333 178697)). | |
| 10.10 | Form of Sales Representative Agreement (incorporated by reference to the registrant’s Registration Statement on Form S-1, as amended, originally filed with the SEC on December 22, 2011 (Registration No. 333 178697)). |
| 10.11# | Asset Purchase Agreement with Danotek (assignment for the benefit of creditors), LLC, dated January 8, 2013 (incorporated by reference to the registrant’s Registration Statement on Form S-1, as amended, originally filed with the SEC on December 22, 2011 (Registration No. 333 178697)). | |
| 10.12# | Exclusive License Agreement between Tecogen Inc. and the Wisconsin Alumni Research Foundation, dated February 5, 2007 (incorporated by reference to the registrant’s Registration Statement on Form S-1, as amended, originally filed with the SEC on December 22, 2011 (Registration No. 333 178697)). | |
| 10.13# | Sales Representative Agreement between American DG Energy Inc. and Ilios Dynamics, dated October 20, 2009 (incorporated by reference to the registrant’s Registration Statement on Form S-1, as amended, originally filed with the SEC on December 22, 2011 (Registration No. 333 178697)). | |
| 10.14 | Revolving Line of Credit Agreement, dated March 25, 2013, between Tecogen Inc. and John N. Hatsopoulos (incorporated by reference to the registrant’s Current Report on Form 8-K, dated March 25, 2013). | |
| 21.1 | List of subsidiaries (incorporated by reference to the registrant’s Registration Statement on Form S-1, as amended, originally filed with the SEC on December 22, 2011 (Registration No. 333 178697)). | |
| 23.1* | Consent of McGladrey LLP. | |
| 23.2** | Consent of Sullivan & Worcester LLP (included in the opinion filed as Exhibit 5.1). | |
| 24.1* | Power of Attorney (included on signature page). |
| * | Filed herewith. |
| ** | To be filed by amendment. |
| # | Confidential Treatment has been granted for portions of this document. The confidential portions were omitted and filed separately, on a confidential basis, with the Securities and Exchange Commission. |
| + | Management contract or compensatory plan or agreement. |