Attached files
| file | filename |
|---|---|
| 8-K - FORM 8-K - PATHEON INC | d547258d8k.htm |
| EX-99.1 - EX-99.1 - PATHEON INC | d547258dex991.htm |
 Patheon
Fiscal 2013 Second Quarter Results
June 3, 2013
Exhibit 99.2 |
 Forward-looking statements
1
This presentation contains forward-looking statements or information which reflect our
expectations regarding possible events, conditions, our future growth, results of
operations, performance, and business prospects and opportunities. All statements, other than statements of
historical fact, are forward-looking statements. Forward-looking statements
necessarily involve significant known and unknown risks, assumptions and uncertainties
that may cause our actual results in future periods to differ materially from those expressed or implied by such
forward-looking statements, including risks related to acquisitions and divestitures, our
operational excellence initiatives and transformation activities, our exposure to
complex production issues, our substantial financial leverage, international operations, competition, government
regulations, customer demand, potential environmental, health and safety liabilities, and
product liability claims. For additional information regarding risks and uncertainties
that could affect our business and our financial results, please see our Annual Report on Form 10-K for the
fiscal year ended October 31, 2012 and our subsequent filings with the U.S. Securities and
Exchange Commission and the Canadian Securities Administrators. Accordingly, you are
cautioned not to place undue reliance on forward-looking statements. These forward-looking statements
are made as of the date hereof, and except as required by law, we assume no obligation to
update or revise them to reflect new events or circumstances.
Use of Non-GAAP Financial Measures
Commencing with the first quarter of fiscal 2013, we revised our calculation of Adjusted
EBITDA to exclude stock-based compensation expense, consulting costs related to our
operational initiatives and purchase accounting adjustments. We believe that excluding these items from
Adjusted EBITDA better reflects our underlying performance. Based on the revisions to
the definition of Adjusted EBITDA, we have recast the presentation of Adjusted EBITDA
for prior periods to be consistent with the current period presentation. Our Adjusted EBITDA (as revised) is
now income (loss) from continuing operations before repositioning expenses, interest expense,
foreign exchange losses reclassified from other comprehensive income (loss),
refinancing expenses, acquisition and integration costs (including certain product returns and inventory write-
offs recorded in gross profit), gains and losses on sale of capital assets, income
taxes, asset impairment charges, depreciation and amortization, stock-based
compensation expense, consulting costs related to our operational initiatives, purchase accounting adjustments and other income
and expenses. "Adjusted EBITDA margin" is Adjusted EBITDA as a percentage of
revenues. Since Adjusted EBITDA is a non-GAAP measure that does not have a
standardized meaning, it may not be comparable to similar measures presented by other issuers. Readers are cautioned that
Adjusted EBITDA should not be construed as an alternative to net income (loss) determined in
accordance with U.S. GAAP as an indicator of performance. Adjusted EBITDA is used by
management as an internal measure of profitability. We have included Adjusted EBITDA because we
believe that this measure is used by certain investors to assess our financial performance
before non-cash charges and certain costs that we do not believe are reflective of
our underlying business. A reconciliation of Adjusted EBITDA to the closest U.S. GAAP measure is included in the
Appendix to this presentation.
|
 •
Revenue increased by 39.9% from prior year
–
Patheon standalone grew by 9.9% from prior year
•
Conversion to a gross profit increase of 67.6% from prior year
•
Adjusted EBITDA increase of $17.9 million from prior year
•
Transformation continues to yield benefits
–
Operational excellence initiatives being extended to manufacturing sites
in High Point, Tilburg and Mexico
Fiscal 2013 second quarter highlights
2 |
 Strengthen
core operations
Sell business
differently
Enter logical
adjacencies
Drive industry
consolidation
•
Transformation project –
operations,
procurement, pricing,
G&A –
paid for itself in
one year
•
Network rationalization
•
Improve customer
experience -
focus on
On Time Delivery (OTD)
and Right First Time
(RFT)
•
Improving margins
•
Commercial team to
focus on key accounts
•
Executive insights -
solicit key customer
feedback for business
positives and key
improvements
•
Accelerating revenue
growth
•
Banner acquisition
adds
proprietary
technologies and
products
•
Direct exposure to
emerging markets
(Latin America)
•
Top 10 CMOs are less than 50% of
market with remaining share divided
amongst 400 companies
•
Potentially 1/3 of companies could
exit, which we expect will help with
long-term pricing power
•
26 acquisitions in CMO & PDS space
in 2012
Strategy
3 |
 181.5
203.7
210.0
213.5
253.9
100
120
140
160
180
200
220
240
260
Q2 2012
Q3 2012
Q4 2012
Q1 2013
Q2 2013
Revenues increased by $72.4 million from prior year
Banner represented $54.6 million of the increase
Revenues
(U.S. $ in millions)
39.9% yr-yr revenue growth
4 |
 Gross profit
increased by $23.0 million from prior year Gross Profit
(U.S. $ in millions)
67.6% yr-yr gross profit growth
5
10
15
20
25
30
35
40
45
50
55
60
Q2 2012
Q3 2012
Q4 2012
Q1 2013
Q2 2013
34.0
55.5
55.4
42.4
57.0 |
 Adjusted EBITDA
increase of $17.9 million from prior year Adjusted EBITDA
(U.S. $ in millions)
6
Q2 2012
Q3 2012
Q4 2012
Q1 2013
Q2 2013
16.5
36.3
36.5
19.8
34.4
-15
-5
5
15
25
35
45 |
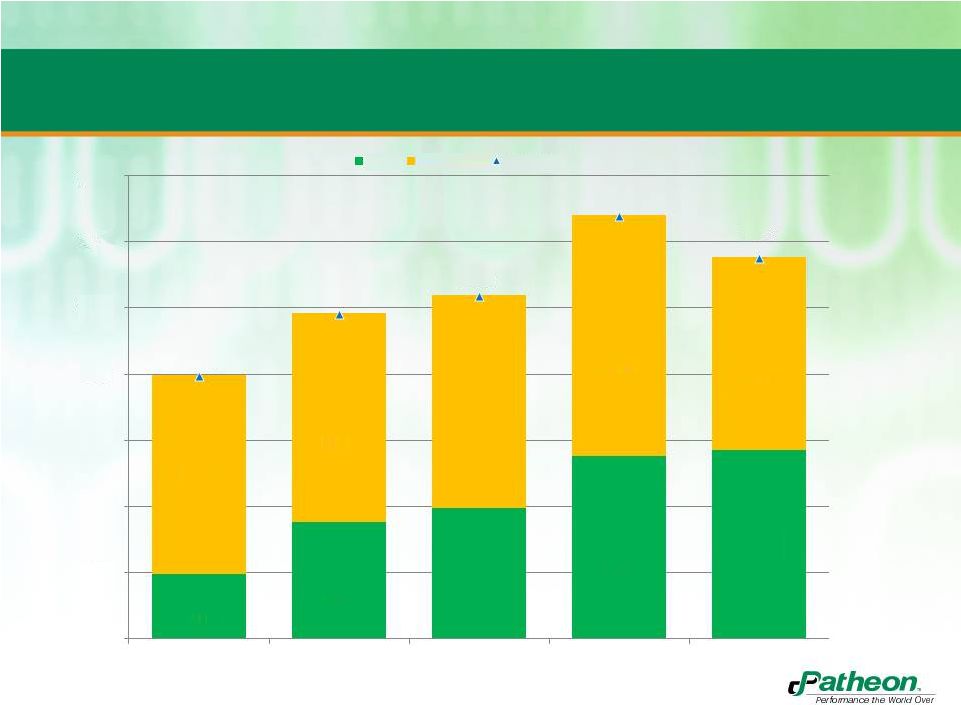 Strong liquidity
position 140.0
120.0
100.0
80.0
60.0
40.0
20.0
-
2Q12
3Q12
4Q12
1Q13
2Q13
79.7
60.1
19.6
98.4
63.0
35.4
103.8
64.4
39.4
128.1
115.3
72.7
58.2
55.4
57.1
Cash
Availability
Liquidity
7 |
 Summary
financial results Three months ended April 30
Statement of Operations
2013
2012
Change
(in millions of U.S. dollars)
$
$
$
Revenues
253.9
181.5
72.5
Gross Profit
57.0
34.0
23.0
Selling, general and administrative expenses
41.6
34.7
(6.9)
Operating income (loss)
7.2
(64.6)
71.8
Income (Loss) from continuing operations
0.1
(79.6)
79.7
Adjusted EBITDA
34.4
16.5
17.9
Balance Sheets
Q2 2013
Q4 2012
Cash and cash equivalents
57.1
39.4
Inventories
139.9
82.3
Intangible assets
73.5
-
Goodwill
45.5
3.5
Deferred tax liabilities (LT & ST)
56.0
23.0
Total debt (LT & ST)
603.1
313.1
Undrawn lines of credit
58.2
64.4
8 |
 •
Provide
industry
leading
customer
experience
–
Right
First
Time (RFT) and On Time Delivery (OTD)
•
Exceed industry growth rates
•
Complete Banner integration
•
Continue to improve financial results
–
Margin expansion
–
Free cash flow
–
Stock appreciation
2013 priorities
9 |
 Thank you
10 |
 Appendix
Adjusted EBITDA
(unaudited)
Q2 2012
Q3 2012
Q4 2012
Q1 2013
Q2 2013
(in millions of U.S. dollars)
$
$
$
$
$
(Loss) income from continuing operations
(79.6)
15.5
(23.0)
(51.4)
0.1
Depreciation and amortization
10.8
9.3
10.1
11.0
12.2
Repositioning expenses
6.0
0.1
(0.8)
4.0
2.5
Acquisition and integration costs
-
-
3.2
4.4
9.8
Interest expense, net
6.5
6.8
6.7
9.8
12.6
Impairment charge
57.9
-
-
10.1
-
Loss (gain) on sale of capital assets
-
-
0.4
(0.3)
(1.3)
Provision for (benefit from) income taxes
8.0
3.3
39.8
(0.2)
(6.2)
Refinancing expenses
-
-
-
29.1
0.1
Consulting
6.0
1.0
-
0.1
1.8
Stock compensation expense
0.8
0.7
0.6
0.8
0.9
Purchase accounting adjustments
-
-
-
2.9
2.1
Other expense (income), net
0.1
(0.4)
(0.5)
(0.5)
(0.2)
Adjusted EBITDA
16.5
36.3
36.5
19.8
34.4
11 |