Attached files
| file | filename |
|---|---|
| 8-K - 8-K - MID AMERICA APARTMENT COMMUNITIES INC. | d548937d8k.htm |
| EX-99.1 - EX-99.1 - MID AMERICA APARTMENT COMMUNITIES INC. | d548937dex991.htm |
 A
transformative combination creating the pre-eminent Sunbelt Multifamily REIT
June 2013
Exhibit 99.2 |
 Two
highly complementary multifamily REIT platforms coming together to establish
the pre-eminent Sunbelt multifamily REIT 100% all stock combination of
Mid-America Apartment Communities (NYSE: MAA) with Colonial Properties
Trust (NYSE: CLP) Fixed exchange ratio of 0.36x MAA shares for each CLP
share Pro forma ownership of approximately 56.2% MAA / 43.8% CLP
Transaction
consideration
Expected
close
Q3 2013
Corporate
name and
headquarters
MAA to retain its corporate name and ticker symbol (NYSE: MAA)
Memphis, TN
Management
& Board
Eric Bolton, Chairman & CEO
Al Campbell, EVP & CFO
Tom Grimes, EVP & COO
Ongoing support from CLP management in integration efforts
New MAA board will be composed of 12 directors, including 7 directors from MAA
board and 5 directors from CLP board
Gross G&A
synergies
Expected $25 million annual run rate
Dividend
MAA will maintain its quarterly dividend at an annual rate of $2.78 per
share Positioned to drive superior long-term investment returns to
capital 1 |
 Strategic rationale and transaction benefits
Higher efficiency in on-site product and service procurement in addition to
back-office and system platforms
Ability to further scale local and regional management operations
Cost elimination from duplicative public company costs and platform
Enhanced
margins and
synergy
opportunities
Leading Sunbelt footprint to drive superior deal flow and opportunistic new growth
opportunities
Superior cost of capital benefits over full cycle to enhance accretive capital
deployment opportunities
Platform
scale
drives
operating
cost
advantages
and
enhances
the
ability
to
attract
top
talent
Strengthened platform through integration of best practices of both
companies Enhanced
competitive
advantage
Enhanced
portfolio
strength
Second largest multifamily REIT by number of units
Improved diversification across high-growth region and markets
Enhanced ability to increase pro-active and opportunistic capital
re-cycling “Full cycle”
capital deployment and performance strategy strengthened
Improved investment grade metrics and limited near-term debt maturities
Larger scale enhances capital market opportunities
Long-term cost of capital benefits
Enhanced
balance sheet
Shared vision for success; enhanced platform to execute
2 |
 Combination of complementary portfolios to create market-leading platform
1
As of 5/31/13
2
Includes all multifamily properties, including operating, lease up, joint venture
communities 3
Multifamily assets weighted by 3/31/13 NOI
4
Represents multifamily portfolio occupancy as of 3/31/13
Formation date
Mid-America Apartments
Colonial Properties
New MAA
Equity market cap
($bn)
Age
3
Occupancy
January 1994
September 1993
Q3 2013
$3.0
$2.1
$5.1
168
117
285
15.4 yrs
14.5 yrs
15.0 yrs
96%
96%
96%
Total market cap
($bn)
1
$4.7
$3.9
$8.6
Units
49,591
35,181
84,772
Revenue / unit
$994
$966
$982
Communities
3
1
2
2
4 |
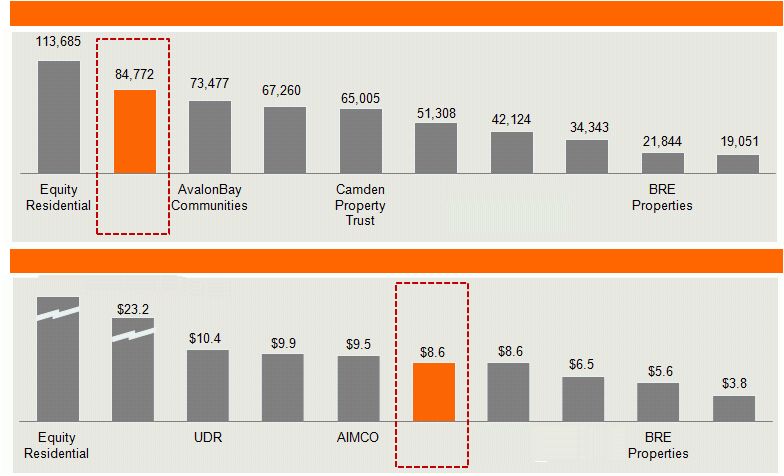 Second largest multifamily REIT by units with a market cap of over $8.6bn
Units
1
Total market capitalization ($bn)
2
Source: Company 1Q’13 Financial Supplements
1
As of 3/31/2013
2
As of 5/31/13
4
$33.8
New MAA
AIMCO
UDR
Essex
Property
Trust
Post
Properties
Home
Properties
AvalonBay
Communities
Essex
Property
Trust
New MAA
Home
Properties
Post
Properties
Camden
Property
Trust |
 Portfolio
distribution
by
total
units
Note: Other large markets includes 3 additional MSAs; Other secondary markets
includes 29 additional MSAs 1
Breakdown based on number of total multifamily 1Q’13 NOI, including operating,
lease-up and joint venture communities (at share) Continued commitment to a
portfolio strategy focused on high-growth markets across the Sunbelt region, allocated
across both large and secondary markets, to capture superior risk-adjusted
performance over full market cycles Distribution
by
secondary
markets
(38%
of
total)
Distribution by large markets (62% of total)
Alabama
Arizona
Arkansas
California
Florida
Georgia
Kentucky
Louisiana
Nevada
New Mexico
North Carolina
Oklahoma
South
Carolina
Tennessee
Texas
Virginia
Mississippi
2,000–5,000 units
Greater than 5,000 units
Less than 2,000 units
Missouri
Note: Includes all multifamily properties, including operating, lease up, joint
venture communities Enhanced diversification across high-growth Sunbelt
region Large markets
% of total Q1'13 NOI
1
Dallas / Fort Worth
11.7%
2
Atlanta
6.9%
3
Austin
6.4%
4
Raleigh
6.3%
5
Charlotte
5.8%
6
Nashville
4.9%
7
Jacksonville
4.6%
8
Tampa
4.0%
9
Orlando
3.9%
10
Houston
3.4%
Secondary markets
% of total Q1'13 NOI
1
Memphis
3.2%
2
Charleston
3.0%
3
Savannah
2.9%
4
Birmingham
2.4%
5
Richmond
2.2%
6
Jackson
2.0%
7
Greenville
1.6%
8
Columbus
1.6%
9
San Antonio
1.6%
10
Little Rock
1.5%
5
1
1
1 |
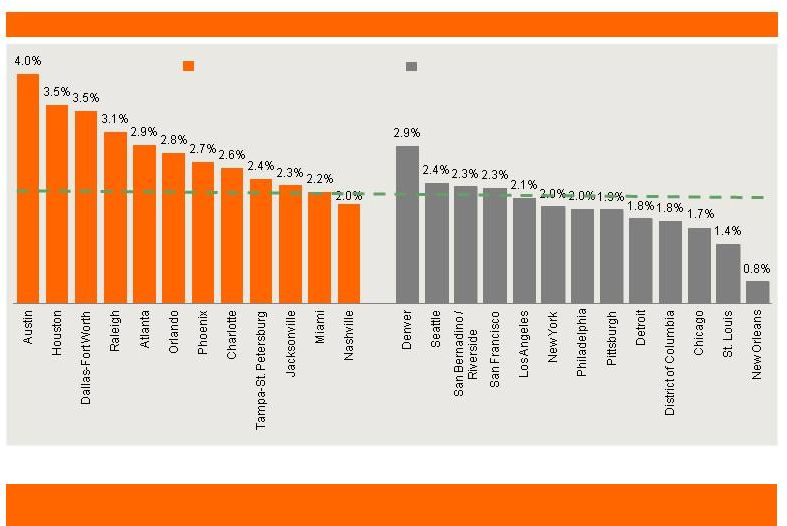 Significant presence in large, high growth markets
Source: Moody’s
Note: Highlighted markets represent 58.7% of New MAA’s multifamily portfolio
(weighted by units) U.S. average: 2.2%
Large markets with meaningful presence
MAA’s combined new, large markets are on a weighted average basis projected to
show 3.0% job growth over the next 5 years vs. U.S. average of 2.2%
Major non-MAA markets
6
5-year projected employment growth CAGR (%) |
 MAA’s two-tier market strategy has delivered stable, long-term
outperformance over the “full cycle”
MAA has generated higher average growth combined with lower volatility than
peers MAA
average: 2.8%
Peer
average: 2.6%
Source: Third party research
Note: Multifamily peers include BRE, CLP, CPT, ESS, HME, PPS, UDR
2009
trough: (5.1%)
2009
trough: (1.8%)
7
Same store NOI growth |
 New
MAA will have an enhanced large market focus across the Sunbelt region Top 10
markets by NOI 1Q’13 unit count by market
% of 1Q’13 same store NOI by market
1
2
3
4
5
6
7
8
9
10
MAA
DFW
Jacksonville
Nashville
Houston
Atlanta
Memphis
Austin
Tampa
Raleigh
Columbus
CLP
DFW
Charlotte
Raleigh
Austin
Atlanta
Orlando
Charleston
Savannah
Birmingham
Tampa
New MAA
DFW
Atlanta
Austin
Raleigh
Charlotte
Nashville
Jacksonville
Tampa
Orlando
Houston
49,591
35,181
84,772
Source: REIS
Markets with 5-year projected employment growth above national average
8
25,846
24,646
50,492
23,745
10,535
34,280 |
 Synergy and value creation potential through integration
Significant overlap in asset footprint creates potential for
margin improvement
Significant overlap in technology to drive and track
performance, leading to minimal business disruption
Opportunity to improve cost structure by leveraging a
combined business platform across a significantly larger
asset portfolio
Estimated total run-rate annual synergies of $25mm
Potential for additional synergies include improved debt
costs and opportunities for scale efficiencies
Strengthened platform through integration of best
practices of both companies
Market
Station
-
Kansas
City,
MO
Colonial
Grand
at
Double
Creek
-
Austin,
TX
9 |
 2
Q1 2013 dividend / share annualized
3
Excludes the write-off of original issuance costs for preferred shares
redeemed 4
Mid point of 2013E FFO / share guidance
MAA management’s proven record of disciplined capital deployment and
performance 359%
224%
211%
Note: Multifamily peers include AIV, AVB, BRE, CLP, CPT, EQR, ESS, HME, PPS,
UDR 1
20 day simple moving average
4
2
3
3
10
(20.0)%
30.0%
80.0%
130.0%
180.0%
230.0%
280.0%
330.0%
380.0%
05/30/03
05/29/04
05/29/05
05/30/06
05/30/07
05/30/08
05/30/09
05/30/10
05/31/11
05/30/12
05/31/13
MAA
MSCIUS REIT Index
Multifamily peers
Total
return
performance
10
years
1
$2.34 $2.34
$2.35
$2.38
$2.42
$2.46 $2.46 $2.46
$2.51
$2.64
$2.78
2003
2005
2007
2009
2011
2013E
Dividend / share
$2.87
$3.00
$3.20
$3.33
$3.55
$3.73
$3.79
$3.77
$3.98
$4.57
$4.87
2003
2005
2007
2009
2011
2013E
FFO / share
MAA dividend growth 10 years
MAA FFO growth 10 years
2004
2006
2008
2010
2012
2004
2006
2008
2010
2012
–
–
– |
 New
MAA will maintain a disciplined approach to development Expected stabilized
NOI yields between 6% and 8% Cost to
Cost to
Expected cost
Expected
MSA
Total units
date
complete
Total
Per unit ($000)
stabilization
MAA
River's Walk
Charleston
270
21.9
11.5
33.4
124
4Q14
1225 South Church Phase II
Charlotte
210
$26.3
$1.2
$27.5
$131
1Q14
Subtotal: MAA
774
$56.3
$45.0
$101.3
$131
CLP
CR at South End
Charlotte
353
31.7
27.6
59.3
168
4Q14
CG at Ayrsley (Phase II)
Charlotte
81
$5.4
$3.7
$9.1
$113
4Q13
CG at Randal Lakes
Orlando
462
24.2
32.8
57.0
123
1Q15
CG at Lake Mary (Phase III)
Orlando
132
2.4
13.7
16.1
122
3Q14
Subtotal: CLP
1,028
$63.7
$77.8
$141.5
$138
Total
1,802
$120.0
$122.8
$242.8
$135
220 Riverside
Jacksonville
294
8.1
32.3
40.4
137
4Q15
11
Active multifamily development pipeline ($mm, except per unit costs)
|
 New
MAA will continue to recycle capital into high quality properties in growth markets
Allure at Brookwood
Colonial Grand at Windemere
Legends at Lowe’s Farm
Colonial Reserve at Las Colinas
MAA purchase: Sept. 2011
MSA: Dallas, TX
Acquisition price: $47mm
Total units: 456
Year built: 2008
Occupancy: 95%
MAA purchased: July 2012
MSA: Atlanta, GA
Acquisition price: $64mm
Total units: 349
Year built: 2008
Occupancy: 94%
CLP purchase: March 2013
MSA: Orlando, FL
Acquisition price: $43mm
Total units: 280
Year built: 2009
Occupancy: 95%
CLP purchase: Nov. 2012
MSA: Dallas, TX
Acquisition price: $43mm
Total units: 306
Year built: 2006
Occupancy: 91%
12 |
 Total unencumbered assets to book value
Debt
/
LTM
EBITDA
Debt / gross assets
Debt / market capitalization
Secured debt / gross assets
LTM
fixed
charge
coverage
ratio
MAA
57.4%
6.5x
44.9%
36.2%
29.8%
4.3x
CLP
69.7%
7.7x
44.2%
45.6%
17.6%
2.5x
New MAA
63.7%
6.7x
44.5%
40.5%
23.6%
3.4x
Debt maturity profile ($mm)
Note: As of 3/31/13
2
Excludes pro rata share of unconsolidated joint venture debt
Strong investment grade balance sheet and manageable debt maturity profile
3%
14%
15%
8%
47%
%
maturing
13%
Credit metrics
Note: As of 3/31/13
1
Includes pro rata share of unconsolidated joint venture debt
2
New MAA EBITDA includes $25mm of synergies pro forma for the transaction
$511
$285
13
1
2
2
2 |
 Strong investment grade balance sheet -
capital structure profile
New MAA capital structure
Debt / market capitalization: 40.5%
Note: As of 3/31/13. Includes pro rata share of unconsolidated joint venture
debt Floating vs. fixed rate debt
Unsecured vs. secured debt
% of unencumbered assets
14 |
 Source: Company filings, SNL Financial
1
EBITDA includes $25mm of synergies pro forma for the transaction
Investment grade balance sheet metrics
Debt / gross assets
Debt / LTM EBITDA
Secured debt / gross assets
LTM fixed charge coverage ratio
15 |
| Strategy and long-term outlook
Optimize cash flow growth through “full-cycle”
Support growing and secure dividend
Deliver superior long-term risk-adjusted returns
Focus on high-growth Sunbelt markets
Prudent capital deployment practices
Proactive capital recycling program
Build competitive advantages in local markets
Limited and disciplined approach to development
Develop New MAA brand value
16 |
 Certain matters in this presentation may constitute forward-looking statements
within the meaning of Section 27-A of the
Securities
Act
of
1933
and
Section
21E
of
the
Securities
and
Exchange
Act
of
1934.
Such
statements
include,
but are not limited to, statements made about anticipated economic and market
conditions, expectations for future demographics, the impact of competition,
general changes in the apartment industry, expectations for acquisition and
joint venture performance, ability to pay dividends and the ability to obtain financing at reasonable rates. Actual
results
and
the
timing
of
certain
events
could
differ
materially
from
those
projected
in
or
contemplated
by
the
forward-looking statements due to a number of factors, including a downturn in
general economic conditions or the capital markets, competitive factors
including overbuilding or other supply/demand imbalances in some or all of our
markets, changes in interest rates and other items that are difficult to control
such as the impact of legislation, as well as the other general risks
inherent in the apartment and real estate businesses. Reference is hereby made to
the filings of Mid-America Apartment Communities, Inc., with the Securities and
Exchange Commission, including quarterly reports on Form 10-Q, reports
on Form 8-K, and its annual report on Form 10-K, particularly including the
risk factors contained in the latter filing.
Eric Bolton, MAA
CEO
901-248-4127
eric.bolton@maac.com
Al Campbell, MAA
CFO
901-248-4169
al.campbell@maac.com
Leslie Wolfgang, MAA
Investor Relations
901-248-4126
leslie.wolfgang@maac.com
Jennifer Patrick, MAA
Investor Relations
901-435-5371
jennifer.patrick@maac.com
http://ir.maac.com
Tom Lowder, CLP
CEO
205-250-8700
tlowder@colonialprop.com
Jerry Brewer, CLP
Executive Vice President
800-645-3917
jbrewer@colonialprop.com
17 |
| Additional Information about the Proposed Transaction and Where to Find
It In connection with the proposed transaction, MAA expects to file with the SEC a registration
statement on Form S-4 that will include a joint proxy statement of MAA and Colonial
Properties Trust that also constitutes a prospectus of MAA. MAA and Colonial Properties
Trust also plan to file other relevant documents with the SEC regarding the proposed
transaction. INVESTORS ARE URGED TO READ THE JOINT PROXY STATEMENT/PROSPECTUS AND OTHER
RELEVANT DOCUMENTS FILED WITH THE SEC IF AND WHEN THEY BECOME AVAILABLE, BECAUSE THEY WILL
CONTAIN IMPORTANT INFORMATION. You may obtain a free copy of the joint proxy
statement/prospectus (if and when it becomes available) and other relevant documents filed by
MAA and Colonial Properties Trust with the SEC at the SEC’s website at www.sec.gov.
Copies of the documents filed by MAA with the SEC will be available free of charge on MAA’s website
at www.maac.com or by contacting MAA Investor Relations at 901-682-6600. Copies of the
documents filed by Colonial Properties Trust with the SEC will be available free of charge on
Colonial Properties Trust’s website at www.colonialprop.com or by contacting Colonial
Properties Trust Investor Relations at 205-250-8700.
MAA and Colonial Properties Trust and their respective directors and executive officers and other
members of management and employees may be deemed to be participants in the solicitation of
proxies in respect of the proposed transaction. You can find information about MAA’s
executive officers and directors in MAA’s definitive proxy statement filed with the SEC on March 22,
2013. You can find information about Colonial Properties Trust’s executive officers and
directors in Colonial Properties Trust’s definitive proxy statement filed with the SEC on
March 13, 2013. Additional information regarding the interests of such potential
participants will be included in the joint proxy statement/prospectus and other relevant documents
filed with the SEC if and when they become available. You may obtain free copies of these
documents from MAA or Colonial Properties Trust using the sources indicated above. This document shall
not constitute an offer to sell or the solicitation of an offer to buy any securities, nor shall there be any sale
of securities in any jurisdiction in which such offer, solicitation or sale would be unlawful prior to
registration or qualification under the securities laws of any such jurisdiction. No offering
of securities shall be made except by means of a prospectus meeting the requirements of Section
10 of the U.S. Securities Act of 1933, as amended. |