Attached files
| file | filename |
|---|---|
| 8-K - 8-K - FIRST BANCORP /PR/ | d548811d8k.htm |
 Investor
Presentation Investor Presentation
June 2013
June 2013
Exhibit 99.1 |
 Disclaimer
2
This presentation contains “forward-looking statements” concerning First
BanCorp’s (the “Corporation”) future economic performance. The words or phrases
“would be,” “will allow,” “intends to,” “will likely
result,” “are expected to,” “expect,” “anticipate,” “look forward,” “should,” “believes” and similar expressions are
meant to identify “forward-looking statements” within the meaning of Section 27A
of the Private Securities Litigation Reform Act of 1995, and are subject to the safe
harbor created by such section. The Corporation wishes to caution readers not to place undue reliance on any such “forward-looking statements,” which
speak only as of the date made, and to advise readers that various factors, including, but not
limited to, uncertainty about whether the Corporation and FirstBank Puerto Rico
(“FirstBank” or “the Bank”) will be able to fully comply with the written agreement dated June 3, 2010 that the Corporation entered into with the
Federal Reserve Bank of New York (the “FED”) and the order dated June 2, 2010 (the
“Order”) that FirstBank entered into with the FDIC and the Office of the
Commissioner of Financial Institutions of Puerto Rico that, among other things, require
FirstBank to maintain certain capital levels and reduce its special mention,
classified, delinquent and non-performing assets; the risk of being subject to possible
additional regulatory actions; uncertainty as to the availability of certain funding
sources, such as retail brokered CDs; the Corporation’s reliance on brokered CDs and its ability to obtain, on a periodic basis, approval from the FDIC to
issue brokered CDs to fund operations and provide liquidity in accordance with the terms of
the Order; the risk of not being able to fulfill the Corporation’s cash
obligations or resume paying dividends to the Corporation’s stockholders in the future
due to the Corporation’s inability to receive approval from the FED to receive
dividends from FirstBank or FirstBank’s failure to generate sufficient cash flow to make a dividend payment to the Corporation; the strength or weakness of
the real estate markets and of the consumer and commercial credit sectors and their impact on
the credit quality of the Corporation’s loans and other assets, including the
Corporation’s construction and commercial real estate loan portfolios, which have contributed and may continue to contribute to, among other
things, the high levels of non-performing assets, charge-offs and the provision
expense and may subject the Corporation to further risk from loan defaults and
foreclosures; adverse changes in general economic conditions in the United States and in
Puerto Rico, including the interest rate scenario, market liquidity, housing absorption
rates, real estate prices and disruptions in the U.S. capital markets, which may reduce interest margins, impact funding sources and affect demand for
all of the Corporation’s products and services and the value of the Corporation’s
assets; an adverse change in the Corporation’s ability to attract new clients and
retain existing ones; a decrease in demand for the Corporation’s products and services
and lower revenues and earnings because of the continued recession in Puerto Rico and
the current fiscal problems and budget deficit of the Puerto Rico government; uncertainty about regulatory and legislative changes for financial
services companies in Puerto Rico, the United States and the U.S. and British Virgin Islands,
which could affect the Corporation’s financial performance and could cause the
Corporation’s actual results for future periods to differ materially from prior results and anticipated or projected results; uncertainty about the
effectiveness of the various actions undertaken to stimulate the United States economy and
stabilize the United States’ financial markets, and the impact such actions may
have on the Corporation’s business, financial condition and results of operations; changes in the fiscal and monetary policies and regulations of the
federal government, including those determined by the Federal Reserve System, the FDIC,
government-sponsored housing agencies and regulators in Puerto Rico and the U.S.
and British Virgin Islands; the risk of possible failure or circumvention of controls and procedures and the risk that the Corporation’s risk management
policies may not be adequate; the risk that the FDIC may further increase the deposit
insurance premium and/or require special assessments to replenish its insurance fund,
causing an additional increase in the Corporation’s non-interest expense; risks of not being able to recover the assets pledged to Lehman Brothers
Special Financing, Inc.; the impact on the Corporation’s results of operations and
financial condition associated with acquisitions and dispositions; a need to recognize
additional impairments on financial instruments or goodwill relating to acquisitions; risks that downgrades in the credit ratings of the Corporation’s long-
term senior debt will adversely affect the Corporation’s ability to access necessary
external funds; the impact of the Dodd-Frank Wall Street Reform and Consumer
Protection Act on the Corporation’s businesses, business practices and cost of
operations; and general competitive factors and industry consolidation. The
Corporation does not undertake, and specifically disclaims any obligation, to update any
“forward-looking statements” to reflect occurrences or unanticipated
events or circumstances after the date of such statements except as required by the federal
securities laws. Investors should refer to the Corporation’s Annual Report on Form
10-K for the year ended December 31, 2011 for a discussion of such factors and certain risks and uncertainties to which the Corporation is subject. |
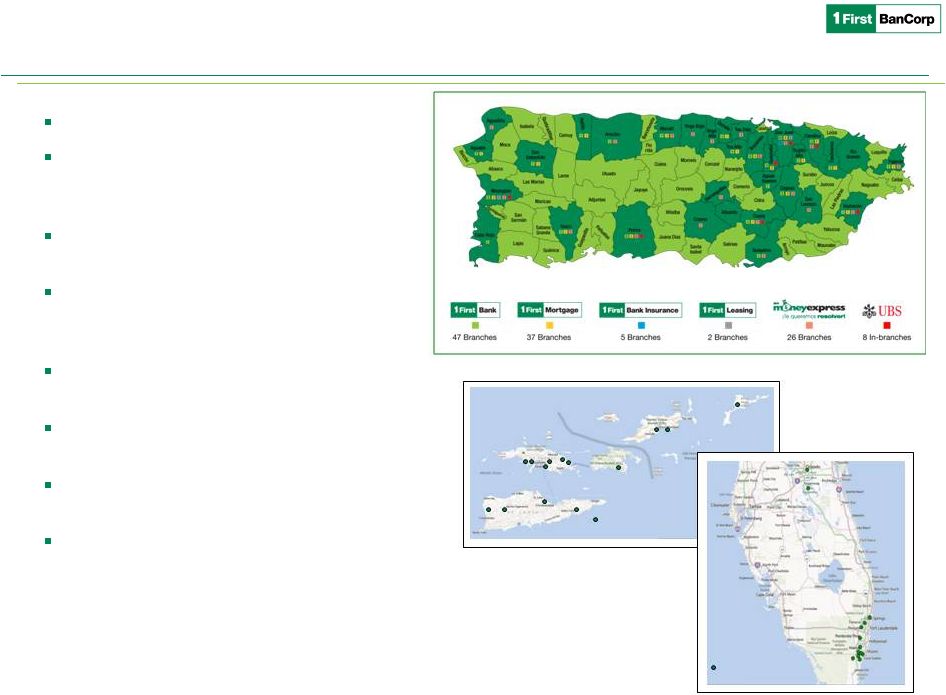 Franchise
Overview Founded in 1948 (65 years)
Headquartered in San Juan, Puerto Rico
with operations in PR, Eastern Caribbean
(Virgin Islands) and Florida
A well diversified operation with over
650,000 retail & commercial customers
2nd largest financial holding company in
Puerto Rico with attractive business mix
and substantial loan market share
The largest bank in the Virgin Islands with
over 40% market share
Small presence in Florida serving south
Florida region
151 ATM machines and largest ATM
network in the Eastern Caribbean Region
~2,500 FTE employees
As of March 31, 2013
Eastern Caribbean Region or ECR includes United States and British Virgin Islands
FTE = Full Time Equivalent
Well diversified with significant competitive strengths
3
Total Assets -
$13.0B
Total Loans -
$9.5B
13 bank branches
1 Loan Production Office
14 bank branches
3 First Express branches
Eastern Caribbean:
7% of Assets
Florida:
7% of Assets
Total Deposits -
$10.0B |
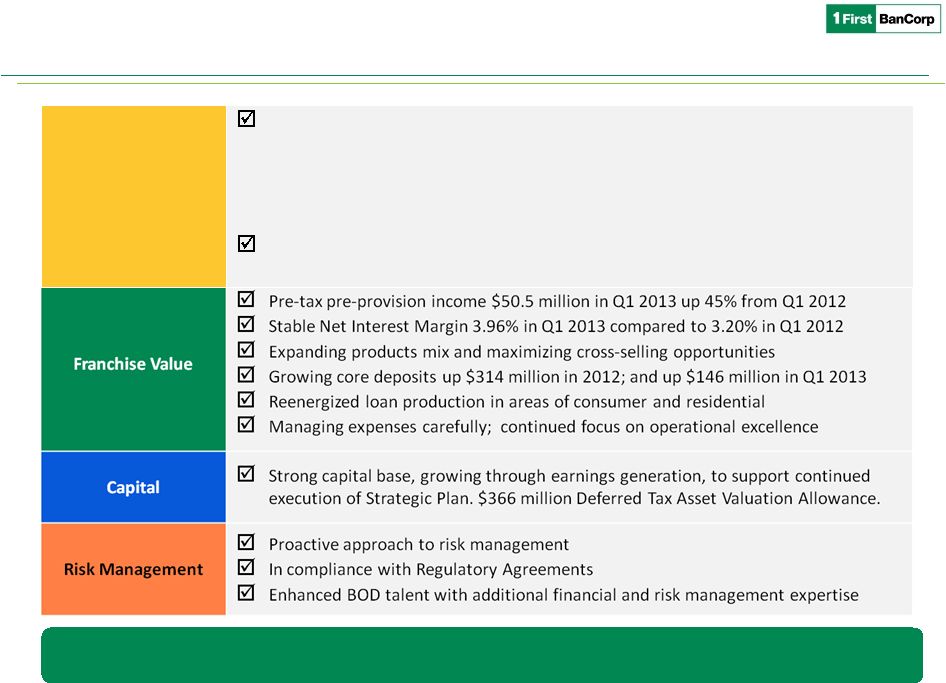 4
Core Franchise is Strong
Effectively executing Strategic Plan
Management focused on continued strengthening of the franchise and
solidifying its strong well-respected position in PR
Balance Sheet
Improving risk profile; focusing on reducing NPAs
Executing on opportunities to reduce cost of funds
•
NPAs decreased for the 12
consecutive quarter
•
NPAs down 18% year over year
•
Completed a bulk sale of adversely classified loans and OREO properties with
a book value of $217.7 million in Q1 2013
•
$2.0 billion brokered CDs maturing in twelve months at average rate of 1.39%
th |
 Franchise
Overview Unique challenger to Puerto Rico’s largest player
5
Puerto Rico Total Assets¹
Puerto Rico Total Loans¹
Puerto Rico Deposits, Net of Brokered¹
($ in millions)
Strong and uniquely positioned market
franchise in densely populated operating
footprints
Strong market share in loan portfolios
facilitates customer relationship expansion and
cross sell to increase deposit share
Puerto Rico
ECR
Florida
Banking Branches
47
14
13
Wholesale Banking
Retail Banking
Consumer Lending
2
Mortgage Banking
Insurance
Retail Brokerage
3
Wholesale Brokerage
4
1 Puerto Rico only; 2 FirstBank acquired the FirstBank-branded credit card portfolio of
$391MM book balance as of June 30, 2012; 3 Provided through alliance with UBS; 4 Established primarily for
municipal financing
Source: PR Market Share Report prepared with data provided by the Commissioner of Financial
Institutions of Puerto Rico as of 3/31/13. |
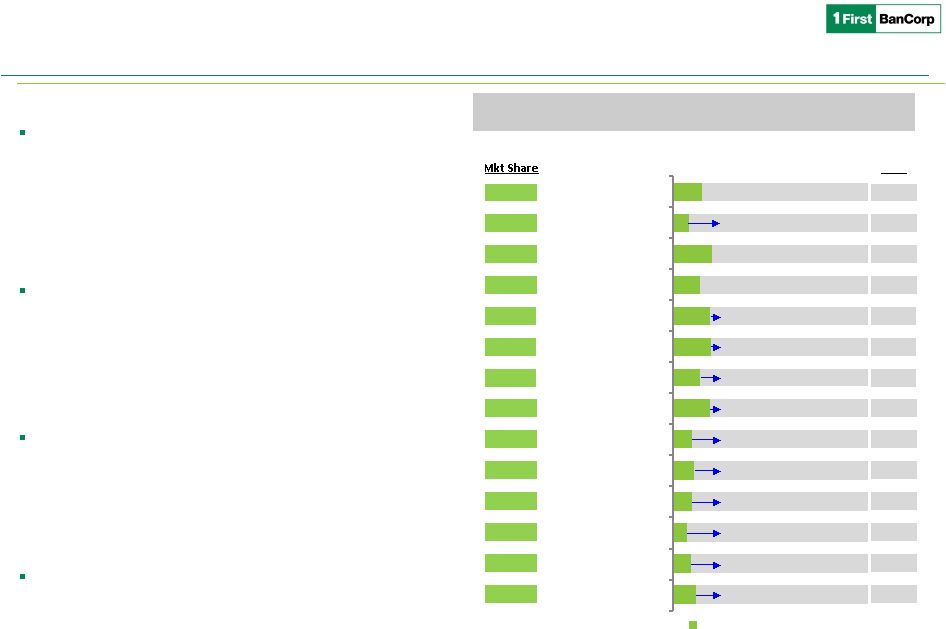 Dec-09
Mar-13
Rank
18%
2
9%
4
21%
2
17%
3
22%
2
16%
2
6%
4
20%
2
2%
6
3%
3
8%
4
5%
4
10%
4
10%
4
15%
8%
20%
14%
19%
20%
14%
19%
10%
11%
10%
7%
9%
12%
85%
92%
80%
86%
81%
80%
86%
81%
90%
89%
90%
93%
91%
88%
Assets
Personal Loans
Commercial Loans
Construction
Auto/Leasing
Small Personal Loans
Mortgage Originations
Credit Cards
ACH Transactions
POS Terminals
ATM Terminals
Debit Cards
Deposits
Branches
FirstBank
Building Franchise Value
Targeted strategies for growth
6
Market
Share
in
Main
Market
¹
Puerto Rico
Opportunities for ongoing market share gains on
selected products based on fair share of market
–
Largest opportunity on deposit products, electronic
banking & transaction services
–
Selected loan products growth for balanced
risk/return to manage risk concentration and
diversify income sources
Acquired FirstBank-branded credit card portfolio from
FIA Card Services, N.A.
–
Diversifies revenue stream and loan portfolio
composition
–
Opportunity to broaden and deepen relationships
Florida
Expansion prospects in Florida given long term
demographic trends
–
Continue focus in core deposit growth, commercial
and transaction banking and conforming residential
mortgages
Virgin Islands
Solidify leadership position by further increasing
customer share of wallet
1 Puerto Rico only
Source: Office of the Commissioner of Financial Institutions of Puerto Rico as of 3/31/13 and
internal reports; commercial loans include loans collateralized by real estate |
 Focus on Strategic
Plan Rebuild earnings and de-risk Balance Sheet
7
($ in millions, except per share results)
1Q 2013 Highlights
Adjusted net loss of $4.6 million, or $0.02 per diluted share, excluding the effect of the
bulk sale and loans transferred to held for sale
PTPP Improvement of $15.7 million compared to Q1 2012
NIM increased 76 basis points year-over-year, due to lower cost of funds and higher
yielding loan portfolio Completed a bulk sale of adversely classified loans and OREO
properties with a book value of $217.7 million for $120.2 million in an all cash
transaction Capital remains strong with total capital ratio, tier 1 and leverage of
17.4%, 16.2% and 12.1%, respectively Income Statement
1Q 2012
2Q 2012
3Q 2012
4Q 2012
1Q 2013
Net interest income, excluding valuations
101.6
$
108.2
$
125.3
$
125.2
$
124.1
$
Valuations
0.3
0.5
0.2
0.4
0.4
GAAP Net Interest Income
101.9
108.7
125.5
125.6
124.5
Provision for loan and lease losses
36.2
24.9
29.0
30.5
111.1
Non-interest income
14.7
16.5
17.3
20.1
19.1
Equity in (losses) gains of unconsolidated entities
(6.2)
(2.5)
(2.2)
(8.3)
(5.5)
Non-interest expense
85.2
86.9
91.8
90.9
98.0
Pre-tax net income (loss)
(11.0)
10.9
19.8
16.0
(71.0)
Income tax (expense) benefit
(2.1)
(1.5)
(0.8)
(1.5)
(1.6)
Net income (loss)
(13.1)
$
9.4
$
19.1
$
14.5
$
(72.6)
$
Adjusted Pre-tax pre-provision earnings
34.8
$
37.9
$
51.4
$
54.5
$
50.5
$
Net Interest Margin, (GAAP) (%)
3.20%
3.46%
3.98%
3.91%
3.96%
Net income (loss) per common share-basic
(0.06)
$
0.05
$
0.09
$
0.07
$
(0.35)
$
|
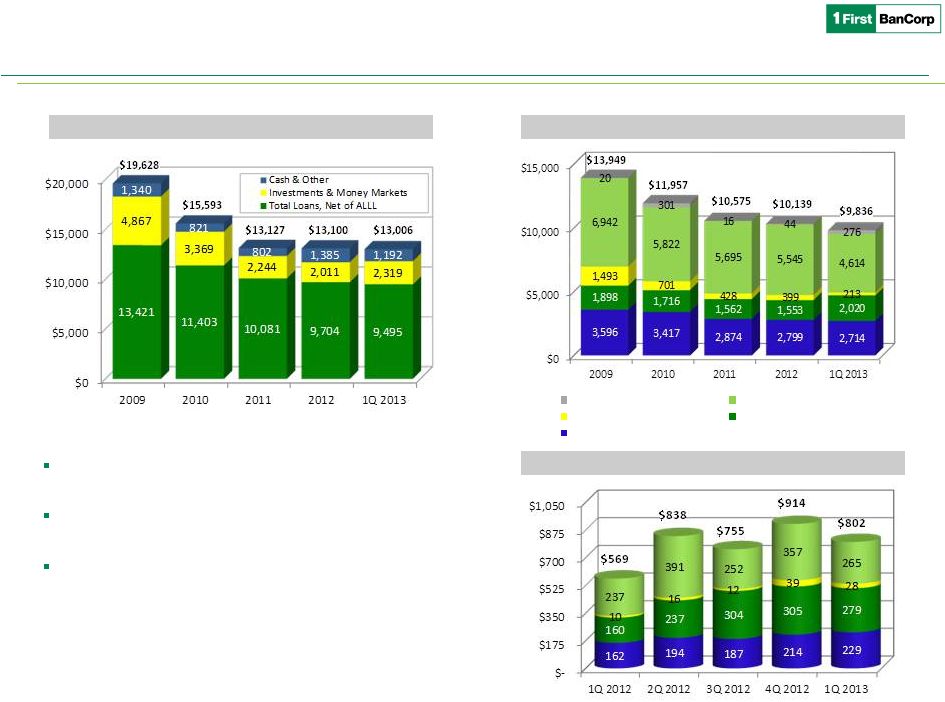
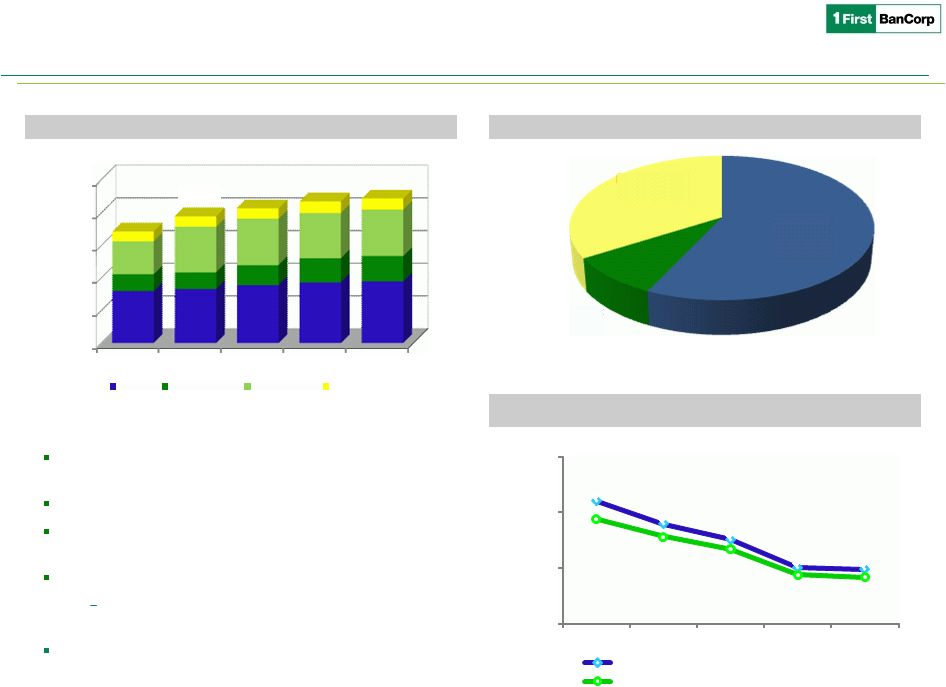 1 Net of
Brokered CDs Building Franchise Value
Successful deposits growth over recent years
8
($ in millions)
Deposits, Net of Brokered CDs
Total Deposit Composition
Cost of Deposits
Core deposit growth strategy continues providing
positive results; $1.5B since 2009
Focus remains on cross-selling opportunities
Cost of interest bearing deposits, net of brokered CDs,
decreased to 0.98% from 1.51% in 2011
Reduced reliance on brokered CDs
34% of deposits are brokered CDs, down from
60% in 2009
$2.0 billion brokered CDs maturing in twelve months at
average rate of 1.39%
2.20%
1.79%
1.51%
1.01%
0.98%
1.87%
1.56%
1.34%
0.88%
0.84%
0.00%
1.00%
2.00%
3.00%
2009
2010
2011
2012
1Q 2013
Interest Bearing Deposits, Net of Brokered CDs
Total Deposits, Net of Brokered CDs
Interest
Bearing
57%
Non-interest
Bearing
9%
Brokered CDs
34%
$-
$1,500
$3,000
$4,500
$6,000
$7,500
2009
2010
2011
2012
Q1 2013
2,381
2,477
2,654
2,776
2,824
774
763
915
1,108
1,161
1,505
2,090
2,126
2,077
2,122
448
470
481
529
515
$5,108
$5,800
$6,176
$6,490
$6,622
Retail
Commercial
CDs & IRAs
Public Funds
1 |
 Well Diversified
Loan Portfolio Continued focus on NPL reduction strategies while selectively
replacing with performing loans.
Continued focus on increasing Consumer and Residential
Mortgage market share & rebuilding our Commercial portfolio.
Increased focus on rebuilding commercial book in PR and FL.
Strong Origination Capabilities
9
($ in millions)
Loan Portfolio
Asset Composition
Loan Originations
Loans Held for Sale
Commercial
Construction
Consumer & Finance Leases
Residential Mortgage |
 1,639
683
1,790
1,701
1,669
1,562
1,410
1,390
1,377
1,337
1,332
1,251
1,259
1,238
1,087
981
$-
$1,800
Q1
Q2
Q3
Q4
Q1
Q2
Q3
Q4
Q1
Q2
Q3
Q4
Q1 13
Pro
Forma
Q1 13
Loans Held for Sale
Repossessed Assets & Other
NPLs Held for Investment
Improving Risk Profile
10
($ in millions)
Net Charge-offs
Non-performing Assets
Pro forma NPAs
(1)
are down $808 million, or 45%, since the peak in Q1
10; and $257 million, or 21%, compared to Q4 12.
Completed a bulk sale of adversely classified loans and OREO properties
with
a
book
value
of
$217.7
million,
including
$185.0
million
of
non-
performing assets, for $120.2 million in a cash transaction.
Loans Held For Sale:
Two large transactions previously announced written down to $81
million, one sale completed in Q2 2013 the other expected to be
completed by year end; and
Reclassified an additional $80 million of commercial &
construction, charging-off $15.5 million.
(1)
2010
2011
2012
Product
Book Value
Accumulated
Charge-offs
Reserves
Net Carrying
Amount
3
C & I
$141.0
$51.7
$30.6
57.3%
CRE
227.6
50.8
30.6
70.8%
Construction
116.9
102.6
13.5
47.1%
Total
$485.6
$205.2
$74.8
59.5%
Commercial Non-performing Loans (includes HFS)
2
Proactively Managing Asset Quality 1)
Pro forma for the write down of the $64.5 million collateral pledged with Lehman Brothers
Special Financing, Inc. announced in Q2 13 and the 2Q 13 completed $40.8 million sale of a loan held for sale.
2)
As of March 31, 2013.
3)
Net Carrying Amount = % of carrying value net of reserves and accumulated charge-offs
|
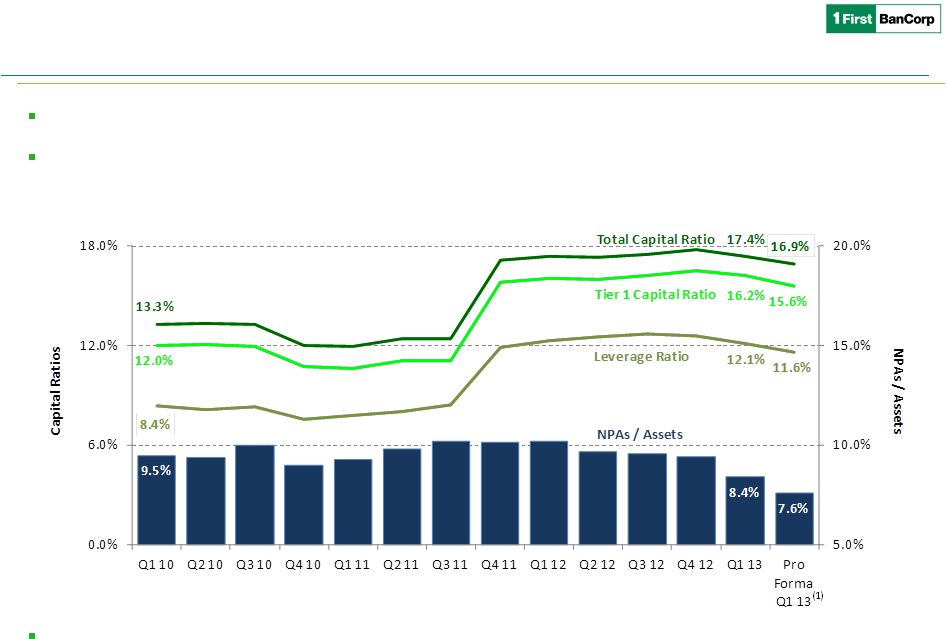 11
Capital Position and Asset Quality
Asset
quality
remains
our
number
one
focus,
while
preserving
and
growing
capital.
With quarterly pre-provision pre-tax income at approximately $50 million we will
continue to grow our capital base while working out legacy credit issues.
Not reflected in the above capital ratios is our deferred tax valuation allowance of $366
million. 1)
Pro forma capital ratios and NPA/Asset ratio to reflect the write down of the $64.5 million
collateral pledged with Lehman Brothers Special Financing, Inc. announced in Q2 2013. NPA/Asset
ratio also pro forma for the $40.8 million sale of a loan held for sale in Q2 2013.
Core Franchise is Strong |
 12
We are confident in the strength of our core franchise and in our ability to
successfully execute on our strategic plan.
Investment Opportunity
Strong capital position:
–
Total capital, Tier 1 capital and Leverage ratios of the Corporation of 16.9%, 15.6%
and 11.6%, respectively pro forma for the write-down of the securities pledged to
Lehman. $366
million
Deferred
Tax
Asset
Valuation
Allowance.
Focus on execution of our Strategic Plan:
–
Asset Quality
remains our number one focus and our Special Assets group continues
to make progress. We will continue to closely manage our NPA book.
–
Profitability
$50.5 million of pre-tax pre-provision income for Q1 2013 up 45% from
2012; Stable Net Interest Margin of 3.96% as of Q1 2013.
–
Loan Portfolio
focus on solid relationships with core balances.
–
Core Deposits
continue to grow, up $146 million in Q1 2013, as we cross-sell with new
and enhanced product offering while reducing our reliance on brokered CDs.
–
Strategic
Alliance
Our
new
strategic
alliance
with
FIS
will
better
prepare
us
for
further
technological
advancements
in
banking.
–
Strong & Focused Management Team
Core Franchise is Strong |
 Exhibits
Investor Presentation
Investor Presentation
June 2013
June 2013 |
 14
Stock Profile
Trading Symbol:
•
FBP
Exchange:
•
NYSE
Share
Price
(5/30/13):
•
$6.05
Shares Outstanding:
•
206,227,980
Market Capitalization
(5/30/13):
•
$1.25 Billion
1 Yr. Average Daily Volume:
•
369,317
Price
(5/30/13)
to
Tangible
Book
(3/31/13):
•
0. 97x
1
Beneficial Owner
Amount
Percent of
Class
Entities affiliated with Thomas H. Lee
Partners, L.P.
50,684,485
24.59%
Entities affiliated with Oaktree Capital
Management, L.P.
50,684,485
24.59%
Wellington Management Company, LLP.
20,336,087
9.87%
United States Department of the
Treasury
34,227,696
16.50%
5% or more Beneficial Ownership
1
Includes the U.S. Treasury warrant that entitles it to purchase up to 1,285,899 shares of
Common Stock at an exercise price of $3.29 per share, as adjusted as a result of the issuance of shares of
Common Stock in the Corporation’s recently completed $525MMprivate placement of Common
Stock (the “Capital Raise”). The exercise price and the number of shares issuable upon exercise of the
warrant are subject to further adjustments under certain circumstances to prevent dilution.
The warrant has a 10-year term from its issue date and is exercisable in whole or in part at any time. |
 Non-performing Assets
1 Collateral pledged with Lehman Brothers Special Financing, Inc.
15
($ in millions)
Mar 2013
Dec 2012
Sep 2012
Jun 2012
Mar 2012
Year-over-Year
Change
Non-performing loans held for investment:
Residential mortgage
311.5
$
313.6
$
320.9
$
333.0
$
341.2
$
-8.7%
Commercial mortgage
136.7
214.8
231.2
239.9
244.4
-44.1%
Commercial & Industrial
141.0
230.1
230.5
255.3
263.6
-46.5%
Construction
59.8
178.2
189.5
202.1
231.1
-74.1%
Consumer Loans & Finance Leases
33.7
38.9
36.1
35.4
39.2
-14.1%
Total non-performing loans held for investment
682.7
975.6
1,008.0
1,065.7
1,119.4
-39.0%
REO
181.5
185.8
177.0
167.3
135.9
33.5%
Other repossessed property
9.9
10.1
9.8
10.6
12.5
-20.7%
Other assets
1
64.5
64.5
64.5
64.5
64.5
0.0%
Total non-performing assets, excl loans held for sale
938.6
1,236.0
1,259.4
1,308.2
1,332.4
-29.6%
Non-performing loans held for sale
148.0
2.2
-
-
-
NA
Total non-performing assets, loans held for sale
1,086.6
1,238.2
1,259.4
1,308.2
1,332.4
-18.4% |
  16
Adjusted Pre-tax, Pre-provision Income Reconciliation
($ in thousands)
1Q 2013
4Q 2012
3Q 2012
2Q 2012
1Q 2012
Loss before income taxes
(71,011)
$
16,028
$
19,834
$
10,901
$
(11,049)
$
Add: Provision for loan and lease losses
111,123
30,466
28,952
24,884
36,197
Add: Net loss on investments and impairments
117
69
547
143
1,207
Add: Unrealized loss (gain) on derivatives instruments
and liabilities measured at fair value
(400)
(432)
(170)
(506)
(283)
Add: Loan sale transaction related expenses and other
non-recurring professional fee expense
5,096
-
-
-
-
Add: Contingency adjustment - tax credits
-
-
-
-
2,489
Add: Equity in losses of unconsolidated entities
5,538
8,330
2,199
2,491
6,236
Adjusted Pre-tax, pre-provision income
50,463
$
54,461
$
51,362
$
37,913
$
34,797
$
Quarter Ended |