Attached files
| file | filename |
|---|---|
| 8-K - FORM 8-K - FINANCIAL INSTITUTIONS INC | d548839d8k.htm |
Exhibit 99.1

| Investor Roadshow June 3-4, 2013 NASDAQ: FISI |
| Martin K. Birmingham President and Chief Executive Officer Management Presentation |

| Statements contained in this presentation which are not historical facts and which pertain to future operating results of Financial Institutions, Inc. and its subsidiaries constitute "forward looking statements" within the meaning of the Private Securities Litigation Reform Act of 1995. These forward looking statements involve significant risks and uncertainties. We refer you to the documents the Company files from time to time with the Securities and Exchange Commission, specifically the Company's last filed Form 10-K and Form 10-Q. These documents contain and identify important factors that could cause actual results to differ materially from those contained in our projections or forward looking statements. The Company assumes no obligation to update any information presented herein. |

| Investor Highlights Focused on Mission to Deliver on Our Promise Strengthened and Deep Management Team to Drive Performance Remain Positioned for Growth Organic Strategy On Track Proven M&A Acumen Low Cost Operating Emphasis Effective Enterprise Risk Management Solid Capital Structure Attractive Dividend Yield Delivering on Our Promise to All Stakeholders |
| Our Promise All Strategic Initiatives Focused on Delivering on our Promise Board & Management Accountability Measurement and Monitoring Tools in Place Enhance Customer Experience Employee Experience Shareholder Value |

| Our Approach Building Management Depth Attract and retain talent Promote from within - Create career opportunities Operational Efficiency Focus on revenue growth Responsible expense management Opportunistic Acquisitions Sound Risk Management Disciplined Lending Organic growth Balance between volume and credit risk |

| 2012/2013 Management Transition and Strengthening Peter Humphrey retired on August 28, 2012 35 years of loyal and dedicated service 18 years President & CEO Management Depth Martin Birmingham Named President & CEO in March 2013 Rick Harrison Named Chief Operating Officer in August 2012 Kevin Klotzbach Named Chief Financial Officer in April 2013 Mike Grover Named Chief Accounting Officer in April 2013 |

| Employee Development Necessary Part of Growth and Expansion Strategy Created the Five Star Bank Experience Core Beliefs "We work as a team in an environment of trust, integrity and mutual respect where successes are recognized" "Every interaction is an opportunity to deliver a friendly, professional, relationship building experience" Developed Recognition System Incorporated into hiring, evaluation and incentive processes |

| Employee Development Regular Employee & Customer Assessments Correlation between Employee Satisfaction and Customer Satisfaction Satisfied Employees = Satisfied Customers = Shareholder Value |
| Customer Experience New Service Offerings Mobile Banking Enhanced Web Presence Online Account Opening Updated Online Banking & Bill Payor New Product Offerings Enhanced Retail Checking Products |
| Customer Experience "Made For You" Philosophy Give the Customer the Power of Choice Robust Products State of the Art Technology Convenient Locations Outstanding Service |

| Customer Experience - Proven Results Indirect Lending as Core Business Effective 2005 Large market Favorable competitive conditions and risk- adjusted returns Natural risk dispersion that comes with retail loans Necessary expertise available |

| Customer Experience - Proven Results Indirect Lending as Core Business (CHART) Indirect Loan Volume ($ Millions) |

| Customer Experience - Proven Results Indirect Auto Vintage Analysis As of 12/31/2012 |

| Successful Branch Acquisitions |
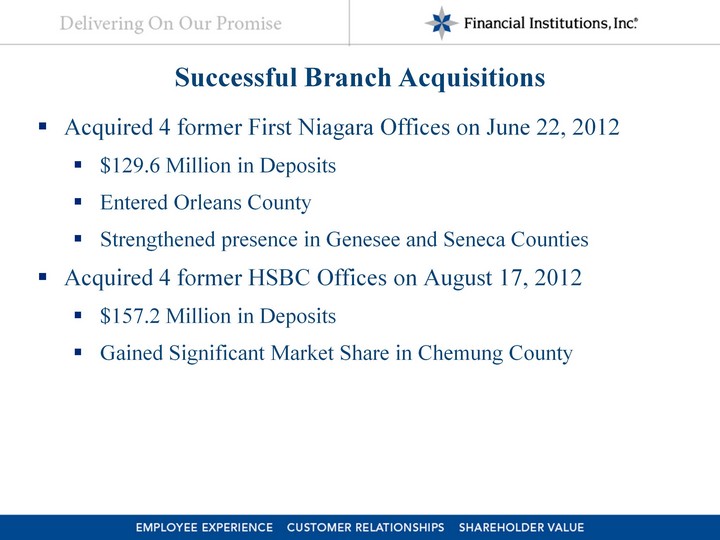
| Successful Branch Acquisitions Acquired 4 former First Niagara Offices on June 22, 2012 $129.6 Million in Deposits Entered Orleans County Strengthened presence in Genesee and Seneca Counties Acquired 4 former HSBC Offices on August 17, 2012 $157.2 Million in Deposits Gained Significant Market Share in Chemung County |
| Successful Branch Acquisitions Solid Execution Detailed planning Seamless integration Extended customer service hours Satisfied Customers Deposit Retention Levels Higher than Projected |
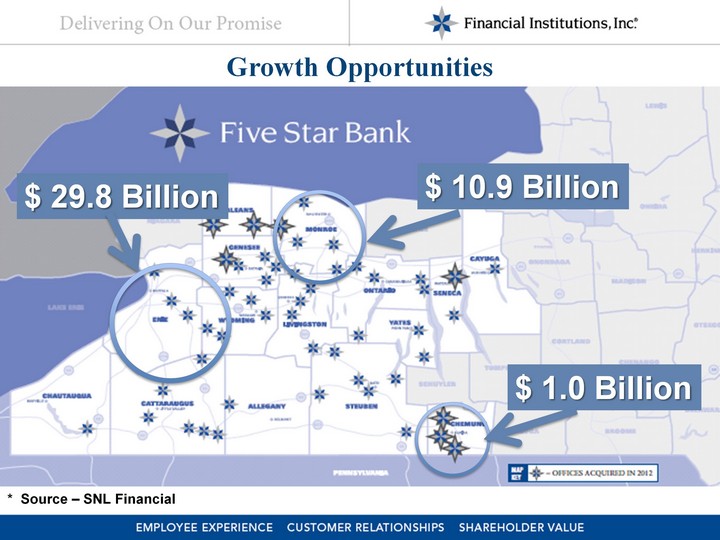
| Growth Opportunities $ 29.8 Billion $ 10.9 Billion $ 1.0 Billion * Source - SNL Financial |

| Financial Overview Kevin B. Klotzbach EVP and Chief Financial Officer/Treasurer |
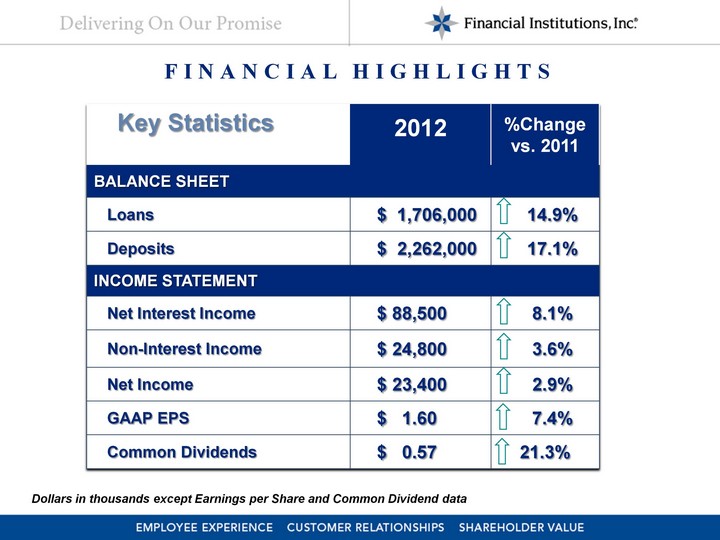
| FINANCIAL Highlights 2012 %Change vs. 2011 BALANCE SHEET BALANCE SHEET BALANCE SHEET Loans $ 1,706,000 14.9% Deposits $ 2,262,000 17.1% INCOME STATEMENT INCOME STATEMENT INCOME STATEMENT Net Interest Income $ 88,500 8.1% Non-Interest Income $ 24,800 3.6% Net Income $ 23,400 2.9% GAAP EPS $ 1.60 7.4% Common Dividends $ 0.57 21.3% Key Statistics Dollars in thousands except Earnings per Share and Common Dividend data |

| Net Interest incomE anD noninterest INCOME (CHART) CAGR ('09-'12) 6.3% * All years exclude OTTI & Securities Gains |

| FINANCIAL overview Strong Net Interest Margin (CHART) |

| (CHART) Financial overview Efficiency Ratio Expense as a Percent of Revenue * Peer group average is the SNL Bank $1B to $5B Index. |

| (CHART) CAGR ('4Q, 09- 4Q, 12) 10.5% |

| $ Millions 2011 2012 Q1 - 2013 2012 Peer Group* Non-Performing Loans Non-Performing Loans Non-Performing Loans Non-Performing Loans Non-Performing Loans Balances $7.1 $9.1 $11.8 Percent 0.48% 0.53% 0.69% 2.41% Net Loan Charge Offs Net Loan Charge Offs Net Loan Charge Offs Net Loan Charge Offs Net Loan Charge Offs Balances $5.0 $5.7 $1.6 Percent 0.36% 0.36% 0.38% 0.81% Allowance for Loan Losses Allowance for Loan Losses Allowance for Loan Losses Allowance for Loan Losses Allowance for Loan Losses Balances $23.3 $24.7 $25.8 Percent 1.57% 1.45% 1.50% 1.90% financial overview CREDIT Quality * Peer group average is the SNL Bank $1B to $5B Index. |

| financial overview Low Risk Investment Portfolio (CHART) |

| (CHART) (CHART) Financial OVERVIEW 1,883 1,932 2,262 2,409 |

| 2011 2012 Q1 '13 Leverage Ratio 8.63% 7.71% 7.46% Tier 1 Risk-Based Capital 12.20% 10.73% 10.84% Total Risk-Based Capital 13.45% 11.98% 12.09% Common Dividend Payout Ratio 31.33% 35.63% 42.86% Return on Average Tangible Common Equity 11.55% 11.74% 12.47% FINANCIAL OVERVIEW capital Management * Peer group average is the SNL Bank $1B to $5B Index. Well Capitalized 38.27% 2012 Peer Group 9.37% |

| Total Shareholder Return (CHART) |
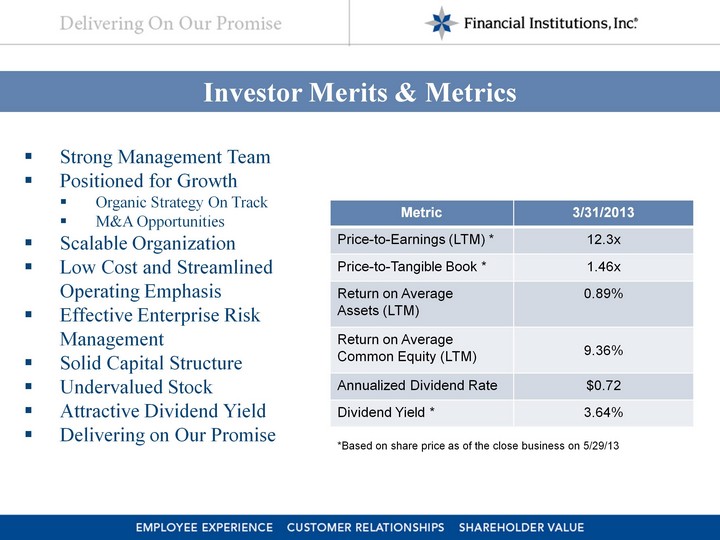
| Investor Merits & Metrics Metric 3/31/2013 Price-to-Earnings (LTM) * 12.3x Price-to-Tangible Book * 1.46x Return on Average Assets (LTM) 0.89% Return on Average Common Equity (LTM) 9.36% Annualized Dividend Rate $0.72 Dividend Yield * 3.64% Strong Management Team Positioned for Growth Organic Strategy On Track M&A Opportunities Scalable Organization Low Cost and Streamlined Operating Emphasis Effective Enterprise Risk Management Solid Capital Structure Undervalued Stock Attractive Dividend Yield Delivering on Our Promise *Based on share price as of the close business on 5/29/13 |

| Thank you. Martin K. Birmingham President and Chief Executive Officer Kevin B. Klotzbach EVP and Chief Financial Officer/Treasurer NASDAQ: FISI |