Attached files
| file | filename |
|---|---|
| 8-K/A - 8-K/A - Fidelity National Financial, Inc. | a8-klpsacquisition1.htm |
| EX-99.1 - EXHIBIT 99.1 - Fidelity National Financial, Inc. | ex991pressrelease1.htm |
| EX-2.1 - EXHIBIT 2.1 - Fidelity National Financial, Inc. | ex21mergeragreement1.htm |
0, 50, 99 199, 234, 252 141, 216, 248 186, 205, 234 126, 167, 217 59, 137, 201 26, 140, 39 Table (repeat 2 & 3) Heading A 79, 129, 189 Heading B 220, 230, 242 2 208, 216, 232 3 233, 237, 244 FNF Acquisition of LPS Investor Slides May 28, 2013

0, 50, 99 199, 234, 252 141, 216, 248 186, 205, 234 126, 167, 217 59, 137, 201 26, 140, 39 Table (repeat 2 & 3) Heading A 79, 129, 189 Heading B 220, 230, 242 2 208, 216, 232 3 233, 237, 244 Forward Looking Statements This presentation may contain forward-looking statements that involve a number of risks and uncertainties. Statements that are not historical facts, including statements regarding our expectations, hopes, intentions or strategies regarding the future are forward-looking statements. Forward-looking statements are based on management's beliefs, as well as assumptions made by, and information currently available to, management. Because such statements are based on expectations as to future financial and operating results and are not statements of fact, actual results may differ materially from those projected. We undertake no obligation to update any forward-looking statements, whether as a result of new information, future events or otherwise. The risks and uncertainties which forward-looking statements are subject to include, but are not limited to: the ability to consummate the proposed transaction; the ability of FNF to successfully integrate LPS’ operations and employees and realize anticipated synergies and cost savings; the potential impact of the announcement or consummation of the proposed transaction on relationships, including with employees, suppliers, customers and competitors; changes in general economic, business and political conditions, including changes in the financial markets; weakness or adverse changes in the level of real estate activity, which may be caused by, among other things, high or increasing interest rates, a limited supply of mortgage funding or a weak U. S. economy; our dependence on distributions from our title insurance underwriters as a source of cash flow; significant competition that our operating subsidiaries face; compliance with extensive government regulation of our operating subsidiaries; and other risks detailed in the “Statement Regarding Forward-Looking Information,” “Risk Factors” and other sections of the Company’s Form 10-K and other filings with the Securities and Exchange Commission. 2
0, 50, 99 199, 234, 252 141, 216, 248 186, 205, 234 126, 167, 217 59, 137, 201 26, 140, 39 Table (repeat 2 & 3) Heading A 79, 129, 189 Heading B 220, 230, 242 2 208, 216, 232 3 233, 237, 244 Important Additional Information Will be Filed with the SEC 3 FNF plans to file with the SEC a Registration Statement on Form S-4 in connection with the transaction. FNF and LPS plan to file with the SEC and mail to their respective stockholders a Joint Proxy Statement/Prospectus in connection with the transaction. The Registration Statement and the Joint Proxy Statement/Prospectus will contain important information about FNF, LPS, the transaction and related matters. INVESTORS AND SECURITY HOLDERS ARE URGED TO READ THE REGISTRATION STATEMENT AND THE JOINT PROXY STATEMENT/PROSPECTUS CAREFULLY WHEN THEY ARE AVAILABLE. Investors and security holders will be able to obtain free copies of the Registration Statement and the Joint Proxy Statement/Prospectus and other documents filed with the SEC by FNF and LPS through the web site maintained by the SEC at www.sec.gov or by phone, email or written request by contacting the investor relations department of FNF or LPS at the following: FNF LPS 601 Riverside Avenue 601 Riverside Avenue Jacksonville, FL 32204 Jacksonville, FL 32204 Attention: Investor Relations Attention: Investor Relations 904-854-8100 904-854-8640 dkmurphy@fnf.com nancy.murphy@lpsvcs.com FNF and LPS, and their respective directors and executive officers, may be deemed to be participants in the solicitation of proxies in respect of the transactions contemplated by the merger agreement. Information regarding the directors and executive officers of FNF is contained in FNF’s Form 10-K for the year ended December 31, 2012 and its proxy statement filed on April 12, 2013, which are filed with the SEC. Information regarding LPS’s directors and executive officers is contained in LPS’s Form 10-K for the year ended December 31, 2012 and its proxy statement filed on April 9, 2013, which are filed with the SEC. A more complete description will be available in the Registration Statement and the Joint Proxy Statement/Prospectus. This communication shall not constitute an offer to sell or the solicitation of an offer to sell or the solicitation of an offer to buy any securities, nor shall there be any sale of securities in any jurisdiction in which such offer, solicitation or sale would be unlawful prior to registration or qualification under the securities laws of any such jurisdiction. No offer of securities shall be made except by means of a prospectus meeting the requirements of Section 10 of the Securities Act of 1933, as amended
0, 50, 99 199, 234, 252 141, 216, 248 186, 205, 234 126, 167, 217 59, 137, 201 26, 140, 39 Table (repeat 2 & 3) Heading A 79, 129, 189 Heading B 220, 230, 242 2 208, 216, 232 3 233, 237, 244 Transaction Overview • FNF to acquire Lender Processing Services (“LPS”) for $33.25 per common share for a total equity value of $2.9 billion – FNF will pay 50% of the consideration for LPS in cash and 50% in shares of FNF common stock – Purchase price represents a 19% and 25% premium, respectively, to the prior 30- day and 60-day average closing prices for LPS’ common stock through May 22, 2013, the last trading day before media reports regarding a potential transaction between FNF and LPS – Under the definitive agreement, FNF shares of common stock have been valued at $25.489 per share, representing a fixed exchange ratio of 0.65224 shares of FNF common stock for each share of LPS common stock – FNF expects to issue approximately 57.4 million shares of common stock, representing approximately 20.151% of FNF’s pro forma fully-diluted shares outstanding – At closing, FNF will combine its ServiceLink business with LPS in a new consolidated holding company named Black Knight Financial Services, Inc. and sell a 19% minority equity interest to funds affiliated with Thomas H. Lee Partners, L.P. for approximately $381 million in cash; FNF will retain an 81% ownership interest in the new holding company 4
0, 50, 99 199, 234, 252 141, 216, 248 186, 205, 234 126, 167, 217 59, 137, 201 26, 140, 39 Table (repeat 2 & 3) Heading A 79, 129, 189 Heading B 220, 230, 242 2 208, 216, 232 3 233, 237, 244 Transaction Overview – If FNF’s average common stock price at closing is above the lower collar price of $24.215 per share, the exchange ratio remains fixed at 0.65224 per share of FNF common stock for each share of LPS common stock and LPS stockholders will receive the benefit of the stock price appreciation – If FNF’s average common stock price at closing is between $20.00 and $24.215, FNF will increase the number of shares of FNF common stock to be received by LPS stockholders such that LPS stockholders receive a minimum of $15.794 per share in value on the stock portion of the consideration, or $32.419 per share in total – If FNF’s average common stock price at closing is less than $20.00, the exchange ratio will be fixed at 0.7897 per share, in which event LPS will have a right to terminate the transaction – Additionally, on or before three trading days prior to the anticipated date of effectiveness of FNF’s registration statement on Form S-4, FNF has the option to increase the cash portion of the consideration from $16.625 per share of LPS common stock up to $33.25 per share of LPS common stock with a corresponding decrease in the stock portion of the merger consideration under the terms of the merger agreement, in which case the exchange ratio will be adjusted to reflect the new consideration mix 5
0, 50, 99 199, 234, 252 141, 216, 248 186, 205, 234 126, 167, 217 59, 137, 201 26, 140, 39 Table (repeat 2 & 3) Heading A 79, 129, 189 Heading B 220, 230, 242 2 208, 216, 232 3 233, 237, 244 Transaction Overview – If FNF elects to increase the cash portion of the consideration and FNF’s average common stock price at closing is greater than the upper collar price of $26.763, then the exchange ratio will be adjusted to reflect the increased value that would have been received at closing without any change in consideration mix – FNF’s pro-forma debt to total capital ratio will increase to approximately 33%; plan to pay down debt quickly to move debt to total capital back below 25% 6
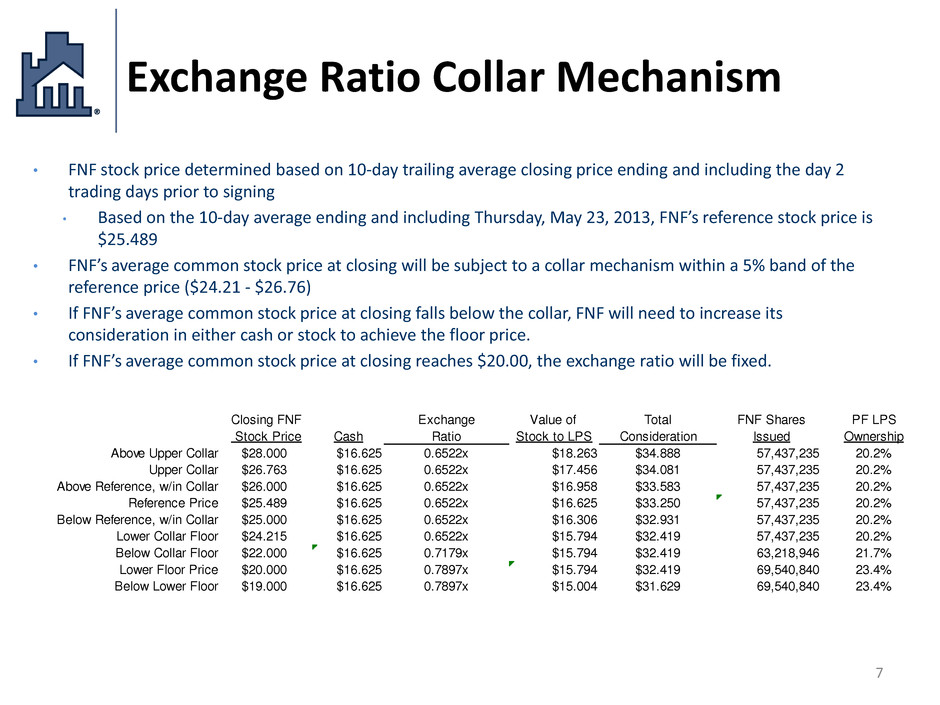
0, 50, 99 199, 234, 252 141, 216, 248 186, 205, 234 126, 167, 217 59, 137, 201 26, 140, 39 Table (repeat 2 & 3) Heading A 79, 129, 189 Heading B 220, 230, 242 2 208, 216, 232 3 233, 237, 244 Exchange Ratio Collar Mechanism • FNF stock price determined based on 10-day trailing average closing price ending and including the day 2 trading days prior to signing • Based on the 10-day average ending and including Thursday, May 23, 2013, FNF’s reference stock price is $25.489 • FNF’s average common stock price at closing will be subject to a collar mechanism within a 5% band of the reference price ($24.21 - $26.76) • If FNF’s average common stock price at closing falls below the collar, FNF will need to increase its consideration in either cash or stock to achieve the floor price. • If FNF’s average common stock price at closing reaches $20.00, the exchange ratio will be fixed. 7 Closing FNF Exchange Value of Total FNF Shares PF LPS Stock Price Cash Ratio Stock to LPS Consideration Issued Ownership Above Upper Collar $28.000 $16.625 0.6522x $18.263 $34.888 57,437,235 20.2% Upper Collar $26.763 $16.625 0.6522x $17.456 $34.081 57,437,235 20.2 Above Reference, w/in Collar $26.000 $16.625 0.6522x $16.958 $33.583 57,437,235 20.2% Reference Price $25.489 $16.625 0.6522x $16.625 $33.250 57,437,235 20.2 Below Reference, w/in Collar $25.000 $16.625 0.6522x $16.306 $32.931 57,437,235 20.2% Lower Collar Floor $24.215 $16.625 0.6522x $15.794 $32.419 57,437,235 20.2 Below Collar Floor $22.000 $16.625 0.7179x $15.794 $32.419 63,218,946 21.7% Lower Floor Price $20.000 $16.625 0.7897x $15.794 $32.419 69,540,840 23.4 Below Lower Floor $19.000 $16.625 0.7897x $15.004 $31.629 69,540,840 23.4%
0, 50, 99 199, 234, 252 141, 216, 248 186, 205, 234 126, 167, 217 59, 137, 201 26, 140, 39 Table (repeat 2 & 3) Heading A 79, 129, 189 Heading B 220, 230, 242 2 208, 216, 232 3 233, 237, 244 Transaction Overview – Acquisition agreement includes a “go-shop” period effective through July 7, 2013 during which LPS is permitted to actively solicit alternative acquisition proposals from third parties – Acquisition agreement contains a break-up fee equal to approximately 1.25% of the total equity value of $2.9 billion payable to FNF if LPS terminates the acquisition agreement based on receiving a superior proposal during the “go-shop” period – Break-up fee equal to approximately 2.5% of the total equity value if LPS fails to hold a shareholder’s meeting or terminates the agreement after the “go-shop” period because it received a superior proposal. – In addition, the acquisition agreement includes a break-up fee equal to approximately 2.5% of the total equity value if, • (i) a competing offer for LPS is made public by a third party, 8
0, 50, 99 199, 234, 252 141, 216, 248 186, 205, 234 126, 167, 217 59, 137, 201 26, 140, 39 Table (repeat 2 & 3) Heading A 79, 129, 189 Heading B 220, 230, 242 2 208, 216, 232 3 233, 237, 244 Transaction Overview • (ii) the acquisition agreement is terminated either as a result of the LPS shareholders voting against the transaction or the date of March 31, 2014 being reached and the LPS shareholder meeting not having been held or if LPS breaches its obligations which results in the failure of a closing condition and, • (iii) within twelve months after termination, LPS enters into or consummates any alternative transaction – Transaction is subject to approval by LPS and FNF stockholders, approvals from applicable federal and state regulators and satisfaction of other customary closing conditions – Closing of the transaction is currently expected to occur in the fourth quarter of 2013 9
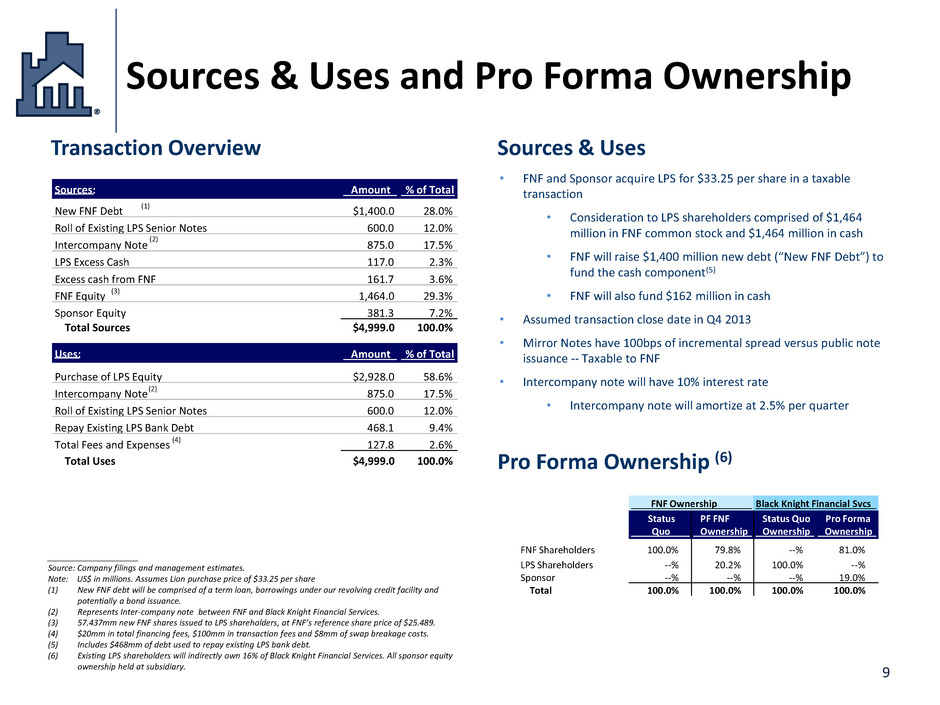
0, 50, 99 199, 234, 252 141, 216, 248 186, 205, 234 126, 167, 217 59, 137, 201 26, 140, 39 Table (repeat 2 & 3) Heading A 79, 129, 189 Heading B 220, 230, 242 2 208, 216, 232 3 233, 237, 244 Sources & Uses and Pro Forma Ownership 9 Sources & Uses Pro Forma Ownership (6) Transaction Overview • FNF and Sponsor acquire LPS for $33.25 per share in a taxable transaction • Consideration to LPS shareholders comprised of $1,464 million in FNF common stock and $1,464 million in cash • FNF will raise $1,400 million new debt (“New FNF Debt”) to fund the cash component(5) • FNF will also fund $162 million in cash • Assumed transaction close date in Q4 2013 • Mirror Notes have 100bps of incremental spread versus public note issuance -- Taxable to FNF • Intercompany note will have 10% interest rate • Intercompany note will amortize at 2.5% per quarter ____________________ Source: Company filings and management estimates. Note: US$ in millions. Assumes Lion purchase price of $33.25 per share (1) New FNF debt will be comprised of a term loan, borrowings under our revolving credit facility and potentially a bond issuance. (2) Represents Inter-company note between FNF and Black Knight Financial Services. (3) 57.437mm new FNF shares issued to LPS shareholders, at FNF’s reference share price of $25.489. (4) $20mm in total financing fees, $100mm in transaction fees and $8mm of swap breakage costs. (5) Includes $468mm of debt used to repay existing LPS bank debt. (6) Existing LPS shareholders will indirectly own 16% of Black Knight Financial Services. All sponsor equity ownership held at subsidiary. Sources: Amount % of Total New FNF Debt (1) $1,400.0 28.0% Roll of Existing LPS Senior Notes 600.0 12.0% Intercompany Note (2) 875.0 17.5% LPS Excess Cash 117.0 2.3% Excess cash from FNF 161.7 3.6% FNF Equity (3) 1,464.0 29.3% Sponsor Equity 381.3 7.2% Total Sources $4,999.0 100.0% Uses: Amount % of Total Purchase of LPS Equity $2,928.0 58.6% Intercompany Note (2) 875.0 17.5% Roll of Existing LPS Senior Notes 600.0 12.0% Repay Existing LPS Bank Debt 468.1 9.4% Total Fees and Expenses (4) 127.8 2.6% Total Uses $4,999.0 100.0% FNF Ownership Black Knight Financial Svcs Status PF FNF Status Quo Pro Forma Quo Ownership Ownership Ownership FNF Shareholders 100.0% 79.8% --% 81.0% LPS Shareholders --% 20.2% 100.0% --% Sponsor --% --% --% 19.0% Total 100.0% 100.0% 100.0% 100.0%
0, 50, 99 199, 234, 252 141, 216, 248 186, 205, 234 126, 167, 217 59, 137, 201 26, 140, 39 Table (repeat 2 & 3) Heading A 79, 129, 189 Heading B 220, 230, 242 2 208, 216, 232 3 233, 237, 244 Transaction Investment Highlights • Strong Strategic Fit – FNF management has significant experience and familiarity with LPS through previous ownership and operating similar businesses – Combination creates a larger, broader, more diversified and recurring revenue base – Makes FNF the nation’s leading title insurance, mortgage technology and mortgage services provider – Deepens relationships with nation’s largest lenders, as LPS’ top customers average a 20- year relationship with the company – Highly recurring revenue and cash flow from technology segment of LPS business – Target of $100 million for cost synergies – Recent clarity on LPS litigation matters is a catalyst for the transaction • Conservative Capital Structure – Current FNF balance sheet is conservatively leveraged (23% debt to total capital) which creates optimal timing for strategic transaction – Post- transaction balance sheet leverage increases to 33% debt to total capital – Plan to quickly pay down debt and move debt to total capital back down to 25% 11
0, 50, 99 199, 234, 252 141, 216, 248 186, 205, 234 126, 167, 217 59, 137, 201 26, 140, 39 Table (repeat 2 & 3) Heading A 79, 129, 189 Heading B 220, 230, 242 2 208, 216, 232 3 233, 237, 244 • FNF and its senior management have a long-standing relationship and deep understanding of LPS • LPS was once a subsidiary of FNF that was controlled by FNF’s senior management – Both companies continue to share a corporate campus • Through a series of transactions, FNF and LPS transitioned into two separate publicly traded companies – Prior to October 2006, FNF owned both Fidelity National Information Services (FIS) and LPS • Bill Foley was the Chairman of all entities – In November 2006, FNF completed the spin-off of FIS to its shareholders. LPS was a subsidiary of FIS at this time • Bill Foley remained the Chairman of both entities – In July 2008, FIS completed the spin-off of LPS into a separate publicly traded company • At spin-off, Bill Foley was the Chairman of LPS but stepped down from that position in 2010 • Subsequent to the 2006 spin-off, FNF and LPS now have certain competitive businesses which keep FNF management close to the LPS business and strategy FNF and LPS Have a Long-Standing Relationship 12
0, 50, 99 199, 234, 252 141, 216, 248 186, 205, 234 126, 167, 217 59, 137, 201 26, 140, 39 Table (repeat 2 & 3) Heading A 79, 129, 189 Heading B 220, 230, 242 2 208, 216, 232 3 233, 237, 244 LPS Business Overview • LPS is the leading provider of technology solutions and services, data and analytics to mortgage lenders, servicers and investors – 2012 revenue of nearly $2 billion, EBITDA of $533 million and cash flow from operations of $434 million – High recurring revenue and cash flow from technology segment • Strong market positions in technology based solutions – #1 U.S. provider of technology, data and transaction services to the mortgage industry – 50% of all first mortgages in the U.S. serviced using the Company’s MSP loan-servicing platform • Offers industry’s most comprehensive range of integrated products and services for all origination environments • Deep, long-term relationships with nations’ top lenders (on average, top customers have used LPS services for over 20 years) • Reports business through two operating segments: – Technology, Data and Analytics ($736mm of Revenue and $200mm of Operating Income in 2012) • MSP – leading mortgage servicing platform, which automates loan servicing • Desktop – leading workflow information system used for default management • Loan origination platform – mortgage origination, real estate software for providing automated valuation products and property loan and tax information • Data and analytics – alternative property valuations, property records and advanced analytic services – Transaction Services ($1,262mm of Revenue and $236mm of Operating Income in 2012) • Loan origination – centralized settlement services • Default management – services supporting end-to-end foreclosure and REO processes ____________________ Note: Revenue and operating income include corporate segment of ($2.0mm) and ($47.3mm), respectively. Excludes legal, regulatory and other one-time adjustments. 13
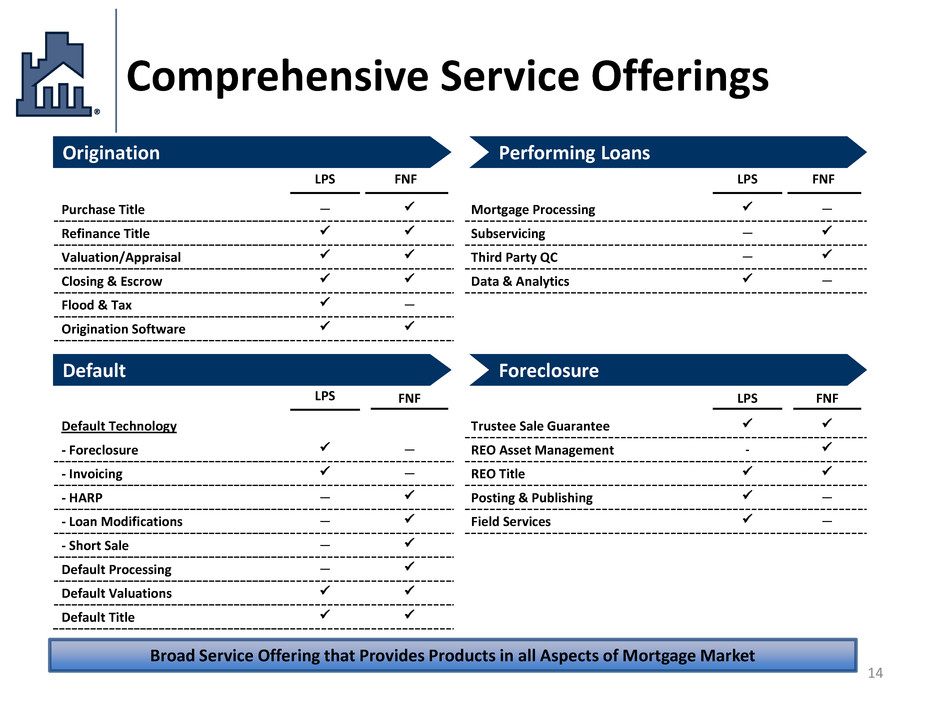
0, 50, 99 199, 234, 252 141, 216, 248 186, 205, 234 126, 167, 217 59, 137, 201 26, 140, 39 Table (repeat 2 & 3) Heading A 79, 129, 189 Heading B 220, 230, 242 2 208, 216, 232 3 233, 237, 244 LPS FNF LPS FNF Purchase Title — Mortgage Processing — Refinance Title Subservicing — Valuation/Appraisal Third Party QC — Closing & Escrow Data & Analytics — Flood & Tax — Origination Software LPS FNF LPS FNF Default Technology Trustee Sale Guarantee - Foreclosure — REO Asset Management - - Invoicing — REO Title - HARP — Posting & Publishing — - Loan Modifications — Field Services — - Short Sale — Default Processing — Default Valuations Default Title Comprehensive Service Offerings Origination Performing Loans Default Foreclosure Broad Service Offering that Provides Products in all Aspects of Mortgage Market 14
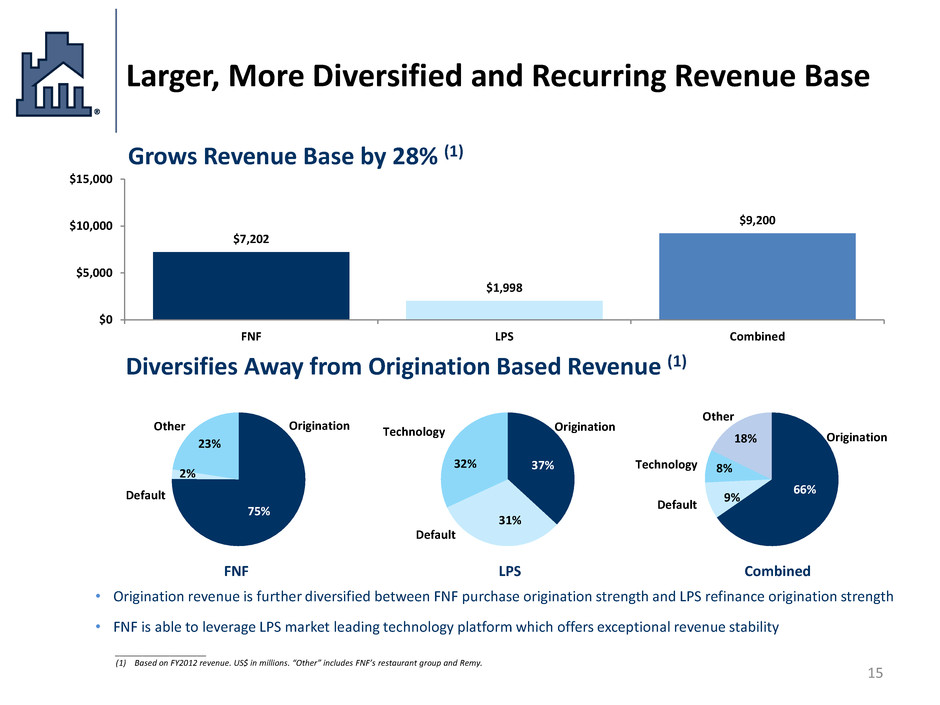
0, 50, 99 199, 234, 252 141, 216, 248 186, 205, 234 126, 167, 217 59, 137, 201 26, 140, 39 Table (repeat 2 & 3) Heading A 79, 129, 189 Heading B 220, 230, 242 2 208, 216, 232 3 233, 237, 244 66% 9% 8% 18% Larger, More Diversified and Recurring Revenue Base $7,202 $1,998 $9,200 $0 $5,000 $10,000 $15,000 FNF LPS Combined Grows Revenue Base by 28% (1) 75% 2% 23% Diversifies Away from Origination Based Revenue (1) Origination Other FNF 37% 31% 32% Origination LPS Combined Default Technology Default Origination Technology Other Default ____________________ (1) Based on FY2012 revenue. US$ in millions. “Other” includes FNF’s restaurant group and Remy. • Origination revenue is further diversified between FNF purchase origination strength and LPS refinance origination strength • FNF is able to leverage LPS market leading technology platform which offers exceptional revenue stability 15
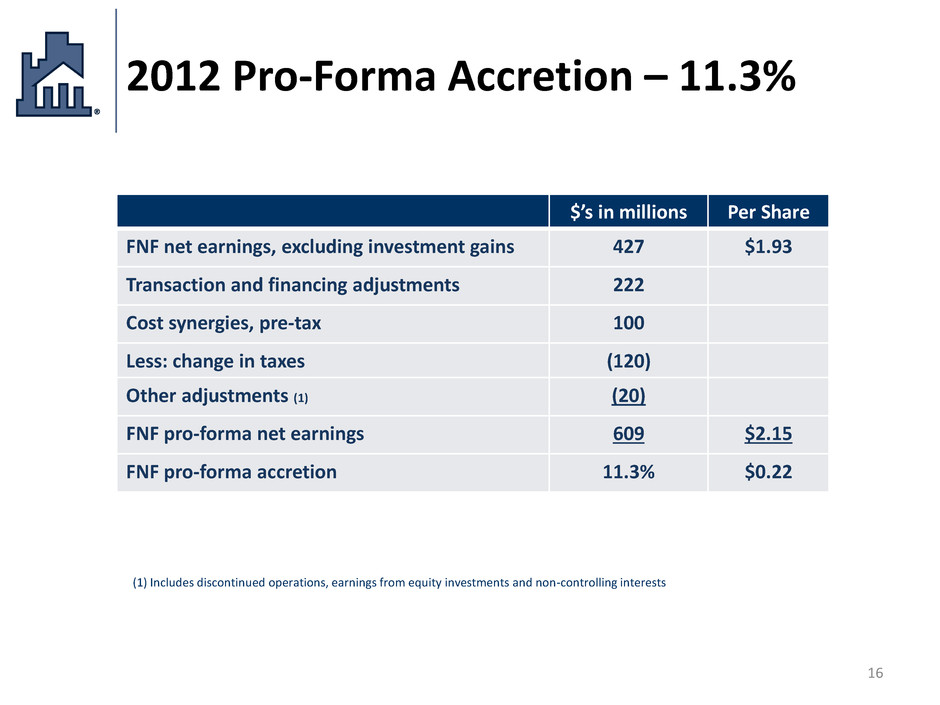
0, 50, 99 199, 234, 252 141, 216, 248 186, 205, 234 126, 167, 217 59, 137, 201 26, 140, 39 Table (repeat 2 & 3) Heading A 79, 129, 189 Heading B 220, 230, 242 2 208, 216, 232 3 233, 237, 244 2012 Pro-Forma Accretion – 11.3% 16 $’s in millions Per Share FNF net earnings, excluding investment gains 427 $1.93 Transaction and financing adjustments 222 Cost synergies, pre-tax 100 Less: change in taxes (120) Other adjustments (1) (20) FNF pro-forma net earnings 609 $2.15 FNF pro-forma accretion 11.3% $0.22 (1) Includes discontinued operations, earnings from equity investments and non-controlling interests
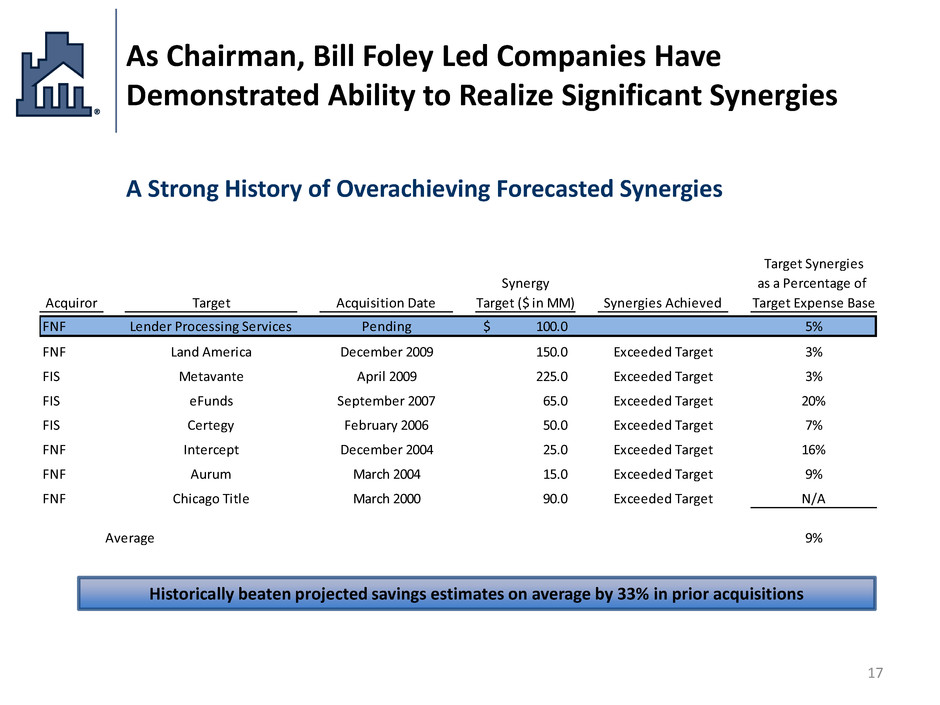
0, 50, 99 199, 234, 252 141, 216, 248 186, 205, 234 126, 167, 217 59, 137, 201 26, 140, 39 Table (repeat 2 & 3) Heading A 79, 129, 189 Heading B 220, 230, 242 2 208, 216, 232 3 233, 237, 244 As Chairman, Bill Foley Led Companies Have Demonstrated Ability to Realize Significant Synergies A Strong History of Overachieving Forecasted Synergies 17 Target Synergies Synergy as a Percentage of Acquiror Target Acquisition Date Target ($ in MM) Synergies Achieved Target Expense Base FNF Lender Processing Services Pending 100.0$ 5% FNF Land America December 2009 150.0 Exceeded Target 3% FIS Metavante April 2009 225.0 Exceeded Target 3% FIS eFunds September 2007 65.0 Exceeded Target 20% FIS Certegy February 2006 50.0 Exceeded Target 7% FNF Intercept December 2004 25.0 Exceeded Target 16% FNF Aurum March 2004 15.0 Exceeded Target 9% FNF Chicago Title March 2000 90.0 Exceeded Target N/A Average 9% Historically beaten projected savings estimates on average by 33% in prior acquisitions
0, 50, 99 199, 234, 252 141, 216, 248 186, 205, 234 126, 167, 217 59, 137, 201 26, 140, 39 Table (repeat 2 & 3) Heading A 79, 129, 189 Heading B 220, 230, 242 2 208, 216, 232 3 233, 237, 244 Summary • Strong strategic fit – FNF management has significant experience and familiarity with LPS through previous ownership and operating similar businesses – Combination creates a larger, broader, more diversified and recurring revenue base – Makes FNF the nation’s leading title insurance, mortgage technology and mortgage services provider – Deepens relationships with nation’s largest lenders, as LPS’ top customers average a 20-year relationship with the company – Highly recurring revenue and cash flow from technology segment of LPS business • Financially compelling – 11.3% accretive to pro-forma 2012 net earnings, including projected cost synergies – Expect transaction to be meaningfully accretive to future earnings – Cost synergies target of $100 million – Believe we will maintain investment grade ratings 18
