Attached files
| file | filename |
|---|---|
| 8-K - 8-K - ROYAL CARIBBEAN CRUISES LTD | a13-14045_18k.htm |
Exhibit 99.1
|
|
ROYAL CARIBBEAN CRUISES LTD. WWW.RCLINVESTOR.COM |
|
|
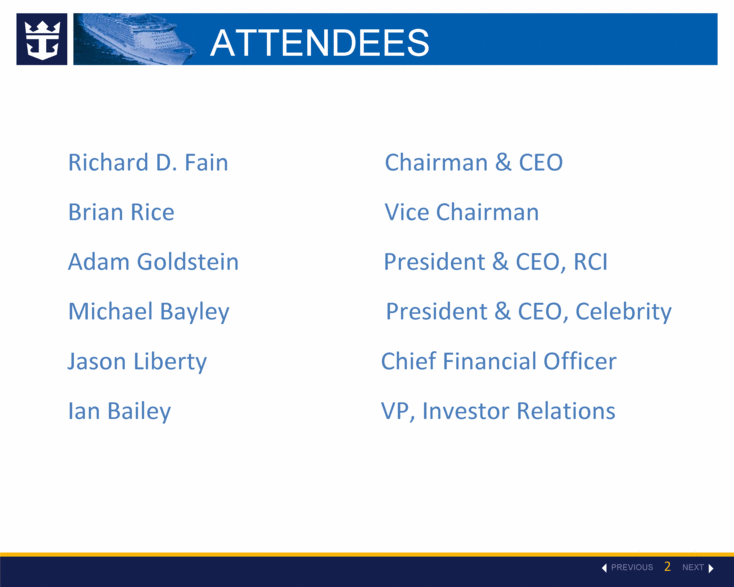
ATTENDEES Richard D. Fain Chairman & CEO Brian Rice Vice Chairman Adam Goldstein President & CEO, RCI Michael Bayley President & CEO, Celebrity Jason Liberty Chief Financial Officer Ian Bailey VP, Investor Relations |
|
|
FORWARD LOOKING STATEMENTS This presentation contains forward looking statements. Please note that actual results could differ materially from those contained herein. For a full discussion regarding the risks, uncertainties and other factors that could impact these statements, please see RCL’s annual and quarterly SEC filings or the company’s Investor Website – www.rclinvestor.com |
|
|
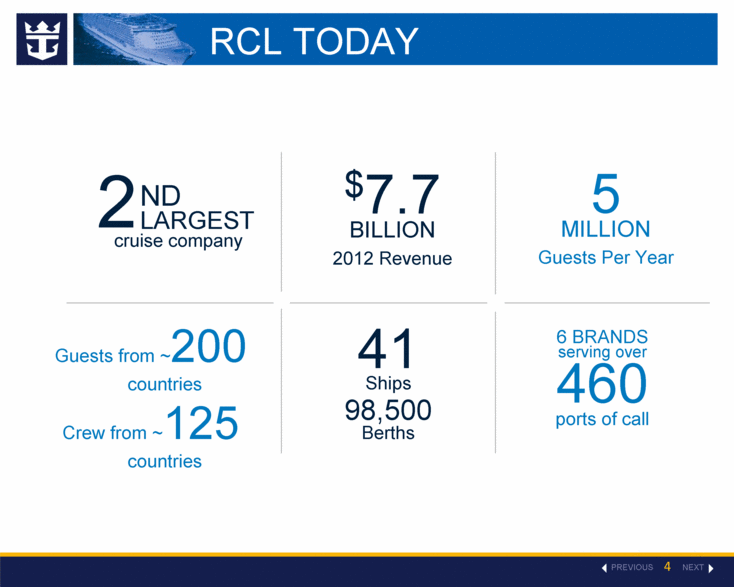
RCL TODAY 2 ND LARGEST cruise company Guests from ~200 countries Crew from ~125 countries $7.7 BILLION 2012 Revenue 5 MILLION Guests Per Year 41 Ships 98,500 Berths 6 BRANDS serving over 460 ports of call |
|
|
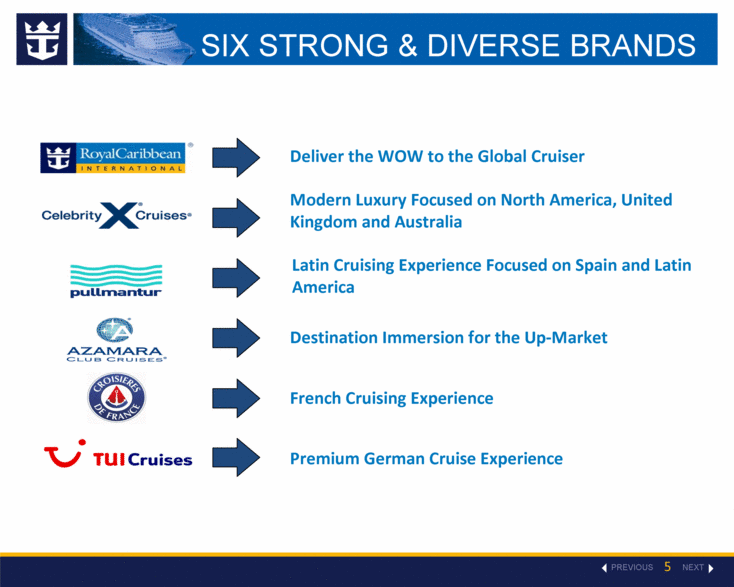
Latin Cruising Experience Focused on Spain and Latin America Deliver the WOW to the Global Cruiser Modern Luxury Focused on North America, United Kingdom and Australia Destination Immersion for the Up-Market French Cruising Experience Premium German Cruise Experience SIX STRONG & DIVERSE BRANDS |
|
|
Improve Shareholder Returns Achieve Investment Grade Moderate Growth CONTINUITY IN STRATEGY |
|
|
Leading Brands/Guest Satisfaction Good Value for Consumers Global Footprint Flexible & Dynamic Sourcing Portable Assets Performance of Newest Hardware Continued Cost Focus ENABLERS OF LONG-TERM SUCESS |
|
|
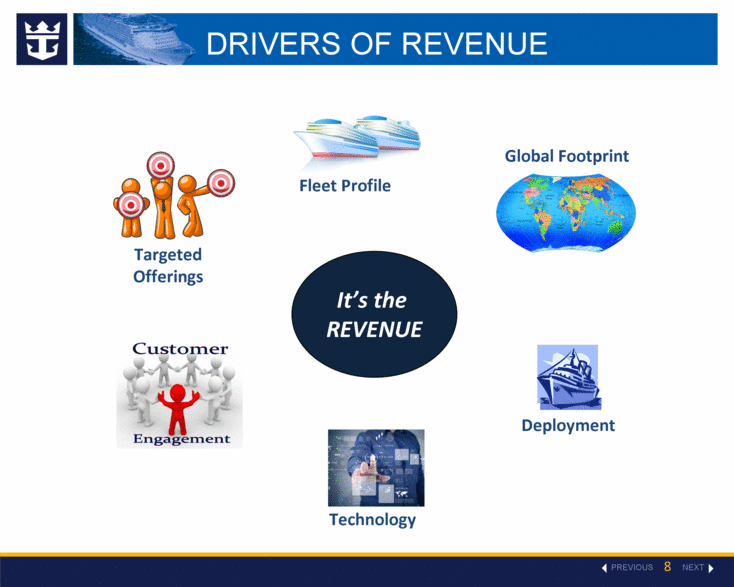
It’s the REVENUE Global Footprint Deployment Fleet Profile Targeted Offerings Technology DRIVERS OF REVENUE |
|
|
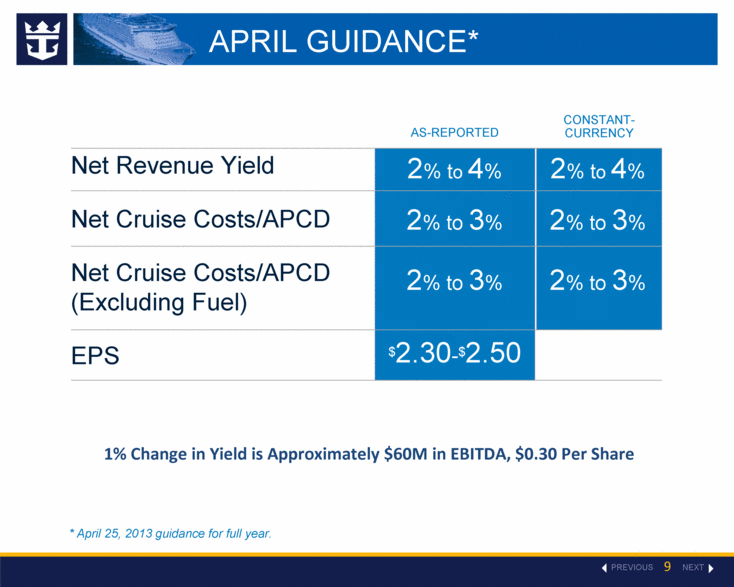
APRIL GUIDANCE* Net Revenue Yield Net Cruise Costs/APCD Net Cruise Costs/APCD (Excluding Fuel) EPS AS-REPORTED CONSTANT-CURRENCY 2% to 4% 2% to 3% 2% to 3% $2.30-$2.50 2% to 4% 2% to 3% 2% to 3% * April 25, 2013 guidance for full year. 1% Change in Yield is Approximately $60M in EBITDA, $0.30 Per Share |
|
|
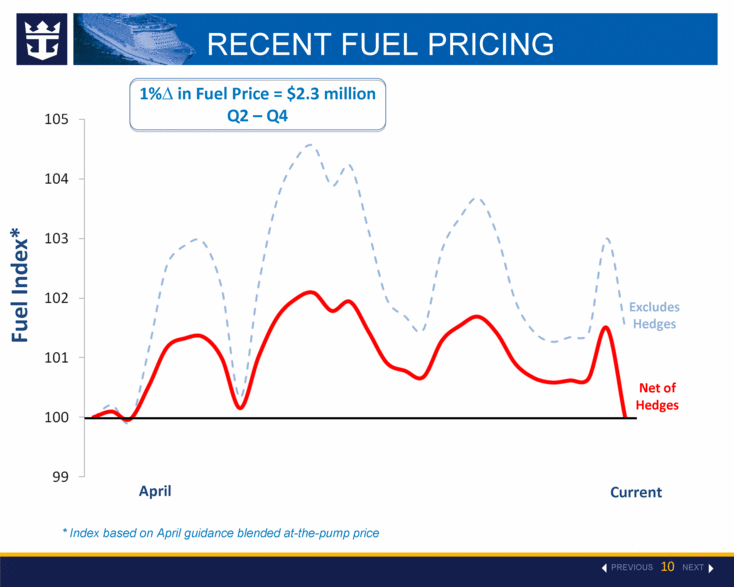
RECENT FUEL PRICING * Index based on April guidance blended at-the-pump price 1% in Fuel Price = $2.3 million Q2 – Q4 Fuel Index* Excludes Hedges Current Net of Hedges April |
|
|
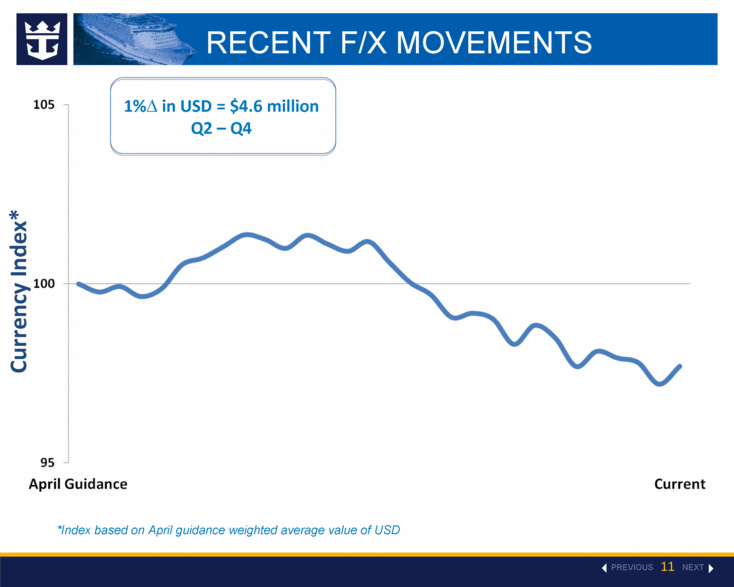
RECENT F/X MOVEMENTS 1% in USD = $4.6 million Q2 – Q4 Currency Index* *Index based on April guidance weighted average value of USD |
|
|
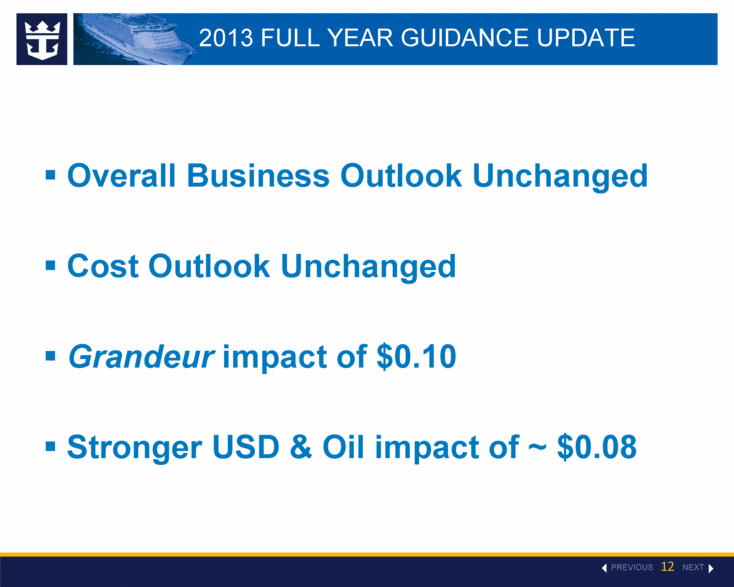
2013 FULL YEAR GUIDANCE UPDATE Overall Business Outlook Unchanged Cost Outlook Unchanged Grandeur impact of $0.10 Stronger USD & Oil impact of ~ $0.08 |
|
|
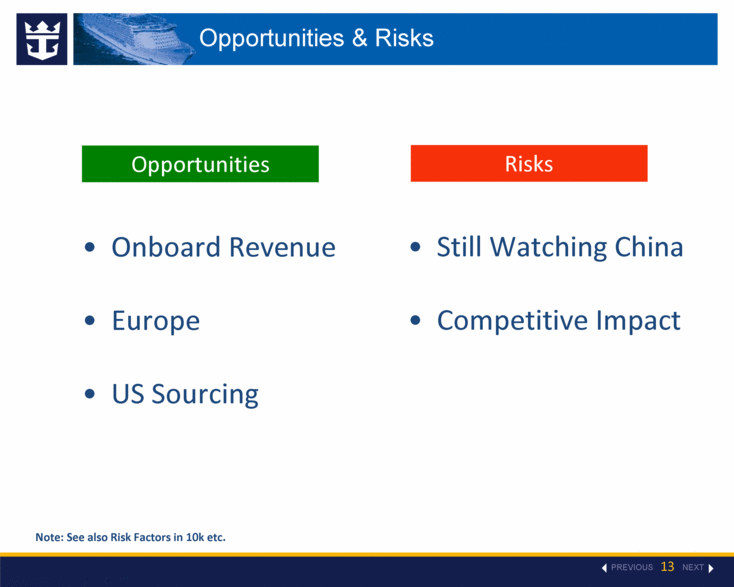
Opportunities & Risks Opportunities Risks Onboard Revenue Europe US Sourcing Still Watching China Competitive Impact Note: See also Risk Factors in 10k etc. |
|
|
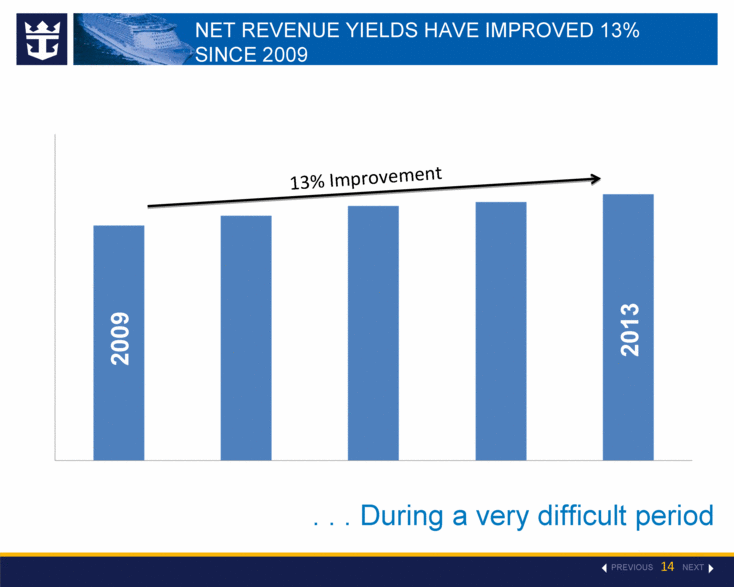
2008 2013 . . . During a very difficult period 2013 2009 2013 NET REVENUE YIELDS HAVE IMPROVED 13% SINCE 2009 2013 13% Improvement |
|
|
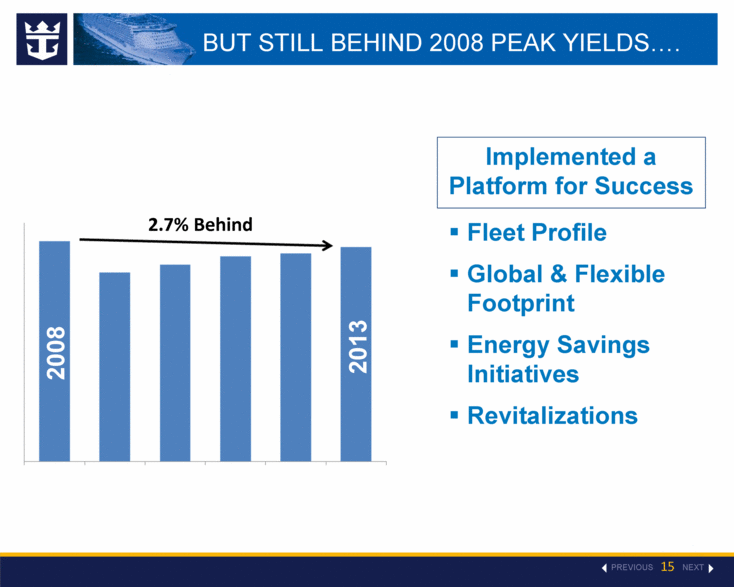
2008 2013 2008 2013 2013 Implemented a Platform for Success Fleet Profile Global & Flexible Footprint Energy Savings Initiatives Revitalizations BUT STILL BEHIND 2008 PEAK YIELDS. 2.7% Behind |
|
|
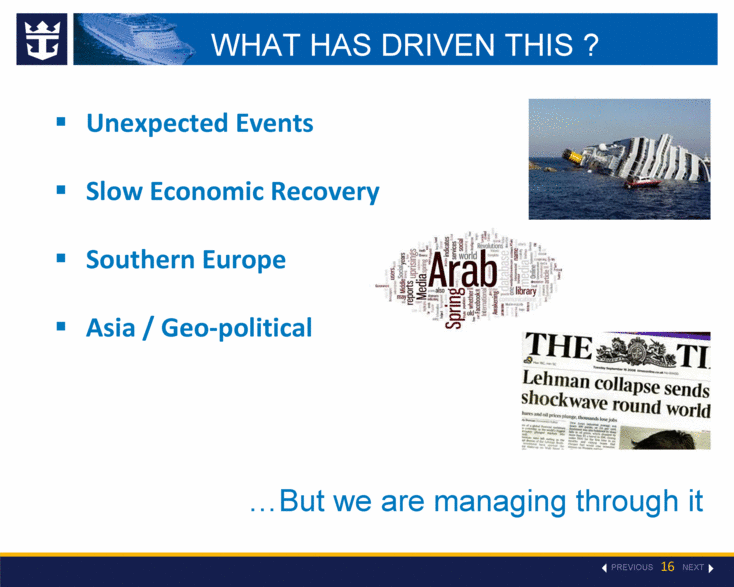
Unexpected Events Slow Economic Recovery Southern Europe Asia / Geo-political But we are managing through it WHAT HAS DRIVEN THIS ? |
|
|
Strengthen/Exploit Strong Branding Shifted Sourcing out of Southern Europe & .Lower Yield Itineraries Revitalized 13 Ships Sold and Transferred Assets Maintain Focus on Costs New Yield Management Tools ACTIONS TAKEN |

