Attached files
| file | filename |
|---|---|
| 8-K - FORM 8-K - MRC GLOBAL INC. | d545176d8k.htm |
 KeyBanc
Capital Markets May 30, 2013
1
May 30, 2013
Jim Braun
EVP & CFO
MRC Global Inc. //
KeyBanc Capital Markets’
Industrial
Automotive and Transportation Conference
Exhibit 99.1 |
 KeyBanc Capital Markets
May 30, 2013
2
2
This presentation contains forward-looking statements within the meaning of
Section 21E of the Securities Exchange Act of 1934, as amended, and Section
27A of the Securities Act, as amended, including, for example, statements about the Company’s business strategy, its industry, its future
profitability, growth in the Company’s various markets, and the Company’s
expectations, beliefs, plans, strategies, objectives, prospects and
assumptions. These forward-looking statements are not guarantees of
future performance. These statements involve known and unknown risks,
uncertainties
and
other
factors
that
may
cause
the
Company’s
actual
results
and
performance
to
be
materially
different
from
any
future
results
or
performance
expressed
or
implied
by
these
forward-looking
statements.
For
a
discussion
of
key
risk
factors,
please
see
the
risk
factors
disclosed
in
the
Company’s annual report on Form 10-K for the year ended December 31, 2012
and the registration statement (including a prospectus and prospectus
supplement)
for
the
offering
to
which
this
communication
relates,
which
are
available
on
the
SEC’s
website
at
www.sec.gov
and
on
the
Company’s
website, www.mrcglobal.com.
Undue reliance should not be placed on the Company’s forward-looking
statements. Although forward-looking statements reflect the Company’s good
faith
beliefs,
reliance
should
not
be
placed
on
forward-looking
statements
because
they
involve
known
and
unknown
risks,
uncertainties
and
other
factors, which may cause our actual results, performance or achievements to differ
materially from anticipated future results, performance or achievements
expressed or implied by such forward-looking statements. The Company undertakes no obligation to publicly update or revise any
forward-looking statement, whether as a result of new information, future
events, changed circumstances or otherwise. Statement Regarding Use of
Non-GAAP Measures: The Non-GAAP financial measures contained in this
presentation (EBITDA, Adjusted EBITDA, Adjusted EPS and variations thereof) are not measures of
financial performance calculated in accordance with GAAP and should not be
considered as alternatives to net income (loss) or any other performance
measure derived in accordance with GAAP or as alternatives to cash flows from
operating activities as a measure of our liquidity. They should be viewed
in addition to, and not as a substitute for, analysis of our results reported in
accordance with GAAP, or as alternative measures of liquidity. Management
believes that certain non-GAAP financial measures provide a view to measures
similar to those used in evaluating our compliance with certain financial
covenants under our credit facilities and provide financial statement users
meaningful comparisons between current and prior year period results. They
are also used as a metric to determine certain components of performance-based
compensation. The adjustments and Adjusted EBITDA are based on
currently available information and certain adjustments that we believe are
reasonable and are presented as an aid in understanding our operating
results. They are not necessarily indicative of future results of operations that
may be obtained by the Company. Forward Looking Statements and Non-GAAP
Disclaimer |
 KeyBanc Capital Markets
May 30, 2013
3
By the Numbers
Industry Sectors
Product Categories
Business Model
2012 Sales
$5.57 B
Upstream
Line Pipe / OCTG
Locations
400+
Countries
44+
Midstream
Valves
Customers
18,000+
Suppliers
18,000+
Downstream/
Industrial
Fittings / Flanges
SKU’s
175,000+
Employees
4,750+
Company Snapshot
Canada
14%
Europe / Asia Pacific
10%
MRC is the largest global distributor of pipe, valves and fittings (PVF) to the
energy industry MRO
70%
Projects
30%
U.S.
76% |
 KeyBanc Capital Markets
May 30, 2013
4
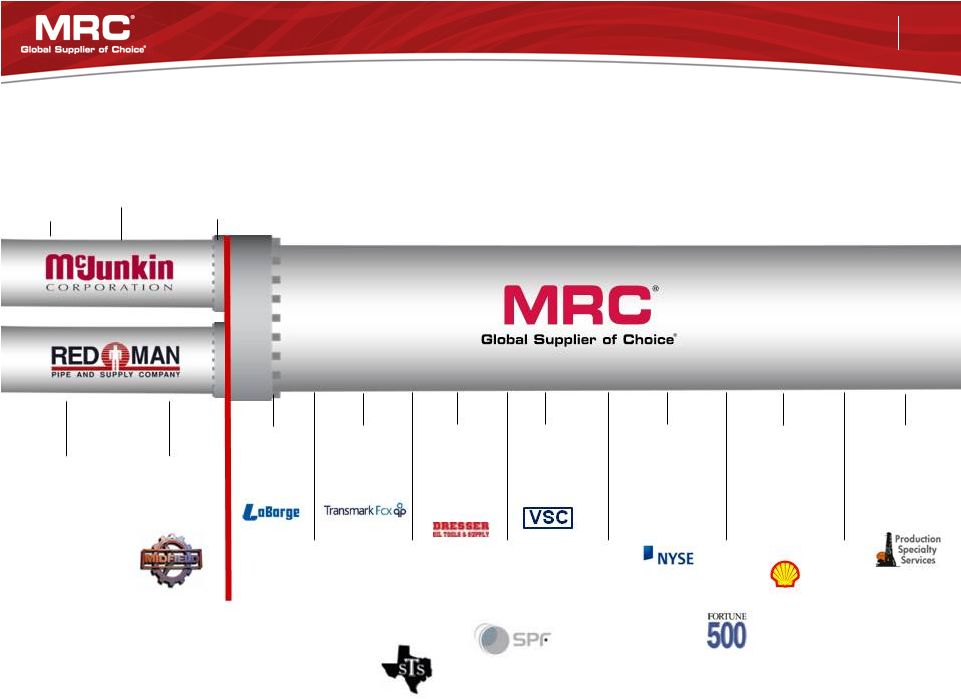
Founded
1921
1989
Acquires
Appalachian
Pipe & Supply
2007
Goldman Sachs
Capital Partners
Strategic
Investment
1977
Founded
2005
Acquires
Midfield
Supply
2007
Merger of
McJunkin
and Red Man
to form
MRC
2009
MRC opens
Houston HQ
2011
MRC
acquires
SPF
2011
MRC
acquires
VSC
2012
MRC
acquires
OneSteel
Piping
Systems
2009
MRC
acquires
Transmark
2010
MRC
acquires
South
Texas
Supply
2010
MRC
acquires
Dresser
Oil Tools
MRC’s 92 Year History // The Road to the Fortune 500
2012
MRC
Global
IPO;
begins
trading
on NYSE
2012
MRC
listed on
Fortune 500
2012
MRC
signs the
industry’s
first global
valve
contract with
Shell
2008
MRC
acquires
LaBarge
2012
MRC
acquires
Chaparral
Supply
2012
MRC
acquires
Production
Specialty
Services
(now #451, up from #493 after IPO
and #10
on the Barron’s 500 of Top Companies) |
 KeyBanc Capital Markets
May 30, 2013
5
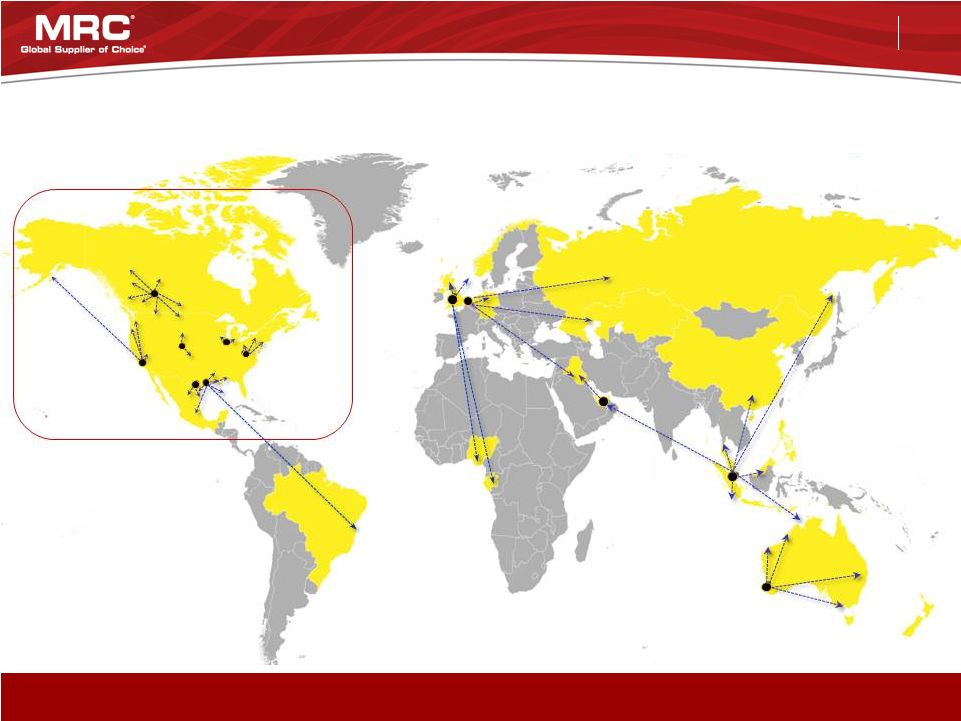
Clear Market Leader Globally and in the Shales
•
~2/3 of sales are under contracts
1
with a 95%
renewal rate since 2000
•
Continue to grow “share”
and “size of wallet”
with
major existing customers while adding new ones
•
North American Shales as much as 5x PVF
intensive as conventional activity
Leading
industrial
distributor
of
PVF
globally
to
the
energy
and
industrials
sectors
Note: As of 31-Dec-2012
1
Including contracts and pricing arrangements.
2
International locations include sales offices and pipe yards at MRC locations.
Ecuador
Equatorial Guinea
Finland
France
Germany
India
Indonesia
Iraq
Italy
Kazakhstan
Kuwait
Malaysia
Mexico
Netherlands
New Zealand
Nigeria
Norway
Pakistan
Peru
Poland
Russia
Saudi Arabia
44+ Countries & 400+ Locations
Angola
Aruba
Australia
Austria
Belgium
Brunei
Cameroon
Canada
China
Colombia
Denmark
Branch operations and significant direct export sales
Singapore
South Africa
South Korea
Spain
Sweden
Thailand
Trinidad
Turkey
United Arab Emirates
United Kingdom
United States
2
North America
International
Branches
190+
50+
Distribution Centers
8 = U.S.
1 = Canada
1 = U.K.
1 = Singapore
1 = Netherlands
1 = Australia
Valve Automation Centers
12
12
Pipe Yards
120
10 |
 KeyBanc Capital Markets
May 30, 2013
6
By Geography
Note: Business mix based on fiscal year 2012.
By Product Line
By Industry Sector
MRC Diversification
1 -
Approximately 17% (or $200 M) of total
for valves is valve automation
Industry leading product, end market and geographic diversification
|
 KeyBanc Capital Markets
May 30, 2013
7
Core Distribution Processes
•
Cost Savings and Efficiencies
•
Order Management and Product
Bundling
•
Quality Assurance
•
Supplier Registration
•
Logistics Management
•
Customer Reporting
Integrated Services
•
Technical Assistance / Product
Recommendation
•
Inventory Consignment / Just-in-
Time Delivery
•
Customized IT Solutions
•
Warehouse Management
Service Offerings
Products
Delivery of Mission Critical Products and Value Added Services
Generating savings and efficiencies for our customers
while enabling them to focus on their core competencies
•
175,000+ unique, mission-critical products
used in high pressure, high stress or
abrasive operating environments
•
Low cost relative to overall cost of
maintenance or project spend so service is
paramount |
 KeyBanc Capital Markets
May 30, 2013
8
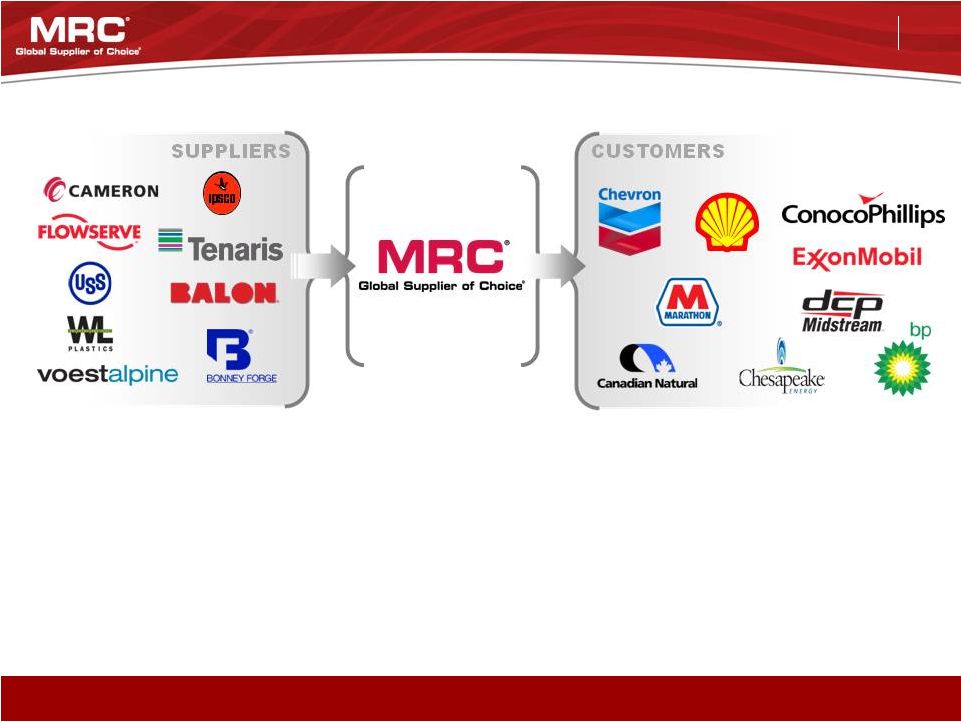
Supplier Benefits
Customer Benefits
MRC plays a critical role in the complex, technical, global energy supply chain
Strong
Long-Term
Relationships
with
“Blue
Chip”
Customers
and
Suppliers
Mutual Benefits
•
Access to over 18,000+
customers
•
Manufacturing and scale
efficiencies
•
Leverage MRC’s technical
sales force
•
Trusted long-term partnerships
•
Financial stability
•
MRC Approved Supplier List /
Quality Program
•
Access to over 18,000+ suppliers
worldwide
•
Efficiencies and inventory
management
•
Access to a broad product offering
(~$1B inventory)
•
Access to global sourcing from 35
countries |
 KeyBanc Capital Markets
May 30, 2013
9
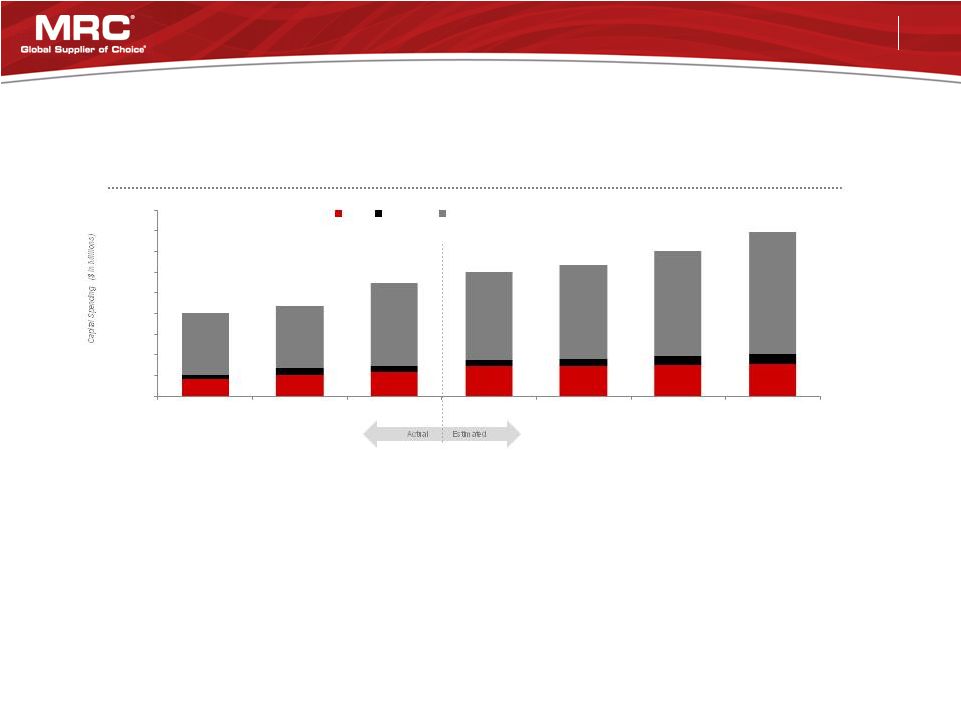
Positive Energy and Industrial Spending Trends
•
Global:
Energy demand continues to grow with sizable MRO/project opportunities given the
age of global energy infrastructure and slowly improving global
economy •
Upstream:
Shales
extremely
active,
shift
to
Oil/NGL
E&P,
Natural
Gas
MRO
production,
Oil
Sands
activity seeing strong growth
•
Midstream:
Shale activity in new unsupported areas; increased pipeline integrity regulation
plus aging pipeline infrastructure accelerating MRO rates; gas utilities
continue to outsource PVF procurement •
Downstream:
MRO and infrastructure projects accelerating; strong growth in chemical/industrial
with low natural gas prices and steady PMI; rebound in refinery utilization
/ margins Multi-Year Exploration & Production Spending Forecast
Source: Barclays Global 2013 E&P Spending Outlook Dec 2012
0
100,000
200,000
300,000
400,000
500,000
600,000
700,000
800,000
900,000
2009A
2010A
2011A
2012E
2013E
2014E
2015E
US
Canada
Outside North America |
 KeyBanc Capital Markets
May 30, 2013
10
(US$ in millions)
1
Reflects reported revenues for the year of acquisition
MRC has completed and successfully acquired $3 billion of revenues since 2007
M&A Driven Growth: Track Record of Success
Date
Acquisition
Rationale
Region
Revenue
1
Apr-07
Midway Tristate
Appalachian
/ Rockies PVF
U.S.
$150
Oct-07
Jul
-08
Red Man
Midfield
(49%)
Transformational
Merger
100% Ownership
of Canadian
Subsidiary
U.S.
Canada
1,982
Oct-08
LaBarge
Midstream
U.S.
233
Oct-09
Transmark
International
MRO Platform
Europe and Asia
346
May-10
South Texas Supply
Eagle Ford
South Texas
9
Aug
-10
Dresser
Oil Tools Supply
Bakken
North Dakota
13
Jun
-11
SPF
Australia / SE Asia Projects
Australia
91
Jul
-11
VSC
Valve Automation
U.S.
13
Mar-12
On
eSteel
Piping Systems
Australia PVF MRO
Australia
174
Jun
-12
Chaparral Supply
Mississippian Lime MRO
Oklahoma / Kansas
71
Dec-12
Production Specialty Services
Permian Basin / Eagle Ford
U.S.
127
Total
$3,209 |
 KeyBanc Capital Markets
May 30, 2013
11
Today
10 –
15 Years Ago
Next 1 to 5 Years
Changing PVF Energy Distribution Landscape
Consolidating energy industry benefits global players
Procurement
•
PVF purchasing handled
locally
•
Facility-by-facility basis
•
Separate contracts
by product class:
•
Pipe
•
Valves
•
Fittings
•
Flanges
•
Supplies
Centralized
Procurement
•
Purchasing more
consolidated
•
Contracts by end
segment:
•
Upstream
•
Midstream
•
Downstream
•
Contracts cover PVF
•
Customers align with
suppliers with size/scale
Global
Procurement
•
Global upstream /
midstream /
downstream PVF
contracts
Decentralized |
 KeyBanc Capital Markets
May 30, 2013
12
MRC & Shell // Global Valve Contract for MRO and Projects
Industry’s first valve and combined North American PFF contract
Shell has one of the top 5 global CAPEX budgets
Deepwater
GOM
NA Tight Gas
& Liquids
Brazil
Offshore
BC-10
West
Africa
Future
Middle
East
RDC
FLNG
/ LNG
Oceania
Sakhalin
Shell
Offshore
Coal Bed
Methane
Cracker Unit
Pittsburgh, PA
Tar Sands
Kashagan
Ph1
Alaska
Offshore
LNG /
GTL
North America
Includes PFF
Salym
Development
LNG
China
Tight Gas |
 KeyBanc Capital Markets
May 30, 2013
13
•
Global
Energy Demand Favorable:
Continued
general economic recovery, commodity price
environment, global supply constraints and
increased energy consumption
•
Shale
Activity
Unprecedented:
Shale
gas,
as
a
percentage
of
total
natural
gas
production,
has
rapidly
increased
from
less
than
2%
of
total
U.S.
natural
gas
production
in
2001
to
30%
in
2011
and
is
projected
to
increase
to
49%
by
2035
•
Accelerating
MRO:
Increased
utilization
of
processing
facilities
and
decreasing
quality
of
energy
feedstocks
accelerating
PVF
replacement
rates
•
Recovering
Project
Outlook:
Infrastructure
and
E&P
projects
rebounding
with
economic
growth
and
need
for
capacity
expansions
Large,
Fragmented
Market
with
Significant
Growth
Opportunities
•
One-Stop
Solution:
Leverage
extensive
product
offering
and
be
“one-stop”
PVF
solution
•
Cross-Selling:
Introduce
existing
customers
to
complete
PVF
product
portfolio
•
Projects:
Further
penetrate
existing
customer’s
project
activity
•
Investments:
Add
incremental
branches,
DCs
and
sales
people
•
International:
Expand
further
globally with existing customers
•
Adjacencies:
Add
new
products
to
existing
PVF
“bundle”
or
target
new
complimentary
end
markets
•
Core
Competency:
Proven
ability
to
identify,
execute
and
integrate
strategic
and
tuck-in
acquisitions
•
Highly
Fragmented:
Opportunities
to
extend
product
offering,
end
markets
and/or
geographic
coverage
MRC is in an excellent position to continue to exceed industry growth
Long-term
Targets:
Revenue
Growth:
10-12%
|
Adjusted
EBITDA
Margin:
10+%
|
Leverage:
2.0
–
3.0x
Note: All targets are long term.
Global E&P Spending Growth –
Positive Secular Trends
(Target 6 –
7% Annually)
Organic Growth –
Leverage Scale
(Target: 8 –
9% Annually)
Acquisitions –
Accretive Expansion
(Target: 2 –
3% Annually) |
 KeyBanc Capital
Markets May 30, 2013
14
Financial Overview |
 KeyBanc Capital Markets
May 30, 2013
15
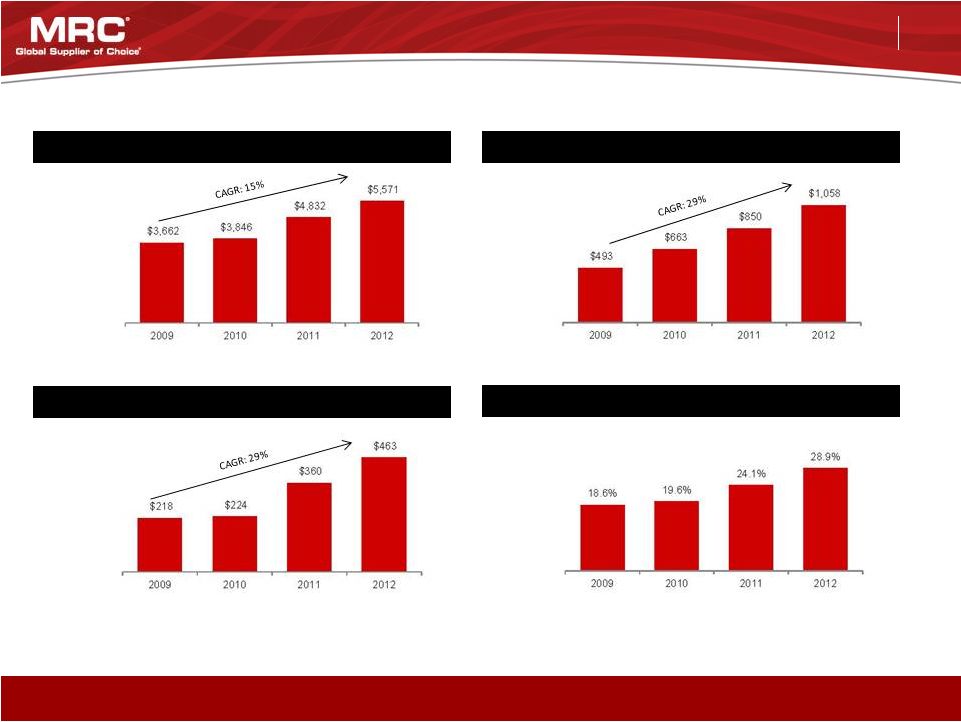
Strong Growth and Margin Drive Attractive Returns
Sales
Adjusted Gross Profit and % Margin
Adjusted EBITDA and % Margin
Adjusted EBITDA RONA
Y-o-Y Growth
5%
26%
15%
(US$ in millions)
Y-o-Y Growth
34%
28%
24%
Y-o-Y Growth
3%
61%
29%
6.0%
5.8%
7.5%
8.3%
13.5%
17.2%
17.6%
19.0%
Strong growth and continued improving profitability
1
Source: Company management; Company Filings
1
Adjusted
EBITDA
RONA
calculation
=
Adjusted
EBITDA
/
(EOY
Inventory
+
EOY
LIFO
reserve
+
EOY
Receivables
+
EOY
PP&E
–
Payables). |
 KeyBanc Capital Markets
May 30, 2013
16
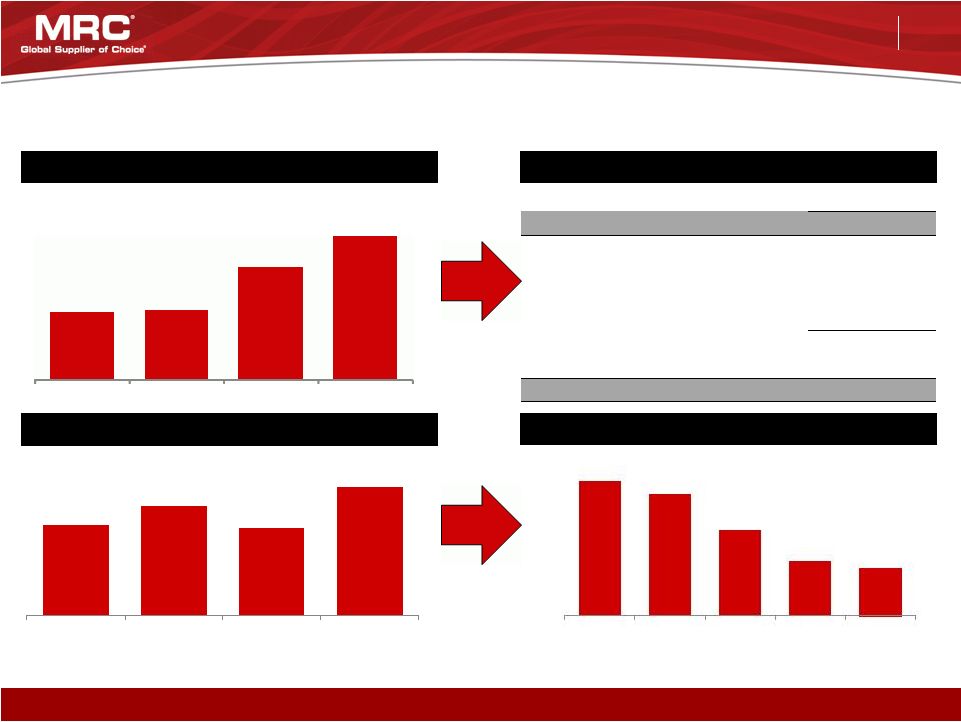
Significant Cash Flow for Deleveraging and Growth Investments
Capital Structure
Cumulative FCF
Net Leverage
(US$ in millions)
1
Strong cash flows allow for continued deleveraging
($ in millions)
March 31, 2013
Cash and Cash Equivalents
$ 27
Total Debt (including current portion):
Term Loan B due 2019, net of discount
641
Global ABL Facility due 2017
426
Other
6
Total Debt
$ 1,073
Total Equity
1,231
Total Capitalization
$ 2,304
$495
$597
$479
$695
2009
2010
2011
2012
1
6.4 x
5.8 x
4.1 x
2.6 x
2.3 x
2009
2010
2011
2012
Since 2008, Free Cash Flow defined as cash from operations, less fixed asset purchases (net of
disposals). $202
$210
$342
$437
2009
2010
2011
2012
5.5%
5.5%
7.8%
7.1%
Mar
-
13
Adjusted
EBITDA
–
Capex
and
%
Margin |
 KeyBanc Capital Markets
May 30, 2013
17
Sales
Margins
Net Income
Q1 2013 Financial Summary
(In millions except per share data)
Q1
2012
2013
OCTG
$221
$126
All Other
1,162
1,179
2%
Total
$1,383
$1,305
Adjusted Gross Profit
Adjusted EBITDA
Net Income
EPS
$ 260
$ 262
Q1 2012
Q1 2013
18.8%
20.1%
$ 115
$ 104
Q1 2012
Q1 2013
8.3 %
8.0%
$ 38
$ 46
Q1 2012
Q1 2013
$ 0.44
$ 0.45
Q1 2012
Q1 2013
•
Total revenue was impacted by strategic OCTG
reduction
•
Acquisition related revenue offset slowdown in
customer spending
•
Year-on-year adjusted gross profit margin expansion of
~130 bps due to emphasis on higher margin products
•
Adjusted EBITDA margins reflected lower sales
•
Net Income improvement driven by $18 million interest
expense savings
•
EPS reflects additional shares outstanding in 2013 |
 KeyBanc Capital Markets
May 30, 2013
18
Appendix |
 KeyBanc Capital Markets
May 30, 2013
19
March 31
December 31
($ in millions)
2013
2012
2012
2011
2010
2009
Net income (loss)
$ 46.2
$ 37.5
$118.0
$ 29.0
$(51.8)
$(339.8)
Income taxes
25.0
21.1
63.7
26.8
(23.4)
(15.0)
Interest expense
15.3
33.7
112.5
136.8
139.6
116.5
Write off of debt issuance costs
-
1.7
1.7
9.5
-
-
Depreciation and amortization
5.4
4.1
18.6
17.0
16.6
14.5
Amortization of intangibles
13.2
12.3
49.5
50.7
53.9
46.6
Amortization of purchase price
accounting
-
-
-
-
-
15.7
Change in fair value of derivative
instruments
(0.6)
(2.1)
(2.2)
(7.0)
4.9
(8.9)
Closed locations
-
-
-
-
(0.7)
1.4
Share based compensation
1.9
1.8
8.5
8.4
3.7
7.8
Franchise taxes
-
-
-
0.4
0.7
1.4
Loss (gain) on early extinguishment of
debt
-
-
114.0
-
-
(1.3)
Goodwill and intangibles impairment
-
-
-
-
-
386.1
Inventory write-down
-
-
-
-
0.4
46.5
IT system conversion costs
-
-
-
-
-
2.4
M&A transaction & integration expenses
-
-
-
0.5
1.4
17.5
Pension settlement
-
-
4.4
-
-
-
Legal and consulting expenses
-
-
(1.2)
9.9
4.2
1.9
Joint venture termination
-
-
-
1.7
-
-
Provision for uncollectible accounts
-
-
-
0.4
(2.0)
1.0
Severance and related costs
-
-
-
1.1
3.2
4.4
MRC Transmark pre-Acquisition
contribution
-
-
-
-
-
38.5
LIFO
(3.1)
6.9
(24.1)
73.7
74.6
(115.6)
Other expenses
0.6
(1.8)
(0.2)
1.6
(1.1)
(3.1)
Adjusted EBITDA
$ 103.9
$ 115.2
$ 463.2
$ 360.5
$ 224.2
$ 218.5
EBITDA Adjustments |
 KeyBanc Capital Markets
May 30, 2013
20
December 31
($ in millions)
EBITDA
$
463.2
$
360.5
$
224.2
$
218.5
AR
$
823.2
$
791.3
$
596.4
$
506.2
Inventory at AC
1,121.2
1,074.2
866.8
898.5
Fixed Assets
122.5
107.4
104.7
111.5
(-) AP
(438.4)
(479.6)
(426.6)
(338.5)
PSS Adjustment
(28.0)
—
—
—
Total Adjusted Net Assets
$
1,600.5
$
1,493.3
$
1,141.3
$
1,177.7
Inventory at LIFO
970.2
899.1
765.4
871.6
(+) LIFO reserve
151.0
175.1
101.4
26.9
Total Inventory
$
1,121.2
$
1,074.2
$
866.8
$
898.5
RONA
28.9
%
24.1
%
19.6
%
18.6
%
2011
2010
2009
2012
December 31
($ in millions)
Stockholders' Equity
$
1,185.9
$
720.8
$
689.8
$
743.9
Long term debt
1,256.6
1,526.7
1,360.2
1,452.6
Deferred taxes
334.5
357.2
373.7
377.9
Other liabilities
147.7
143.3
140.8
170.2
Intangible assets
(1,359.7)
(1,333.1)
(1,366.5)
(1,425.7)
LIFO reserve
151.0
175.1
101.4
26.9
Other assets
(50.4)
(50.6)
(101.9)
(111.9)
Cash
(37.1)
(46.1)
(56.2)
(56.2)
PSS Adjustment
(28.0)
—
—
—
Total Adjusted Net Assets
$
1,600.5
$
1,493.3
$
1,141.3
$
1,177.7
Net income (loss)
$
118.0
$
29.0
$(51.8)
$(339.8)
Stockholders' equity
1,185.9
720.8
689.8
743.9
Net income / stockholders'equity
10.0
%
4.0
%
(7.5)%
(45.7)%
2012
2011
2010
2009
Adjusted EBITDA RONA
Calculation
Total Adjusted Net Assets
GAAP Reconciliation |
 KeyBanc Capital Markets
May 30, 2013
21
March 31
December 31
($ in millions)
2013
2012
2012
2011
2010
2009
Gross Profit
$ 246.6
$ 236.6
$ 1,013.7
$ 708.2
$ 518.1
$ 548.0
Depreciation and amortization
5.4
4.1
18.6
17.0
16.6
14.5
Amortization of intangibles
13.2
12.3
49.5
50.7
53.9
46.6
(Decrease) increase in LIFO reserve
(3.1)
6.9
(24.1)
73.7
74.6
(115.6)
Adjusted Gross Profit
$ 262.1
$ 259.9
$ 1,057.7
$ 849.6
$ 663.2
$ 493.5
December 31
($ in millions)
2012
2011
2010
2009
Cash from operations
$ 240.1
$(102.9)
$ 112.7
$ 505.5
Fixed asset purchases
(26.2)
(18.1)
(14.3)
(16.7)
Disposal of fixed assets
2.3
3.1
3.1
6.5
Free cash flow
$216.2
$(117.9)
$ 101.5
$ 495.3
Cummulative free cash flow
$ 695.1
$ 478.9
$ 596.8
$ 495.3
Adjusted Gross Profit GAAP Reconciliation
Free Cash Flow Calculation |