Attached files
| file | filename |
|---|---|
| 8-K - TRUSTCO BANK CORP NY 8-K 5-23-2013 - TRUSTCO BANK CORP N Y | form8k.htm |
Exhibit 99(a)

Welcome to the 2013 Annual Meeting

Shareholder Assembly Agenda Deposits Loan Portfolio Investment Portfolio Dividends & Capital Growth Ratio Analysis Stock Performance Questions and Answers

Deposit Growth ($000)

Number of Branches & Average Size
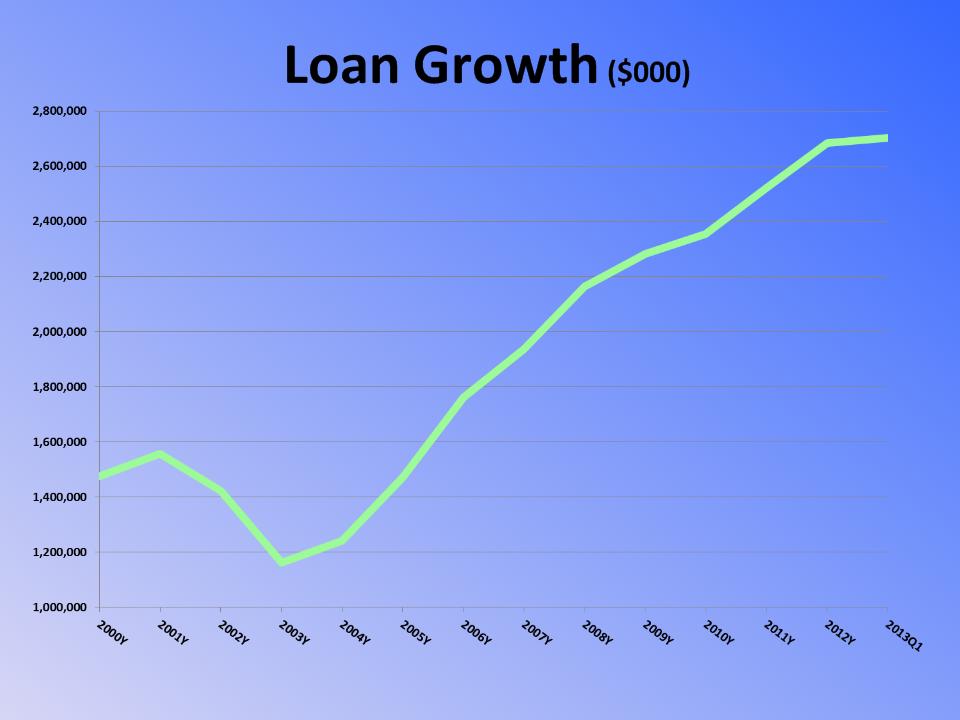
Loan Growth ($000)
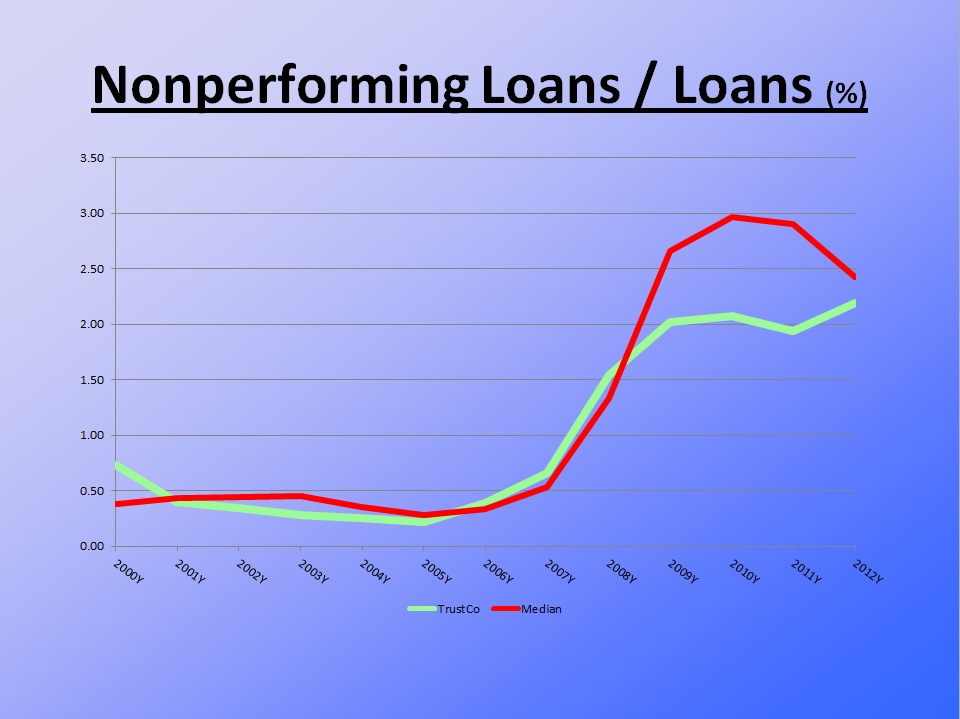
Nonperforming Loans / Loans (%)
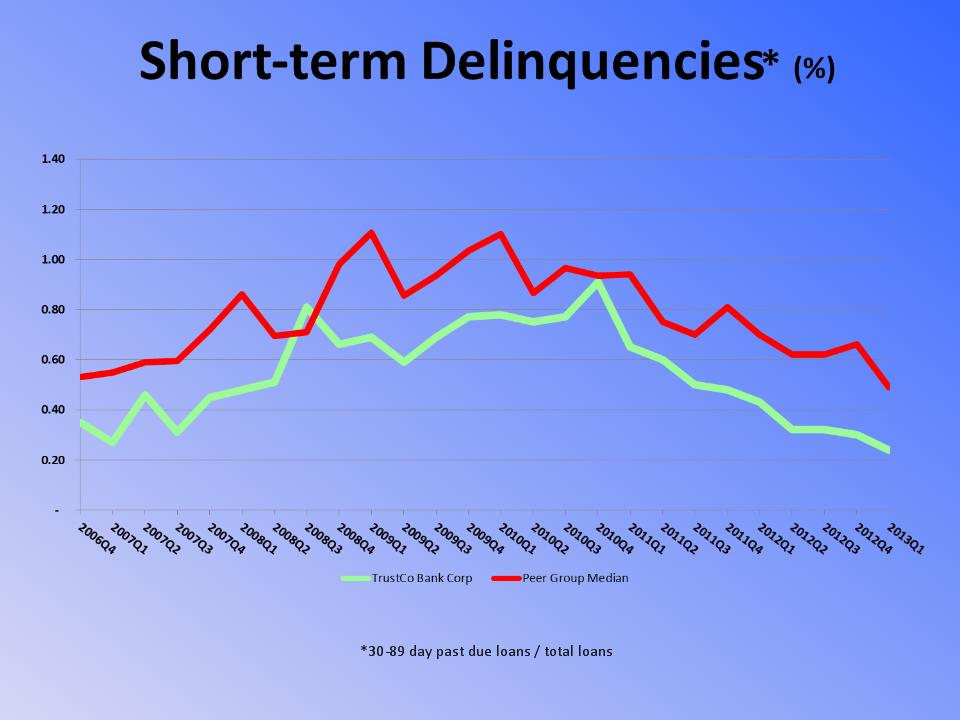
Short-term Delinquencies* (%) *30-89 day past due loans / total loans
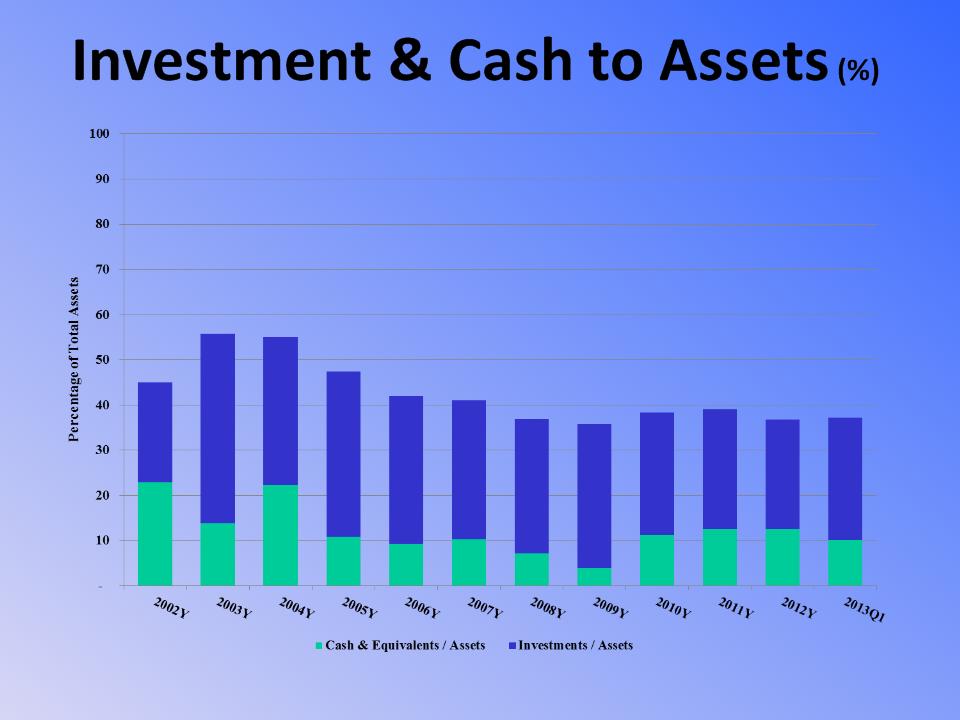
Investment & Cash to Assets (%)

Modest margin declines recently, but flattened expenses….. …should help drive ROE and ROA as credit costs decline and growth continues

Dividends & Capital Growth 2000-2012 Dividends Paid: $6.27 per share Dividends Paid: $471 million total Shareholders’ Equity: Increase of 83%

TrustCo vs. Peers *All public owned banking institutions covered by SNL Financial with assets of $2 to $10 billion as of December 31, 2012; peer numbers are the medians for the full year 2012. **Includes restructured loans TrustCo TrustCo TrustCo TrustCo Peers* 2010 2011 2012 Q1/13 2012 Return on Average Equity 11.5% 11.0% 10.7% 10.4% 8.6% Return on Average Assets 0.77% 0.81% 0.87% 0.86% 0.93% Net Interest Margin 3.50% 3.40% 3.20% 3.19% 3.75% Nonperforming Loans/ Loans 2.07% 1.93% 2.20% 2.13% 2.43% 30-89 Day PD Loans / Loans 0.91% 0.48% 0.30% 0.24% 0.49% Efficiency Ratio 51.4% 50.0% 52.3% 54.3% 61.4%

3 Year Stock Performance* *May 3, 2010 to May 1, 2013, Total Return

Forward Looking Statements Safe Harbor Regarding Forward-Looking Statements This presentation may contain forward-looking information about TrustCo Bank Corp NY (“the Company”) that is intended to be covered by the safe harbor for forward-looking statements provided by the Private Securities Litigation Reform Act of 1995. Actual results and trends could differ materially from those set forth in such statements due to various risks, uncertainties and other factors. Such risks, uncertainties and other factors that could cause actual results and experience to differ from those projected include, but are not limited to, the following: credit risk, the effects of and changes in, trade, monetary and fiscal policies and laws, inflation, interest rates, market and monetary fluctuations, competition, the effect of changes in financial services laws and regulations, real estate and collateral values, changes in accounting policies and practices, changes in local market areas and general business and economic trends and the matters described under the heading “Risk Factors” in our most recent annual report on Form 10-K and our other securities filings. The statements are valid only as of the date hereof and the Company disclaims any obligation to update this information except as may be required by applicable law. Note: Data in this presentation was obtained from SNL Financial and from the Company’s SEC filings.

2013 Annual Meeting Questions and Answers

2013 Annual Meeting Thank You for Attending
-19-