Attached files
| file | filename |
|---|---|
| 8-K - FORM 8-K - Bristow Group Inc | d542008d8k.htm |
 Fourth Quarter FY13
Earnings Presentation
Bristow Group Inc.
May 23, 2013
Exhibit 99.1 |
 2
Fourth quarter earnings call agenda
Introduction
CEO remarks and operational highlights
Current and future financial performance
Closing remarks
Questions and answers
Linda McNeill, Director Investor Relations
Bill Chiles, President and CEO
Jonathan Baliff, SVP and CFO
Bill Chiles, President and CEO |
 3
Forward-looking statements
This
presentation
may
contain
“forward-looking
statements”
within
the
meaning
of
the
Private
Securities Litigation Reform Act of 1995. Forward-looking statements include
statements about our future business, operations, capital expenditures,
fleet composition, capabilities and results; modeling information, earnings
and adjusted earnings growth guidance, expected operating margins and other
financial projections; future dividends, share repurchase and other uses of excess
cash; plans, strategies
and
objectives
of
our
management,
including
our
plans
and
strategies
to
grow
earnings
and
our business, our general strategy going forward and our business model; expected
actions by us and by third parties, including our customers, competitors and
regulators impact of grounding and the effects
thereof;
the
valuation
of
our
company
and
its
valuation
relative
to
relevant
financial
indices;
assumptions underlying or relating to any of the foregoing, including assumptions
regarding factors impacting our business, financial results and industry;
and other matters. Our forward-looking statements
reflect
our
views
and
assumptions
on
the
date
of
this
presentation
regarding
future
events
and
operating
performance.
They
involve
known
and
unknown
risks,
uncertainties
and
other
factors,
many of which may be beyond our control, that may cause actual results to differ
materially from any future results, performance or achievements expressed or
implied by the forward-looking statements.
These risks, uncertainties and other factors include
fluctuations in the demand for our services;
fluctuations in worldwide prices of and demand for natural gas and oil;
fluctuations in levels of natural gas and oil exploration and development
activities; the impact of competition; actions by customers; the risk of
reductions in spending on helicopter services by governmental agencies; changes in tax and
other laws and regulations; |
 4
Forward-looking statements (continued)
changes
in
foreign
exchange
rates
and
controls;
risks
associated
with
international
operations;
operating risks inherent in our business, including the possibility of declining
safety performance; general economic conditions including the capital and
credit markets; our ability to obtain financing; the risk of grounding of
segments of our fleet for extended periods of time or indefinitely; our ability to re-
deploy our aircraft to regions with greater demand; our ability to acquire
additional aircraft and dispose of older aircraft through sales into the
aftermarket; the possibility that we do not achieve the anticipated benefit
of our fleet investment program; availability of employees; political instability, war or acts of
terrorism in any of the countries where we operate; and those
discussed under the captions “Risk
Factors”
and “Management’s Discussion and Analysis of Financial Condition and
Results of Operations”
in our Annual Report on Form 10-K for the fiscal year-ended March 31,
2013. We do not undertake any obligation, other than as required by law, to
update or revise any forward-looking statements, whether as a result of
new information, future events or otherwise. |
 5
Chief Executive Officer comments
Bill
Chiles
President
and
CEO
, |
 6
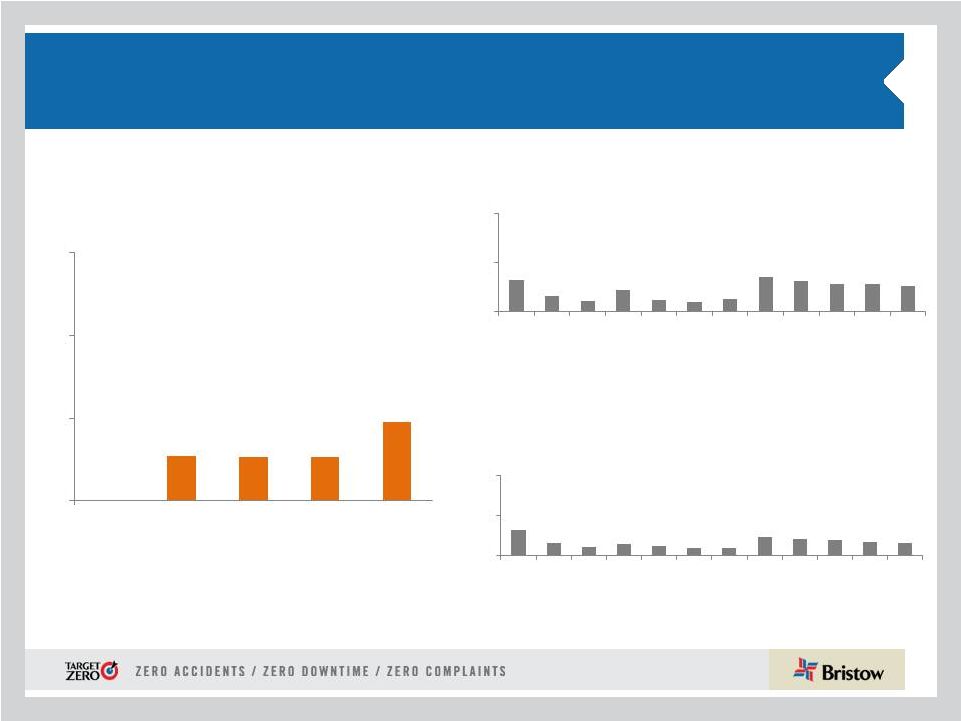
Operational safety review
* Includes consolidated commercial operations only
Total Recordable Injury Rate* per 200,000
man-hours (cumulative)
Lost Work Case Rate* per 200,000
man-hours (cumulative)
Commercial Air Accident Rate* per 100,000
Flight Hours (Fiscal Year)
FY13
FY13
0
0.54
0.53
0.53
0.96
0
1
2
3
FY09
FY10
FY11
FY12
FY13
0.32
0.16
0.11
0.22
0.12
0.10
0.13
0.35
0.31
0.28
0.28
0.26
0
0.5
1
A
M
J
J
A
S
O
N
D
J
F
M
0.32
0.16
0.11
0.14
0.12
0.10
0.09
0.23
0.21
0.19
0.17
0.16
0
0.5
1
A
M
J
J
A
S
O
N
D
J
F
M |
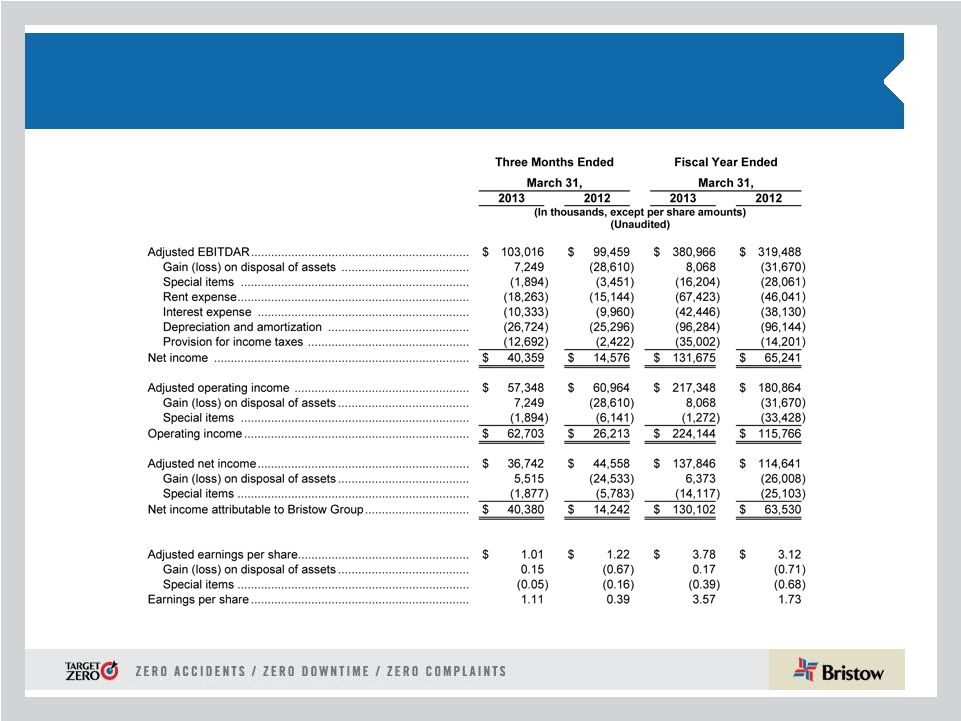
 7
Q4 and FY13 highlights
* Adjusted
EPS
and
adjusted
EBITDAR
amounts
exclude
gains
and
losses
on
dispositions
of
assets
and
any
special
items
during
the
period.
See
reconciliation
of
these
items
to
GAAP
measures
in
the
appendix hereto and in our earnings release for the quarter and
fiscal year ended March 31, 2013.
** Bristow Value Added (BVA) is calculated by taking Gross Cash
Flow less the product of Gross Operating Assets times a capital charge of 10.5%. Example calculation can be found in the appendix hereto.
*** Please see our earnings release for more information regarding
earnings guidance. •
Q4 operating revenue of $350.7M (10% increase
from Q4 FY12, 1.2% increase from Q3 FY13)
•
Q4 GAAP EPS of $1.11 (184.6% increase from Q4
FY12, 11% increase from Q3 FY13)
•
Q4 adjusted EPS* of $1.01 (17.2% decrease from Q4
FY12, 13.7% decrease from Q3 FY13)
•
Q4 adjusted EBITDAR* of $103.0M (3.6% increase
from Q4 FY12, 5.7%
decrease
from Q3 FY13) •
FY13 operating revenue of $1.3B (12.1% increase
from FY12)
•
FY13 GAAP EPS of $3.57 (106.4% increase from
FY12)
•
FY13 adjusted EPS* of $3.78 (21.2% increase from
FY12)
•
FY13 adjusted EBITDAR* of $381.0M (19.2%
increase from FY12)
Strong operating performance in FY13 with record operating revenue of $351 million
and $1.3 billion for the quarter and fiscal year period
Fourth quarter and FY13 adj. EPS were $1.01 per share and $3.78 per share, respectively,
which excludes the impact of special items and asset dispositions and includes charges
related to a client’s bankruptcy of $0.02 per share for Q4 FY13 and $0.11 per share
for FY13 Record BVA with cash flow from operations of $267 million
up ~ 15% year-over-year** 25% quarterly dividend increase
to $0.25 per share Guidance range for FY14 adjusted EPS is $4.20
- $4.50*** |
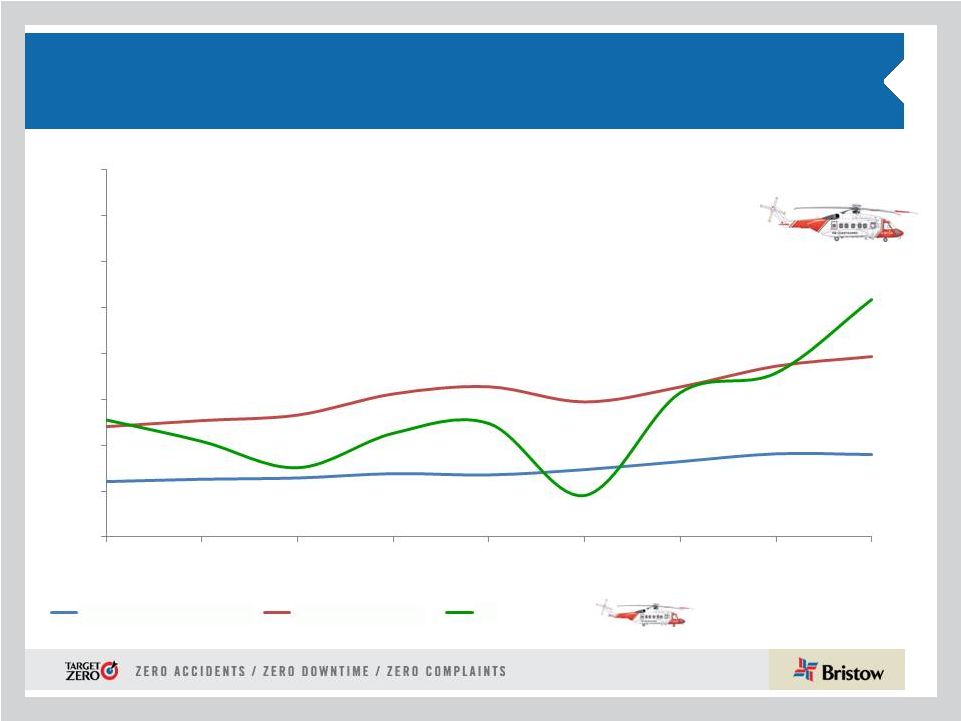
 8
•
Despite continued volatility, Brent prices remain above $100 per
barrel
for the foreseeable future
•
Offshore/deepwater and harsh environment remains a primary driver of
IOC and NOC production growth
•
Exploration success due to technological advances continues to unlock
new plays in deepwater
•
Gulf of Mexico (GoM) to experience the greatest absolute growth in
ultra- deepwater rig demand in the world over the next several years
with potential to reach 60 deepwater rigs by 2015 from 37 currently
operating •
North Sea activity growth rivals the GoM with rig and FPSO utilization
levels at near maximum levels
•
Clients are recognizing the criticality of safe, efficient and reliable
helicopter services for their offshore operations
Market environment outlook
Source: Industry reports and sell-side research. |
 9
•
~80
EC225
continue
to
be
suspended
from
operations
globally
with
16
Bristow aircraft affected, mainly located in Aberdeen
•
Eurocopter has indicated that they have determined the root causes of the
gear shaft failure
•
The
definitive
solution
to
the
problem
will
be
a
redesign
of
the
gear
shaft
which we believe will take more than a year to complete
•
Interim solutions under consideration include minor aircraft modifications
and new maintenance/operating procedures for mitigating shaft failure and
enhancing early detection
•
These
interim
solutions
could
result
in
Bristow’s
return
to
revenue
service
for EC225s in the third quarter of our fiscal year 2014
•
We continue to respond to client needs by redeploying a/c from other
regions, increasing utilization of existing a/c and adding new a/c including
the S-92s ordered last year
EC225 fleet update |
 10
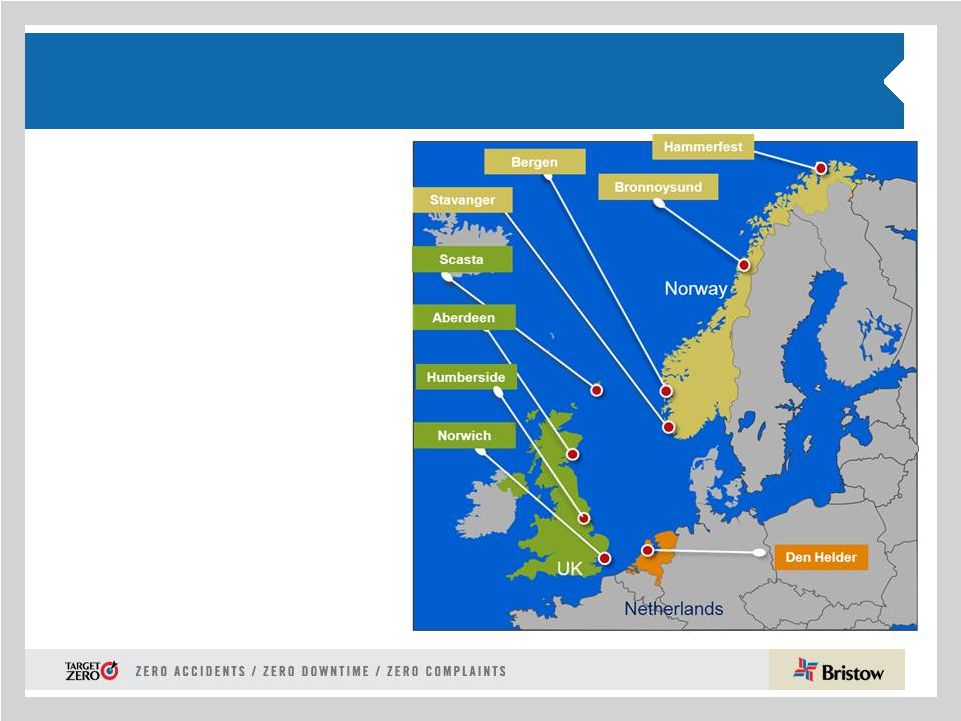
•
Europe represented 39% of Bristow operating
revenue and 42% of adjusted EBITDAR* in Q4
FY13
•
Operating revenue increased to $129.3M in Q4
FY13 from $121.0M in Q4 FY12 despite
decreased flying activity
•
Adjusted EBITDAR increased to $49.5M in Q4
FY13 from $43.7M in Q4 FY12 and adjusted
EBITDAR margin increased to 38.3% in Q4
FY13 from 36.1% in Q4 FY12
Outlook:
•
GAP SAR pre-operational phase underway
with four a/c for June/July start up
•
North Sea oil and gas growth to rival Gulf of
Mexico
•
UK SAR contract win with further 18 new
additional a/c at ~$12M full LACE run rate
•
Four new large a/c are expected to be
under contract in Q3 and Q4 FY14
FY14 adjusted EBITDAR margin
expected to be ~ mid thirties
Europe (EBU)
* Operating revenue and adjusted EBITDAR percentages exclude corporate and
other. |
 11
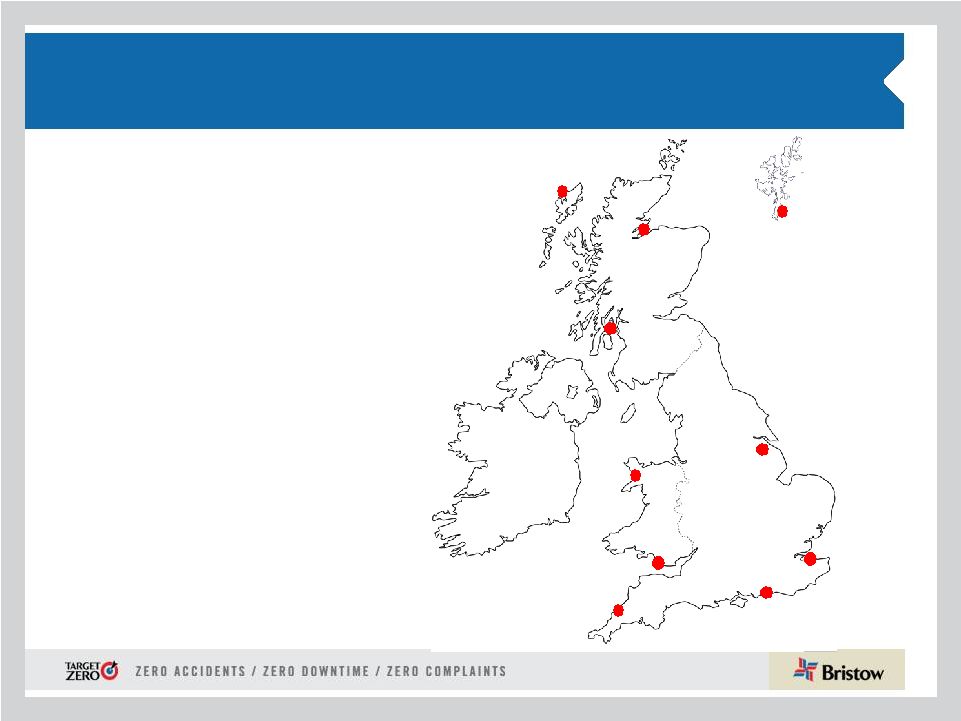
UK SAR update
Stornoway
Sumburgh
Humberside
Caernarfon
Inverness
Prestwick
Manston
Lee-on-Solent
Cardiff
Newquay
•
Ten bases equipped with 22
technologically-advanced
helicopters
•
Two training aircraft are
scheduled to be delivered in
FY15 with the revenue
anticipated to build between
FY16 to FY18 as operational
aircraft come on station
•
Contract will provide stable
revenue through any oil and gas
downturn or cyclicality
•
UK SAR award is a potential
catalyst for future SAR
outsourcing by governments |
 12
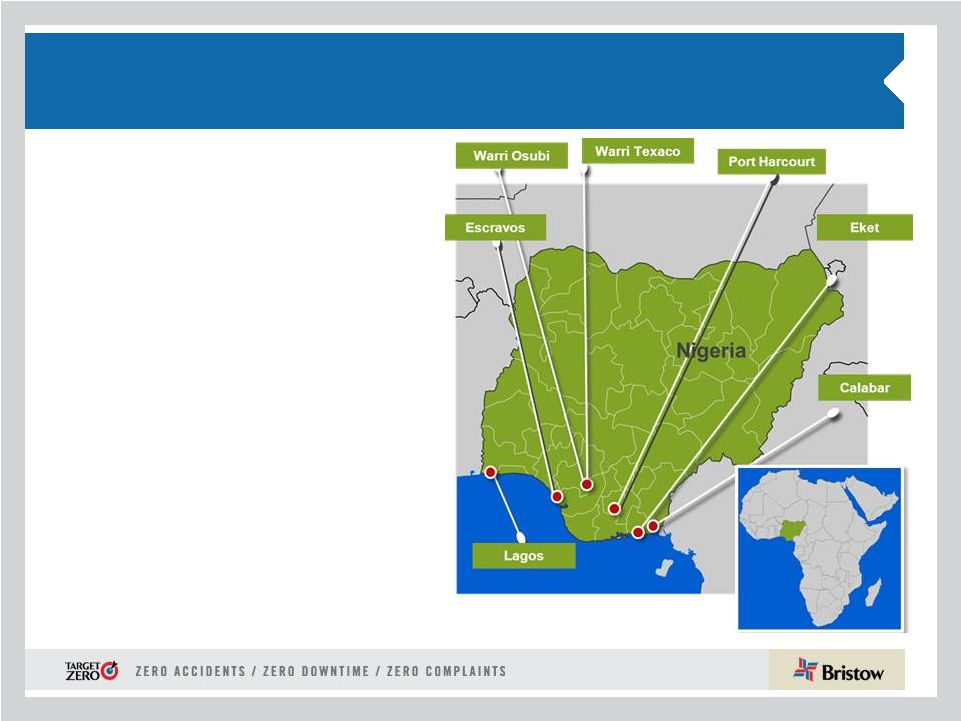
West Africa (WASBU)
•
Nigeria represented 22% of Bristow operating
revenue and 20% of adjusted EBITDAR* in Q4
FY13
•
Operating revenue increased by 11.8% to $74.0M
in Q4 FY13 from $66.2M in Q4 FY12 due to an
increase in flight hours from new contracts and ad
hoc work
•
Adjusted EBITDAR decreased slightly to $23.5M
in Q4 FY13 from $24.2M in Q4 FY12; adjusted
EBITDAR margin decreased to 31.8% in Q4FY13
vs 36.6% in Q4 FY12 due to an increase in
salaries and maintenance expense
Outlook:
•
Even with new competition, increased
deepwater activity favors Bristow
•
One S-92 is a new additional a/c starting in
Q3 FY14
•
Local content remains important
* Operating revenue and adjusted EBITDAR percentages exclude corporate and
other. FY14 adjusted EBITDAR margin
expected to be ~ low thirties |
 13
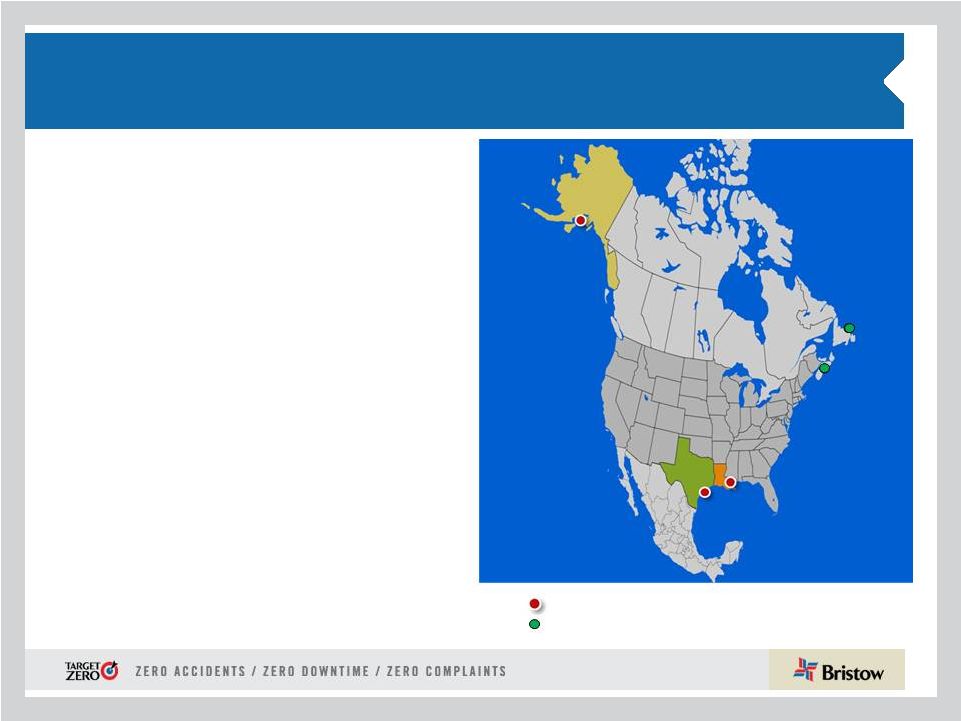
•
North America represented 17% of Bristow operating
revenue and 14% of adjusted EBITDAR* in Q4 FY13
•
Operating revenue increased 33% to $56.3M in Q4
FY13 from $42.3M in Q4 FY12 as a result of a shift
toward larger a/c and improved terms
•
Eight aircraft dry leased to Cougar in Canada resulted
in a revenue increase of $8.2 million in Q4 FY13
•
Adjusted EBITDAR more than doubled to $16.6M in
Q4 FY13 vs $8.2M in Q4 FY12 and adjusted
EBITDAR margin increased to 29.5% vs.19.4% in Q4
FY12
Outlook:
•
GoM -
second most prolific deepwater basin after
Brazil and permitting above pre-Macondo levels
•
Cougar is performing above expectations and has
the possibility of adding one more a/c in FY14
•
Client demand for medium and large a/c is
increasing, with one new large a/c starting in July
2013 on a three year contract
North America (NABU)
* Operating revenue and adjusted EBITDAR percentages exclude corporate and
other. Consolidated in NABU
Unconsolidated Affiliate
FY14 adjusted EBITDAR margin expected
to be ~ low thirties |
 14
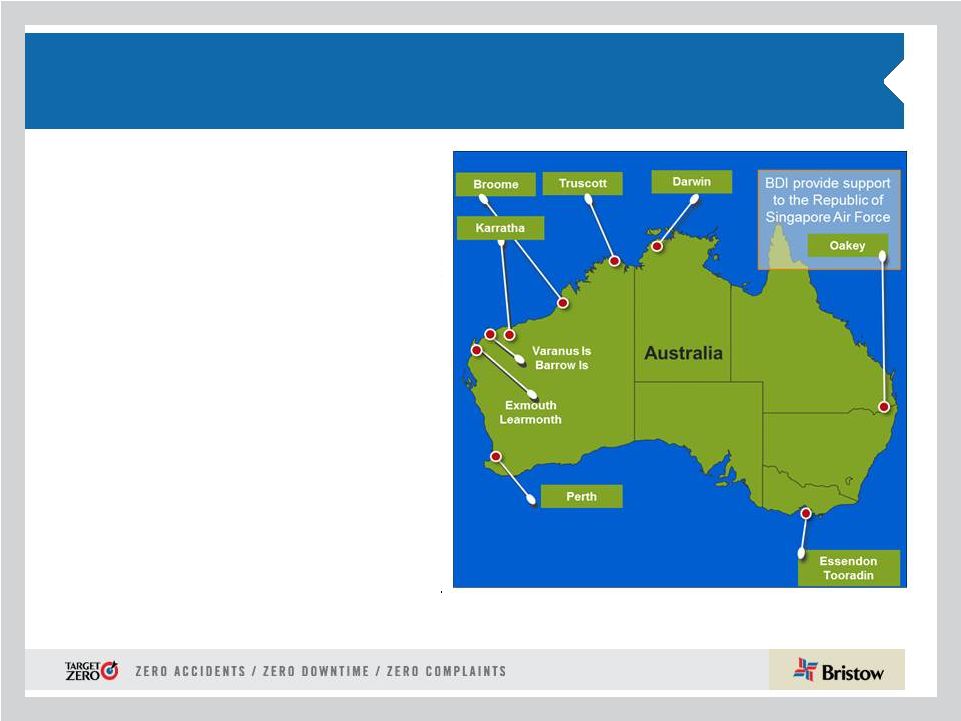
Australia (AUSBU)
•
Australia represented 12% of Bristow operating revenue
and 9% of adjusted EBITDAR* in Q4 FY13
•
Operating revenue decreased 6.4% to $40.6M in Q4
FY13 from $43.4M in Q4 FY12 due to short-term
contract roll-off
•
Adjusted EBITDAR decreased to $10.6M in Q4 FY13
from $15.5M in Q4 FY12 and adjusted EBITDAR margin
decreased to 26.0% in Q4 FY13 from 35.6% in Q4 FY12
due to revenue decline
•
FY13 adjusted EBITDAR was much higher at $43.0M
compared to FY12 of $36.0M with adjusted EBITDAR
margin increased to 27.1% vs 24.3%
Outlook:
•
FY14 introduction of new large a/c type to the
region will require additional staff and training to
be recovered during future contract periods
•
Clients reconsidering alternative fleet types and
contracting strategies due to EC225 suspension
•
New awards for four existing large a/c at better
contract terms are expected to start in Q2 and
Q3 FY14
* Operating revenue and adjusted EBITDAR percentages exclude corporate and
other. FY14 adjusted EBITDAR margin expected
to be ~ low twenties |
 15
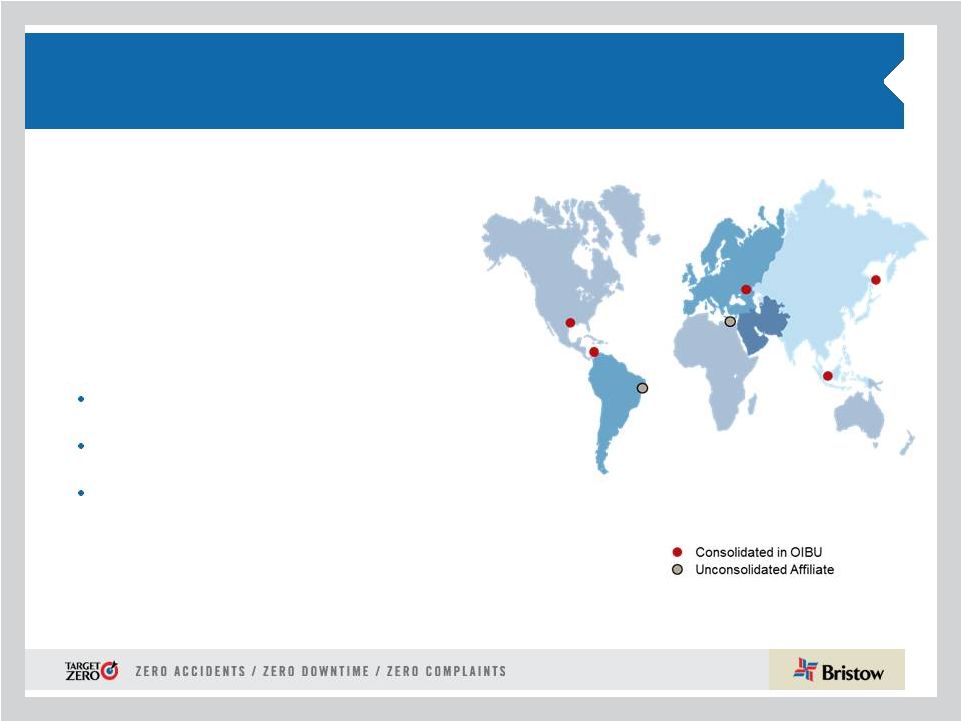
Other International (OIBU)
Other International (OIBU)
•
Other International represented 10% of Bristow
operating revenue and 15% of adjusted EBITDAR*
in Q4 FY13
•
Operating revenue stayed flat at $34.8M in Q4
FY13 vs $34.6M in Q4 FY12
•
Adjusted EBITDAR increased 21.2% to $18.0M in
Q4 FY13 vs $14.8M in Q4 FY12 and adjusted
EBITDAR margin increased to 51.6% in Q4 FY13
from 42.9% in Q4 FY12 due to increased earnings
from Lider
* Operating revenue and adjusted EBITDAR percentages exclude corporate and
other. Outlook:
FY14 adjusted EBITDAR margin expected to be ~
low to mid forties
Lider’s S-92s operating at full capacity as Brazil has 12
EC225s affected by the current suspension
As expected, further medium and large a/c bids from
Petrobras are in process
New potential contracts in Trinidad, Malaysia and Peru with
other opportunities in East Africa and Russia
|
 16
Financial discussion
Jonathan
Baliff
SVP
and
CFO
, |
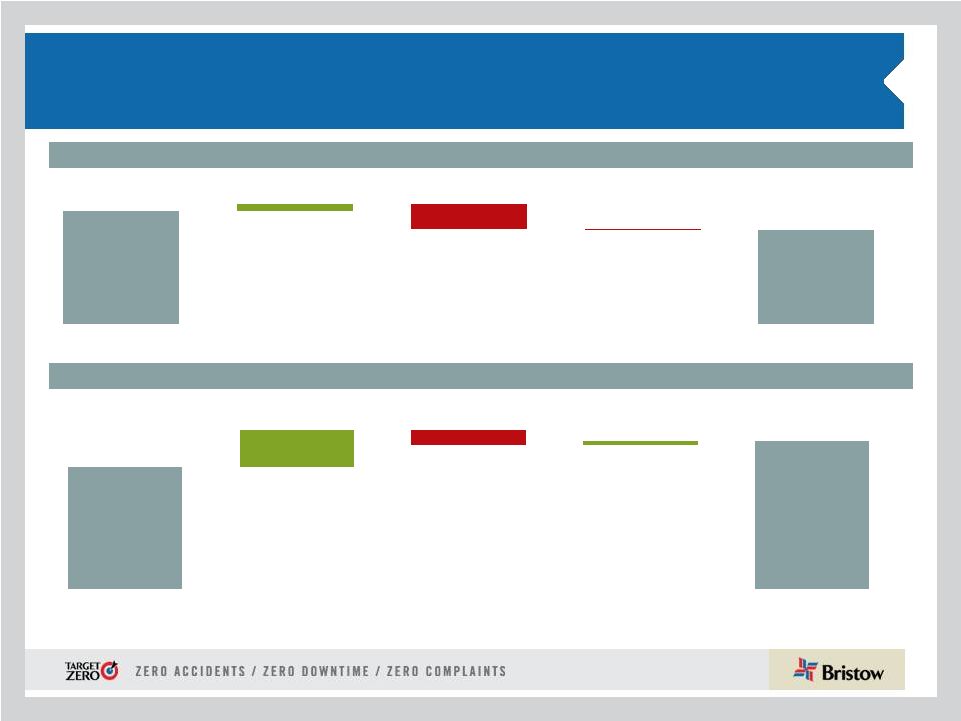 17
Financial highlights:
Adjusted EPS Summary
Q4 FY12 to Q4 FY13 adjusted EPS bridge
FY12 to FY13 adjusted EPS bridge
$1.22
$1.01
$0.08
$0.27
$0.02
Q4 FY12
Operations
Corporate and Other
FX Changes
Q4 FY13
$3.12
$3.78
$0.95
$0.10
$0.39
FY12
Operations
Corporate and Other
FX Changes
FY13
* Adjusted EPS amounts exclude gains and losses on dispositions of assets and any special items
during the period. See reconciliation of these items to GAAP in our earnings release for the
quarter ended March 31, 2013. |
 18
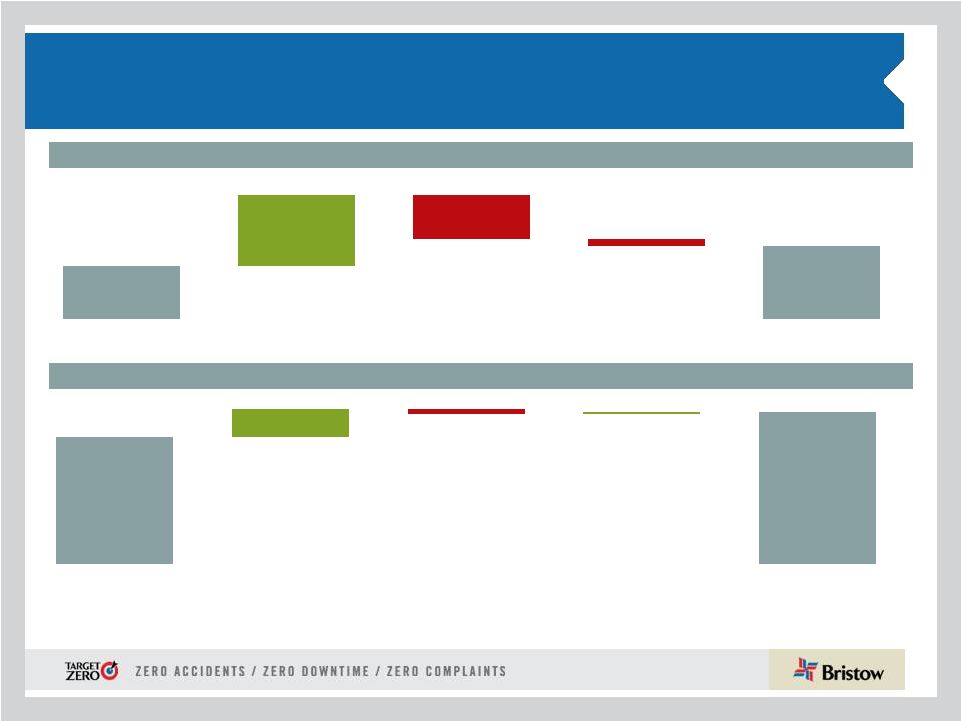
Financial highlights:
Adjusted EBITDAR Summary
Q4 FY12 to Q4 FY13 adjusted EBITDAR bridge (in millions)
FY12 to FY13 adjusted EBITDAR bridge (in millions)
* Adjusted EBITDAR amounts exclude gains and losses on dispositions of assets
and any special items during the period. See reconciliation of these items to GAAP in our earnings
release for the quarter ended March 31, 2013.
$99.5
$103.0
$12.7
$7.9
$1.3
Q4 FY12
Operations
Corporate and Other
FX Changes
Q4 FY13
$319.5
$381.0
$70.0
$4.8
$13.3
FY12
Operations
Corporate and Other
FX Changes
FY13 |
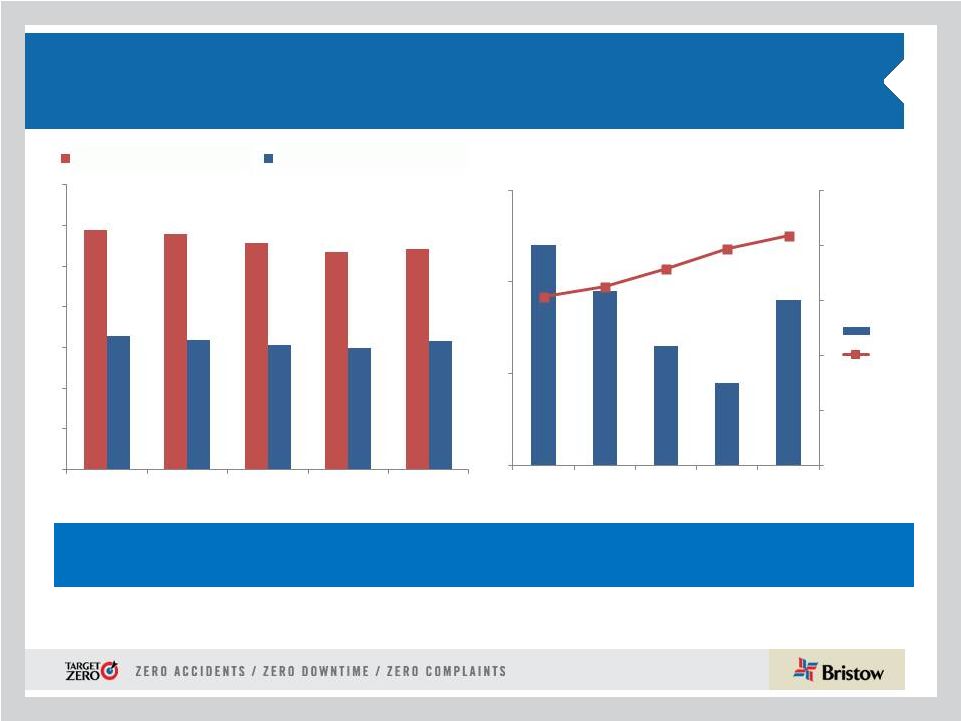 19
LACE and LACE rate continue to increase led by
new technology a/c and improved utilization/terms
LACE
increased
for
the
first
time
in
5
years
with
LACE
Rate
also
improving
due to improved terms and utilization, especially in WASBU and AUSBU
($ in millions)
164
159
153
149
158
6.14
6.49
7.15
7.89
8.35
0
2
4
6
8
10
140
150
160
170
FY09
FY10
FY11
FY12
FY13
295
290
279
268
271
164
159
153
149
158
0
50
100
150
200
250
300
350
FY09
FY10
FY11
FY12
FY13
Consolidated commerical aircraft
Large Aircraft Equivalent (LACE)*
LACE*
LACE Rate *
* See appendix hereto for more information on LACE and LACE Rate. LACE and LACE Rate
excludes Bristow Academy, affiliate a/c, aircraft held for sale, a/c
construction in progress, and reimbursable revenue. |
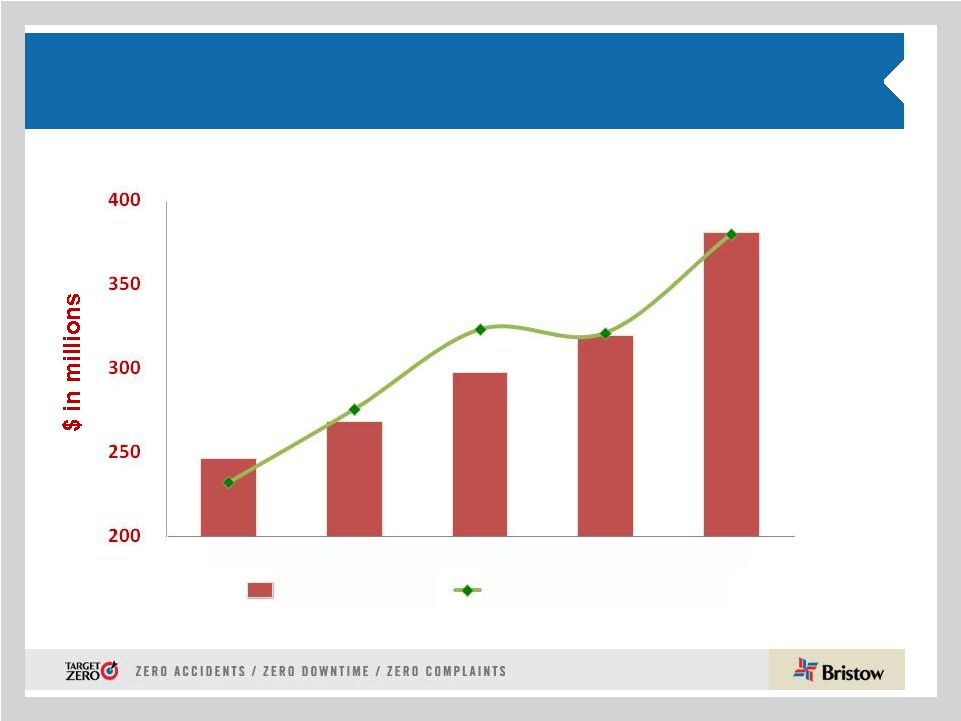 20
Continuous commercial and operational
improvement delivered stronger adj. EBITDAR
247
298
319
381
23%
24%
25%
26%
27%
28%
29%
200
250
300
350
400
FY09
FY10
FY11
FY12
FY13
Adj. EBITDAR
Adj. EBITDAR margin
268 |
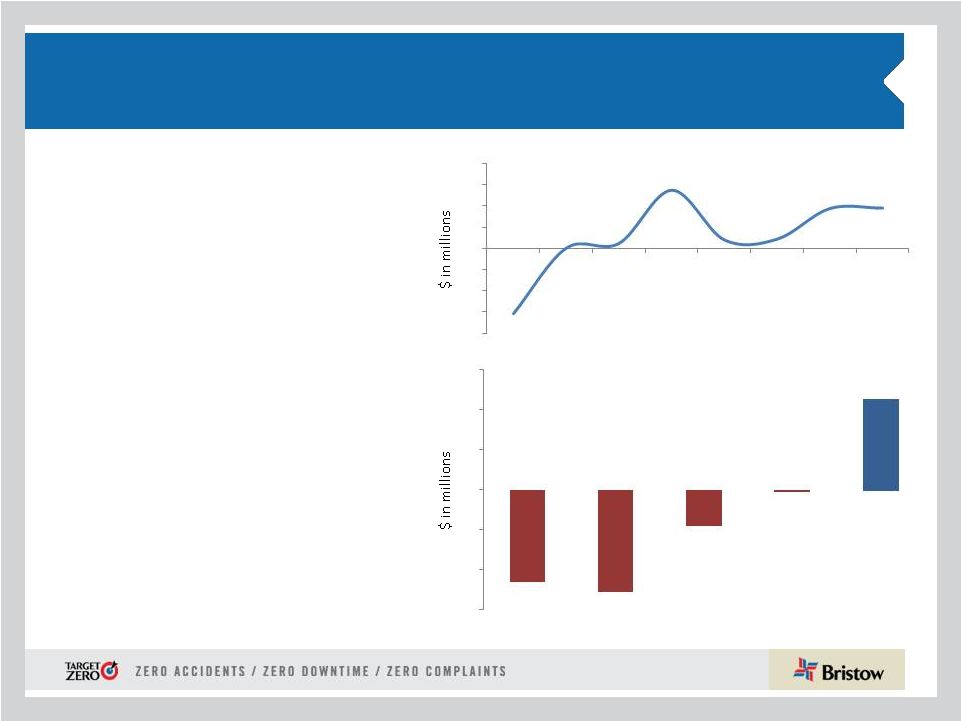 21
Recent quarterly and yearly BVA
Significant year-over-year improvement in FY13
* Bristow
Value
Added
(BVA)
is
calculated
by
taking
Gross
Cash
Flow
less
the
product
of
Gross
Operating
Assets
times
a
capital
charge
of
10.5%.
Example
calculation
for
Q4
FY12 and Q4 FY13 can be found in the appendix hereto.
•
Q4 FY13 BVA is positive $9.4M
•
FY13 consolidated BVA is
positive $22.7M, a $23.4M
increase from FY12
•
Positive year-over-year change
in BVA is driven by:
•
Increase of ~$44M in gross
cash flow as more LACE a/c
underpin the growth
•
Working capital management
and the lease strategy allow
for a lower capital charge
•
AUSBU, EBU and NABU are
key performers year-over-year
Absolute BVA* Q1 FY12 –
Q4 FY13
Absolute BVA FY09 –
FY13
$(23.1)
$(25.6)
$(9.1)
$(0.7)
$22.7
-30
-20
-10
0
10
20
30
FY10
FY11
FY12
FY13
FY09
-15.4
0
1.1
13.6
1.9
2.1
9.3
9.4
-20
-15
-10
-5
0
5
10
15
20
Q1 FY12
Q2 FY12
Q3 FY12
Q4 FY12
Q1 FY13
Q2 FY13
Q3 FY13
Q4 FY13 |
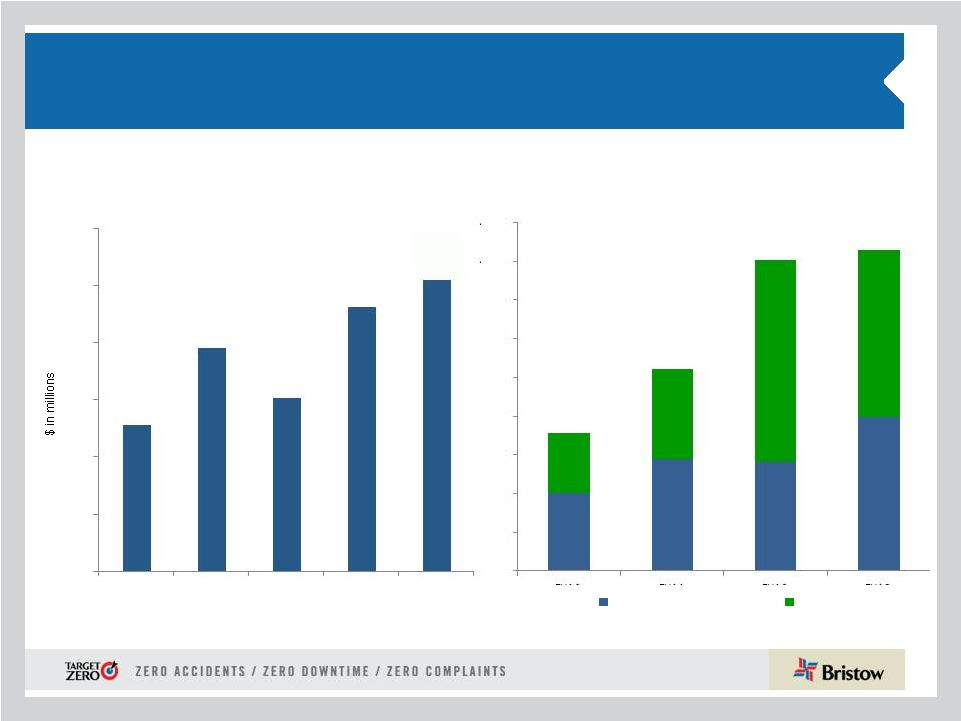 22
Our progress on BVA yields stronger operating
cash flow generation and better liquidity
Net cash provided by operating activities*
* See 10-K for more information on cash flow provided by operating
activities. Total liquidity as of March 31,
128
195
151
231
267
0
50
100
150
200
250
300
FY09
FY10
FY11
FY12
FY13
100
144
140
199
78
116
262
216
-
50
100
150
200
250
300
350
400
450
FY10
FY11
FY12
FY13
Undrawn borrowing capacity
Cash
178
261
402
415 |
 23
Financial highlights:
FY14 guidance
•
FY14
adjusted
EPS
guidance
range
of
$4.20
-
$4.50,
excluding
special items and a/c sales
* Assuming FY14 revenue earned in same regions and same mix as in FY13.
Our quarterly dividend increase of 33 percent in fiscal year 2013 and
an additional 25 percent increase for Q1 FY14 reflects management’s
commitment to deliver solid total return for our shareholders
LACE (Large AirCraft Equivalent)
~ 173 -
177
Interest expense
~ $30 -
$35M
LACE Rate
~ $8.30 -
$8.60M
Rent expense (a/c only)
~ $85 -
$90M
G & A expense (all inclusive)
~ $155 -
$165M
Tax rate*
~ 21 -
24%
Depreciation expense
~ $95 -
$100M
Adj. EPS guidance
$4.20 -
$4.50 |
 24
Financial highlights:
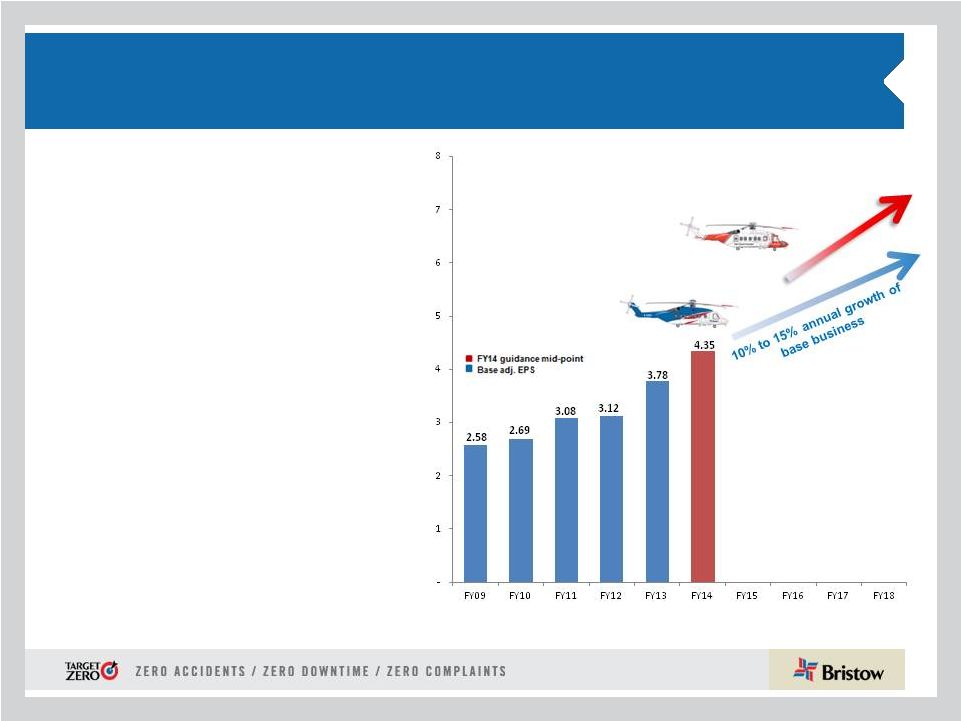
Long term adjusted earnings guidance
•
Bristow’s 5 year historical adj.
EPS of 10% growth shows
resiliency through economic
downturns
•
Our FY13 adj. EPS growth of
21% benefitted from the
accelerating shift to deeper
water E&P
•
Our expected future long term
average annual adj. EPS
growth rate is higher at 10% –
15%*
•
UK SAR is expected to provide
even higher growth as we ramp
up to full operations in FY18
* This guidance represents a long term average during the next 3-5 years, and
growth rates for any fiscal year or quarter may be outside this range. Please see our earnings
release for more information regarding earnings guidance, which is also applicable
to our adjusted earnings growth rate guidance. UK SAR expected to
contribute ~$1.00 to adj. EPS by FY18 |
 25
Conclusions
•
Safety continues to be our #1 priority as we strive to achieve
Target Zero
•
Record year-over-year revenue, cash flow and bottom line
earnings in FY13 demonstrate the uniqueness and strength
of our business model and balance sheet
•
Bristow’s largest share of revenue is increasingly related to oil
and gas production and SAR work, delivering even lower
business risk cash flow
•
Our new a/c order book positions us well for future growing
offshore market opportunities
•
Our capital appreciation and proven commitment to dividend
growth have provided solid returns for our shareholders
|
 26
Appendix |
 27
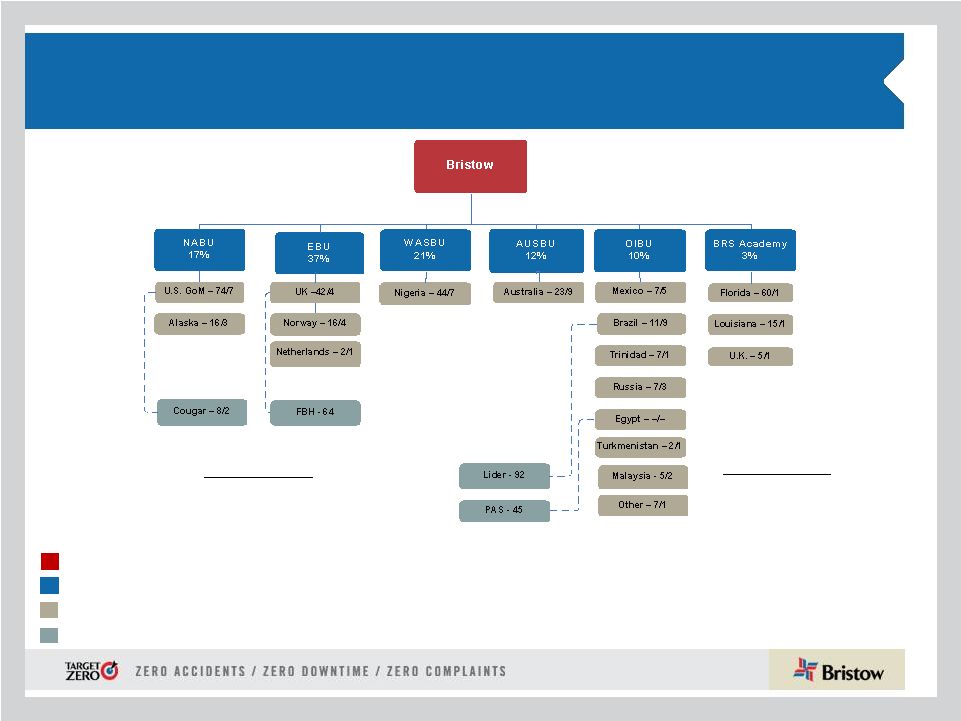
Organizational chart -
as of March 31, 2013
Business
Unit
(%
of
FY13
Operating
Revenue)
Corporate
Region
( # of a/c / # of Locations)
Joint
Venture
(#
of
a/c)
Key
Operated Aircraft
Bristow owned and/or operated
351 aircraft as of March 31, 2013
Affiliated Aircraft
Bristow affiliates and joint
ventures operated 201 aircraft
as of March 31, 2013 |
 28
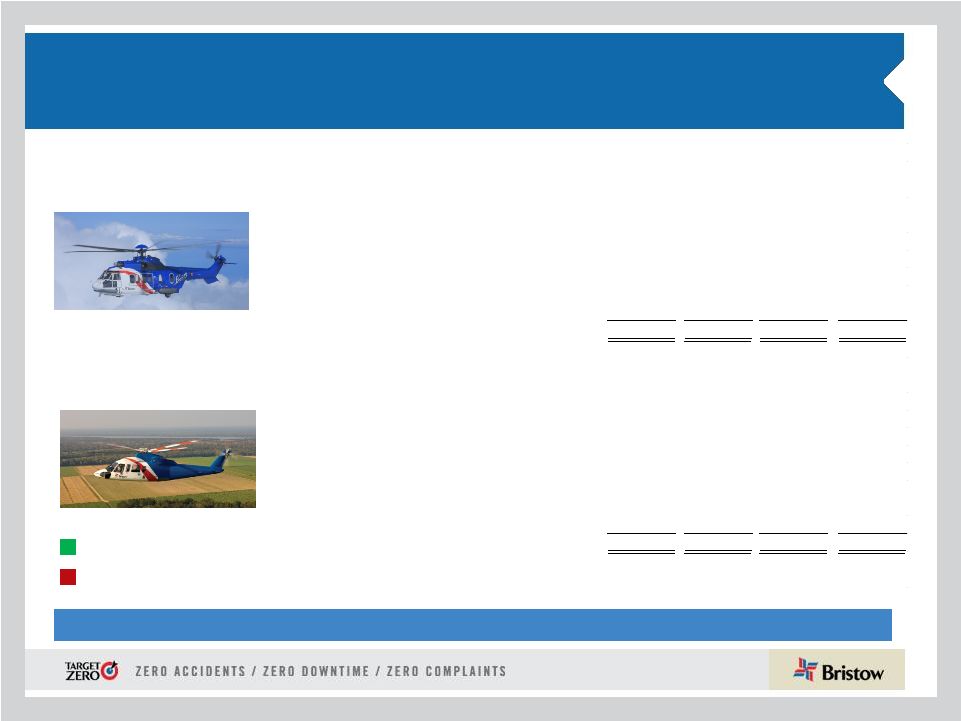
Aircraft Fleet –
Medium and Large
as of March 31, 2013
Next Generation Aircraft
Medium capacity 12-16 passengers
Large capacity 18-25 passengers
Mature Aircraft Models
Fair
market
value
of
our
owned
fleet
is
~$1.9
billion
and
leased
fleet
is
~$550
million
Aircraft
Type
No. of PAX
Engine
Consl
Unconsl
Total
Ordered
Large Helicopters
AS332L Super Puma
18
Twin Turbine
20
-
20
-
AW189
16
Twin Turbine
-
-
-
6
EC175
16
Twin Turbine
-
-
-
5
EC225
25
Twin Turbine
20
-
20
3
Mil MI 8
20
Twin Turbine
7
-
7
-
Sikorsky S-61
18
Twin Turbine
2
-
2
-
Sikorsky S-92
19
Twin Turbine
45
7
52
15
94
7
101
29
LACE
94
Medium Helicopters
AW139
12
Twin Turbine
8
2
10
6
Bell 212
12
Twin Turbine
14
14
-
Bell 412
13
Twin Turbine
29
20
49
-
EC155
13
Twin Turbine
1
-
1
-
Sikorsky S-76A/A++
12
Twin Turbine
5
5
10
-
Sikorsky S-76C/C++
12
Twin Turbine
51
34
85
-
Sikorsky S-76D
12
Twin Turbine
-
-
-
10
94
75
169
16
LACE
45 |
 29
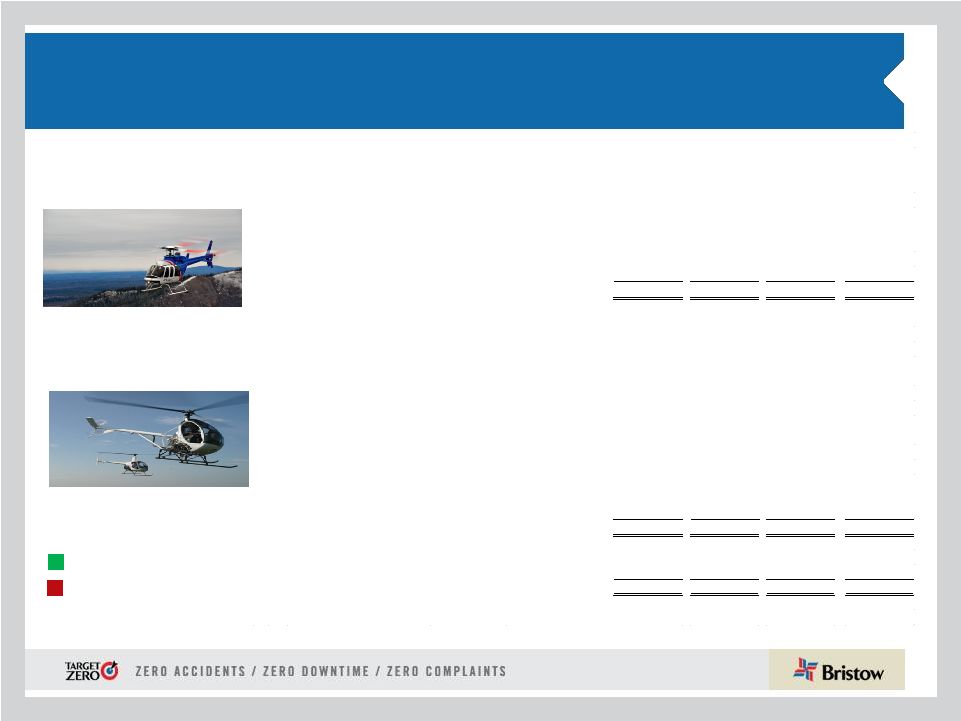
Aircraft Fleet –
Small, Training and Fixed
as of March 31, 2013 (continued)
Next Generation Aircraft
Mature Aircraft Models
Small capacity 4-7 passengers
Training capacity 2-6 passengers
* LACE does not include held for sale, training and fixed wing helicopters.
Aircraft
Type
No. of PAX
Engine
Consl
Unconsl
Total
Ordered
Small Helicopters
Bell 206B
4
Turbine
1
2
3
-
Bell 206 L-3
6
Turbine
4
6
10
-
Bell 206 L-4
6
Turbine
28
1
29
-
Bell 407
6
Turbine
37
-
37
-
BK 117
7
Twin Turbine
2
-
2
-
BO-105
4
Twin Turbine
2
-
2
-
EC135
7
Twin Turbine
6
3
9
-
80
12
92
-
LACE
19
Training Helicopters
AW139
12
Twin Turbine
-
3
3
-
Bell 412
13
Twin Turbine
-
8
8
-
Bell 212
12
Twin Turbine
-
15
15
-
AS355
4
Twin Turbine
5
-
5
-
AS350BB
4
Turbine
-
37
37
-
Agusta 109
8
Twin Turbine
-
2
2
-
Bell 206B
6
Single Engine
13
-
13
-
Robinson R22
2
Piston
13
-
13
-
Robinson R44
2
Piston
3
-
3
-
Sikorsky 300CB/Cbi
2
Piston
45
-
45
-
Fixed Wing
1
-
1
-
80
65
145
-
Fixed Wing
3
42
45
-
Total
351
201
552
45
TOTAL LACE (Large Aircraft Equivalent)*
158 |
 30
Operating lease strategy: lowering the cost and amount of
capital needed to grow
•
Of
the
70
a/c
currently
leased
in
our
fleet,
33
are
training
and
37
are
commercial
(28 LACE)
•
28 LACE a/c represent approximately 18% of our commercial fleet
•
Our
goal
is
for
commercial
fleet
operating
leases
to
account
for
20-30%
of
our
LACE
Leased aircraft as of March 31, 2013
Small
Medium
Large
Total
Leased LACE
Total LACE
% Leased
EBU
-
1
16
17
17
55
30%
WASBU
-
1
-
1
1
21
2%
NABU
1
11
2
14
8
37
21%
AUSBU
2
-
3
5
4
19
19%
OIBU
-
-
-
-
-
27
-
Total
3
13
21
37
28
158
18%
See 10-K Note 8 “Commitments and contingencies” for more information provided on
operating leases. |
 31
Consolidated fleet changes and aircraft sales for
Q4 FY13
See
10-K
Note
8
“Commitments
and
contingencies”
for
more
information
provided
on
operating
leases.
Small
Medium
Large
Training
Total
EBU
-
1
16
-
17
WASBU
-
1
-
-
1
NABU
1
11
2
-
14
AUSBU
2
-
3
-
5
OIBU
-
-
-
-
-
Academy
-
-
-
33
33
Total
3
13
21
33
70
Leased aircraft in consolidated fleet
Small
Medium
Large
Total
EBU
-
-
-
-
WASBU
-
-
-
-
NABU
3
-
-
3
AUSBU
-
-
-
-
OIBU
-
4
-
4
Total
3
4
-
7
Held for sale aircraft in consolidated fleet
# of A/C Sold
Received**
Q1 FY13
4
19.0
$
Q2 FY13
5
16.5
Q3 FY13
5
7.5
Q4 FY13
11
16.0
Totals
25
59.0
$
** Amounts stated in millions
Q2 FY13
Q3 FY13
Q4 FY13
YTD
Fleet Count Beginning
361
357
349
356
361
Delivered
-
B412EP
1
1
S-92
2
10
3
15
EC225
1
1
1
3
Total Delivered
2
1
12
4
19
Removed
Sales
(4)
(5)
(5)
(11)
(25)
Other*
(2)
(4)
-
2
(4)
Total Removed
(6)
(9)
(5)
(9)
(29)
357
349
356
351
351
* Includes destroyed aircraft, lease returns and commencements
Fleet changes
Q1 FY13 |
 32
Operating revenue, LACE and LACE Rate by BU
1) $ in millions
2) LACE Rate is annualized
3) $ in millions per LACE
Op revenue
1
LACE
LACE Rate
2,3
EBU
502
55
9.13
WASBU
282
21
13.28
NABU
225
37
6.12
AUSBU
159
19
8.58
IBU
132
27
4.94
Total
1,300
158
8.35
Operating Revenue, LACE, and LACE Rate by BU
FY13 |
 33
Historical LACE and LACE Rate by BU
1) $ in millions
2) LACE Rate is annualized
Q1
Q2
Q3
Q4
Q1
Q2
Q3
Q4
Q1
Q2
Q3
Q4
EBU
42
43
48
46
44
46
46
45
47
45
51
55
WASBU
24
24
21
22
23
22
22
22
22
22
20
21
NABU
39
35
34
29
30
29
30
30
30
31
39
37
AUSBU
20
23
24
20
19
20
20
19
18
17
17
19
OIBU
33
33
33
38
39
38
38
34
32
28
27
27
Consolidated
157
158
159
154
154
154
155
149
147
142
154
158
Q1
Q2
Q3
Q4
Q1
Q2
Q3
Q4
Q1
Q2
Q3
Q4
EBU
$8.20
$8.50
$7.90
$8.40
$9.80
$9.60
$9.63
$10.09
$10.60
$11.03
$9.74
$9.13
WASBU
9.70
9.40
10.70
9.90
9.10
10.30
11.17
11.46
12.35
12.24
13.71
13.28
NABU
5.40
6.10
6.00
6.60
5.80
6.30
5.89
5.79
7.05
7.11
5.84
6.12
AUSBU
6.80
6.00
6.00
7.50
8.60
7.10
6.96
7.78
8.48
9.29
9.55
8.58
OIBU
3.90
4.10
4.40
3.90
3.50
3.70
3.78
4.22
4.22
4.62
4.76
4.94
Consolidated
6.70
6.90
6.90
7.10
7.30
7.40
7.43
7.89
8.55
8.95
8.49
8.35
LACE
2011
2012
2011
2012
LACE Rate
1,2
2013
2013 |
  34
Order and options book as of March 31, 2013
#
Helicopter
Class
Delivery Date
Location
Contracted
#
Helicopter
Class
Delivery Date
1
Large
June 2013
EBU
4 of 4
1
Large
June 2014
2
Large
September 2013
NABU
1 of 2
1
Large
September 2014
1
Large
September 2013
EBU
3
Large
December 2014
1
Large
September 2013
WASBU
4
Large
March 2015
3
Large
December 2013
IBU
3
Large
June 2015
2
Large
December 2013
EBU
3
Large
September 2015
1
Large
December 2013
AUSBU
1 of 1
3
Large
December 2015
3
Large
March 2014
EBU
3
Large
March 2016
2
Large
June 2014
EBU
2 of 2
3
Large
June 2016
3
Large
September 2014
EBU
5
Large
September 2016
1
Large
December 2014
EBU
4
Large
December 2016
1
Large
March 2015
EBU
3
Large
March 2017
3
Large
June 2015
AUSBU
1 of 1
3
Large
June 2017
1
Large
September 2015
AUSBU
1 of 1
3
Large
September 2017
2
Large
December 2015
AUSBU
2
Large
December 2017
1
Large
March 2016
EBU
1
Medium
March 2014
1
Large
June 2016
EBU
2
Medium
June 2014
1
Medium
June 2013
NABU
1
Medium
September 2014
1
Medium
June 2013
AUSBU
4
Medium
December 2014
6
Medium
September 2013
NABU
2
Medium
March 2015
2
Medium
December 2013
NABU
2
Medium
June 2015
1
Medium
March 2014
WASBU
2
Medium
September 2015
2
Medium
June 2014
WASBU
3
Medium
December 2015
3
Medium
September 2014
IBU
1
Medium
March 2016
45
10 of 45
2
Medium
June 2016
1
Medium
September 2016
* Six large ordered aircraft expected to enter service late
1
Medium
December 2016
calendar 2014 are subject to the successful development
1
Medium
March 2017
and certification of the aircraft.
1
Medium
June 2017
1
Medium
September 2017
1
Medium
December 2017
70
ORDER BOOK*
OPTIONS BOOK |
 35
Adjusted EBITDAR margin* trend
(fiscal year ended)
Q1
Q2
Q3
Q4
Full Year
Q1
Q2
Q3
Q4
Full Year
EBU
31.2%
31.7%
31.9%
28.0%
30.8%
29.8%
31.5%
34.6%
34.4%
32.7%
WASBU
31.7%
36.8%
33.7%
39.1%
36.0%
33.7%
36.9%
35.8%
34.3%
35.2%
NABU
18.3%
20.0%
14.9%
17.7%
17.8%
20.8%
25.8%
15.9%
8.5%
18.5%
AUSBU
26.5%
36.7%
34.4%
31.3%
32.4%
33.2%
26.1%
27.0%
31.1%
29.3%
OIBU
34.4%
37.6%
25.9%
25.1%
31.0%
18.3%
40.2%
37.4%
59.4%
39.3%
Consolidated
24.7%
27.8%
24.7%
23.9%
25.3%
23.8%
27.5%
25.9%
29.6%
26.7%
Q1
Q2
Q3
Q4
Full Year
Q1
Q2
Q3
Q4
Full Year
EBU
33.0%
31.4%
30.7%
36.1%
32.9%
32.2%
34.6%
39.5%
38.3%
36.2%
WASBU
29.5%
35.5%
37.2%
36.6%
35.0%
31.9%
26.5%
35.0%
31.8%
31.5%
NABU
14.3%
20.6%
14.8%
19.4%
17.3%
23.2%
20.7%
29.1%
29.5%
25.7%
AUSBU
20.2%
14.4%
23.5%
35.6%
24.3%
27.0%
28.0%
27.3%
26.0%
27.1%
OIBU
48.1%
19.1%
47.8%
42.9%
39.5%
36.2%
44.2%
55.7%
51.6%
46.6%
Consolidated
23.4%
24.0%
27.6%
31.2%
26.6%
26.3%
26.1%
31.5%
29.6%
28.4%
2010
2011
2012
2013
* Adjusted EBITDAR excludes special items and asset dispositions and is calculated by taking adjusted
EBITDAR divided by operating revenue. |
 36
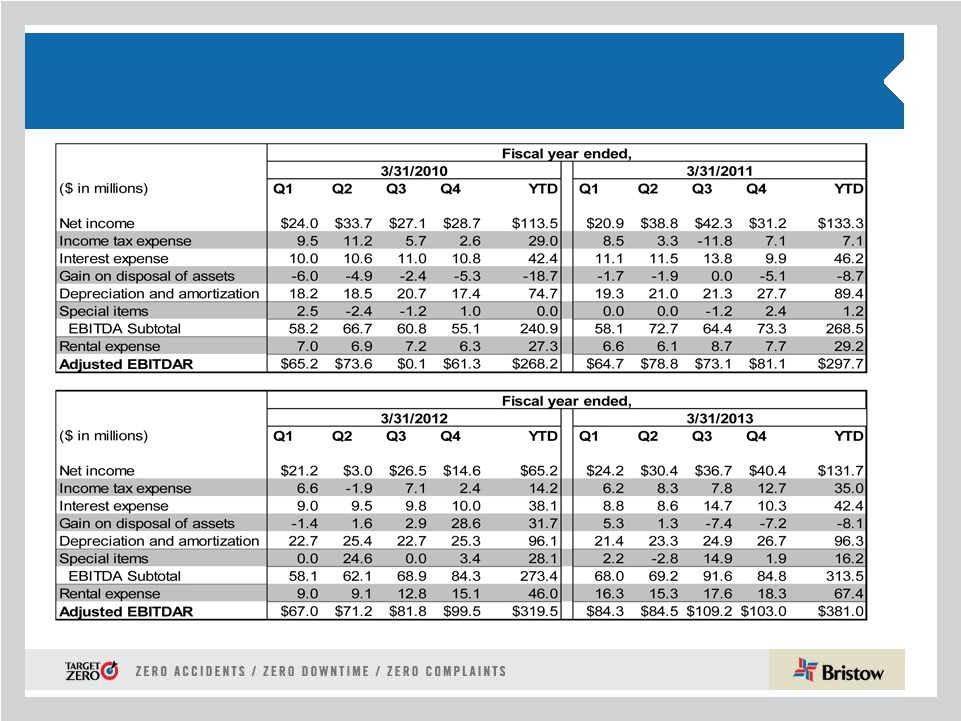
Adjusted EBITDAR* reconciliation
* Adjusted EBITDAR excludes special items and asset dispositions.
|
 37
Bristow Value Added (BVA)
Sample calculation for Q4 FY13 and Q4 FY12
Bristow
Value
Added
=
Gross
Cash
Flow
–
(Gross
Operating
Assets
X
Capital
Charge)
BVA
= GCF -
(
GOA X 10.5%** )
Bristow Value Added calculation for Q4 FY13
$9.4
= $94.5* -
( $3,241*
X 2.625%**) Bristow Value Added
calculation for Q4 FY12 $13.6
=
$90.4*
-
(
$2,926*
X
2.625%**)
* Reconciliation for these items follows right after this
slide. ** Quarterly capital charge of 2.625% is based on annual
capital charge of 10.5%. |
 38
Gross cash flow reconciliation
(in millions)
Gross Cash Flow Reconciliation
Q4 FY13
Q4 FY12
Net Income
40.4
14.2
Depreciation and Amortization
26.7
25.3
Interest Expense
10.3
10.0
Interest Income
(0.3)
(0.1)
Rent
18.3
15.1
Other Income/expense-net
(0.4)
(0.6)
Earnings of Discontinued Operations
-
-
Gain/loss on Asset Sale
(7.2)
28.6
Special Items
1.9
3.4
Tax Effect from Special Items
1.0
(6.3)
Earnings (losses) from Unconsolidated Affiliates, Ne
(7.2)
(5.6)
Non-controlling Interests
0.0
0.3
Gross Cash Flow (before Lider)
83.5
84.4
Gross Cashflow -Lider proportional
11.0
5.9
Gross Cash Flow after Lider
94.5
90.4 |
 39
Adjusted gross operating asset reconciliation
(in millions)
Adjusted Gross Operating Assets Reconciliation
Q4 FY13
Q4 FY12
Total Assets
2,951
2,740
Accumulated Depreciation
494
458
Capitalized Operating Leases
327
190
Cash and Cash Equivalents
(216)
(262)
Investment in Unconsolidated Entities
(272)
(205)
Goodwill
(29)
(30)
Intangibles
(3)
(5)
Assets Held for Sale: Net
(8)
(19)
`
Assets Held for Sale: Gross
23
87
Adj. for gains & losses on assets sales
95
102
Accounts Payable
(70)
(56)
Accrued Maintenance and Repairs
(15)
(14)
Other Accrued Taxes
(8)
(5)
Accrued Wages, Benefits and Related Taxes
(56)
(44)
Other Accrued Liabilities
(21)
(23)
Income Taxes Payable
(12)
(10)
Deferred Revenue
(22)
(15)
ST Deferred Taxes
(0)
(15)
LT Deferred Taxes
(151)
(148)
Adjusted Gross Operating Assets before Lider
$3,007
$2,727
Adjusted Gross Operating Assets-Lider proportional
235
199
Adjusted Gross Operating Assets after Lider
$3,241
$2,926 |
 40
GAAP reconciliation |
 41
Leverage reconciliation
*Adjusted EBITDAR exclude gains and losses on dispositions of assets
Debt
Investment
Capital
Leverage
(a)
(b)
(c) = (a) + (b)
(a) / (c)
(in millions)
As of March 31, 2013
787.3
$
1,611.0
$
2,398.2
$
32.8%
Adjust for:
Unfunded Pension Liability
126.6
126.6
NPV of Lease Obligations
301.9
301.9
Letters of credit
2.6
2.6
Adjusted
1,218.4
$
(d)
1,611.0
$
2,829.3
$
43.1%
Calculation of debt to adjusted EBITDAR multiple
Adjusted EBITDAR*:
FY 2013
381.0
$
(e)
\
= (d) / (e)
3.2:1 |
 42
Bristow
net
asset
FMV
including
UK
SAR
aircraft
are
expected
to remain resilient and higher than current net asset FMV/share
The UK SAR aircraft are expected to add
significant net asset FMV in FY18, even after
netting the imputed leases
~71.00
Net Asset FMV per share including SAR
43.98
54.63
60.90
35.00
40.00
45.00
50.00
55.00
60.00
65.00
70.00
75.00
Mar-11
Jun-11
Sep-11
Dec-11
Mar-12
Jun-12
Sep-12
Dec-12
Mar-13
Book value of equity per share
Net Asset FMV per share
Average stock price |
 43
Bristow Group Inc. (NYSE: BRS)
2103 City West Blvd., 4
th
Floor
Houston, Texas 77042
t
713.267.7600
f
713.267.7620
bristowgroup.com
Contact Us |