Attached files
| file | filename |
|---|---|
| 8-K - 8-K - ARO Liquidation, Inc. | aro-20130523x8xk.htm |
| EX-99.1 - PRESS RELEASE - ARO Liquidation, Inc. | q113-exhibit991.htm |

1 First Quarter 2013 Financial Results


Condensed Consolidated Statements of Operation (unaudited) 3 May 4, 2013 % of sales April 28, 2012 % of sales Net sales $ 452,273 100.0 % $ 497,214 100.0% Cost of sales (includes certain buying, occupancy and warehousing expenses) 350,838 77.6 % 358,202 72.0% Gross profit 101,435 22.4 % 139,012 28.0% Selling, general and administrative expenses 121,941 27.0 % 122,323 24.6% (Loss) income from operations (20,506) (4.6)% 16,689 3.4% Interest expense, net 199 0.0 % 159 0.1% (Loss) income before income taxes (20,705) (4.6)% 16,530 3.3% Incom taxes (8,537) (1.9)% 5,954 1.2% Net (loss) income $ (12,168) (2.7)% $ 10,576 2.1% Basic (loss) earnings per share $ (0.16) $ 0.13 Diluted (loss) earnings per share $ (0.16) $ 0.13 Weighted average basic shares 78,370 81,044 Weighted average diluted shares 78,370 81,626 (In thousands, except per share data) 13 Weeks Ended

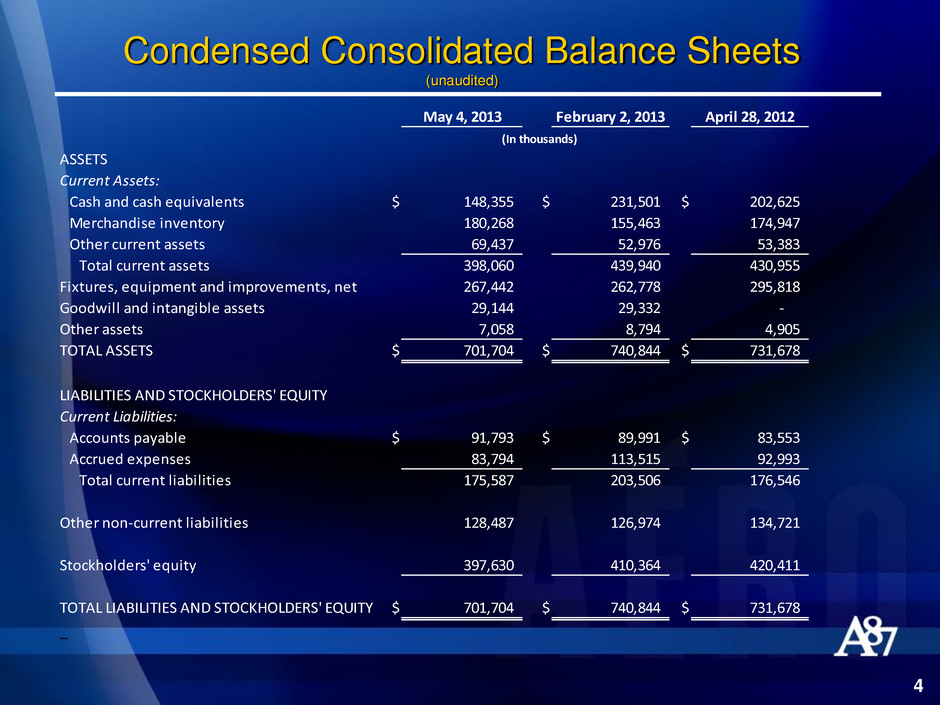
Condensed Consolidated Balance Sheets (unaudited) 4 May 4, 2013 February 2, 2013 April 28, 2012 ASSETS Current Assets: Cash and cash equivalents $ 148,355 $ 231,501 $ 202,625 Merchandise inventory 180,268 155,463 174,947 Other current assets 69,437 52,976 53,383 Total current assets 398,060 439,940 430,955 Fixtures, equipment and improvements, net 267,442 262,778 295,818 Goodwill and intangible assets 29,144 29,332 - Other assets 7,058 8,794 4,905 TOTAL ASSETS $ 701,704 $ 740,844 $ 731,678 LIABILITIES AND STOCKHOLDERS' EQUITY Current Liabilities: Accounts payable $ 91,793 $ 89,991 $ 83,553 Accrued expenses 83,794 113,515 92,993 Total current liabilities 175,587 203,506 176,546 Other non-current liabilities 128,487 126,974 134,721 Stockholders' equity 397,630 410,364 420,411 TOTAL LIABILITIES AND STOCKHOLDERS' EQUITY $ 701,704 $ 740,844 $ 731,678 _ (In thousands)

5 First Quarter 2013 Metrics May 4, 2013 April 28, 2012 Comparable sales change 1 (14)% 2 % Comparable units per transaction change 1 5 % 3 % Comparable sales transactions change 1 (10)% (1)% Comparable average unit retail change 1 (9)% 1 % 1 The comparable changes for the 13-week period ended May 4, 2013 are compared to the 13-week period ended May 5, 2012. 13 Weeks Ended

First Quarter 2013 Metrics 6 May 4, 2013 April 28, 2012 Average square footage increase 3 % 5 % Total square footage at end of period 4,087,060 3,950,570 Average square footage during period 4,053,745 3,928,764 Change in total inventory over comparable period 3 % 23 % Change in inventory per retail square foot (3)% 16 % over comparable period 13 Weeks Ended

7 First Quarter 2013 Store Count Q4 Additions Closures Q1 Aéropostale U.S. 906 1 (3) 904 Aéropostale Canada 78 - - 78 Total Aéropostale 984 1 (3) 982 P.S. from Aéropostale 100 24 - 124 Total stores 1,084 25 (3) 1,106
