Attached files
| file | filename |
|---|---|
| 8-K - FORM 8-K - SEALED AIR CORP/DE | d541813d8k.htm |
| EX-99.1 - EX-99.1 - SEALED AIR CORP/DE | d541813dex991.htm |
 SEALED AIR CORPORATION
Goldman Sachs Basic Materials Conference
May 22, 2013
Carol
P.
Lowe
–
Senior
Vice
President
&
Chief
Financial
Officer
Ryan
Flanagan
–
President
–
Protective
Packaging
Division
Exhibit 99.2 |
 Safe
Harbor and Regulation G Statement •
This
presentation
contains
“forward-looking
statements”
within
the
meaning
of
the
Private
Securities
Litigation
Reform
Act
of
1995.
Forward-looking
statements
can
be
identified
by
such
words
as
“anticipates,”
“believes,”
“plan,”
“assumes,”
“could,”
“estimates,”
“expects,”
“intends,”
“may,”
“plans to,”
“will”
and similar expressions.
Examples of these forward-looking statements include 2013 financial
expectations and assumptions associated with
our
restructuring
programs,
availability
and
pricing
of
raw
materials,
success
of
our
growth
programs,
economic conditions, and the success of pricing actions. These statements reflect
our beliefs and expectations as to future events and trends affecting our
business, our consolidated financial position and our results of operations.
A variety of factors may cause actual results to differ materially from these
expectations, including general domestic and international economic and
political conditions affecting packaging utilization; changes in our raw
material and energy costs; credit ratings; competitive conditions and contract
terms; currency translation and devaluation effects, including Venezuela;
the success of our financial growth, profitability and manufacturing
strategies and our cost reduction and productivity efforts; the effects of animal
and food-related health issues; pandemics; environmental matters;
regulatory actions and legal matters; and the successful integration of
Diversey. For
more
extensive
information,
see
“Risk
Factors”
and
“Cautionary
Notice
Regarding
Forward-
Looking Statements,”
which appear in our most recent Annual Report on Form 10-K, as filed with the
Securities and Exchange Commission, and as revised and updated by our
Quarterly Reports on Form 10-Q and Current Reports on Form 8-K.
While we may elect to update these forward-looking statements at some point in the future,
we specifically disclaim any obligation to do so, whether as a result of new
information, future events, or otherwise.
•
Our management uses non-U.S. GAAP financial measures to evaluate the
Company’s performance, which exclude items we consider unusual or
special items. We believe the use of such financial measures and
information may be useful to investors. We believe that the use of non-U.S.
GAAP measures helps investors to gain
a
better
understanding
of
core
operating
results
and
future
prospects,
consistent
with
how
management
measures and forecasts the Company's performance, especially when comparing such
results to previous periods or forecasts. For important information on our
use of non-U.S. GAAP financial measures and information, including
reconciliations of such non-U.S. GAAP financial measures and information to
comparable U.S. GAAP measures and information, please refer to the
financial tables and information provided in our most recent earnings release. 1
|
 Premium global provider with #1 or #2 position in our principal
applications
•
Food and Beverage (F&B)
–
Food Packaging and Food Solutions businesses, along with Diversey food and
beverage hygiene solutions business •
Institutional and Laundry (I&L)
–
Building services, food service, health care, hospitality and retail markets
•
Protective Packaging
–
Protective Packaging and Specialty Materials (formerly part of Other)
•
Medical Applications and New Ventures (Other category)
•
Geographic Reporting structure
–
North America
–
Europe
–
Latin America
–
AMAT (Asia, Middle East, Africa and Turkey)
–
Japan and Australia/New Zealand
2
49% F&B
28% I&L
21% Protective
2% Other
Diversified Revenue
Geographical
Reach
39% N. Am
33% Europe
11% L. Am
10% AMAT
7%
Japan/ANZ
24% Developing
regions
(1)
$7.6B
(1)
Developing Regions are Africa, Asia (excluding Japan and South Korea), Central and
Eastern Europe, and Latin America |
 3
Food & Beverage: Value Creation In Operations and Downstream
Note: All classifications include the related equipment sales.
Sales Mix by End Sector:
Sales Mix by Geography:
40%
28%
14%
6%
12%
North America
Europe
Latin America
AMAT
Japan/ANZ
41%
15%
10%
15%
19%
Fresh Meat
Smoked &
Processed
Dairy
Microwavable
Meals
Cleaning &
Hygiene |
 4
Institutional & Laundry: Reducing the “Total Cost to Clean”
Facility
Management &
BSC
Retailers
Hospitality
Food Service
Healthcare
*BSC=Building Service Contractors
Sales Mix by End Sector:
Sales Mix by Geography:
25%
45%
9%
18%
3%
North America
Europe
Latin America
AMAT
Japan/ANZ
11%
13%
11%
12%
9%
10%
34%
BSC*
Food Service
Retail
Lodging
Healthcare
Other
Distributors |
 5
Protective Packaging: Focused on Sustainable & Efficient Delivery
*General Use=Bubblewrap, PakNatural loose fill, Jiffy mailers; Pack Sys=NewAir IB,
PriorityPak, Fill-Air, FilTeck, PackTiger, FasFil EZ, RapidFill Sales Mix
by Geography: Sales Mix by End Sector:
57%
24%
5%
8%
6%
North America
Europe
Latin America
AMAT
Japan/ANZ
38%
35%
17%
10%
Cushioning
General Use*
Shrink
Pack Systems* |
 2013:
Focus on Quality of Earnings Improving
Profitability
6
Pricing Discipline
Deliver cost synergies and manage cost structure
Prioritizing
Resources
Repayment of debt
Dividends
R&D productivity
Aligning
Management
Goals
Productivity:
Support expenses measured in
relation to profitability
Achieving Plan:
Adjusted EBITDA
Cash Flow:
Reduced investment in working capital |
 Q1
2013 Highlights 7
Please see Sealed Air’s May 1, 2013 earnings press release for important
information about the use of non- U.S. GAAP financial measurers,
including applicable reconciliations to U.S. GAAP financial measures.
Reported U.S. GAAP Measures: Q1-13 Operating Profit: $130M; Q1-12
Operating Profit: $ 83M Food and Beverage
Institutional & Laundry
Protective Packaging
Excluding SARs expense:
Q1 2013 Adjusted EBITDA $245M, 13.2% of Sales
Q1 2012 Adjusted EBITDA $240M, 13.0% of Sales
•
+1.9% Organic Growth
•
Growth Drivers:
Developing Regions,
Brazilian Beef Production,
Equipment
•
Challenges:
North
American and European
Protein Supply
Constraints, price-cost
spread
•
+1.2% Organic Growth
•
Growth Drivers:
Developing Regions,
Food Service
•
Challenges:
Southern
Europe, SARs expense,
machine sales,
distribution in mature
markets
•
-0.8% Organic Growth
•
Growth
Drivers:
E-
commerce/retail
•
Challenges:
Global
economic weakness,
customer mix,
price/cost spread |
 Outlook for Full Year 2013
Management’s full year outlook includes:
–
Net Sales approximately $7.7 billion to $7.9 billion
–
Adjusted EBITDA approximately $1.01 billion to $1.03 billion
–
Earnings Per Share approximately $1.10 to $1.20 per share
–
Revised Free Cash Flow approximately $275 million to $325 million
•
Includes estimated cash costs of $65 million for earnings quality improvement
program and $70 million for the 2011-2014 Integration and Optimization
Program and anticipated higher SARs payments
•
Includes 2013 estimated capital expenditures of $160 million
•
2012 Free Cash Flow was $280 million and was net of $81 million of Integration and
Optimization cash payments and $125 million of capital expenditures
8
Please see Sealed Air’s May 1, 2013 earnings press release for important
information about the use of non-U.S. GAAP financial measurers,
including applicable reconciliations to U.S. GAAP financial measures. Adjusted
EPS guidance excludes the impact of special items. It also excludes the payment of the W. R. Grace settlement, as the exact timing
of the settlement is unknown. Final payment of the W. R. Grace settlement is
expected to be accretive to adjusted EPS by approximately $0.13 annually
following the payment date under the assumption of using a substantial portion of cash on hand for the payment and ceasing
to accrue interest on the settlement amount. Additionally, guidance excludes
any non-operating gains or losses that may be recognized in 2013 due to
currency fluctuations in Venezuela. |
 Protective
Packaging – Value Proposition
•
Minimize total cost of
packaging
•
Improved labor productivity
•
Reduced storage space
requirements
•
Reduced freight costs
9
•
Retail presentation
•
Highest clarity, high-gloss
•
Clean, tight package
appearance
•
Ease of use
•
Custom printing
•
Cushioning, Blocking & Bracing,
Void Fill, Surface Protection,
Containment
•
Minimize impact of shock,
vibration, and abrasion
•
Reduced damage during
distribution
•
High performance
with less material
•
Market leader in
biodegradable and
compostable
packaging products
•
High recycled
content
•
Recycling programs
Maximum
Value
Product
Protection
Customer
Appeal
Operational
Efficiency
Sustainability |
 •
Systematically shifting from product and geography to application and market
segment focus
•
Product lines and market / sales organization aligned with this shift
•
Instapak, Specialty
Foams, and Korrvu
product lines
•
Design driven solutions
which leverage SAC
support capabilities
•
Direct/Distribution/Fabric
ator sales model –
customer visibility is good
•
Instapak equipment and
service are key
competitive advantages
•
Products offer medium to
high levels of protection
Cushioning
Packaging
Systems
•
New Air Inflatable Bubble,
Fill Air Inflatable bags,
PackTiger Paper systems,
PriorityPak and Rapid Fill
systems
•
Based on a system &
consumable value sell
•
Sold through distribution,
but SAC has high visibility
through system support
•
Growth has been double
digits
•
Products offer low to
medium levels of
protection
Shrink Packaging
•
Cryovac and Opti shrink
films, and Shanklin
wrapping equipment
•
Based on a system &
consumable value sell
•
Sold through
distribution, but SAC
has good visibility
through technical sales
support
•
Products offer
unitization and display,
with light surface
protection
General Use
Cushioning Sales Force
General Use/PSS Sales Force
Shrink Sales Force
Protective Packaging –
Solution (Application) Segments
10
•
BubbleWrap, PE Foam,
Mailers and Loosefill
product lines
•
Primarily sold through
distribution
•
No systems or support
•
Ease of use and
affordability are key
considerations
•
Products offer low to
medium levels of
protection |
 Protective
Packaging: Distribution Channels 11 |
 SEALED AIR CORPORATION
Goldman Sachs Basic Industrials Conference
May 22, 2013
Q&A
Q&A
Q&A
Please see Sealed Air’s May 1, 2013 earnings press release for important
information about the use of non- U.S. GAAP financial measurers,
including applicable reconciliations to U.S. GAAP financial measures. All
results are on a continuing operations basis. 12 |
 SEALED AIR CORPORATION
Goldman Sachs Basic Industrials Conference
May 22, 2013
Appendix
Appendix
Appendix
Please see Sealed Air’s May 1, 2013 earnings press release for important
information about the use of non- U.S. GAAP financial measurers,
including applicable reconciliations to U.S. GAAP financial measures. All
results are on a continuing operations basis. 13 |
 Positive volume growth
across all Divisions
Offset by unfavorable
Foreign Exchange –
particularly in Latin America
14
Q1 Net Sales Bridge
($ in millions)
+19
+3
-14
1,853
1,845
Q1 2012
Volume
Price-Mix
Foreign
Exchange
Q1 2013 |
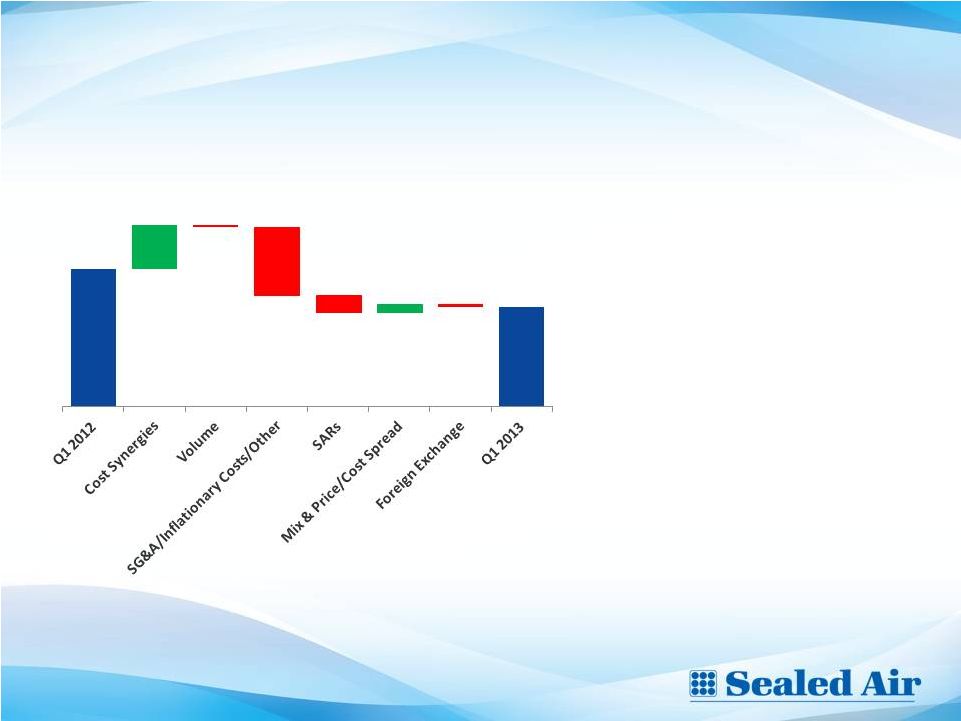
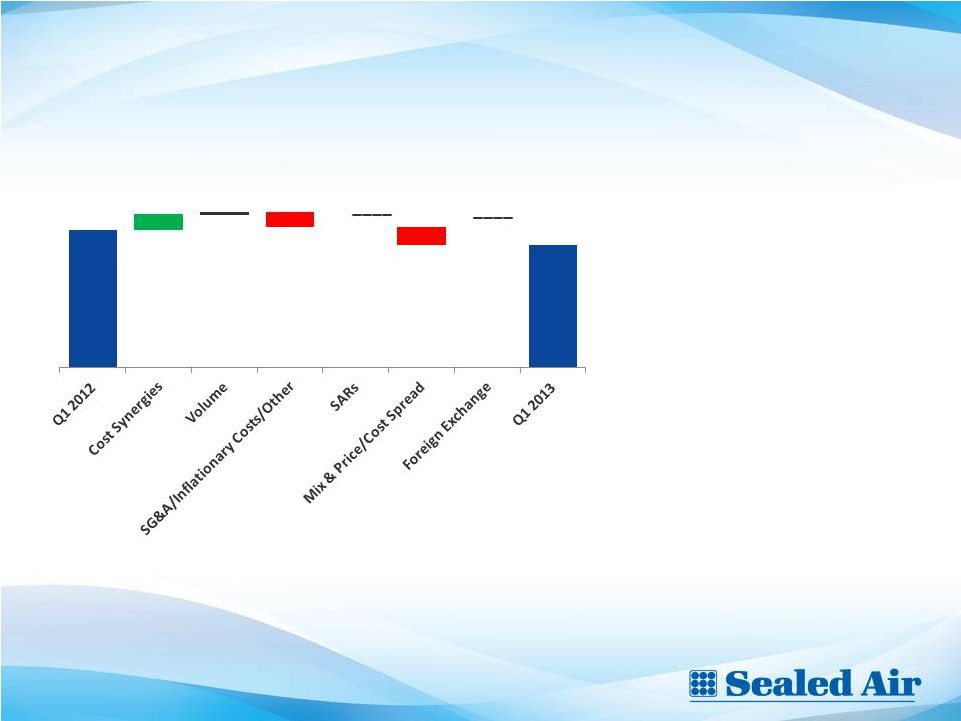
 Q1
2013 Adjusted EBITDA Bridge 15
($ millions)
Please see Sealed Air’s May 1, 2013 earnings press release for important
information about the use of non-U.S. GAAP financial measurers,
including applicable reconciliations to U.S. GAAP financial measures.
•
Strong cost synergies
•
Offset by inflationary
expense growth and SARs
expense
•
Excluding the impact of
SARs expense, Q1 2013
EBITDA grew $5 million over
prior year
228
227
+29
+7
-17
-7
-6
-5
-2 |
 Q1
2013 Adjusted EBITDA Bridge – F&B
16
($ millions)
Please see Sealed Air’s May 1, 2013 earnings press release for important
information about the use of non- U.S. GAAP financial measurers,
including applicable reconciliations to U.S. GAAP financial measures.
•
Strong cost synergies
•
Positive volume growth
•
Unfavorable SARs and
Price/Cost Spread
+13
+6
-8
-2
-3
-1
131
126 |
 Q1
2013 Adjusted EBITDA Bridge – I&L
17
($ millions)
Please see Sealed Air’s May 1, 2013 earnings press release for important
information about the use of non- U.S. GAAP financial measurers,
including applicable reconciliations to U.S. GAAP financial measures.
•
Strong cost synergies
•
Unfavorable impact of
SG&A/Inflationary Cost
Increases
•
Unfavorable impact of
SARs expense
36
+11
-1
-17
-4
+2
-1
26 |
 Q1
2013 Adjusted EBITDA Bridge – Protective Packaging
18
($ millions)
Please see Sealed Air’s May 1, 2013 earnings press release for important
information about the use of non- U.S. GAAP financial measurers,
including applicable reconciliations to U.S. GAAP financial measures.
•
Strong cost synergies
•
Unfavorable Price/Cost
Spread
61
+4
0
-3
0
-4
0
58 |
 19
Q1 Refinancing Provides Maturity Extension at Attractive Rates
= Senior Secured Credit Facilities (term loans) = $1.626B
= Short Term Borrowings
= Bonds (associated interest rate) =
$2.925B Debt Maturity Schedule
($ millions)
12.0%
8.125%
8.375%
6.875%
*Reflects estimated cash liability at December 31, 2013. Exact timing of the
settlement is unknown. 6.5%
Net Total Leverage Ratio Covenant*
(fiscal
year
ending
December
31
st
)
2013
2014
2015
2016+
5.25
4.50
3.75
3.25
Weighted average interest rate
Is approx. 6.2%
5.25%
8
120
330
408
760
150
750
425
750
425
450
926
77
2013
2014
2015
2016
2017
2018
2019
2020
2021
2023
2033
= W. R. Grace Settlement
* |
 Regional Sales Performance
First Quarter 2013
Latin
America
Reported: +5.4%
Organic: +11.9%
North
America
Reported: +0.2%
Organic: +0.2%
20
Please see Sealed Air’s May 1, 2013 earnings press release for important
information about the use of non- U.S. GAAP financial measurers,
including applicable reconciliations to U.S. GAAP financial measures.
Japan/ANZ
Reported: -2.3%
Organic: -0.6%
Europe
Reported: -2.1%
Organic: -2.4%
AMAT
Reported: +7.1%
Organic: +8.0% |