Attached files
| file | filename |
|---|---|
| 8-K - PBF ENERGY INC. & PBF HOLDING COMPANY LLC 8-K - PBF Energy Inc. | a50637894.htm |
Exhibit 99.1
PBF Energy Inc. Annual Meeting of Stockholders May 21, 2013
2 Legal Notice / Forward-Looking Statements This presentation contains forward-looking statements made by PBF Energy Inc. (the “Company” or “PBF”) and its management. Such statements are based on current expectations, forecasts and projections, including, but not limited to, anticipated financial and operating results, plans, objectives, expectations and intentions that are not historical in nature. Forward-looking statements should not be read as a guarantee of future performance or results, and may not necessarily be accurate indications of the times at, or by which, such performance or results will be achieved. Forward-looking statements are based on information available at the time, and are subject to various risks and uncertainties that could cause the Company’s actual performance or results to differ materially from those expressed in such statements. Factors that could impact such differences include, but are not limited to, changes in general economic conditions; volatility of crude oil and other feedstock prices; fluctuations in the prices of refined products; actions taken or non-performance by third parties, including suppliers, contractors, operators, transporters and customers; adequacy, availability and cost of capital; work stoppages or other labor interruptions; operating hazards, natural disasters, weather-related delays, casualty losses and other matters beyond our control; inability to complete capital expenditures, or construction projects that exceed anticipated or budgeted amounts; inability to successfully integrate acquired refineries or other acquired businesses or operations; effects of existing and future laws and governmental regulations, including environmental, health and safety regulations; effects of litigation; and, various other factors. Forward-looking statements reflect information, facts and circumstances only as of the date they are made. The Company assumes no responsibility or obligation to update forward-looking statements to reflect actual results, changes in assumptions or changes in other factors affecting forward-looking information after such date.
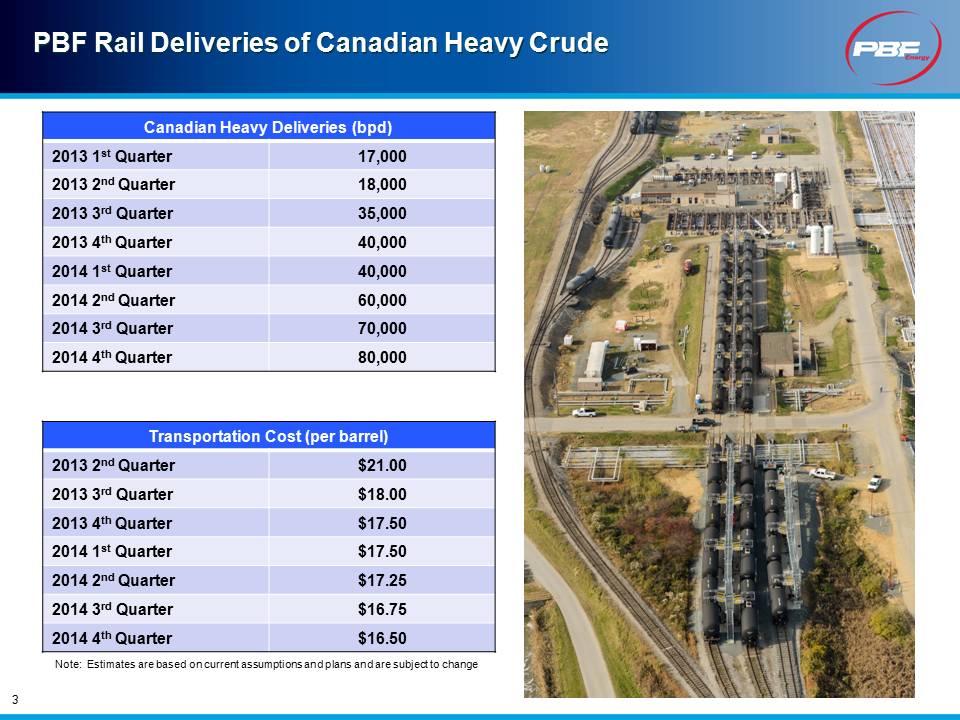
3 PBF Rail Deliveries of Canadian Heavy Crude Canadian Heavy Deliveries (bpd) 2013 1st Quarter 17,000 2013 2nd Quarter 18,000 2013 3rd Quarter 35,000 2013 4th Quarter 40,000 2014 1st Quarter 40,000 2014 2nd Quarter 60,000 2014 3rd Quarter 70,000 2014 4th Quarter 80,000 Transportation Cost (per barrel) 2013 2nd Quarter $21.00 2013 3rd Quarter $18.00 2013 4th Quarter $17.50 2014 1st Quarter $17.50 2014 2nd Quarter $17.25 2014 3rd Quarter $16.75 2014 4th Quarter $16.50 Note: Estimates are based on current assumptions and plans and are subject to change
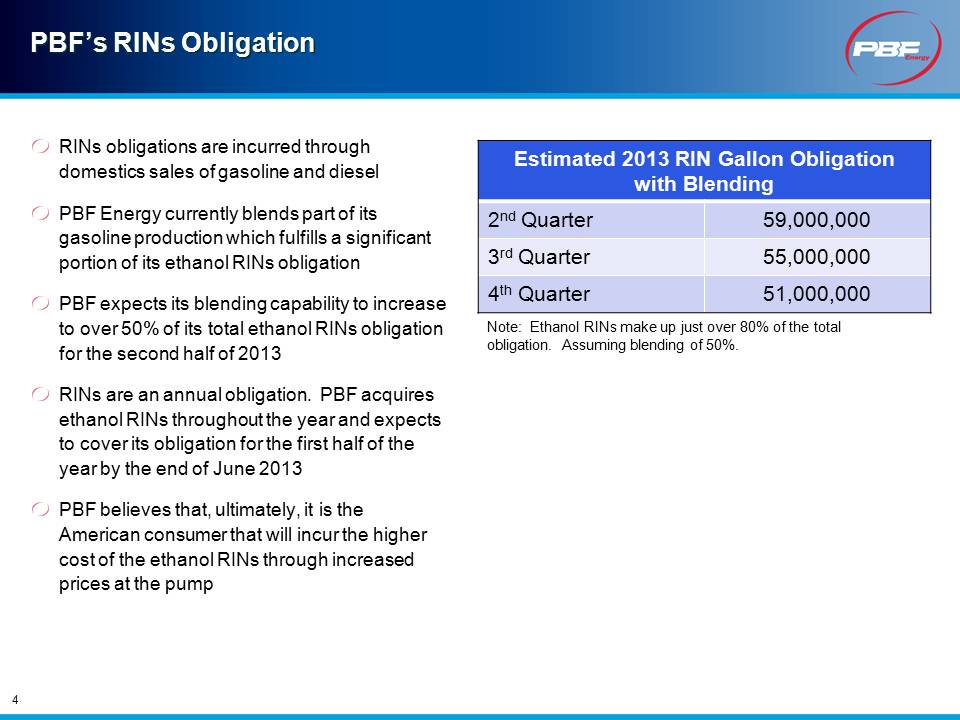
PBF’s RINs Obligation 4 RINs obligations are incurred through domestics sales of gasoline and diesel PBF Energy currently blends part of its gasoline production which fulfills a significant portion of its ethanol RINs obligation PBF expects its blending capability to increase to over 50% of its total ethanol RINs obligation for the second half of 2013 RINs are an annual obligation. PBF acquires ethanol RINs throughout the year and expects to cover its obligation for the first half of the year by the end of June 2013 PBF believes that, ultimately, it is the American consumer that will incur the higher cost of the ethanol RINs through increased prices at the pump Estimated 2013 RIN Gallon Obligation with Blending 2nd Quarter 59,000,000 3rd Quarter 55,000,000 4th Quarter 51,000,000 Note: Ethanol RINs make up just over 80% of the total obligation. Assuming blending of 50%.
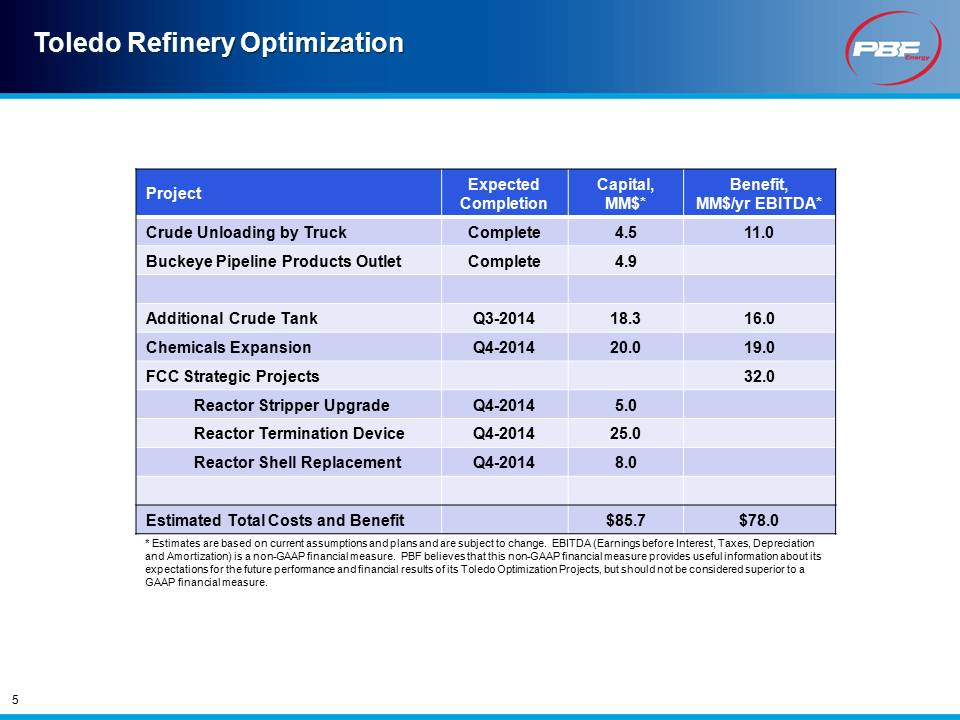
5 Toledo Refinery Optimization Project Expected Completion Capital, MM$* Benefit, MM$/yr EBITDA* Crude Unloading by Truck Complete 4.5 11.0 Buckeye Pipeline Products Outlet Complete 4.9 Additional Crude Tank Q3-2014 18.3 16.0 Chemicals Expansion Q4-2014 20.0 19.0 FCC Strategic Projects 32.0 Reactor Stripper Upgrade Q4-2014 5.0 Reactor Termination Device Q4-2014 25.0 Reactor Shell Replacement Q4-2014 8.0 Estimated Total Costs and Benefit $85.7 $78.0 * Estimates are based on current assumptions and plans and are subject to change. EBITDA (Earnings before Interest, Taxes, Depreciation and Amortization) is a non-GAAP financial measure. PBF believes that this non-GAAP financial measure provides useful information about its expectations for the future performance and financial results of its Toledo Optimization Projects, but should not be considered superior to a GAAP financial measure.

Presentation Remarks
Speaker: Thomas D. O’Malley, Executive Chairman, PBF Energy Inc.
I have three subjects to review at the meeting with our shareholders.
I will be using a slide presentation for each of these items and the slides together with my remarks are available on PBF’s website www.pbfenergy.com. First, I want to report on the progress we are making on the Company’s plans to process, on a long term basis, Canadian Heavy Crude oil.
This slide shows our current plan for the volume of Canadian Heavy Crude oil per day we hope to run and have run earlier in 2013:
|
Canadian Heavy Deliveries (bpd)
|
||
|
2013 1st Quarter
|
17,000
|
|
|
2013 2nd Quarter
|
18,000
|
|
|
2013 3rd Quarter
|
35,000
|
|
|
2013 4th Quarter
|
40,000
|
|
|
2014 1st Quarter
|
40,000
|
|
|
2014 2nd Quarter
|
60,000
|
|
|
2014 3rd Quarter
|
70,000
|
|
|
2014 4th Quarter
|
80,000
|
|
As you can see, there is a gradual increase in volume until we reach our planned rate in the 2nd half of 2014. The volume growth is tied to delivery of rail cars from our suppliers over the same period, suitable commercial arrangements, development of loading facilities in Western Canada and completion of our second heavy crude oil unloading facility at the Delaware City Refinery. While we believe this schedule is accurate, it is subject to change and is subject to governmental approvals. We will give periodic updates on the subject.
The second table gives our best estimate of the future costs of moving this crude oil from Western Canada by rail.
|
Transportation Cost (per barrel)
|
||||
|
2013 2nd Quarter
|
$ | 21.00 | ||
|
2013 3rd Quarter
|
$ | 18.00 | ||
|
2013 4th Quarter
|
$ | 17.50 | ||
|
2014 1st Quarter
|
$ | 17.50 | ||
|
2014 2nd Quarter
|
$ | 17.25 | ||
|
2014 3rd Quarter
|
$ | 16.75 | ||
|
2014 4th Quarter
|
$ | 16.50 | ||
The steady drop in cost is tied to three (3) factors:
|
1.)
|
substituting new cars we will receive under our long-term lease and or purchase contracts for much more expensive short term leases;
|
|
2.)
|
ongoing development of infrastructure in Canada; and
|
|
3.)
|
Unit train rates from railroads for our increasing volumes.
|
Once again, the schedule given on cost is subject to change and we will issue periodic updates on this matter at the time of our quarterly earnings call or as otherwise needed.
I believe the processing of Canadian Heavy Crudes combined with lighter crudes from both US Domestic fields and Canadian fields will lead to much improved profitability at our Delaware City facility. I can report to you that our facilities to discharge light crude oil at Delaware City are easily running above name plate capacity and that we will process at Delaware City approximately 80MBD of domestic light crude oil in May, combined with 18MBD of Western Canadian Sour Crude, and 65MBD of imported Heavy Crudes and feedstocks.
This is the start of the revised operating mode and with increasing Canadian Heavy substituting for imported waterborne heavy we believe we will put Delaware City in a position of sustained profitability.
RINs
The second subject I would like to comment on is the U.S. government’s program involving Renewable Identification Numbers. This program is, in our view, ill advised and not justified given today’s U.S. Energy environment.
It is in our view, an unjustified direct subsidy for the Ethanol and Bio Fuels industry, which raises prices on gasoline and diesel fuel, converts food to fuel and thus ”taxes” every American family through higher fuel and food prices. The program was entitled “The Energy Independence and Security Act” and was designed to lessen the country’s dependence on imported oil. The US Energy revolution which is only in its beginning stages negates the import issue. The U.S., will according to most experts, become a net energy exporter by about 2020. If you think our government established ill advised programs with the likes of Solyndra and Fisker, continuation of the substitution of food based fuel for Hydrocarbon under current regulations will make the cost of these programs look like small potatoes.
I believe the Act as currently administered in the future will easily add $25 billion to our national fuel bill. Most of this sum will go to subsidize the conversion of food to fuel and will of course raise food prices. If you do not want to believe my remarks, it might be useful to mention that ten (10) governors petitioned the EPA in 2012 to revise the regulation under the Energy Independence and Security Act, pointing out the high cost of the program. The EPA, which has the authority to make the changes, refused to act.
Recently, we have seen escalation for the cost of RINs, about a 10% increase, and this will impact PBF’s previous estimate for RINs expense, provided in April, of approximately $160 million for the program this year. For the six months ended June 30, 2013, PBF’s RINs expense should be approximately $90 million.
In addition to the direct RIN expense mentioned earlier, there is, we estimate, an additional cost of $100 million embedded in the price of ethanol we buy and blend into gasoline.
Our RINs obligation is dependent on our actual shipment of oil products domestically.
The following slide shows estimated RINs purchase obligation for the year by quarter and is dependent upon the volume of transportation fuels produced, the amount of blending achieved and the volume of transportation fuels exported.
|
Estimated 2013 RIN Gallon Obligation
with Blending
|
||
|
2nd Quarter
|
59,000,000
|
|
|
3rd Quarter
|
55,000,000
|
|
|
4th Quarter
|
51,000,000
|
|
Toledo
Finally, while the heavy crude opportunities I discussed earlier will improve the competitiveness of our East Coast systems, we are also pursuing opportunities to increase the profitability of our Toledo Refinery, as shown in the next slide.
These projects, which will improve crude sourcing and flexibility, further diversify our product sales into higher margin chemicals and improve the ULSD and total liquid yield from the plant are estimated to increase EBITDA by ~$80MM/yr at a capital cost of ~$85MM.
|
Project
|
Expected Completion
|
Capital, MM$
|
Benefit,
MM$/yr EBITDA
|
|
Crude Unloading by Truck
|
Complete
|
4.5
|
11.0
|
|
Buckeye Pipeline Products Outlet
|
Complete
|
4.9
|
|
|
Additional Crude Tank
|
Q3-2014
|
18.3
|
16.0
|
|
Chemicals Expansion
|
Q4-2014
|
20.0
|
19.0
|
|
FCC Strategic Projects
|
32.0
|
||
|
Reactor Stripper Upgrade
|
Q4-2014
|
5.0
|
|
|
Reactor Termination Device
|
Q4-2014
|
25.0
|
|
|
Reactor Shell Replacement
|
Q4-2014
|
8.0
|
|
|
Estimated Total Costs and Benefit
|
$85.7
|
$78.0
|