Attached files
| file | filename |
|---|---|
| 8-K - FORM 8-K - US BANCORP \DE\ | d541841d8k.htm |
Exhibit 99.1
| Barclays Americas Select Franchise Conference 2013 Andy Cecere Vice Chairman and CFO May 22, 2013 |

| Forward-looking Statements and Additional Information The following information appears in accordance with the Private Securities Litigation Reform Act of 1995: This presentation contains forward-looking statements about U.S. Bancorp. Statements that are not historical or current facts, including statements about beliefs and expectations, are forward-looking statements and are based on the information available to, and assumptions and estimates made by, management as of the date made. These forward-looking statements cover, among other things, anticipated future revenue and expenses and the future plans and prospects of U.S. Bancorp. Forward-looking statements involve inherent risks and uncertainties, and important factors could cause actual results to differ materially from those anticipated. Global and domestic economies could fail to recover from the recent economic downturn or could experience another severe contraction, which could adversely affect U.S. Bancorp's revenues and the values of its assets and liabilities. Global financial markets could experience a recurrence of significant turbulence, which could reduce the availability of funding to certain financial institutions and lead to a tightening of credit, a reduction of business activity, and increased market volatility. Continued stress in the commercial real estate markets, as well as a delay or failure of recovery in the residential real estate markets, could cause additional credit losses and deterioration in asset values. In addition, U.S. Bancorp's business and financial performance is likely to be negatively impacted by recently enacted and future legislation and regulation. U.S. Bancorp's results could also be adversely affected by deterioration in general business and economic conditions; changes in interest rates; deterioration in the credit quality of its loan portfolios or in the value of the collateral securing those loans; deterioration in the value of securities held in its investment securities portfolio; legal and regulatory developments; increased competition from both banks and non-banks; changes in customer behavior and preferences; effects of mergers and acquisitions and related integration; effects of critical accounting policies and judgments; and management's ability to effectively manage credit risk, residual value risk, market risk, operational risk, interest rate risk and liquidity risk. For discussion of these and other risks that may cause actual results to differ from expectations, refer to U.S. Bancorp's Annual Report on Form 10-K for the year ended December 31, 2012, on file with the Securities and Exchange Commission, including the sections entitled "Risk Factors" and "Corporate Risk Profile" contained in Exhibit 13, and all subsequent filings with the Securities and Exchange Commission under Sections 13(a), 13(c), 14 or 15(d) of the Securities Exchange Act of 1934. However, factors other than these could also adversely affect U.S. Bancorp's results, and you should not consider these factors to be a complete set of all potential risks. Forward-looking statements speak only as of the date they are made, and U.S. Bancorp undertakes no obligation to update them in light of new information or future events. This presentation includes non-GAAP financial measures to describe U.S. Bancorp's performance. The reconciliations of those measures to GAAP measures are provided within or in the appendix of the presentation. These disclosures should not be viewed as a substitute for operating results determined in accordance with GAAP, nor are they necessarily comparable to non-GAAP performance measures that may be presented by other companies. |
| U.S. Bancorp Overview Capital Management Business Lines 2Q13 Update Summary |
| U.S. Bancorp Overview |

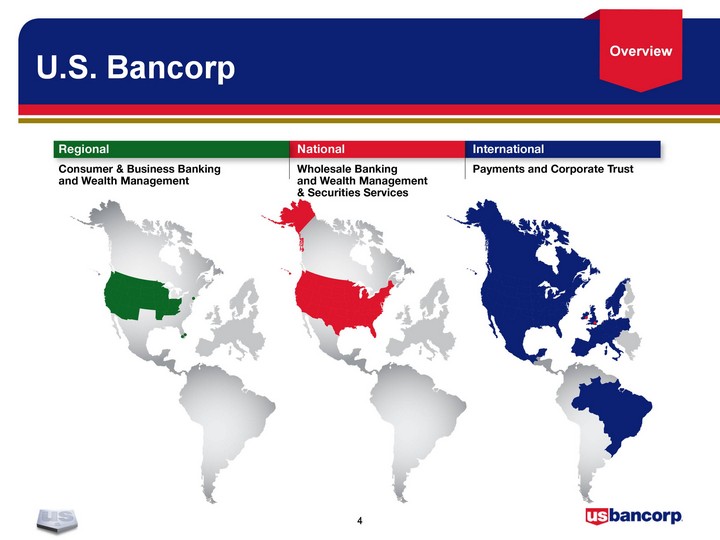
| U.S. Bancorp European Presence European Offices Elavon Corporate Trust London Dublin Diegem Frankfurt Arklow Loughlinstown Oslo Poznan Warsaw Madrid Watford Overview |

| U.S. Bancorp Dimensions * As of May 10, 2013 Asset Size $355 billion Deposits $248 billion Loans $223 billion Customers 17.6 million NYSE Traded USB Market Capitalization* $62 billion Founded 1863 Bank Branches 3,080 ATMs 5,056 1Q13 Dimensions Overview |
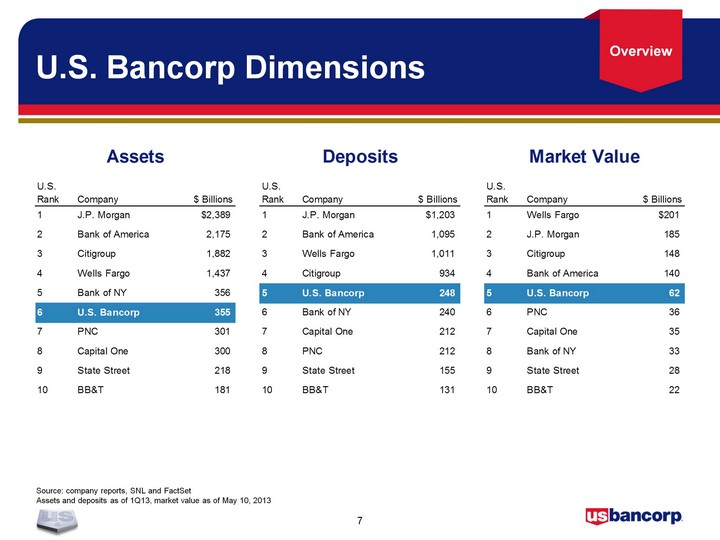
| U.S. Bancorp Dimensions Source: company reports, SNL and FactSet Assets and deposits as of 1Q13, market value as of May 10, 2013 Overview |

| Peer Bank Ticker Symbols BAC Bank of America PNC PNC BBT BB&T RF Regions FITB Fifth Third STI SunTrust JPM J.P. Morgan USB U.S. Bancorp KEY KeyCorp WFC Wells Fargo Peer Banks Overview |
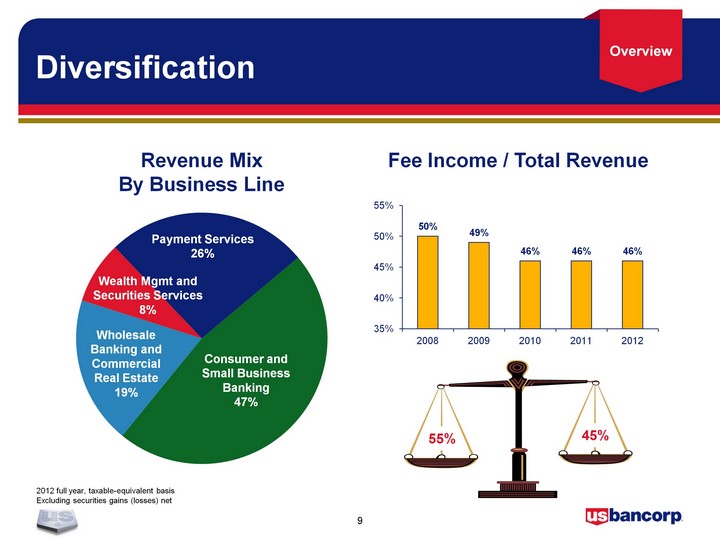
| Diversification 2012 full year, taxable-equivalent basis Excluding securities gains (losses) net Revenue Mix By Business Line (CHART) Consumer and Small Business Banking 47% Payment Services 26% Wealth Mgmt and Securities Services 8% Wholesale Banking and Commercial Real Estate 19% Fee Income / Total Revenue 55% 45% (CHART) Overview |
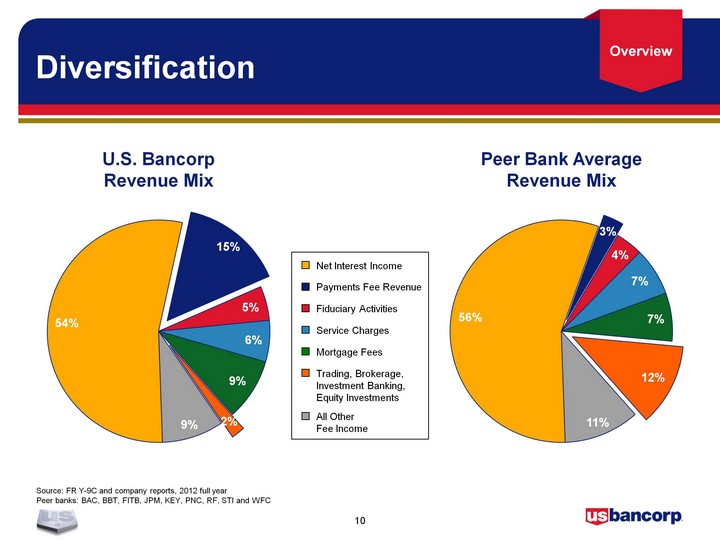
| Diversification Source: FR Y-9C and company reports, 2012 full year Peer banks: BAC, BBT, FITB, JPM, KEY, PNC, RF, STI and WFC U.S. Bancorp Revenue Mix (CHART) (CHART) Peer Bank Average Revenue Mix Net Interest Income Payments Fee Revenue Fiduciary Activities Service Charges Mortgage Fees Trading, Brokerage, Investment Banking, Equity Investments All Other Fee Income Overview |

| Performance Metrics Source: SNL and company reports Peer banks: BAC, BBT, FITB, JPM, KEY, PNC, RF, STI and WFC Return on Average Assets Return on Average Common Equity Efficiency Ratio Since 1Q08 1Q13 (CHART) (CHART) (CHART) (CHART) (CHART) (CHART) Overview |
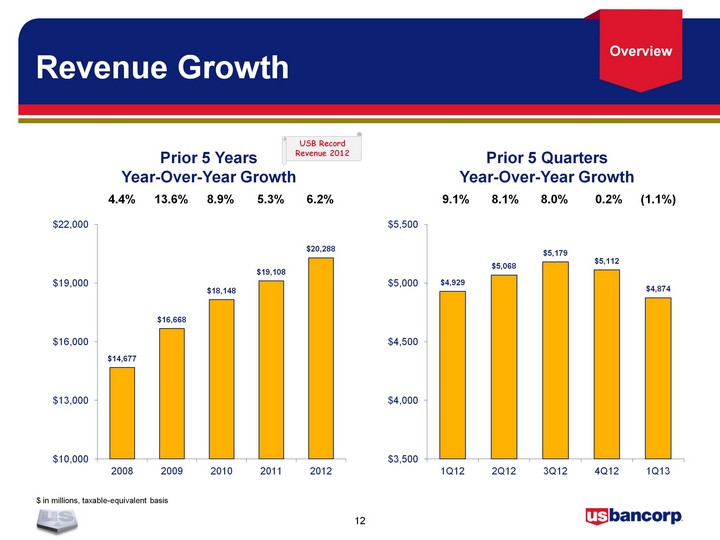
| Revenue Growth $ in millions, taxable-equivalent basis (CHART) (CHART) Prior 5 Years Year-Over-Year Growth 4.4% 13.6% 8.9% 5.3% 6.2% Prior 5 Quarters Year-Over-Year Growth 9.1% 8.1% 8.0% 0.2% (1.1%) USB Record Revenue 2012 Overview |
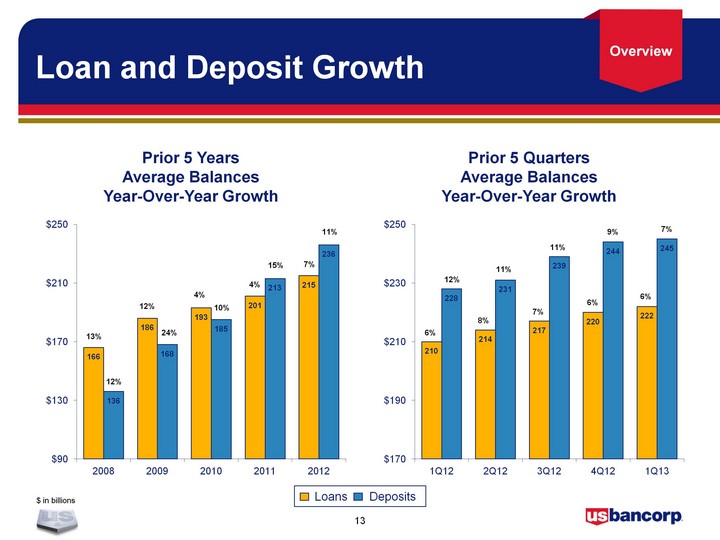
| Loan and Deposit Growth $ in billions (CHART) (CHART) 6% 12% 8% 6% 9% 6% 11% 11% 7% 4% 4% 11% 13% 12% 10% 15% 7% 12% 24% Loans Deposits Prior 5 Years Average Balances Year-Over-Year Growth Prior 5 Quarters Average Balances Year-Over-Year Growth 7% Overview |
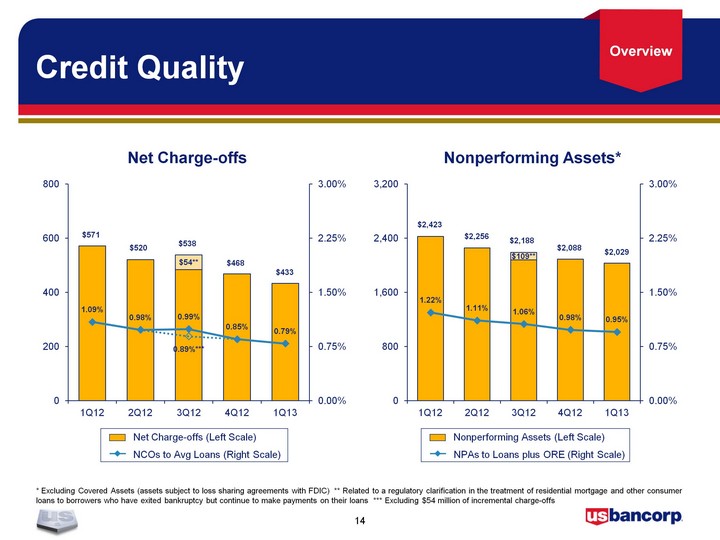
| Credit Quality * Excluding Covered Assets (assets subject to loss sharing agreements with FDIC) ** Related to a regulatory clarification in the treatment of residential mortgage and other consumer loans to borrowers who have exited bankruptcy but continue to make payments on their loans *** Excluding $54 million of incremental charge-offs Net Charge-offs Nonperforming Assets* (CHART) Net Charge-offs (Left Scale) NCOs to Avg Loans (Right Scale) Nonperforming Assets (Left Scale) NPAs to Loans plus ORE (Right Scale) (CHART) $433 $571 $520 $538 $468 $2,029 $2,423 $2,256 $2,188 $2,088 Overview |

| U.S. Bancorp Overview Capital Management Business Lines 2Q13 Update Summary |
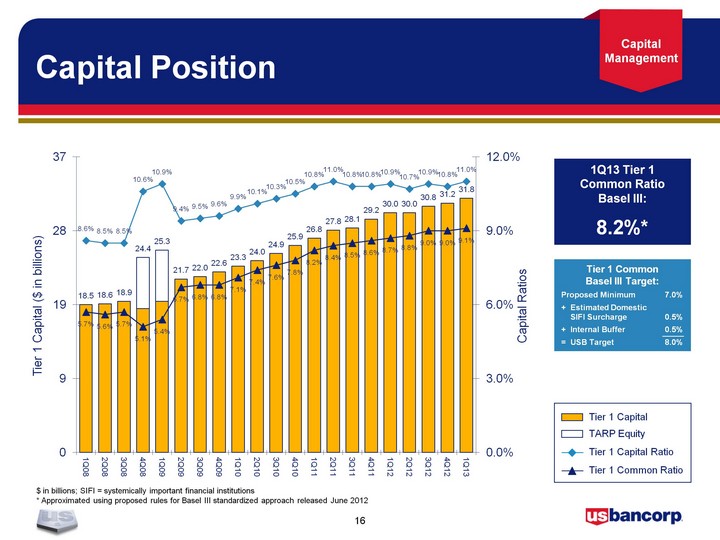
| Capital Position $ in billions; SIFI = systemically important financial institutions * Approximated using proposed rules for Basel III standardized approach released June 2012 (CHART) TARP Equity Tier 1 Capital Tier 1 Capital Ratio Tier 1 Common Ratio 1Q13 Tier 1 Common Ratio Basel III: 8.2%* Capital Management Tier 1 Common Basel III Target: Proposed Minimum 7.0% + Estimated Domestic SIFI Surcharge 0.5% + Internal Buffer 0.5% = USB Target 8.0% |
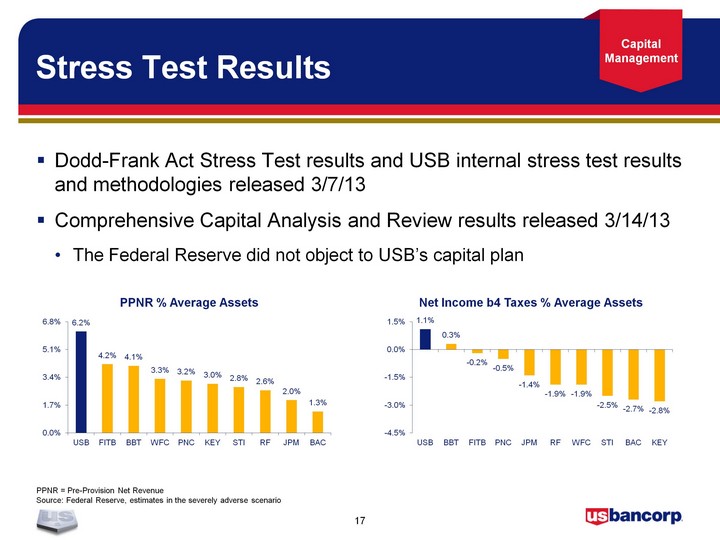
| Stress Test Results Dodd-Frank Act Stress Test results and USB internal stress test results and methodologies released 3/7/13 Comprehensive Capital Analysis and Review results released 3/14/13 The Federal Reserve did not object to USB's capital plan (CHART) (CHART) PPNR = Pre-Provision Net Revenue Source: Federal Reserve, estimates in the severely adverse scenario Capital Management |
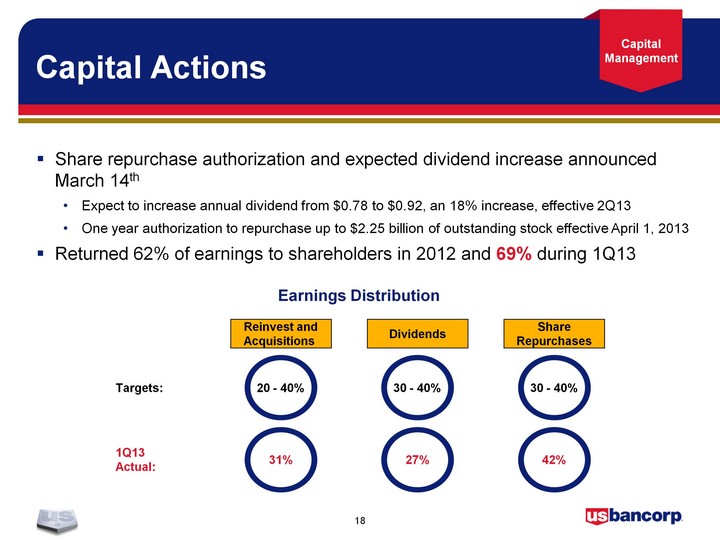
| Capital Actions Share repurchase authorization and expected dividend increase announced March 14th Expect to increase annual dividend from $0.78 to $0.92, an 18% increase, effective 2Q13 One year authorization to repurchase up to $2.25 billion of outstanding stock effective April 1, 2013 Returned 62% of earnings to shareholders in 2012 and 69% during 1Q13 Reinvest and Acquisitions Dividends Share Repurchases 20 - 40% Targets: 30 - 40% 30 - 40% 31% 1Q13 Actual: 42% 27% Earnings Distribution Capital Management |
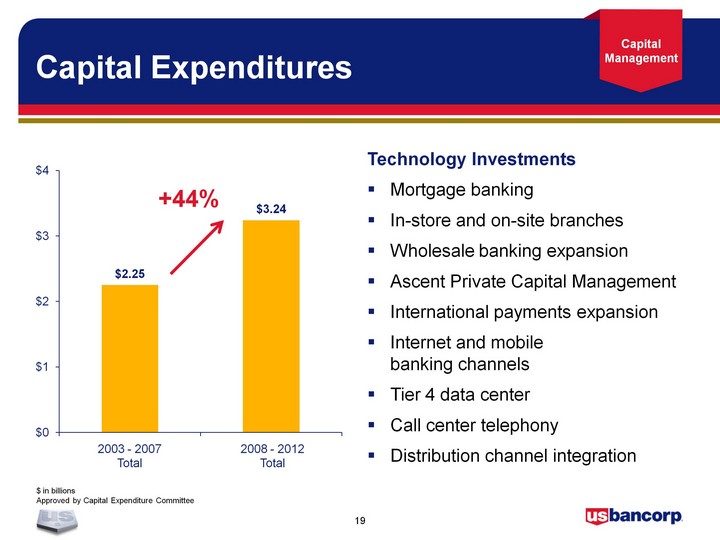
| Capital Expenditures Technology Investments Mortgage banking In-store and on-site branches Wholesale banking expansion Ascent Private Capital Management International payments expansion Internet and mobile banking channels Tier 4 data center Call center telephony Distribution channel integration (CHART) 2003 - 2007 Total 2008 - 2012 Total +44% $ in billions Approved by Capital Expenditure Committee Capital Management |
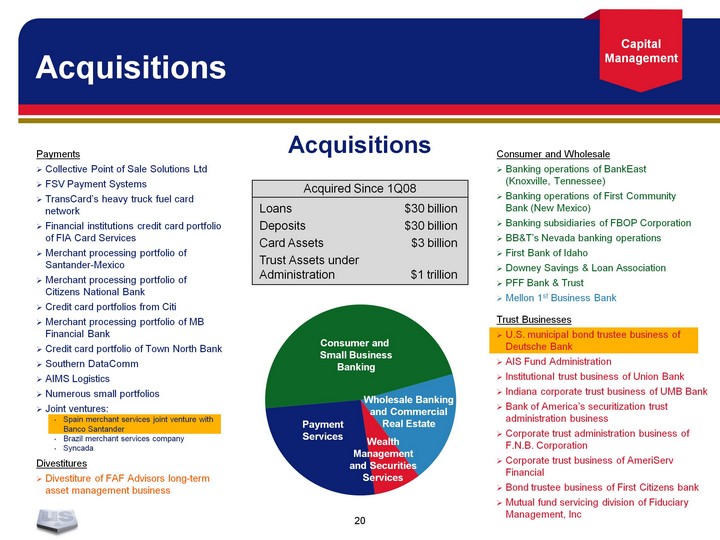
| Acquisitions Payments Collective Point of Sale Solutions Ltd FSV Payment Systems TransCard's heavy truck fuel card network Financial institutions credit card portfolio of FIA Card Services Merchant processing portfolio of Santander-Mexico Merchant processing portfolio of Citizens National Bank Credit card portfolios from Citi Merchant processing portfolio of MB Financial Bank Credit card portfolio of Town North Bank Southern DataComm AIMS Logistics Numerous small portfolios Joint ventures: Spain merchant services joint venture with Banco Santander Brazil merchant services company Syncada Consumer and Wholesale Banking operations of BankEast (Knoxville, Tennessee) Banking operations of First Community Bank (New Mexico) Banking subsidiaries of FBOP Corporation BB&T's Nevada banking operations First Bank of Idaho Downey Savings & Loan Association PFF Bank & Trust Mellon 1st Business Bank Trust Businesses U.S. municipal bond trustee business of Deutsche Bank AIS Fund Administration Institutional trust business of Union Bank Indiana corporate trust business of UMB Bank Bank of America's securitization trust administration business Corporate trust administration business of F.N.B. Corporation Corporate trust business of AmeriServ Financial Bond trustee business of First Citizens bank Mutual fund servicing division of Fiduciary Management, Inc Divestitures Divestiture of FAF Advisors long-term asset management business Acquisitions (CHART) Consumer and Small Business Banking Payment Services Wealth Management and Securities Services Wholesale Banking and Commercial Real Estate Loans $30 billion Deposits $30 billion Card Assets $3 billion Trust Assets under Administration $1 trillion Acquired Since 1Q08 Capital Management |
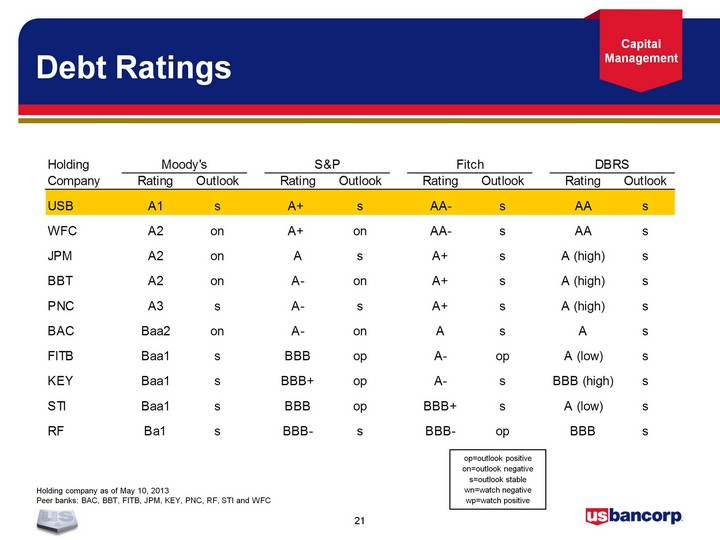
| Holding company as of May 10, 2013 Peer banks: BAC, BBT, FITB, JPM, KEY, PNC, RF, STI and WFC Debt Ratings op=outlook positive on=outlook negative s=outlook stable wn=watch negative wp=watch positive Capital Management |
| U.S. Bancorp Overview Capital Management Business Lines 2Q13 Update Summary |
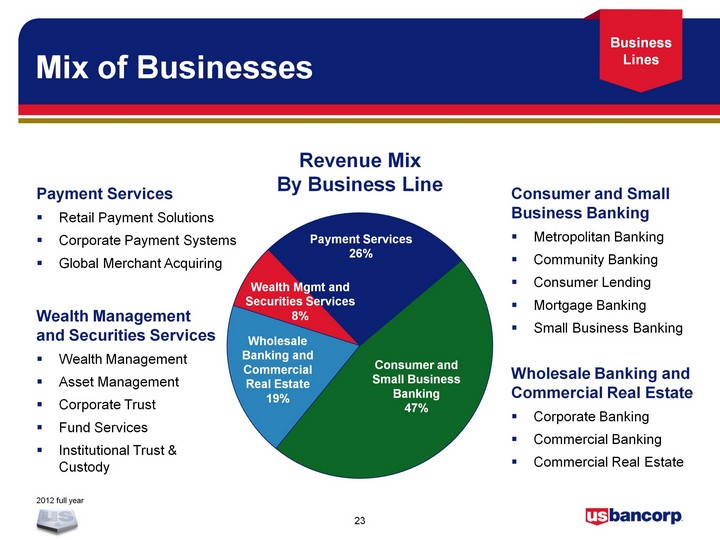
| Mix of Businesses Payment Services Retail Payment Solutions Corporate Payment Systems Global Merchant Acquiring Wealth Management and Securities Services Wealth Management Asset Management Corporate Trust Fund Services Institutional Trust & Custody Consumer and Small Business Banking Metropolitan Banking Community Banking Consumer Lending Mortgage Banking Small Business Banking Wholesale Banking and Commercial Real Estate Corporate Banking Commercial Banking Commercial Real Estate 2012 full year Revenue Mix By Business Line (CHART) Consumer and Small Business Banking 47% Payment Services 26% Wealth Mgmt and Securities Services 8% Wholesale Banking and Commercial Real Estate 19% Business Lines |
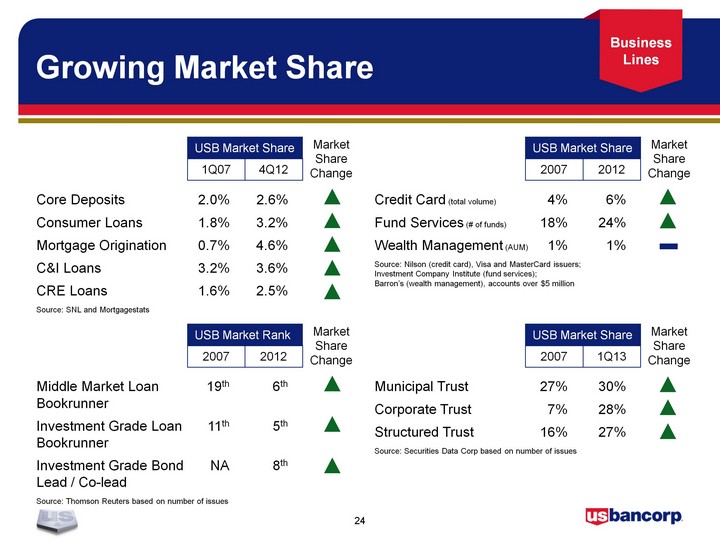
| Growing Market Share Middle Market Loan 19th 6th Bookrunner Investment Grade Loan 11th 5th Bookrunner Investment Grade Bond NA 8th Lead / Co-lead Source: Thomson Reuters based on number of issues 2012 2007 USB Market Rank Market Share Change Core Deposits 2.0% 2.6% Consumer Loans 1.8% 3.2% Mortgage Origination 0.7% 4.6% C&I Loans 3.2% 3.6% CRE Loans 1.6% 2.5% Source: SNL and Mortgagestats 4Q12 1Q07 USB Market Share Market Share Change 2012 2007 USB Market Share Market Share Change Credit Card (total volume) 4% 6% Fund Services (# of funds) 18% 24% Wealth Management (AUM) 1% 1% Source: Nilson (credit card), Visa and MasterCard issuers; Investment Company Institute (fund services); Barron's (wealth management), accounts over $5 million Municipal Trust 27% 30% Corporate Trust 7% 28% Structured Trust 16% 27% Source: Securities Data Corp based on number of issues 1Q13 2007 USB Market Share Market Share Change Business Lines |
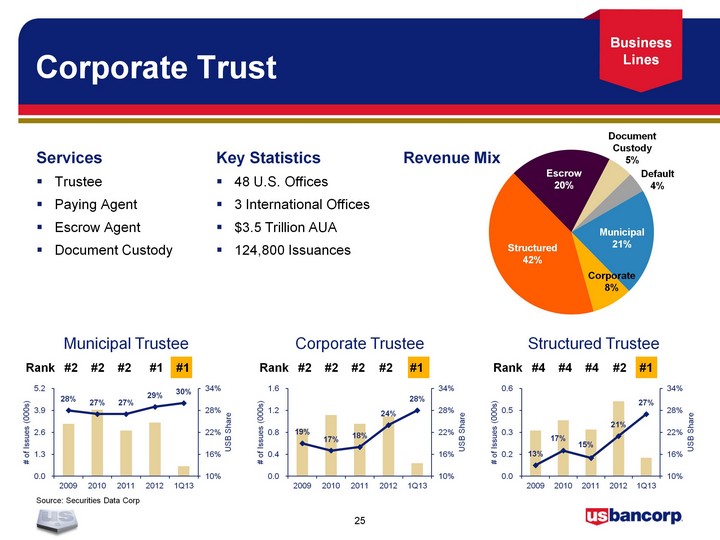
| Corporate Trust Business Lines (CHART) Escrow 20% Municipal 21% Structured 42% Corporate 8% Document Custody 5% Default 4% Services Trustee Paying Agent Escrow Agent Document Custody Key Statistics 48 U.S. Offices 3 International Offices $3.5 Trillion AUA 124,800 Issuances Revenue Mix (CHART) (CHART) (CHART) Corporate Trustee Municipal Trustee Structured Trustee Rank #2 #2 #2 #2 #1 Rank #2 #2 #2 #1 #1 Rank #4 #4 #4 #2 #1 Source: Securities Data Corp |
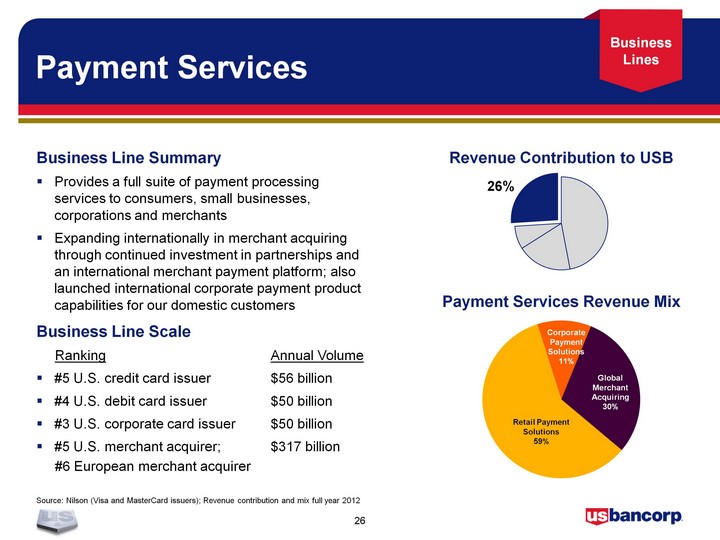
| Payment Services Source: Nilson (Visa and MasterCard issuers); Revenue contribution and mix full year 2012 (CHART) Business Line Summary Provides a full suite of payment processing services to consumers, small businesses, corporations and merchants Expanding internationally in merchant acquiring through continued investment in partnerships and an international merchant payment platform; also launched international corporate payment product capabilities for our domestic customers Business Line Scale Ranking Annual Volume #5 U.S. credit card issuer $56 billion #4 U.S. debit card issuer $50 billion #3 U.S. corporate card issuer $50 billion #5 U.S. merchant acquirer; $317 billion #6 European merchant acquirer (CHART) 26% Retail Payment Solutions 59% Global Merchant Acquiring 30% Corporate Payment Solutions 11% Revenue Contribution to USB Payment Services Revenue Mix Business Lines |
| U.S. Bancorp Overview Capital Management Business Lines 2Q13 Update Summary |

| 2Q13 Update Business Climate Mortgage Activity Loan Growth Net Interest Margin 2Q13 Update |

| U.S. Bancorp Overview Capital Management Business Lines 2Q13 Update Summary |
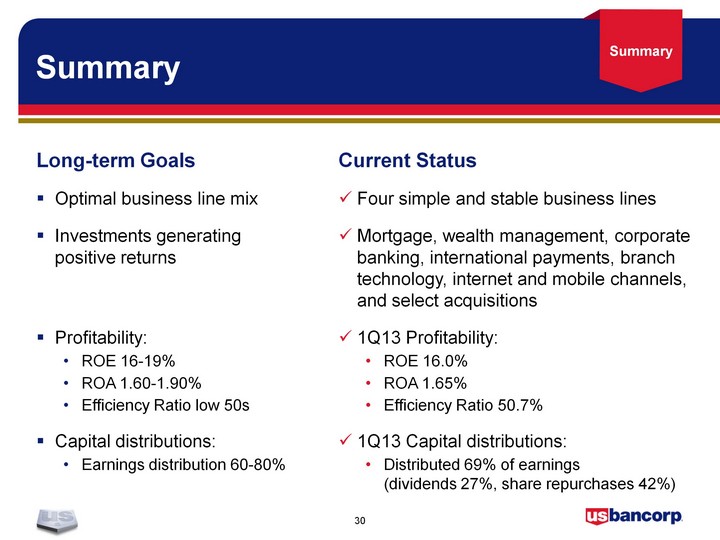
| Summary Long-term Goals Optimal business line mix Investments generating positive returns Profitability: ROE 16-19% ROA 1.60-1.90% Efficiency Ratio low 50s Capital distributions: Earnings distribution 60-80% Current Status Four simple and stable business lines Mortgage, wealth management, corporate banking, international payments, branch technology, internet and mobile channels, and select acquisitions 1Q13 Profitability: ROE 16.0% ROA 1.65% Efficiency Ratio 50.7% 1Q13 Capital distributions: Distributed 69% of earnings (dividends 27%, share repurchases 42%) Summary |

| Appendix Barclays Americas Select Franchise Conference |

| Non-GAAP Financial Measures Appendix |
| Barclays Americas Select Franchise Conference 2013 |