Attached files
| file | filename |
|---|---|
| 8-K - 8-K - SYNERGY PHARMACEUTICALS, INC. | a13-12409_28k.htm |
Exhibit 99.1
|
|
Plecanatide, A Novel Guanylate Cyclase-C Receptor Agonist, is Efficacious and Safe in Patients with Chronic Idiopathic Constipation: Results from a 951 Patient, 12 Week, Multi-Center Trial Authors: Philip B. Miner*1, Ron Surowitz2, Ron Fogel3, William Koltun4, Douglas A. Drossman5, Michael Camilleri6, Allen Mangel7, Laura Barrow8, Gary S. Jacob8 and Kunwar Shailubhai8 *Presenter, 1Oklahoma Foundation for Digestive Research, Oklahoma City, OK 2Health Awareness, Inc., Jupiter, FL 3Clinical Research Institute of MI, Chesterfield, MI 4Medical Center for Clinical Research, San Diego, CA 5School of Medicine, University of North Carolina, Chapel Hill, NC 6Mayo Clinic, Rochester, MN 7RTI, Research Triangle Park, NC 8Synergy Pharmaceuticals, New York, NY |
|
|
Plecanatide: Novel Approach to the Treatment of GI Disorders Analogue of uroguanylin- natural agonist of guanylate cyclase-C (GC-C) receptor Oral once-daily dosing Targets GC-C receptor in GI tract Essentially non-systemic Models normal physiology Plecanatide CIC Study |

|
|
Guanylate Cyclase-C Receptor Agonists Physiological mechanism Cross section of the GI tract Activation of GC-C receptors stimulates synthesis of cyclic GMP, activating cystic fibrosis transmembrane conductance regulator (CFTR) Activated CFTR secretes Cl-, HCO3- and fluid into the intestinal lumen. Secretion of fluid into intestine is critical for normal digestion 2 3 Uroguanylin (UroG) activates guanylate cyclase-C (GC-C) receptors on the lumenal side of the gut 1 1 2 3 4 Plecanatide binds to GC-C receptors, promoting spontaneous bowel movement (SBM) 4 Plecanatide Plecanatide CIC Study |
|
|
Plecanatide: A Novel Mechanism of Action to Treat Chronic Constipation and IBS-C 16 mer peptide with 2 disulfide bonds Structurally similar to uroguanylin Plecanatide binding constant to human GC-C receptors is 8-fold higher than uroguanylin No systemic absorption up to single oral doses of 48.6 mg Phase I and IIA Clinical Summary: Results suggest Plecanatide will be useful in treating CIC and IBS-C Uroguanylin (UroG) – Natural Hormone NDDCELCVNVACTGCL Plecanatide – Uroguanylin Analog NDECELCVNVACTGCL Plecanatide CIC Study |
|
|
Protocol Design Aim: Determine safety, effectiveness and dose-response of Plecanatide in CIC patients Randomized, double–blind, placebo controlled, parallel group, stratified by gender, multicenter study Population: modified Rome III CIC criteria, including < 3 CSBMs/week Evaluation of Plecanatide doses: 0.3, 1.0 & 3.0 mg given QD for 12 weeks Protocol Design: Screening -5 weeks Run-in -2 weeks Treatment 12 weeks Post- Tx 2 weeks Plecanatide CIC Study |
|
|
Key Protocol Inclusion/Exclusion Inclusion Modified Rome III for CIC including < 3 CSBM during each week of 2 week pre-treatment Exclusion Rome III IBS-C diagnosis Previous major GI surgical history Recognized causes of constipation (opioids, iron supplements, hypothyroidism, etc.) Plecanatide CIC Study |
|
|
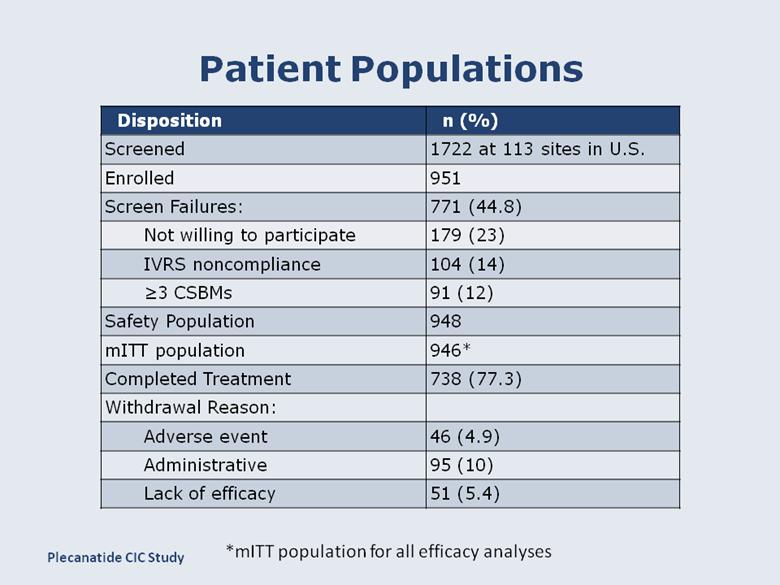
Patient Populations Disposition n (%) Screened 1722 at 113 sites in U.S. Enrolled 951 Screen Failures: 771 (44.8) Not willing to participate 179 (23) IVRS noncompliance 104 (14) ≥3 CSBMs 91 (12) Safety Population 948 mITT population 946* Completed Treatment 738 (77.3) Withdrawal Reason: Adverse event 46 (4.9) Administrative 95 (10) Lack of efficacy 51 (5.4) *mITT population for all efficacy analyses Plecanatide CIC Study |
|
|
Patient Demographics By Treatment Group Category Placebo Plecanatide n (%) Placebo N =234 0.3 mg N =237 1.0 mg N =238 3.0 mg N =237 Female Gender 209 (88.6) 203 (85.7) 202 (84.9) 205 (86.5) Mean Age (yr) (Min, Max) 46.2 (19, 75) 47.8 (20, 75) 47.1 (18, 75) 47.1 (18, 75) Race- White 171 (72.5) 171 (72.2) 170 (71.4) 175 (73.8) Race- Other 65 (27.6) 66 (27.8) 68 (28.6) 62 (26.2) Mean BMI (SD) (kg/m2) 26.9 (4.5) 27.6 (4.3) 27.2 (4.0) 27.3 (4.1) Plecanatide CIC Study |
|
|
Primary Endpoint Percent CSBM Responders % of Responders % of Responders *= p<0.05 ** = p<0.01 Plecanatide CIC Study |
|
|
Weekly Responder Rates ≥3 CSBMs/wk with an increase of ≥ 1 CSBM/wk * = p<0.05; ** = p < 0.01; *** = p < 0.001 Treatment Week % Responders *** Post-Treatment Plecanatide CIC Study |
|
|
Patients Reporting an Increase of ≥ 1 CSBM/week % Responders ** *** ** = p < 0.01; *** = p < 0.001 Plecanatide CIC Study |
|
|
Time to First SBM & CSBM Time (Hours) * ** ** ** * = p<0.05; ** = p < 0.01; *** = p < 0.001 Percent of Patients Plecanatide CIC Study |
|
|
Stool Consistency Bristol Stool Form Scale Score * = p<0.05; ** = p < 0.01; *** = p < 0.001 Treatment week ** ** 1 2 3 4 5 6 7 Plecanatide CIC Study |
|
|
Weekly Straining Scores Straining score based on 11-point score (0-10 rating) * = p<0.05; ** = p < 0.01; *** = p < 0.001 * Plecanatide CIC Study Mean Score |
|
|
Cumulative Days of Rescue Medication Use Per Month Days Taking RM * = p<0.05; ** = p < 0.01; *** = p < 0.001 * Plecanatide CIC Study |
|
|
Global Assessments, Symptoms and QOL Severity *** ** *** * = p<0.05; ** = p < 0.01; *** = p < 0.001 Severe Moderate Mild None Moderate Mild Little bit Moderate Not Little Moderate Quite Mean Score Mean Score Severe Severe Plecanatide CIC Study Mean Score |
|
|
Treatment Emergent Adverse Events >2% Event Placebo Plecanatide Adverse Event n (%) Placebo N=236 0.3 mg N=327 1.0 mg N=238 3.0 mg N=237 Any event 96 (40.7) 99 (41.8) 103 (43.3) 106 (44.7) Diarrhea 3 (1.3) 13 (5.5) 20 (8.4) 23 (9.7) Flatulence 5 (2.1) 5 (2.1) 3 (1.3) 14 (5.9) Abdominal Pain 11 (4.7) 6 (2.5) 9 (3.8) 12 (5.1) Abdominal Distension 5 (2.1) 5 (2.1) 10 (4.2) 9 (3.8) Nausea 5 (2.1) 5 (2.1) 12 (5.0) 8 (3.4) URI 5 (2.1) 6 (2.5) 5 (2.1) 9 (3.8) Nasopharyngitis 5 (2.1) 5 (2.1) 3 (1.3) 4 (1.7) UTI 6 (2.5) 5 (2.1) 9 (3.8) 8 (3.4) Headache 5 (2.1) 10 (4.2) 11 (4.6) 9 (3.8) Plecanatide CIC Study |
|
|
Summary of AEs and Diarrhea AEs Event Placebo Plecanatide n (%) Placebo N=236 0.3 mg N=237 1.0 mg N=238 3.0 mg N=237 Serious AEs 5 (2.1) 1 (0.4) 1 (0.4) 2 (0.8) Treatment-emergent (TE) AEs 96 (40.7) 99 (41.8) 103 (43.3) 106 (44.7) AEs leading to withdrawal 8 (3.4) 9 (3.8) 16 (6.7) 13 (5.5) All Diarrhea TEAEs 3 (1.3) 13 (5.5) 20 (8.4) 23 (9.7) Severe Diarrhea TEAEs 0 0 4 (1.7) 1 (0.4) WD due to Diarrhea 1 (0.4) 2 (0.8) 8 (3.4) 7 (3.0) Plecanatide CIC Study |
|
|
Serious Adverse Events (SAEs) Placebo Plecanatide Placebo n=5 0.3 mg n=1 1.0 mg n=1 3.0 mg n=2 Hypertension exacerbation Non-cardiac chest pain Endometriosis Acute cholecystitis Gastroenteritis Hypoaesthesia with weakness Spontaneous abortion Atypical chest pain Asthma exacerbation No signals in serum chemistries, hematology, urinalysis, ECG or vital signs Plecanatide CIC Study |
|
|
Plecanatide 3.0 mg produced a statistically significant improvement in all primary and key secondary endpoints Clear dose-response with doses below 3 mg achieving statistical significance in some primary and key secondary endpoints Safe and well tolerated with a diarrhea rate at the highest dose below 10% Conclusion This study demonstrates Plecanatide 3.0 mg dose appears to be safe and effective at this phase in development. Plecanatide CIC Study |