Attached files
| file | filename |
|---|---|
| EXCEL - IDEA: XBRL DOCUMENT - APOLLO SOLAR ENERGY, INC. | Financial_Report.xls |
| EX-31.1 - RULE 13A-14(A) CERTIFICATION ? CEO - APOLLO SOLAR ENERGY, INC. | apollo10qexh311.htm |
| EX-32.1 - RULE 13A-14(B) CERTIFICATION - APOLLO SOLAR ENERGY, INC. | apollo10qexh321.htm |
| EX-31.2 - RULE 13A-14(A) CERTIFICATION ? CFO - APOLLO SOLAR ENERGY, INC. | apollo10qexh312.htm |
UNITED STATES
SECURITIES AND EXCHANGE COMMISSION
Washington, D.C. 20549
FORM 10-Q
|
QUARTERLY REPORT PURSUANT TO SECTION 13 OR 15(d) OF THE SECURITIES EXCHANGE ACT OF 1934.
|
For the quarterly period ended March 31, 2013
|
TRANSITION REPORT PURSUANT TO SECTION 13 OR 15(d) OF THE SECURITIES EXCHANGE ACT OF 1934
|
For the transition period from __________ to ____________
Commission File Number: 000-12122
APOLLO SOLAR ENERGY, INC.
(Exact name of registrant as specified in its charter)
|
(State or other jurisdiction of incorporation or organization)
|
84-0601802
(I.R.S. Employer Identification No.)
|
|
No. 485 Tengfei Third,
Shuangliu Southwest Airport Economic Development Zone,
Shuangliu, Chengdu
People’s Republic of China, 610207
|
|
(Address of principal executive offices)
|
Registrant’s Telephone Number, Including Area Code: +86 (28) 8562-3888
Indicate by check mark whether the registrant (1) has filed all reports required to be filed by Section 13 or 15(d) of the Securities Exchange Act of 1934 during the preceding 12 months (or for such shorter period that the registrant was required to file such reports), and (2) has been subject to such filing requirements for the past 90 days. Yes ý No o
Indicate by check mark whether the registrant has submitted electronically and posted on its corporate Web site, if any, every Interactive Data File required to be submitted and posted pursuant to Rule 405 of Regulation S-T (§232.405 of this chapter) during the preceding 12 months (or for such shorter period that the registrant was required to submit and post such files). Yes ý No o
Indicate by check mark whether the registrant is a large accelerated filer, an accelerated filer, a non-accelerated filer, or a smaller reporting company. See the definitions of “large accelerated filer,” “accelerated filer” and “smaller reporting company” in Rule 12b-2 of the Exchange Act.
|
Large accelerated filer
|
o
|
Accelerated filer
|
o
|
|
Non-accelerated filer
|
o
|
Smaller reporting company | ý |
|
(Do not check if a smaller reporting company)
|
|||
Indicate by check mark whether the registrant is a shell company (as defined in Rule 12b-2 of the Act). Yes o No ý
There were 49,377,038 shares of common stock outstanding as of May 20, 2013.
APOLLO SOLAR ENERGY, INC.
TABLE OF CONTENTS TO QUARTERLY REPORT ON FORM 10-Q
For the Quarterly Period Ended March 31, 2013
|
ITEM
|
Page
|
||
|
PART I
|
FINANCIAL INFORMATION
|
2
|
|
|
Item 1.
|
Financial Statements
|
2
|
|
|
Item 2.
|
Management’s Discussion and Analysis of Financial Condition and Results of Operations
|
11
|
|
|
Item 3.
|
Quantitative and Qualitative Disclosures About Market Risk
|
16
|
|
|
Item 4.
|
Controls and Procedures
|
16
|
|
|
PART II
|
OTHER INFORMATION
|
16
|
|
|
Item 1.
|
Legal Proceedings
|
16
|
|
|
Item 1A.
|
Risk Factors
|
17
|
|
|
Item 6.
|
Exhibits
|
17
|
|
|
Signatures
|
17
|
1
|
APOLLO SOLAR ENERGY, INC
|
||||||||
|
CONSOLIDATED BALANCE SHEETS
|
||||||||
|
March 31,
2013
|
December 31,
2012
|
|||||||
|
(Unaudited)
|
||||||||
|
ASSETS
|
||||||||
|
Current Assets
|
||||||||
|
Cash
|
$ | 892,740 | $ | 940,225 | ||||
|
Accounts receivable, net of allowance of $18,976 and $18,872
|
606,037 | 339,648 | ||||||
|
Inventories
|
3,071,449 | 3,202,724 | ||||||
|
Prepaid expenses and other current assets
|
747,003 | 353,605 | ||||||
|
Total Current Assets
|
5,317,229 | 4,836,202 | ||||||
|
Long-term Assets
|
||||||||
|
Property, machinery and mining assets, net
|
16,713,092 | 16,853,702 | ||||||
|
Non-marketable investment
|
55,852 | 55,546 | ||||||
|
Investment in and advances to Joint Venture
|
5,377,111 | 5,425,577 | ||||||
|
Total long-term Assets
|
22,146,055 | 22,334,825 | ||||||
|
Total Assets
|
$ | 27,463,284 | $ | 27,171,027 | ||||
|
LIABILITIES AND SHAREHOLDERS' EQUITY
|
||||||||
|
Current Liabilities
|
||||||||
|
Short-term loans
|
$ | 7,681,199 | $ | 7,797,845 | ||||
|
Account payable - trade
|
1,153,193 | 261,953 | ||||||
|
Account payable - construction vendors
|
1,170,821 | 1,164,411 | ||||||
|
Accrued expenses and other current liabilities
|
2,755,763 | 2,735,892 | ||||||
|
Due to stockholders and related parties
|
453,104 | 373,322 | ||||||
|
Total Current Liabilities
|
13,214,080 | 12,333,423 | ||||||
|
Long-term liabilities
|
||||||||
|
Convertible loan
|
400,000 | 100,970 | ||||||
|
Total liabilities
|
13,614,080 | 12,434,393 | ||||||
|
Stockholders' Equity
|
||||||||
|
Preferred stock:
|
- | - | ||||||
|
$0.001 par value, 25,000,000 shares authorized; 0 shares issued and outstanding as of March 31, 2013 and December 31, 2012
|
||||||||
|
Common stock:
|
51,796 | 51,796 | ||||||
|
$0.001 par value, 100,000,000 shares authorized; 51,795,961 shares issued and 49,377,038 shares outstanding as of March 31, 2013 and December 31, 2012
|
||||||||
|
Additional paid-in capital
|
33,103,249 | 33,032,641 | ||||||
|
Treasury stock 2,418,923 shares at cost
|
(5,216,770 | ) | (5,216,770 | ) | ||||
|
Accumulated deficit
|
(17,169,498 | ) | (16,125,326 | ) | ||||
|
Accumulated other comprehensive income
|
3,080,427 | 2,994,293 | ||||||
|
Total stockholders' Equity
|
13,849,204 | 14,736,634 | ||||||
|
Total Liabilities and Stockholders' Equity
|
$ | 27,463,284 | $ | 27,171,027 | ||||
See accompanying notes to the consolidated financial statements
2
|
APOLLO SOLAR ENERGY, INC
|
||||||||
|
CONSOLIDATED STATEMENTS OF COMPREHENSIVE LOSS
|
||||||||
|
(Unaudited)
|
||||||||
|
For the Three Months
Ended March 31,
|
||||||||
|
2013
|
2012
|
|||||||
|
Sales
|
$ | 1,556,215 | $ | 1,872,034 | ||||
|
Cost of goods sold
|
(1,419,509 | ) | (1,768,154 | ) | ||||
|
Gross profit
|
136,706 | 103,880 | ||||||
|
Operating expenses:
|
||||||||
|
General and administrative expenses
|
619,048 | 688,019 | ||||||
|
Selling expense
|
64,548 | 56,898 | ||||||
|
Research and development expenses
|
295,252 | 155,570 | ||||||
|
Total operating expenses
|
978,848 | 900,487 | ||||||
|
Operating loss
|
(842,142 | ) | (796,607 | ) | ||||
|
Other income (expense):
|
||||||||
|
Interest expense
|
(106,529 | ) | (138,896 | ) | ||||
|
Loss in equityof Joint Venture
|
(95,500 | ) | (108,597 | ) | ||||
|
Total other income (expense)
|
(202,029 | ) | (247,493 | ) | ||||
|
Loss before provision for income taxes
|
(1,044,171 | ) | (1,044,100 | ) | ||||
|
Provision for income taxes
|
- | - | ||||||
|
Net loss
|
(1,044,171 | ) | (1,044,100 | ) | ||||
|
Other comprehensive loss
|
||||||||
|
Foreign currency translation adjustment
|
86,133 | 28,950 | ||||||
|
Comprehensive loss
|
$ | (958,038 | ) | $ | (1,015,150 | ) | ||
|
Loss per share
|
||||||||
|
Basic
|
$ | (0.02 | ) | $ | (0.02 | ) | ||
|
Diluted
|
$ | (0.02 | ) | $ | (0.02 | ) | ||
|
Weighted average shares outstanding
|
||||||||
|
Basic
|
49,377,038 | 49,377,038 | ||||||
|
Diluted
|
49,377,038 | 49,377,038 | ||||||
See accompanying notes to the consolidated financial statements
3
|
APOLLO SOLAR ENERGY, INC
|
||||||||
|
CONSOLIDATED STATEMENTS OF CASH FLOWS
|
||||||||
|
(Unaudited)
|
||||||||
|
For the Three Months
Ended March 31,
|
||||||||
|
2013
|
2012
|
|||||||
|
Cash flows from operating activities:
|
||||||||
|
Net Loss
|
$ | (1,044,171 | ) | $ | (1,044,100 | ) | ||
|
Adjustments to reconcile net loss to net cash used in operating activities:
|
- | |||||||
|
Stock-based compensation
|
70,608 | 143,618 | ||||||
|
Loss in equity of Joint Venture
|
95,500 | 108,597 | ||||||
|
Depreciation and amortization
|
234,149 | 238,531 | ||||||
|
Changes in operating assets and liabilities:
|
||||||||
|
Accounts receivable
|
(264,084 | ) | 24,730 | |||||
|
Inventory
|
148,664 | 246,589 | ||||||
|
Prepaid expenses and other current assets
|
(390,808 | ) | (1,297,217 | ) | ||||
|
Accounts payable-trade
|
888,341 | 32,737 | ||||||
|
Accounts payable-construction
|
- | (31,052 | ) | |||||
|
Accrued expenses and other current liabilities
|
9,511 | (315,157 | ) | |||||
|
Net cash used in operating activities
|
(252,290 | ) | (1,892,724 | ) | ||||
|
Cash flows from investing activities:
|
||||||||
|
Purchase of property and equipment
|
(1,141 | ) | (13,499 | ) | ||||
|
Net cash used in investing activities
|
(1,141 | ) | (13,499 | ) | ||||
|
Cash flows from financing activities:
|
||||||||
|
Proceeds from (Repanyment of) short-term loans
|
(159,314 | ) | 2,852,495 | |||||
|
Proceeds from (repayment of) to stockholder loan
|
78,663 | - | ||||||
|
Due to related parties
|
17,328 | 11,969 | ||||||
|
Proceeds from convertible loan
|
299,030 | - | ||||||
|
Net cash provided by financing activities
|
235,707 | 2,864,464 | ||||||
|
Effect of exchange rate changes on cash
|
(29,761 | ) | 2,032 | |||||
|
Net increase (decrease) in cash
|
(47,485 | ) | 960,273 | |||||
|
Cash at beginning of period
|
940,225 | 363,771 | ||||||
|
Cash at end of period
|
$ | 892,740 | $ | 1,324,044 | ||||
|
Supplemental disclosure of cash flow information
|
||||||||
|
Income tax paid in cash
|
$ | - | $ | 111 | ||||
|
Interest expense
|
$ | 110,595 | $ | 99,377 | ||||
See accompanying notes to the consolidated financial statements
4
APOLLO SOLAR ENERGY, INC.
NOTES TO CONSOLIDATED FINANCIAL STATEMENTS
FOR THE THREE MONTHS ENDED MARCH 31, 2013
(UNAUDITED)
NOTE 1. BASIS OF PRESENTATION
The accompanying unaudited consolidated financial statements of Apollo Solar Energy, Inc. (the “Company) reflect all material adjustments consisting of only normal recurring adjustments which, in the opinion of management, are necessary for a fair presentation of results for the interim periods. Certain information and footnote disclosures required under accounting principles generally accepted in the United States of America have been condensed or omitted pursuant to the rules and regulations of the Securities and Exchange Commission, although the Company believes that the disclosures are adequate to make the information presented not misleading. These consolidated financial statements should be read in conjunction with the consolidated financial statements and notes thereto included in the Company’s Annual Report on Form 10-K for the year ended December 31, 2012 as filed with the Securities and Exchange Commission.
The preparation of financial statements in conformity with accounting principles generally accepted in the United States of America requires management to make estimates and assumptions that affect the reported amounts of assets and liabilities and disclosure of contingent assets and liabilities at the date of the financial statements and those estimates. Estimates that are particularly susceptible to change include assumptions used in determining the fair value of securities owned and non-readily marketable securities.
The results of operations for the three months ended March 31, 2013 are not necessarily indicative of the results to be expected for the entire year or for any future period.
The Company’s functional currency is the Chinese Renminbi (“RMB”); however, the accompanying financial statements have been translated and presented in United States Dollars (“USD”).
Going concern
The accompanying financial statements have been prepared assuming that the Company will continue as a going concern. As shown in the accompanying financial statements, the Company has negative working capital of $7,896,851, did not generate cash from its operations, and has had operating losses during past two years. These circumstances, among others, raise substantial doubt about the Company’s ability to continue as a going concern. The financial statements do not include any adjustments that might result from the outcome of this uncertainty.
Inventories are valued at the lower of cost or net realizable value with cost determined on the weighted-average method. Work in progress and finished goods are composed of direct material, direct labor and a portion of manufacturing overhead. Net realizable value is the estimated selling price in the ordinary course of business, less estimated costs to complete and dispose. The Company did not record any inventory mark-down for the three months ended March 31, 2013 and 2012, respectively.
5
APOLLO SOLAR ENERGY, INC.
NOTES TO CONSOLIDATED FINANCIAL STATEMENTS
FOR THE THREE MONTHS ENDED MARCH 31, 2013
(UNAUDITED)
NOTE 2. INVENTORIES (Continued)
Inventories consist of the following:
|
As of
|
||||||||
|
March 31,
2013
|
December 31,
2012
|
|||||||
|
Raw Materials
|
$
|
829,947
|
$
|
765,637
|
||||
|
Work-in-progress
|
818,082
|
860,535
|
||||||
|
Finished goods
|
1,423,420
|
1,576,552
|
||||||
|
Total
|
$
|
3,071,449
|
$
|
3,202,724
|
||||
Prepaid expenses and other current assets consist following:
|
|
March 31,
2013
|
December 31,
2012
|
||||||
|
Advances for purchases
|
$ | 581,902 | $ | 221,985 | ||||
|
Other receivable
|
165,101 | 131,620 | ||||||
|
Total
|
$ | 747,003 | $ | 353,605 | ||||
NOTE 4. RELATED PARTIES TRANSACTIONS AND BALANCES
The breakdown of due from/due to related parties consists of the following:
|
As of
|
||||||||
|
March 31,
2013
|
December 31,
2012
|
|||||||
|
Due to (from) Xinju
|
$
|
(37,949
|
)
|
$
|
(37,704)
|
|||
|
Due to shareholders and related parties
|
491,053
|
411,026
|
||||||
|
Total
|
$
|
$ 451,104
|
$
|
373,322
|
||||
Due to shareholders and due to/from Xinju are non-interest bearing and due on demand.
Xinju is a related company partially owned by the second largest shareholder of Apollo Solar Energy.
6
APOLLO SOLAR ENERGY, INC.
NOTES TO CONSOLIDATED FINANCIAL STATEMENTS
FOR THE THREE MONTHS ENDED MARCH 31, 2013
(UNAUDITED)
NOTE 5. EQUITY METHOD INVESTMENT IN JOINT VENTURE
On November 9, 2009, Sichuan Apollo Solar Science & Technology Co. Ltd. (“Sichuan Apollo”), a wholly-owned foreign subsidiary of the Company, entered into a joint venture agreement (the “Agreement”) with Bengbu Design & Research Institute for Glass Industry (“Bengbu”) and a local Chinese government agency (the “Agency”). The Joint Venture (“JV”) was formed to conduct research and development related to glass used in the production of thin film solar cells and manufacture thin film solar cells. The Company accounts for this investment under the equity method of accounting.
Under the terms of the agreement, Benghu and the Agency own an aggregate of 65% of the JV and Sichuan Apollo owns the remaining 35%. The JV was formed with a cash contribution by Bengbu and the Agency and the contribution by Sichuan Apollo of assets consisting of land, a manufacturing plant, equipment and three patents. with a net book value of approximately $1.7 million with a fair market value of RMB 49,980,000 (approximately $7.3 million). In addition, under the terms of the agreement, responsibility for debt of Sichuan Apollo aggregating RMB 37,170,000 (approximately $5,444,500) owed to the Agency was assigned to the JV. The fair market value of the net assets contributed by Sichuan Apollo, as determined by Sichuan Apollo’s management giving consideration to the valuation services provided by an independent third party, was equal to 35% of the aggregate contribution of the three parties to the JV.
As of December 31, 2012, all parties had finished the total capital contribution of RMB142,800,000 (approximately $22.7 million) to JV per agreement. In accordance with ASC 805-40, Sichuan Apollo has reported a gain on the difference between the cost of its investment in the JV and the Company’s proportionate share of the fair value of the JV’s net equity, an amount which, if the JV were treated as a consolidated subsidiary, would have resulted in negative goodwill to be recorded as a gain. This resulted in an excess of the proportionate share of the JV’s net assets at fair market value over the cost of the assets contributed by Sichuan Apollo, which was reported as income on the Company statement of operations. The Company contributed its assets over time and recognized its proportional gain during the periods in which it contributed the assets. All gain had been recognized as of December 31, 2012.
Summarized financial information for our investment in the JV assuming a 100% ownership interest is as follows:
|
March 31,
2013
|
March 31,
2012
|
|||||||
|
Statement of operations
|
||||||||
|
Revenues
|
$ |
22,435
|
$ |
-
|
||||
|
Cost of sales
|
47,154
|
-
|
||||||
|
Gross profit
|
-
|
-
|
||||||
|
Operating Loss
|
(272,856)
|
(310,277)
|
||||||
|
Loss before income tax
|
$ |
(272,856)
|
$ |
(310,277)
|
||||
NOTE 6. ACCRUED EXPENSES, TAXES AND OTHER CURRENT LIABILITIES
Accrued expenses, taxes and other current liabilities are listed as below:
|
March 31,
2013
|
December 31,
2012
|
|||||||
|
|
|
|||||||
|
Accrued interest
|
$ | 823,048 | $ | 824,704 | ||||
|
Salaries and benefits
|
144,750 | 161,094 | ||||||
|
Other taxes
|
298,722 | 344,596 | ||||||
|
Professional fees
|
60,108 | 148,640 | ||||||
|
Accrued R&D expenses
|
625,000 | 625000 | ||||||
|
Other payables
|
562,669 | 479,834 | ||||||
|
Advance from customers
|
241,466 | 152,024 | ||||||
|
Total
|
$ | 2,755,763 | $ | 2,735,892 | ||||
7
APOLLO SOLAR ENERGY, INC.
NOTES TO CONSOLIDATED FINANCIAL STATEMENTS
FOR THE THREE MONTHS ENDED MARCH 31, 2013
(UNAUDITED)
NOTE 7. SHORT-TERM LOAN
Short-term loans consist of the following loans collateralized by assets of the Company:
|
|
March 31,
|
December 31,
|
||||||
|
2013
|
2012
|
|||||||
|
1) Loan payable to Chengdu Xihang Gang Construction & Investment Co., Ltd. due on demand, without interest collateralized by certain plant equipment of Sichuan Apollo
|
$ | 659,050 | $ | 655,441 | ||||
|
2) Loan payable to Bank of China, Xihanggang Branch, Chengdu due on August 22, 2013, with interest at 8.4% per annum, collateralized by the buildings of Sichuan Apollo. This loan was paid off in March, 2013
|
- | 730,031 | ||||||
|
3) Loan payable to Bank of China, Xihanggang Branch, Chengdu due on September 17, 2013, with interest at 7.74% per annum, collateralized by the buildings of Sichuan Apollo. This loan was paid off in March, 2013
|
- | 698,290 | ||||||
|
4) Loan payable to Industrial and Commercial Bank of China, due on November 19, 2013 and December 3, 2013, with interest of 6.6% and 6.00% per annum, respectively, collateralized by the land of Sichun Apollo and its 100% ownership of Xinlong
|
3,031,947 | 3,015,347 | ||||||
|
5) Loan payable to Bank of China, Xihanggang Branch, Chengdu, due on September 20, 2013
|
798 | 793 | ||||||
|
6)Loans payable to unrelated party, non-interest bearing and due on March 24 , 2013
|
1,436,185 | * | 1,428,323 | * | ||||
|
7) Loan payable to an unrelated party, non-interest bearing and due on April 10, 2013. This loan was fully repaid in April, 2013
|
1,436,185 | - | ||||||
|
8) Loan payable to Wuhan Economic Development Group through Industrial and Commercial Bank of China, Huangpu Breach, due on March 31,2013, with interest at 7.5% per annum, collateralized by Sichun Xinlong’s 100% ownership in Shimian
|
1,117,033 | * | 1,269,620 | * | ||||
| $ | 7,681,199 | $ | 7,797,845 | |||||
*These loans are currently in default. Management and the lender are negotiating to extend the terms of these loans, but there is no assurance that they will be extended.
NOTE 8. CONVERTIBLE LOAN
On October 31, 2012, the Company entered into a Loan Agreement with Golden Bridge Education Inc., pursuant to which the Company may borrow up to $500,000. Pursuant to the Agreement, the lender has an option to convert the loan balance into the Company’s common stock before October 31, 2013 at $2 per share. This loan has an annual interest rate of 10% and a term of 5 years. The loan is collateralized by 2% of the ownership of the Joint Venture referred to in Note 7. The Company borrowed $100,970 and $299,030 during December 2012 and January 2013, respectively.
On March 28, 2013, the Company entered into another loan Agreement with Golden Bridge Education Inc., pursuant to which the Company may borrow up to $500,000. Pursuant to the Agreement, the loan has an annual interest rate of 10% and a term of 5 years. The Company is required to pay $12,500 of interest every three month. The lender has an option to convert the loan balance into the Company’s common stock before the loan agreement has expired. This loan was subordinated to the bank loan and is a senior loan to all other liabilities.
The Company evaluated the conversion option of these loans and determined that they do not contain an embedded derivative instrument or a beneficial conversion feature.
8
APOLLO SOLAR ENERGY, INC.
NOTES TO CONSOLIDATED FINANCIAL STATEMENTS
FOR THE THREE MONTHS ENDED MARCH 31, 2013
(UNAUDITED)
NOTE 9. TAXES
Corporation income tax
The Company is incorporated in the United States of America and is subject to United States federal taxation. No provisions for income taxes have been made, as the Company had no U.S. taxable income for the three and three months ended March 31, 2013 and 2012.
The Company’s Chinese subsidiaries are governed by the Income Tax Law of the PRC concerning the privately run and foreign invested enterprises, which are generally subject to tax at a statutory rate of 25% on income reported in the statutory financial statements after appropriate tax adjustments.
Based on management's present assessment, the Company has determined that it is more likely than not a deferred tax asset attributable to the future utilization of the net operating loss carry-forward as of March 31, 2013 will not be realized. Accordingly, the Company has provided a 100% allowance against the deferred tax asset in the financial statements at March 31, 2013. The Company will continue to review this valuation allowance and make adjustments as appropriate.
The Company has net operating loss carry-forwards in China and United States of approximately $3 million and $8 million, respectively, which expire between 2012 and 2022. The Company has a deferred tax asset resulting from the tax loss carry-forwards of approximately $4 million for which the Company has provided a 100% valuation allowance.
The comparison of income tax expense at the U.S. statutory rate of 35% in 2013 and 2012, to the Company’s effective tax is as follows:
|
Three Months Ended
March 31,
|
||||||||
|
2013
|
2012
|
|||||||
|
U.S. Statutory rate of 35%
|
$ | (365,460 | ) | $ | (365,435 | ) | ||
|
Tax rate difference between China and U.S.
|
94,144 | 87,722 | ||||||
|
Change in valuation allowance
|
72,614 | 133,431 | ||||||
|
Net operating loss expired
|
198,702 | 144,282 | ||||||
|
Effective tax
|
$ | - | $ | - | ||||
Value added tax (“VAT”)
Enterprises or individuals who sell commodities, engage in repair and maintenance or import or export goods in the PRC are subject to a value added tax in accordance with the PRC laws. The value added tax standard rate is 17% of the gross sales price. A credit is available whereby VAT paid on the purchases of semi-finished products or raw materials used in the production of the Company’s finished products can be used to offset the VAT due on the sales of the finished products.
NOTE 10. PRC STATUTORY RESERVES
In accordance with the PRC Companies Law, the Company was required to transfer 10% of its profit after tax, as determined in accordance with accounting standards and regulations of the PRC, to the statutory surplus reserve. The statutory surplus reserve is non-distributable. As of March 31, 2013 and December 31, 2012, the Company did not accumulate any statutory reserve due to its accumulated deficit.
9
APOLLO SOLAR ENERGY, INC.
NOTES TO CONSOLIDATED FINANCIAL STATEMENTS
FOR THE THREE MONTHS ENDED MARCH 31, 2013
(UNAUDITED)
NOTE 11. BUSINESS SEGMENTS
For three months ended March 31, 2013,
|
Manufacturing
|
Refining
|
Mining
|
Corporate &
Others
|
Consolidated
Total
|
||||||||||||||||
|
Revenue
|
$ | 456,010 | $ | 1,100,205 | $ | - | $ | - | $ | 1,556,215 | ||||||||||
|
Operating loss
|
$ | (271,661 | ) | $ | (403,552 | ) | $ | (64,360 | ) | $ | (102,569 | ) | $ | (842,142 | ) | |||||
|
Depreciation and amortization
|
$ | 174,647 | $ | 51,590 | $ | 7,912 | $ | - | $ | 234,149 | ||||||||||
|
Capital expenditures
|
$ | 1,141 | $ | - | $ | - | $ | - | $ | 1,141 | ||||||||||
For the three months ended March 31, 2012,
|
Manufacturing
|
Refining
|
Mining
|
Corporate &
Others
|
Consolidated
Total
|
||||||||||||||||
|
Revenue
|
$ | 155,671 | $ | 1,716,363 | $ | - | $ | - | $ | 1,872,034 | ||||||||||
|
Operating loss
|
$ | (416,797 | ) | $ | (17,614 | ) | $ | (57,626 | ) | $ | (304,570 | ) | $ | (796,607 | ) | |||||
|
Depreciation and amortization
|
$ | 159,989 | $ | 70,367 | $ | 8,175 | $ | - | $ | 238,531 | ||||||||||
|
Capital expenditures
|
$ | 1,507 | $ | 10,328 | $ | 1,664 | $ | - | $ | 13,499 | ||||||||||
NOTE 12. CONCENTRATIONS
For the three months ended March 31, 2013, two major customers accounted for approximately 22% and 13% of total sales, respectively. As of March 31, 2013, three customers accounted for 37%, 14% and 14% of total accounts receivable, respectively.
For the three months ended March 31, 2012, three major customers accounted for approximately 21%, 14% and 7% of total sales, respectively. At March 31, 2012, two customers accounted for 50 % and 20% of total accounts receivable, respectively.
The Company has reviewed its subsequent events through the date these financial statements were issued and has determined that no additional material subsequent events have occurred through such date.
10
ITEM 2. MANAGEMENT’S DISCUSSION AND ANALYSIS OF FINANCIAL CONDITION AND RESULTS OF OPERATIONS
The following discussion contains forward-looking statements that involve risks and uncertainties. Forward-looking statements include, but are not limited to, statements regarding future events, our plans and expectations and financial projections. Our actual results could differ materially from those discussed herein. Factors that could cause or contribute to such differences include, but are not limited to, those discussed elsewhere in this Form 10-Q and in our Annual Report on Form 10-K filed on May 10, 2013. Unless the context otherwise requires, the terms “we,” the “Company,” “us,” or “Apollo” refers to Apollo Solar Energy, Inc. and our wholly-owned subsidiaries and variable interest entities.
Overview
We are a China-based vertically integrated refiner of tellurium, or Te, and high-purity tellurium-based metals for specific segments of the electronic materials market. Our main expertise is in the production of Te-based compounds used to produce thin-film solar cells, cell modules and solar electronic products. While no reserves under the SEC’s Industry Guide 7 can currently be delineated at our properties, we believe that the tellurium to be used in our products in the future will be primarily sourced from our Dashuigou project located in Sichuan Province, PRC. In addition, we expect to source tellurium from another property in Shimian, Majiagou, PRC, through variable interest entity agreements, or the VIE Agreements, executed in April, 2009, with Sichuan Xinju Mineral Resources Development Corporation and certain of its shareholders holding 51.6619% of its voting stock, which shareholders are our direct or indirect employees. Under the terms of the VIE Agreements, we have been granted the exclusive exploration and mining rights to these two projects in accordance with a license granted by the Chinese government, which extends through January 2014 for exploration and mining activities at our Dashuigou property, and through May 2013 for mining activities at our Majiagou property, subject to potential renewal thereafter.
Currently, tellurium is produced as a by-product in the process of processing copper and other metals. As a result, costs are high. We believe that the Dashuigou and Majiagou projects are the only two known deposits in the world in which tellurium, one of the rarest metallic elements on earth, is the primary commodity of economic interest. By the end of 2014, we plan to obtain approximately 50% to 60% of the tellurium necessary for our products from the Dashuigou and Majiagou projects and believe this ability to be a significant competitive advantage because the cost of tellurium sourced from our own properties will be substantially lower than that purchased from an outside third party. We will source the remaining 40% to 50% of our tellurium needs from third-party suppliers with whom we have established good business relationships over the past few years. By vertically integrating our processes, we believe we are able to achieve significant operating efficiencies and produce high-quality products that offer cost and quality benefits to our customers.
Our refining operations are currently based in a 330,000 square foot facility in Chengdu, Sichuan Province, PRC. We expect this facility to eventually have the capacity to produce more than 300 tons of high-purity photovoltaic cell materials and 42 other types of electronic materials. Future expansion of this facility in vacant land leased to the Company will have a capacity to produce up to an additional 350 tons of high-purity photovoltaic cell materials.
We are currently in the exploration stage of operations in accordance with the requirements of SEC Industry Guide 7. However, we believe we are unique in that we expect to both mine and refine our tellurium-based products, with primary refining capabilities as provided by Sichuan Xinju Mineral Resources Development Corporation pursuant to the VIE Agreements, and secondary refining capabilities directly through our Company. Our primary refining capabilities are such that we can treat metal concentrates (containing, for example, as little as 50% of the metals of interest), and extract and refine the metals of interest so that they can be fed to our secondary refining operations, where we attain a higher level of purity. Because we expect to mine the raw material in the future, and perform both refining functions, both directly and through our VIE Arrangement, we consider ourselves a supplier that will in the future have uniquely integrated capabilities. Our end-products are tellurium, cadmium, zinc and related compounds of 99.999% (five nines, or 5N) purity or above. Our products are critical precursors in a number of electronic applications, including the rapidly-expanding thin-film photovoltaic, or PV, market.
11
Thin film technologies, because of their relatively low usage of raw materials when compared with traditional silicon-based photovoltaic technologies, offer a potential cost advantage in the marketplace. Accordingly, we believe these technologies are beginning to gain an ever increasing foothold in the market.
Our Variable Interest Entity Agreements
As illustrated in the diagram below, we entered into various exclusive contractual arrangements on April 10, 2009 with Sichuan Xinju Mineral Resources Development Corporation, or the VIE, and certain of its shareholders who are our direct or indirect employees and who collectively own 51.6619% of the VIE. Among other things, these VIE Agreements granted to our wholly-owned subsidiary a first option to purchase the exploration rights related to the Dashuigou area property and the mining rights related to that certain tellurium and bismuth property in Shimian Majiagou, which rights we collectively referred to as the Exploration Business. Additionally, the VIE and certain of its shareholders who collectively own 51.6619% of the VIE granted to our wholly-owned subsidiary an exclusive right to purchase all of the products produced from the Exploration Business for a specified period of time. As a result, we consolidate the financial results of the VIE related to the Exploration Business pursuant to FASB ASC 810-10, “Consolidation.”
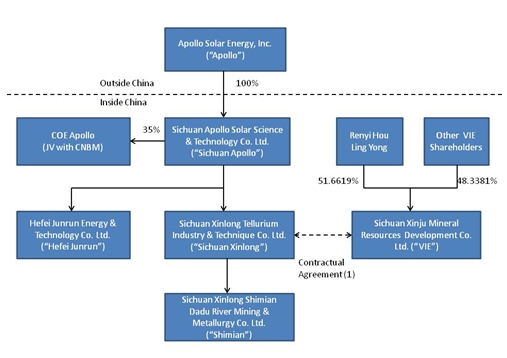
(1) Agreements that provide us with effective control over Sichuan Xinju Mineral Resources Development Co. Ltd., or the VIE, include a purchase option agreement, a business operations agreement and an exclusive technical and consulting agreement.
12
The agreements between the VIE and our other affiliated entities or persons are summarized below:
|
·
|
First Option Exclusive Acquiring Agreement among Sichuan Xinlong Tellurium Industry & Technique Co., Ltd., Sichuan Xinju Mineral Resources Development Co., Ltd., Renyi Hou and Ling Yong, which grants to our wholly-owned subsidiary a first option to purchase the Mining Business at such time as the purchase becomes advisable, permissible and in our best interest.
|
|
·
|
Exclusive Sales Agreement between Sichuan Xinlong Tellurium Industry & Technique Co., Ltd. and Sichuan Xinju Mineral Resources Development Co., Ltd., which grant to our wholly-owned subsidiary the exclusive right to buy all of the output of the Mining Business.
|
|
·
|
Business Operation Agreement among Sichuan Xinlong Tellurium Industry & Technique Co., Ltd., Sichuan Xinju Mineral Resources Development Co., Ltd., Renyi Hou and Ling Yong, which imposes certain restrictions and obligations on the VIE and certain of its shareholders to support the VIE arrangement, including refraining from competing with our business and modifying the business operations of the VIE without the prior consent of our wholly-owned subsidiary.
|
|
·
|
Exclusive Technical and Consulting Agreement between Sichuan Xinlong Tellurium Industry & Technique Co., Ltd. and Sichuan Xinju Mineral Resources Development Co., Ltd., which requires the VIE to provide certain technical and consulting services exclusively to our wholly-owned subsidiary in connection with the Mining Business. Our wholly-owned subsidiary agrees to provide up to $6.0 million in investing funding to the VIE in connection with its operation of the Mining Business, on such terms as the parties shall agree from time to time.
|
Results of Operations
Sales
Sales for the three months ended March 31, 2013 were $1,556,215, compared to the sales of $1,872,034 in the same period in 2012, a decrease of $315,819 or approximately 16.8%. The primary reasons for the reduction in sales were:
|
·
|
Decrease in the selling price of Tellurium to $159 this year from $319 the first quarter of last year;
|
|
·
|
The sales during three months ended March 31, 2012 including $318,629 sales of Infrared Image; we recorded no sale of Infrared Image in the three months ended March 31, 2013.
|
Gross profit
Our cost of sales for the three months ended March 31, 2013 was 1,419,509, compared to the cost of sales of $1,768,154 in the same period in 2012, a decrease of 348,645 or approximately 19.7%. Our gross margin in each of the quarters was less than 9%. The primary reason for the this low level of gross margin was the delay in production from our tellurium mines, caused by new government regulations. Without an internal source of tellurium, we were forced to purchase tellurium on the world market. As a significant amount of our revenue was generated from the sale of compounds incorporating high purity tellurium, our margin was impacted adversely. We expect this situation to improve as we have satisfied the new government regulations and expect internal tellurium production to be initiated in the next year.
Selling expense
For the three months ended March 31, 2013, selling expenses were $64,548 compared to $56,898 for the three months ended March 31, 2012, representing an increase of 13.5%. This increase occurred because the Company carried out more promotions in the first quarter of 2013 than in the same period of last year.
13
General and administrative expenses
We incurred general and administrative expenses of $619,048 for the three months ended March 31, 2013, compared to $688,019 in the same period of 2011, representing a decrease of 10%.
The principal reason for the improvement was the decrease in stock-based compensation costs from $143,618 in three months ended March 31, 2012 to $70,608 in the three months ended March 31, 2013. Certain members of senior management left the company late in 2012, resulting in expiration of their stock options.
Research and development expenses
For the three months ended March 31, 2013, we incurred research and development expenses of $295,252, compared to $155,570 for the three months ended March 31, 2012. This represents an increase of 90%. Research and development expenses increased because the Company was able to invest a portion of the proceeds from its sale of convertible debt into the development of new products and production processes.
Other income (expense)
Other income (expense) consisted of loss in equity in Joint Venture and interest expenses.
We hold a 35% interest in COE Apollo, a joint venture. We record our share of the COE Apollo’s profits and losses on the equity basis. We recorded a loss of $95,500 and $108,597 on our investment in COE Apollo for the three months ended March 31, 2013 and 2012, respectively.
For the three months ended March 31, 2013 and 2012, we incurred interest expenses of $106,529 and $138,896 respectively, representing a decrease of 23.3%. The decrease occurred primarily because we replaced interest-bearing debt with short-term loans from an unrelated party that bear no interest.
Net income/loss
We recorded a net loss of $1,044,171 and $1,044,100 for the three months ended March 31, 2013 and 2012. Our expectation is that we will continued to incur losses until we are able to source most of our Tellurium from our own mines.
We have historically funded our operation primarily through paid-in capital, sales of goods, loan from stockholders and short term loans from financial institutions in China. Based on our current cash level and management’s forecast of operating cash flows, management has determined that the Company will require additional funds, either debt or equity, to finance our planned operations for the next twelve months.
The Following table summarizes our liquidity and capital resources on the dates presented
|
March 31,
2013
|
December 31,
2012
|
|||||||
|
Cash
|
$ | 892,740 | $ | 940,225 | ||||
|
Working capital(deficit)
|
(7,896,851 | ) | (7,497,221 | ) | ||||
|
Stockholders' Equity
|
13,849,204 | 14,736,634 | ||||||
14
The Company had a working capital deficit of $7,896,851 at March 31, 2013. This represented an atrophy of $399,630 since December 31, 2012. The primary reason for the atrophy of working capital was the $1,044,171 loss that we incurred during three months ended March 31, 2013, which we funded by taking short-term loans.
The following table describes our contractual commitments and obligations as of March 31, 2013:
|
Payments due by Period (in $)
|
||||||||||||||||||||
|
Contractual Obligations
|
Total
|
Less Than 1 Year
|
1 - 3 Years
|
3 - 5 Years
|
More Than 5 Years
|
|||||||||||||||
|
Short term loans
|
$ | 7,681,199 | $ | 7,681,199 | $ | -- | $ | -- | $ | -- | ||||||||||
|
Convertible loan
|
400,000 | -- | -- | 400,000 | -- | |||||||||||||||
|
Loans from shareholder and related party
|
453,104 | 453,104 | -- | -- | -- | |||||||||||||||
|
Total
|
$ | 8,534,303 | $ | 8,134,303 | $ | -- | $ | 400,000 | $ | -- | ||||||||||
Given that the Company’s debt obligations in the next twelve months equal 161% of its current assets at March 31, 2013, management has determined that additional funds will have to be secured in order to finance our operations for the coming year.
Cash flows
The following table shows the movements of our cash for the periods presented
|
Three Months Ended
March 31,
|
||||||||
|
2013
|
2012
|
|||||||
|
Net cash used in operating activities
|
$ | (252,290 | ) | $ | (1,892,724 | ) | ||
|
Net cash used in investing activities
|
(1,141 | ) | (13,499 | ) | ||||
|
Net cash provided by financing activities
|
235,707 | 2,864,464 | ||||||
|
Effect of exchange rate changes on cash
|
(29,761 | ) | 2,032 | |||||
|
Net increase (decrease) in cash
|
(47,485 | ) | 960,273 | |||||
|
Cash at beginning of period
|
940,225 | 363,771 | ||||||
|
Cash at end of period
|
$ | 892,740 | $ | 1,324,044 | ||||
Net cash used in operating activities.
Our operating activities during the three months ended March 31, 2013 used $252,290 in cash. The cash impact of our net loss of $1,044,171 was partially offset by a reduction in our inventory and a sizeable increase in accounts payable-trade.
By comparison, our operations in the first quarter of 2012 used $1,892,724 in cash. The use of cash exceeded our net loss of $1,044,100 primarily because we used $1,297,217 for prepaid expenses and other current assets. In addition, we reduced our accrued expenses and other current liabilities by $315,157.
Net cash used in investing activities.
Due to our lack of funds, we have made only very modest additions to our capital assets during recent years. Net cash used in investing activities for the three months ended March 31, 2013 and 2012 was $1,141 and $13,499, which resulted from the purchase of property and equipment.
15
Net cash /provided by financing activities.
Net cash provided by financing activities for the three months ended March 31, 2013 was $235,707. This was primarily attributable to $299,030 in proceeds from the convertible debt we issued as well as $78,663 that stockholders repaid to us.
We funded our 2012 operations by taking short-term loans totaling $2,852,495 in the first quarter of 2012.
Off-Balance Sheet Transactions
We have no material off-balance sheet transactions.
ITEM 3. QUANTITATIVE AND QUALITATIVE DISCLOSURES ABOUT MARKET RISK
Not Applicable.
ITEM 4. CONTROLS AND PROCEDURES
(a) Evaluation of Disclosure Controls and Procedures
Under the supervision and with the participation of our management, including our Chief Executive Officer and Chief Financial Officer, we evaluated the effectiveness of the design and operation of our disclosure controls and procedures pursuant to Rule 13a-15 under the Securities Exchange Act of 1934, as amended, or the Exchange Act, as of the end of the period covered by this report. That evaluation disclosed that the Company has material defects in its disclosure controls and procedures. Specifically management determined that there is a lack of expertise in U.S. GAAP among the Company’s management personnel. They also determined that the size of the Company’s accounting staff and low number of supervisory personnel prevented an appropriate segregation of accounting functions. Based on that evaluation, the Company’s Chief Executive Officer and Chief Financial Officer have concluded that our disclosure controls and procedures were not effective as of March 31, 2013.
(b) Changes in Internal Controls
There were no changes in our internal control over financial reporting during the three months ended March 31, 2013 that have materially affected, or are reasonably likely to materially affect our internal control over financial reporting.
PART II. OTHER INFORMATION
None.
16
ITEM 1A. RISK FACTORS
In addition to other information set forth in this report, you should carefully consider the “Risk Factors” discussed in our Annual Report on Form 10-K filed on May 10, 2013, for our 2012 fiscal year. There have been no material changes to the “Risk Factors” previously disclosed in our Annual Report on Form 10-K.
|
31.1
|
Rule 13a-14(a) Certification – CEO
|
|
31.2
|
Rule 13a-14(a) Certification – CFO
|
|
32
|
Rule 13a-14(b) Certification
|
|
101 INS
|
XBRL Instance Document*
|
|
101 SCH
|
XBRL Schema Document*
|
|
101 CAL
|
XBRL Calculation Linkbase Document*
|
|
101 DEF
|
XBRL Definition Linkbase Document*
|
|
101 LAB
|
XBRL Labels Linkbase Document*
|
|
101 PRE
|
XBRL Presentation Linkbase Document*
|
* The XBRL related information in Exhibit 101 shall not be deemed “filed” for purposes of Section 18 of the Securities Exchange Act of 1934, as amended, or otherwise subject to liability of that section and shall not be incorporated by reference into any filing or other document pursuant to the Securities Act of 1933, as amended, except as shall be expressly set forth by specific reference in such filing or document.
In accordance with the requirements of the Exchange Act, the registrant has duly caused this report to be signed on its behalf by the undersigned, thereunto duly authorized.
|
Apollo Solar Energy, Inc.
|
|
|
Date: May 20, 2013
|
By: /s/ Jingong Pan |
| Jingong Pan | |
| Chief Executive Officer | |
|
Date: May 20, 2013
|
By: /s/ Hui Hua |
| Hui Hua | |
| Chief Financial Officer |
17