Attached files
| file | filename |
|---|---|
| 8-K - 8-K - SEARS HOMETOWN & OUTLET STORES, INC. | sho-8kx5142013.htm |
Annual Meeting of Stockholders May 14, 2013 Bruce Johnson – CEO and President
2 Who is SHO ?
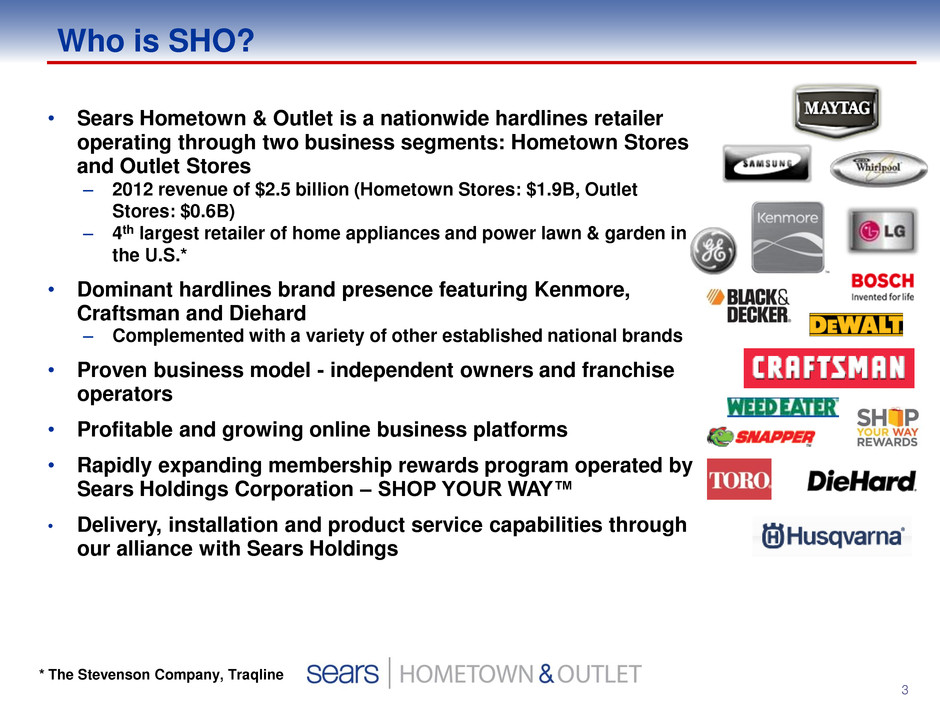
3 • Sears Hometown & Outlet is a nationwide hardlines retailer operating through two business segments: Hometown Stores and Outlet Stores – 2012 revenue of $2.5 billion (Hometown Stores: $1.9B, Outlet Stores: $0.6B) – 4th largest retailer of home appliances and power lawn & garden in the U.S.* • Dominant hardlines brand presence featuring Kenmore, Craftsman and Diehard – Complemented with a variety of other established national brands • Proven business model - independent owners and franchise operators • Profitable and growing online business platforms • Rapidly expanding membership rewards program operated by Sears Holdings Corporation – SHOP YOUR WAY™ • Delivery, installation and product service capabilities through our alliance with Sears Holdings Who is SHO? * The Stevenson Company, Traqline
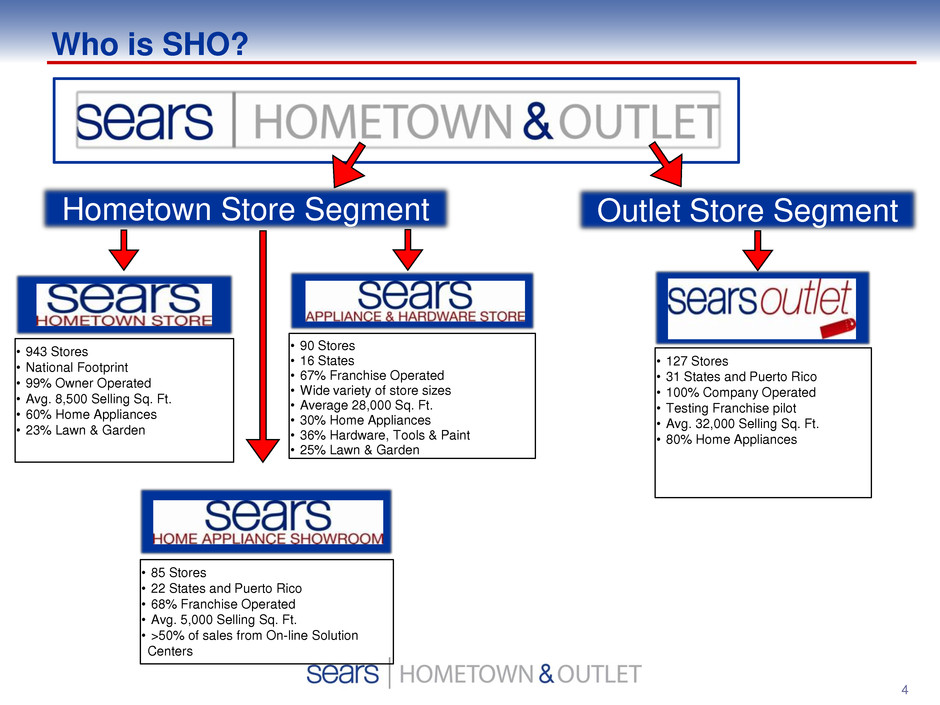
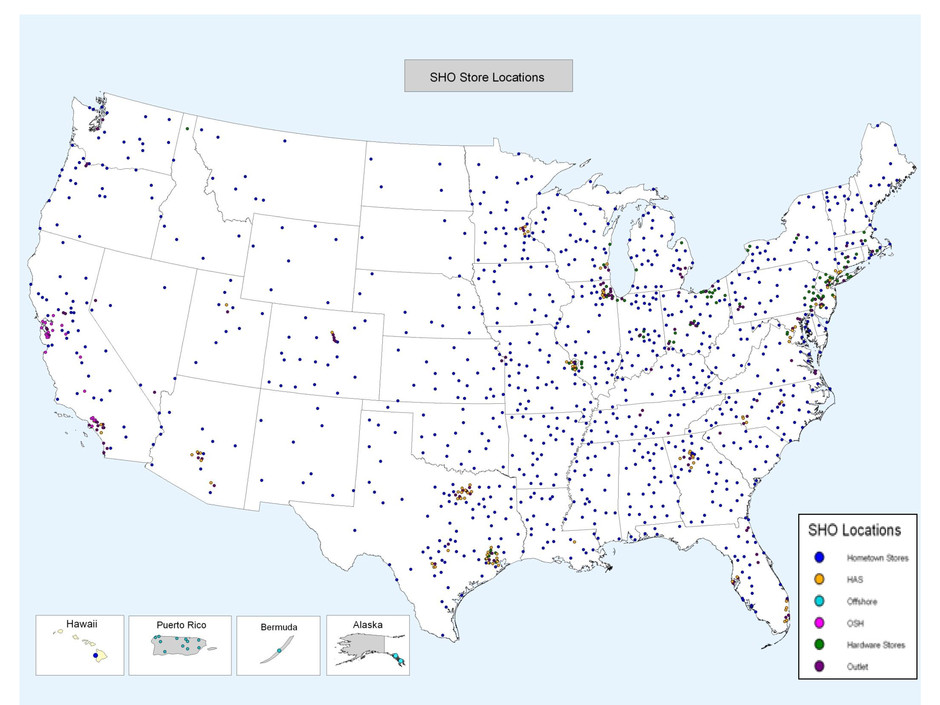
4 Who is SHO? Hometown Store Segment • 90 Stores • 16 States • 67% Franchise Operated • Wide variety of store sizes • Average 28,000 Sq. Ft. • 30% Home Appliances • 36% Hardware, Tools & Paint • 25% Lawn & Garden • 85 Stores • 22 States and Puerto Rico • 68% Franchise Operated • Avg. 5,000 Selling Sq. Ft. • >50% of sales from On-line Solution Centers • 943 Stores • National Footprint • 99% Owner Operated • Avg. 8,500 Selling Sq. Ft. • 60% Home Appliances • 23% Lawn & Garden Outlet Store Segment • 127 Stores • 31 States and Puerto Rico • 100% Company Operated • Testing Franchise pilot • Avg. 32,000 Selling Sq. Ft. • 80% Home Appliances
6 2012 Financial Summary 2012 - A Year of Transition: October 11: • SHO became a public company At Separation: • Sears/SHO made several one-time operational/accounting adjustments that affected 2012 financial results (e.g. - treatment of KCD product warranty) Post Separation: • SHO began incurring ongoing costs associated with operating as a public company – Management, Board, Auditors, etc. – Costs for services previously provided by Sears at no cost (e.g. - online sales commission) There were also several non-recurring events in 2012
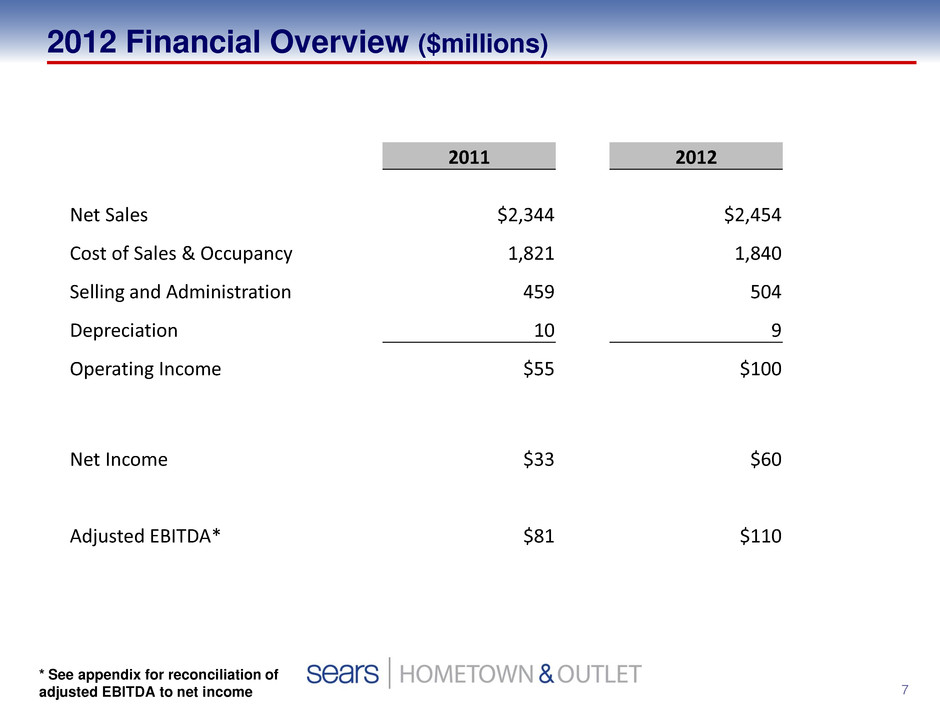
7 2012 Financial Overview ($millions) 2011 2012 Net Sales $2,344 $2,454 Cost of Sales & Occupancy 1,821 1,840 Selling and Administration 459 504 Depreciation 10 9 Operating Income $55 $100 Net Income $33 $60 Adjusted EBITDA* $81 $110 * See appendix for reconciliation of adjusted EBITDA to net income
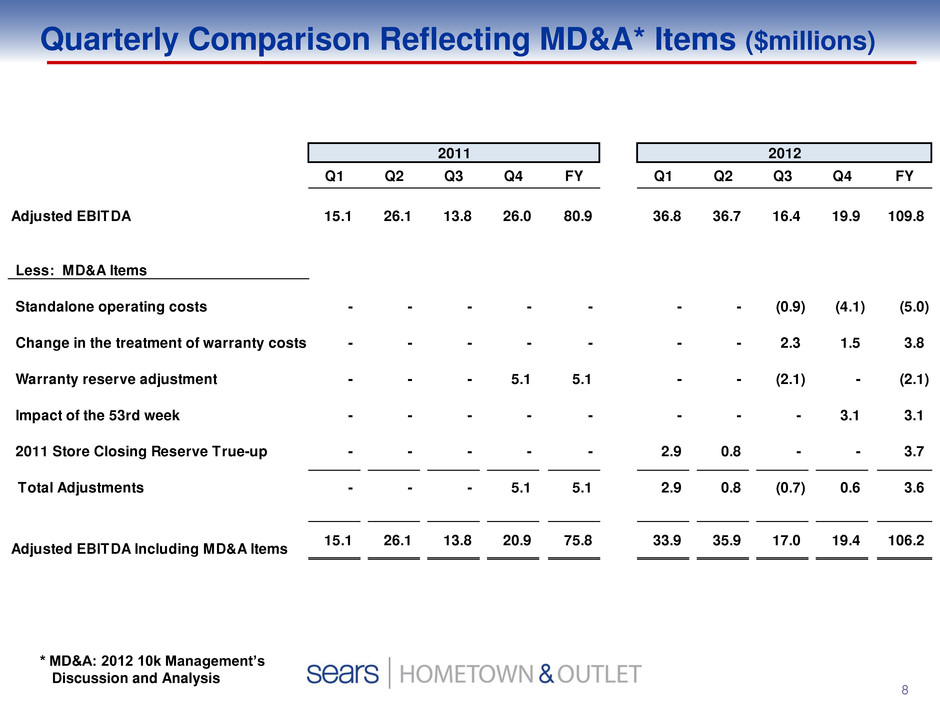
8 Quarterly Comparison Reflecting MD&A* Items ($millions) Q1 Q2 Q3 Q4 FY Q1 Q2 Q3 Q4 FY Adjusted EBITDA 15.1 26.1 13.8 26.0 80.9 36.8 36.7 16.4 19.9 109.8 Less: MD&A Items Standalone operating costs - - - - - - - (0.9) (4.1) (5.0) Change in the treatment of warranty costs - - - - - - - 2.3 1.5 3.8 Warranty reserve adjustment - - - 5.1 5.1 - - (2.1) - (2.1) Impact of the 53rd week - - - - - - - - 3.1 3.1 2011 Store Closing Reserve True-up - - - - - 2.9 0.8 - - 3.7 Total djustments - - - 5.1 5.1 2.9 0.8 (0.7) 0.6 3.6 Adjusted EBITDA Including MD&A Items 15.1 26.1 13.8 20.9 75.8 33.9 35.9 17.0 19.4 106.2 2011 2012 * MD&A: 2012 10k Management’s Discussion and Analysis
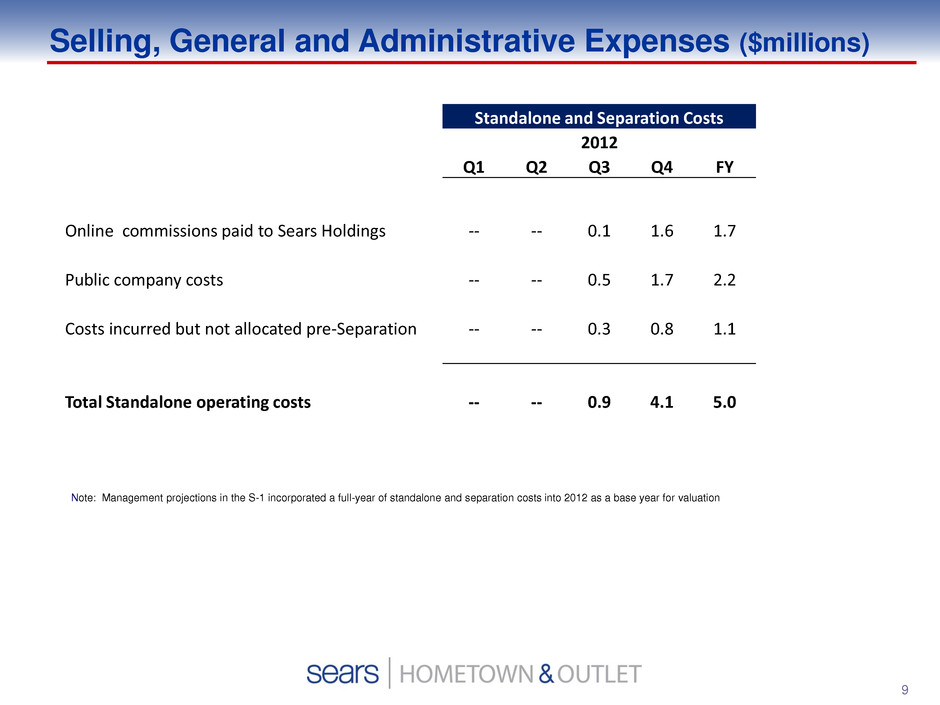
9 Selling, General and Administrative Expenses ($millions) Note: Management projections in the S-1 incorporated a full-year of standalone and separation costs into 2012 as a base year for valuation Standalone and Separation Costs 2012 Q1 Q2 Q3 Q4 FY Online commissions paid to Sears Holdings -- -- 0.1 1.6 1.7 Public company costs -- -- 0.5 1.7 2.2 Costs incurred but not allocated pre-Separation -- -- 0.3 0.8 1.1 Total Standalone operating costs -- -- 0.9 4.1 5.0
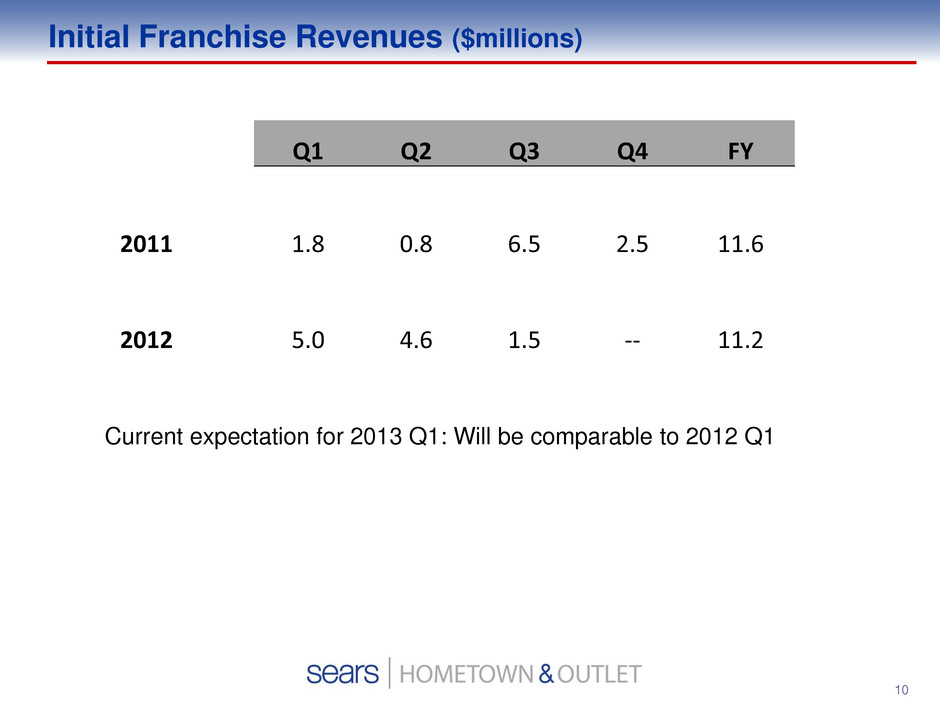
10 Initial Franchise Revenues ($millions) Q1 Q2 Q3 Q4 FY 2011 1.8 0.8 6.5 2.5 11.6 2012 5.0 4.6 1.5 -- 11.2 Current expectation for 2013 Q1: Will be comparable to 2012 Q1
Our Strategy
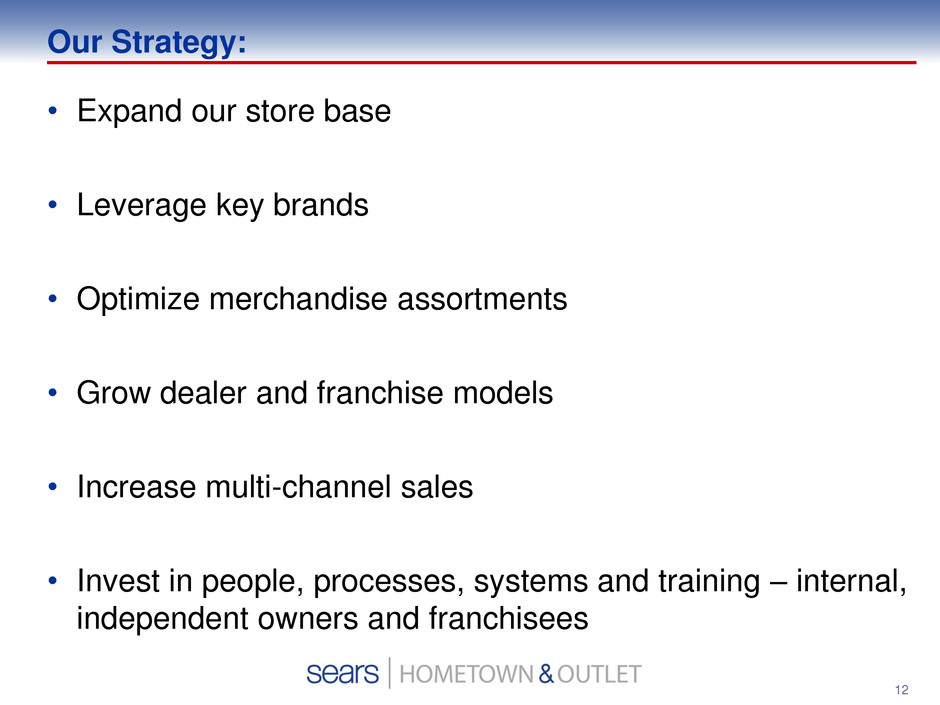
12 Our Strategy: • Expand our store base • Leverage key brands • Optimize merchandise assortments • Grow dealer and franchise models • Increase multi-channel sales • Invest in people, processes, systems and training – internal, independent owners and franchisees
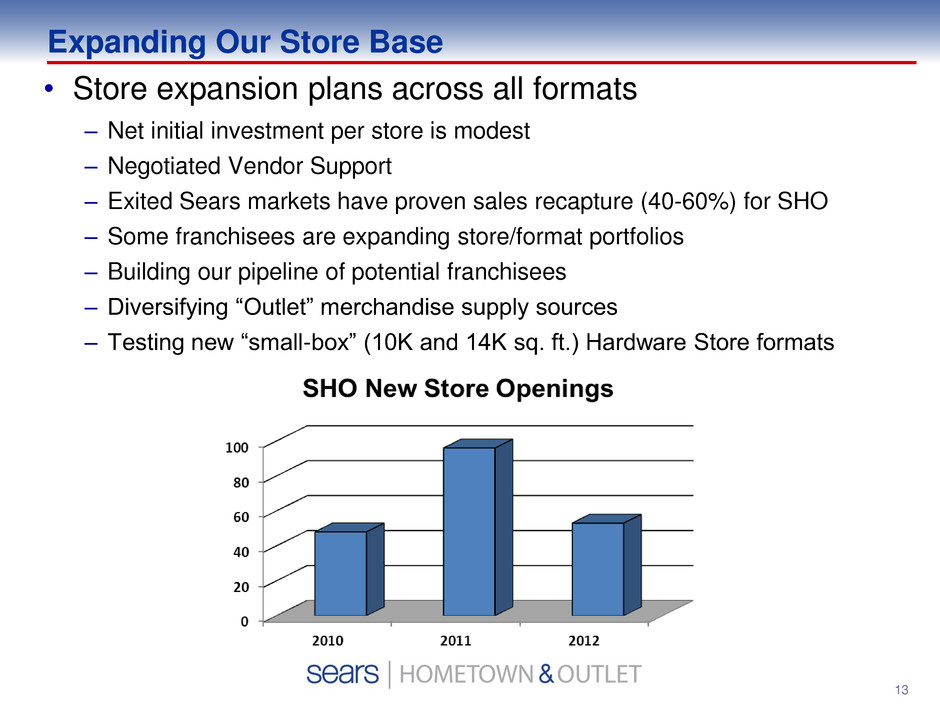
13 Expanding Our Store Base • Store expansion plans across all formats – Net initial investment per store is modest – Negotiated Vendor Support – Exited Sears markets have proven sales recapture (40-60%) for SHO – Some franchisees are expanding store/format portfolios – Building our pipeline of potential franchisees – Diversifying “Outlet” merchandise supply sources – Testing new “small-box” (10K and 14K sq. ft.) Hardware Store formats
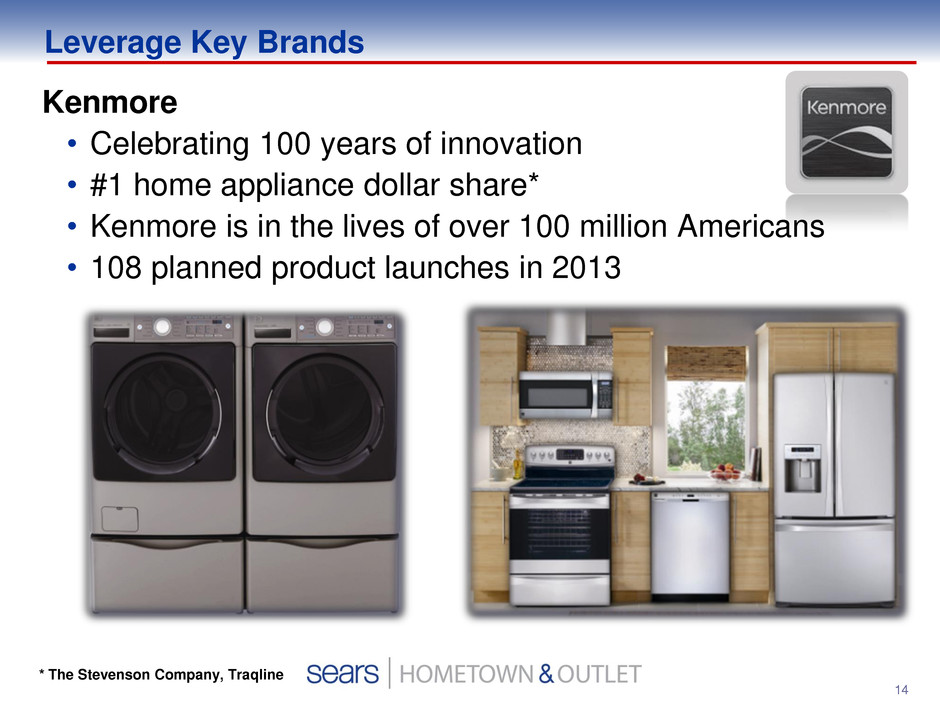
14 Kenmore • Celebrating 100 years of innovation • #1 home appliance dollar share* • Kenmore is in the lives of over 100 million Americans • 108 planned product launches in 2013 Leverage Key Brands * The Stevenson Company, Traqline
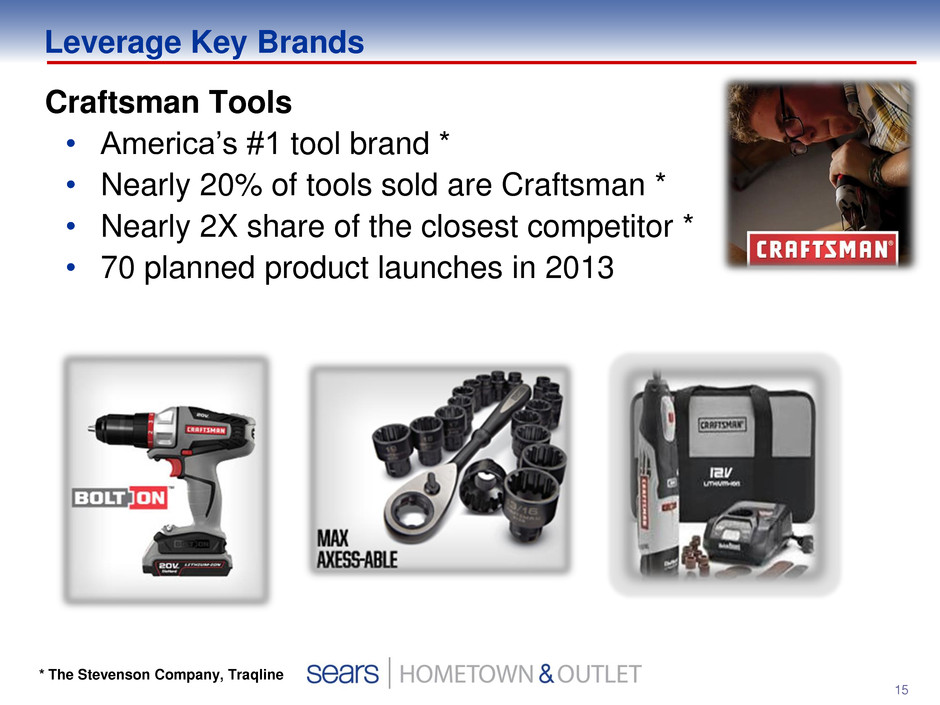
15 Craftsman Tools • America’s #1 tool brand * • Nearly 20% of tools sold are Craftsman * • Nearly 2X share of the closest competitor * • 70 planned product launches in 2013 Leverage Key Brands * The Stevenson Company, Traqline
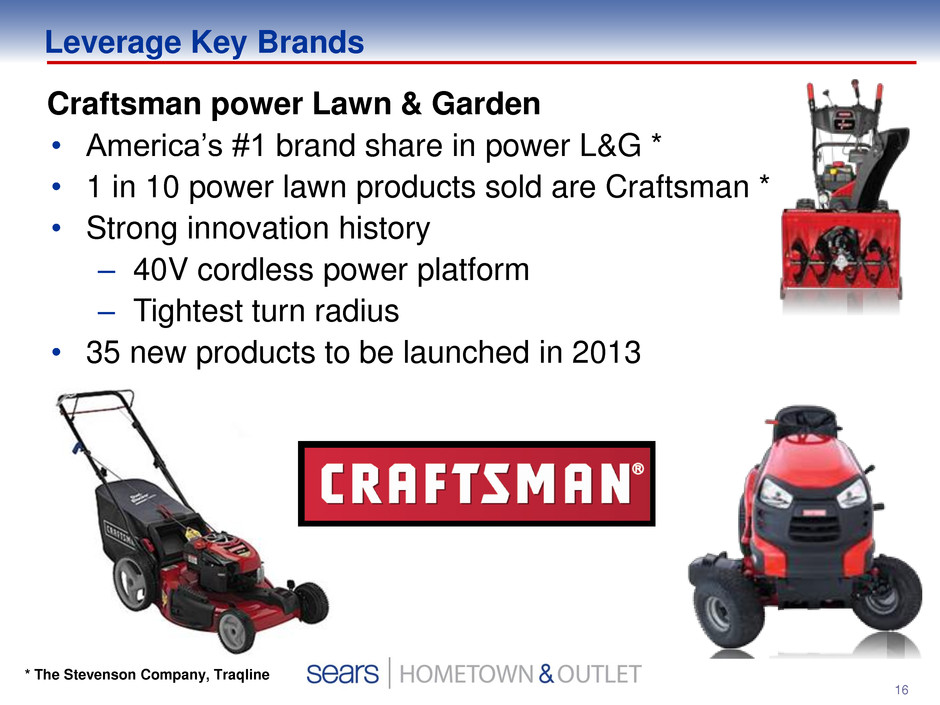
16 Craftsman power Lawn & Garden • America’s #1 brand share in power L&G * • 1 in 10 power lawn products sold are Craftsman * • Strong innovation history – 40V cordless power platform – Tightest turn radius • 35 new products to be launched in 2013 Leverage Key Brands * The Stevenson Company, Traqline
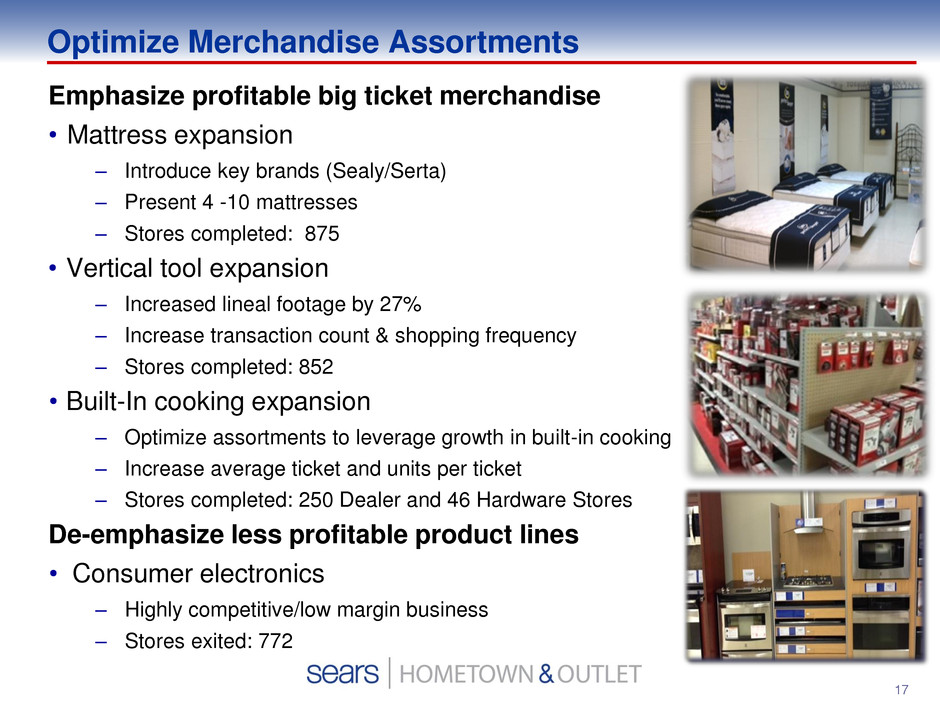
17 Optimize Merchandise Assortments Emphasize profitable big ticket merchandise • Mattress expansion – Introduce key brands (Sealy/Serta) – Present 4 -10 mattresses – Stores completed: 875 • Vertical tool expansion – Increased lineal footage by 27% – Increase transaction count & shopping frequency – Stores completed: 852 • Built-In cooking expansion – Optimize assortments to leverage growth in built-in cooking – Increase average ticket and units per ticket – Stores completed: 250 Dealer and 46 Hardware Stores De-emphasize less profitable product lines • Consumer electronics – Highly competitive/low margin business – Stores exited: 772
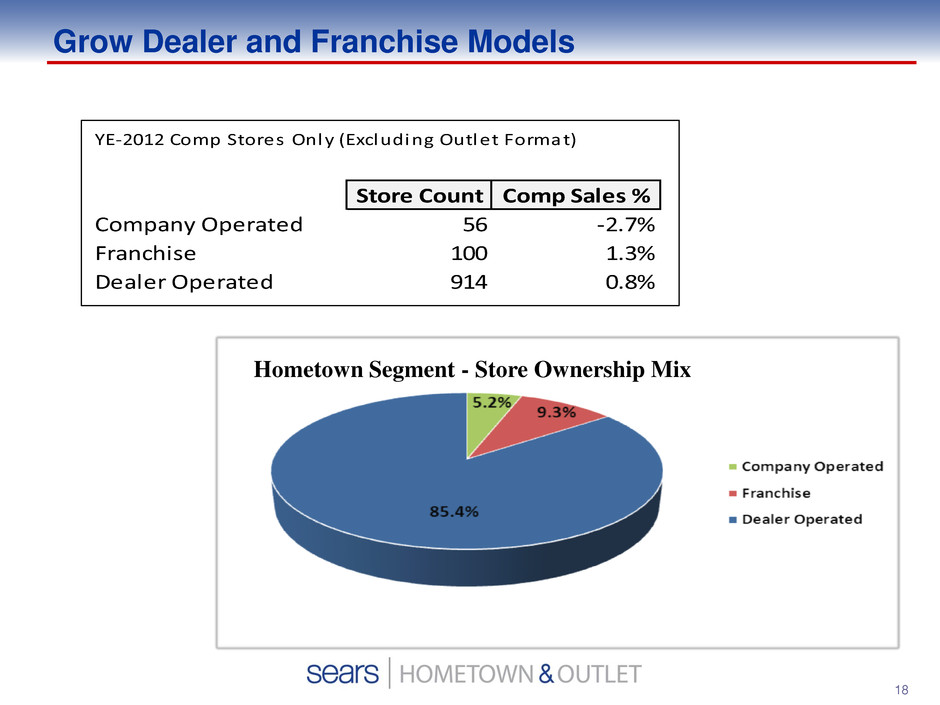
18 Grow Dealer and Franchise Models Hometown Segment - Store Ownership Mix YE-2012 Comp Stores Only (Excluding Outlet Format) Store Count Comp Sales % Company Operated 56 -2.7% Franchise 100 1.3% Dealer Operated 914 0.8%
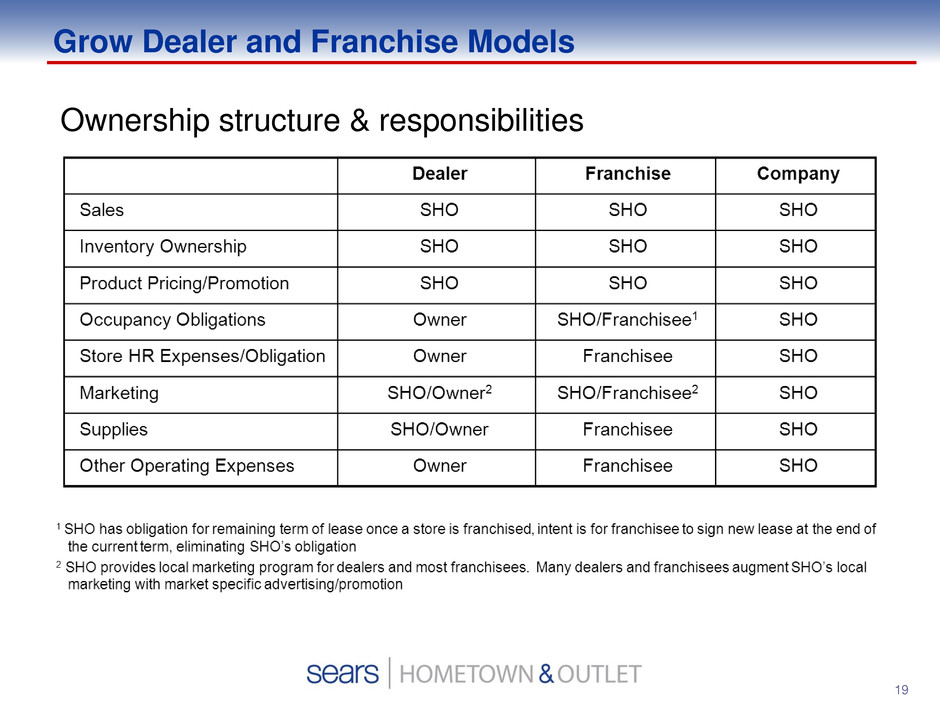
19 Grow Dealer and Franchise Models Ownership structure & responsibilities
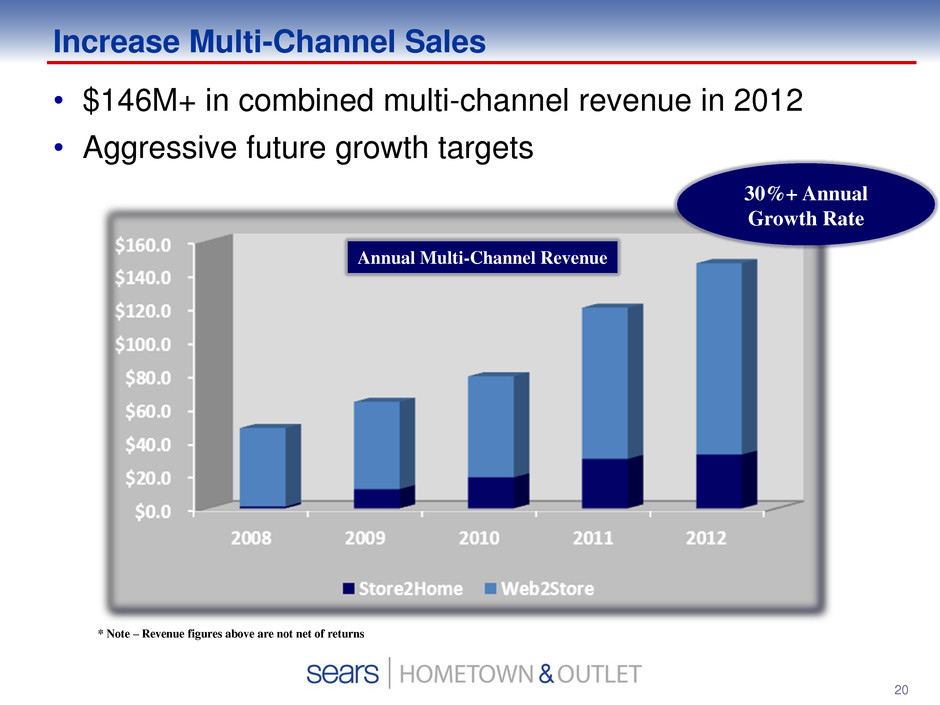
20 • $146M+ in combined multi-channel revenue in 2012 • Aggressive future growth targets Increase Multi-Channel Sales * Note – Revenue figures above are not net of returns 30%+ Annual Growth Rate Annual Multi-Channel Revenue
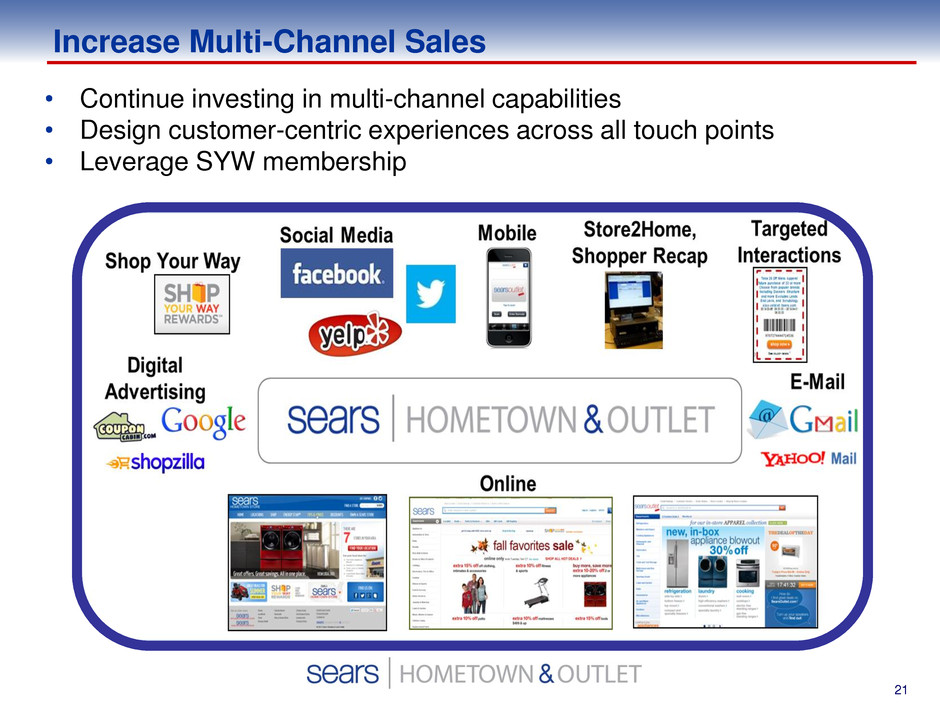
21 Increase Multi-Channel Sales • Continue investing in multi-channel capabilities • Design customer-centric experiences across all touch points • Leverage SYW membership
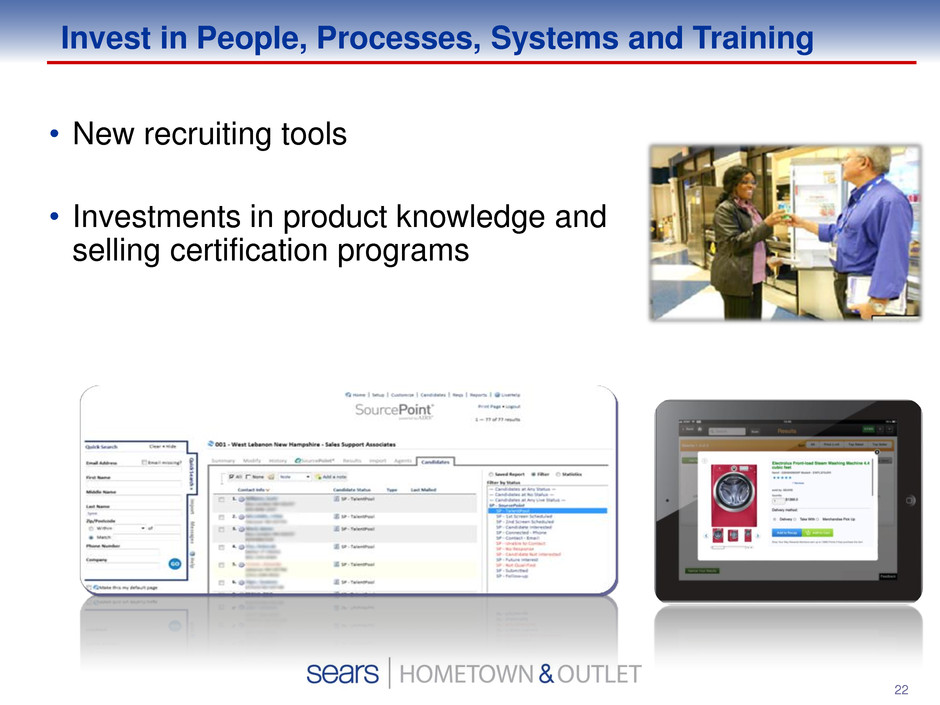
22 Invest in People, Processes, Systems and Training • New recruiting tools • Investments in product knowledge and selling certification programs
23 In Summary, we are…. • Creating points of differentiation, leveraging innovation, embracing change and executing our core strategy – Recognized and trusted brand name Local market “hometown” retail appeal – Best in-class product offerings Proprietary brands (Kenmore/Craftsman) Established national brands – Nationwide delivery, installation and product service capabilities – Dealer/Franchise operating models – Store expansion plans – Best in-class member program – Advanced multi-channel retail capabilities Store2Home, Web2Store, local Facebook pages Established digital/social marketing platforms
24 Forward-Looking Statements Certain statements made in this presentation contain forward-looking statements. Forward-looking statements are subject to risks and uncertainties that may cause our actual results, performance or achievements to be materially different from any future results, performance or achievements expressed or implied by these forward-looking statements. Forward-looking statements include without limitation information concerning our future financial performance, business strategy, plans, goals and objectives. Statements preceded or followed by, or that otherwise include, the words “believes,” “expects,” “anticipates,” “intends,” “project,” “estimates,” “plans,” “forecast,” “is likely to” and similar expressions or future or conditional verbs such as “will,” “may,” “would,” “should” and “could” are generally forward-looking in nature and not historical facts. Such statements are based upon the current beliefs and expectations of our management and are subject to significant risks and uncertainties. Actual results may differ materially from those set forth in the forward-looking statements. The following factors, among others, could cause our actual results, performance, and achievements to differ from those described in the forward-looking statements: our continued reliance on Sears Holdings Corporation (“Sears Holdings”) for most products and services that are important to the successful operation of our business; our potential need to depend on Sears Holdings beyond the expiration or earlier termination by Sears Holdings of certain of our agreements with Sears Holdings; the willingness and ability of Sears Holdings to meet their contractual obligations to us; our ability to offer merchandise and services that our customers want, including those under the Kenmore, Craftsman, and DieHard brands (which brands are owned by subsidiaries of Sears Holdings); the sale by Sears Holdings and its subsidiaries to other retailers that compete with us of major home appliances and other products branded with the Kenmore, Craftsman, or DieHard brands; our ability to successfully manage our inventory levels and implement initiatives to improve inventory management and other capabilities; competitive conditions in the retail industry; worldwide economic conditions and business uncertainty, the availability of consumer and commercial credit, changes in consumer confidence, tastes, preferences and spending, and changes in vendor relationships; the fact that our past performance generally, as reflected on our historical financial statements, may not be indicative of our future performance as a result of, among other things, the consolidation of Hometown and Outlet into a single business entity, our separation from Sears Holdings (the “Separation”), operating as a standalone business entity, and the impact of increased costs due to a decrease in our purchasing power following the Separation and other losses of benefits associated with being wholly owned by Sears Holdings and its subsidiaries prior to the (Continued on Next Slide)
25 Forward-Looking Statements—Continued Separation; our agreements related to the Separation and our continuing relationship with Sears Holdings were negotiated while we were a subsidiary of Sears Holdings and we may have received different terms from unaffiliated third parties; limitations and restrictions in our Credit Agreement and related agreements governing our indebtedness and our ability to service our indebtedness; our ability to obtain additional financing on acceptable terms; our dependence on independent dealers and independent franchisees to operate their stores profitably and in a manner consistent with our concepts and standards; our dependence on sources outside the U.S. for significant amounts of our merchandise inventories; impairment charges for goodwill or fixed-asset impairment for long-lived assets; our ability to attract, motivate and retain key executives and other employees; the impact of increased costs associated with being a public company; our ability to maintain effective internal controls as a public company; our ability to realize the benefits that we expect to achieve from the Separation; low trading volume of our common stock due to limited liquidity or a lack of analyst coverage; and the impact on our common stock and our overall performance as a result of our principal stockholders' ability to exert control over us. The foregoing factors are not exhaustive and should be read in conjunction with the other cautionary statements, including the "Risk Factors," that are included in our Annual Report on Form 10-K and in our other filings with the Securities and Exchange Commission and our other public announcements. If one or more of these or other risks or uncertainties materialize, or if our underlying assumptions prove to be incorrect, actual results may vary materially from what we projected. The forward-looking statements included in this presentation are made only as of its date. We undertake no obligation to publicly update or review any forward-looking statement made by us or on our behalf.
Appendix
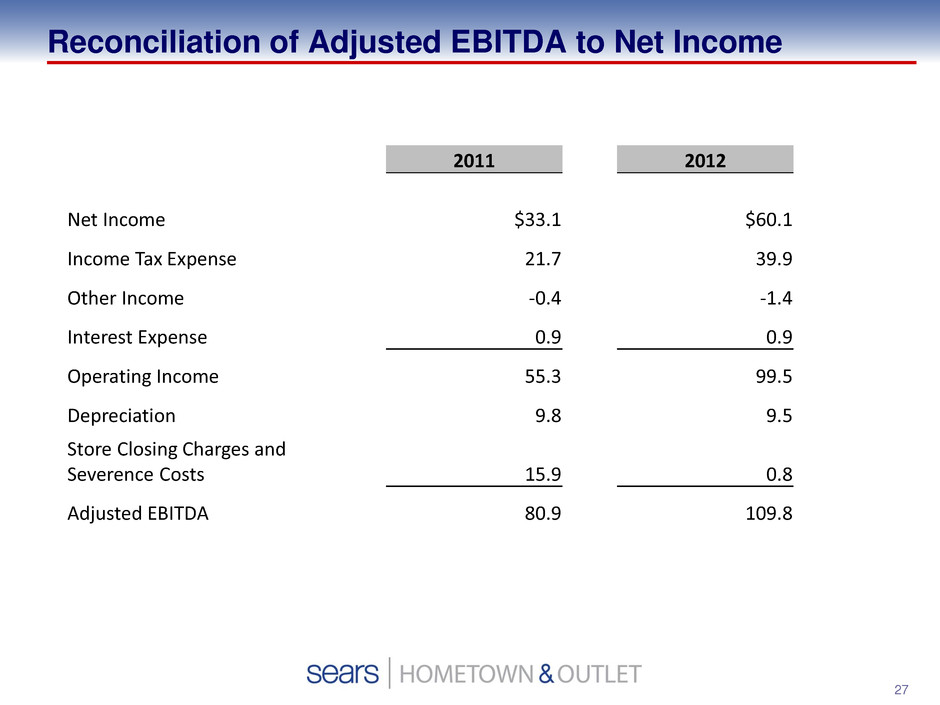
27 Reconciliation of Adjusted EBITDA to Net Income 2011 2012 Net Income $33.1 $60.1 Income Tax Expense 21.7 39.9 Other Income -0.4 -1.4 Interest Expense 0.9 0.9 Operating Income 55.3 99.5 Depreciation 9.8 9.5 Store Closing Charges and Severence Costs 15.9 0.8 Adjusted EBITDA 80.9 109.8
