Attached files
| file | filename |
|---|---|
| 8-K - FORM 8-K - NEWTEK BUSINESS SERVICES, INC. | d534415d8k.htm |
| EX-99.1 - EX-99.1 - NEWTEK BUSINESS SERVICES, INC. | d534415dex991.htm |
 www.thesba.com
Newtek Business Services, Inc.
Newtek Business Services, Inc.
“The Small Business Authority®”
“The Small Business Authority®”
Hosted by:
Hosted by:
Barry Sloane, President & CEO
Barry Sloane, President & CEO
Jennifer Eddelson, EVP & CAO
Jennifer Eddelson, EVP & CAO
First Quarter 2013
First Quarter 2013
Financial Results Conference Call
Financial Results Conference Call
May 8, 2013 4:15pm ET
May 8, 2013 4:15pm ET
NASDAQ: NEWT
NASDAQ: NEWT
www.thesba.com
www.thesba.com
Investor Relations
Public Relations
Newtek IR
Hayden Investor Relations
Rubenstein Public Relations, Inc.
Jayne Cavuoto
Director of IR
jcavuoto@thesba.com
(212) 273-8179
Brett Maas
brett@haydenir.com
(646) 536-7331
Peter Seltzberg
peter@haydenir.com
(646) 415-8972
Jonathan Goldberg
jgoldberg@rubensteinpr.com
(212) 843-9335
Exhibit 99.2 |
 www.thesba.com
Safe Harbor Statement
Safe Harbor Statement
The statements in this slide presentation including statements regarding anticipated future
financial performance, Newtek's beliefs, expectations, intentions or strategies for the
future, may be "forward-looking statements" under the Private Securities
Litigation Reform Act of 1995. All forward-looking statements involve a number of
risks and uncertainties that could cause actual results to differ materially from the
plans, intentions and expectations reflected in or suggested by the forward-looking
statements. Such risks and uncertainties include, among others, intensified
competition, operating problems and their impact on revenues and profit margins,
anticipated future business strategies and financial performance, anticipated future
number of customers, business prospects, legislative developments and similar matters. Risk
factors, cautionary statements and other conditions which could cause Newtek’s
actual results to differ from management's current expectations are contained in
Newtek’s filings with the Securities and Exchange Commission and available through
http://www.sec.gov 2 |
 www.thesba.com
First Quarter 2013
First Quarter 2013
Conference Call Agenda
Conference Call Agenda
3
First Quarter 2013 Consolidated Financial Performance
Segment Performance and Strategy
Reaffirmation of 2013 Guidance
Newtek Growth Strategy
Marketing Initiatives
Future Initiatives
Investment Merits |
 www.thesba.com
Consolidated Earnings Performance
Consolidated Earnings Performance
4
*See slide 35
for definition of Modified EBITDA
Pretax income of $2.2 million, an increase of $569 thousand, or 34.8%, compared to Q1
2012 Net income of $1.5 million, an increase of $433 thousand, or 42.5%, compared to Q1
2012 Modified EBITDA* of $4.4 million, an increase of $1.3 million, or 41.9%, compared
to Q1 2012 $1.6
$1.0
$3.1
$2.2
$1.5
$4.4
Pre-Tax Income
Net Income
Modified EBITDA*
Q1 2012
Q1 2013 |
 www.thesba.com
5
Consolidated Earnings Performance
Consolidated Earnings Performance
Earnings per Diluted Share
33.3% increase year over year in fully diluted EPS
$0.03
$0.04
$0.00
$0.02
$0.04
Earnings Per Diluted Share
Q1 2012
Q1 2013 |
 www.thesba.com
2013 Consolidated Financial Guidance
2013 Consolidated Financial Guidance
6
Pretax Income
($ in millions)
Diluted Earnings Per Share
Expect FY 2013 diluted EPS midpoint of $0.18 per share and pretax
income midpoint of $11.5 million
$1.0
$2.0
$9.4
$11.5
2010
2011
2012
2013 Forecasted
Midpoint
$0.04
$0.09
$0.15
$0.18
2010
2011
2012
2013 Forecasted
Midpoint |
 www.thesba.com
Consolidated Balance Sheet
Consolidated Balance Sheet
Major Balance Sheet changes:
•
Increase of $4.4 million in cash and cash equivalents*
•
Increase of $1.6 million in total equity
•
Decrease of $2.8 million in Credits and Notes payable in credits
in lieu of cash
7
$ in thousands
Balance
March 31, 2013
Balance
Dec 31, 2012
Total Cash & Cash Equivalents*
$27,108
$22,685
Total Assets
$166,758
$152,742
Total Liabilities
$96,210
$83,840
Total Equity
$70,548
$68,902
Selected Items
*Includes restricted cash of $15.1 million at March 31, 2013, and $8.5 million at December 31,
2012. |
 www.thesba.com
Consolidated Cash Position
Consolidated Cash Position
8
Between
December
31,
2012
and
March
31,
2013:
Cash and cash equivalents* increased by $4.4 million
Cash per diluted share increased from $0.63 to $0.72
*Includes restricted cash of $15.1 million at March 31, 2013, and $8.5 million at December 31,
2012. $22.7
$27.1
12/31/2012
3/31/2013
Cash & Cash Equivalents* |
 www.thesba.com
Operating Segment Performance
Operating Segment Performance
9
Electronic Payment Processing:
•
Revenue increased by 5.1% over Q1 2012, to $21.7 million
•
Pretax income increased by 15.1% over Q1 2012 to $1.8 million
For the First Quarter 2012 vs. 2013:
Managed Technology Solutions*:
•
Revenue decreased by 6.4% over Q1 2012 to $4.4 million
•
Pretax income decreased by 18.7% over Q1 2012 to $896 thousand
Small Business Lending:
•
Revenue increased by 53.9% over Q1 2012 to $7.4 million
•
Pretax income increased by 48.4% over Q1 2012 to $2.2 million
* In process of repositioning strategy in Managed Technology Solutions – additional
detail beginning on slide 18.
|
 www.thesba.com
Small Business Finance
Small Business Finance
10
Q1 2013 SBF revenue increased by 53.9% to $7.4 million from $4.8
million in Q1 2012
Company on track to fund $175 million in SBA 7(a) loans in 2013
Q1 2013 securitization: sold 4% yield to maturity, and improved advance rate by 8%-
9% and our long-term cost of interest by 150 basis points compared to the 2
previous securitizations
Total servicing portfolio expected to grow by 32.4% in 2013
Q1 2013 SBF revenue was 21.8% of total operating revenue
Q1
2013
Total
Operating
Revenue:
$34.1
million
SBF
$7.4M
$1.3
$5.1
$4.8
$7.4
$-
$1
$2
$3
$4
$5
$6
$7
$8
Q1' 10
Q1' 11
Q1' 12
Q1' 13
SBF Revenue Trend |
 www.thesba.com
Key Variables in Loan Sale Transaction
Loan Amount
$1,000,000
Guaranty Percent
75%
Guaranteed Balance
$750,000
Unguaranteed Balance
$250,000
Premium*
12.5%
11
Small Business Finance
Small Business Finance
Direct
Revenue
/
Expense
of
a
Loan
Sale
Transaction
–
An
Example
Resulting Revenue (Expense)
Associated Premium**
$93,750
Servicing Asset***
$18,630
Total Premium Income
$112,380
Packaging Fee Income
$2,500
FV Discount
$(18,750)
Referral Fees
$(7,500)
Total Direct Expenses
$(26,250)
Net Risk-adjusted Profit Recognized
$88,630
Net Cash Created pretax
(post securitization)****
$11,250
**Assumes 12.5% of the Guaranteed balance
***
Value determined by GAAP servicing value
**** Assuming the loan is sold in a securitization in
12 months
*Premium above 10% split 50/50 with SBA |
 www.thesba.com
Small Business Finance –
Small Business Finance –
Total Pipeline
Total Pipeline
12
As of March 31, 2013, the total Small Business Lending Total Pipeline* has
increased by $225.5 million, or 150.0%, to $375.8 million year over year:
•
Open Referrals increased by $159.6 million, or 171.8%
•
Prequalified volume has increased by $45.3 million, or 348.1%
•
Loans
currently
in
underwriting
have
increased
by
$14.8
million,
or
134.4%
•
Approved –
Pending Closing increased by $5.7 million, or 17.2%
* Total pipeline = Open loan referrals + Prequalified loans + Loans in underwriting + Loans
approved and pending closing. $92.9
$13.0
$11.0
$33.4
$252.5
$58.3
$25.9
$39.2
Open Referrals
Prequalified
In Underwriting
Approved -
Pending
Closing
3/31/2012
3/31/2013 |
 www.thesba.com
13
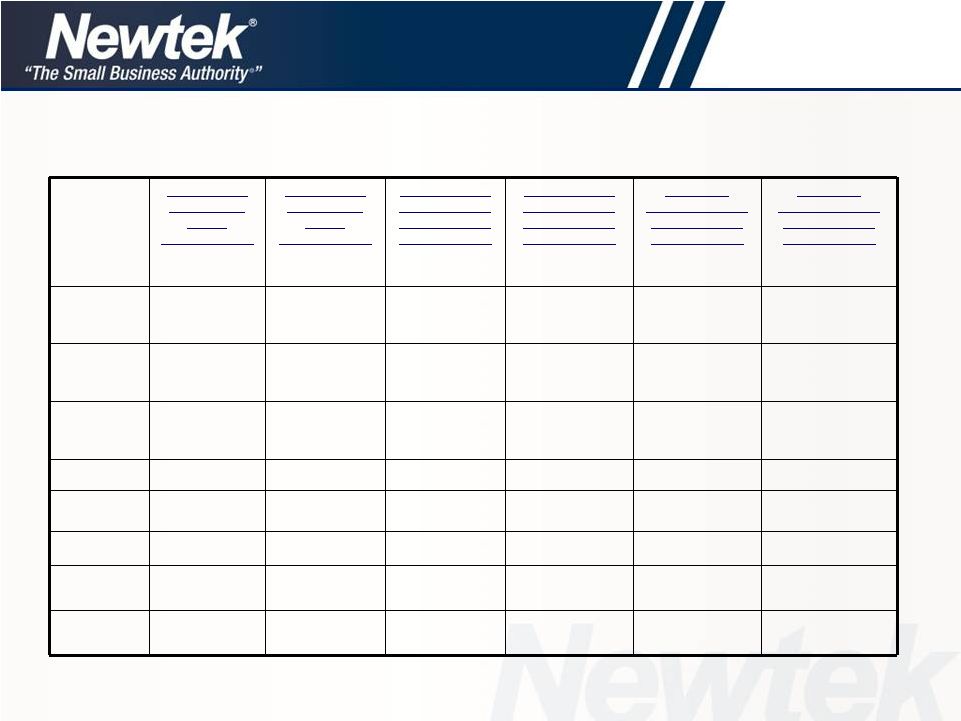
Comparative Loan Portfolio Data
Comparative Loan Portfolio Data
Loan Characteristic
As of 12/31/10
As of 3/31/13
Business Type:
Existing Businesses
53.93%
81.88%
Business Acquisition
25.89%
11.28%
Start-Ups
20.18%
6.84%
Primary Collateral:
Commercial RE
45.33%
50.53%
Machinery & Equipment
22.79%
23.57%
Residential RE
22.27%
15.51%
All Other
9.61%
10.39%
Percentage
First
Lien
on
RE:
Commercial RE
84.84%
93.06%
Residential RE
9.87%
20.49%
Industry:
Restaurant
10.60%
9.81%
Hotel/Motel
9.36%
2.93%
State Concentration:
Florida
21.55%
11.27%
New York
12.66%
11.65%
Other:
Mean FICO
675
700
Weighted Average Current LTV
78.23%
71.60%
(12/31/10 vs. 3/31/2013) |
 www.thesba.com
14
Small Business Finance
Small Business Finance
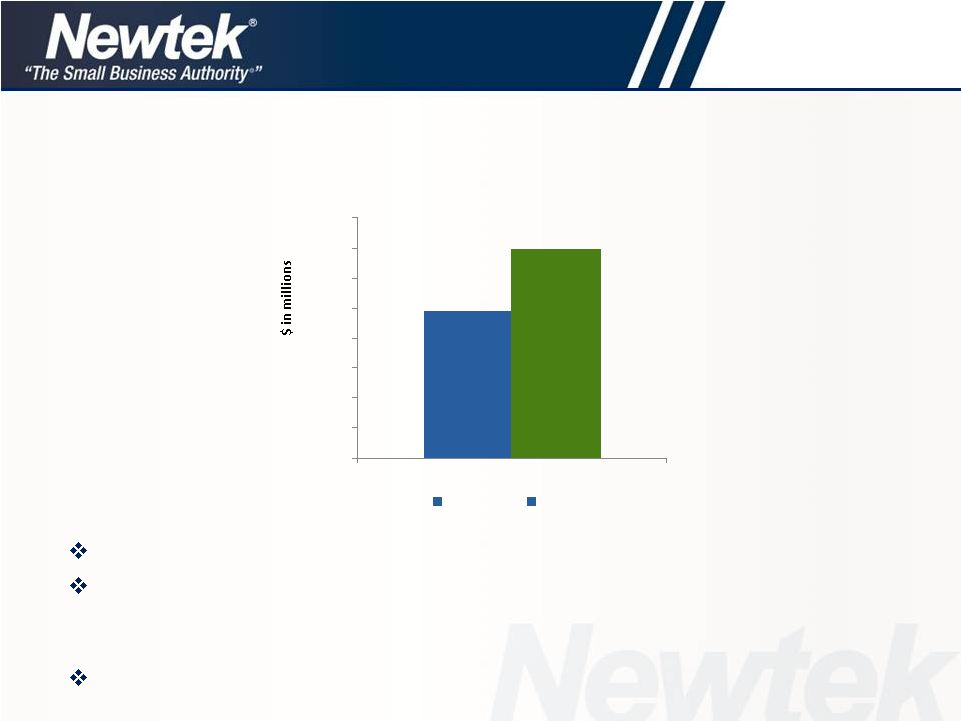
Funded $34.8 million in loans in Q1 2013, a 42.2% increase over Q1 2012
During the 3 months ended March 31, 2013, the Lender funded 35
loans,
totaling $34.8 million, vs. 19 loans, totaling $24.5 million, in the 3 months
ended March 31, 2012
We forecast the Lender to fund between $150 -
$200 million in loans in 2013
Loans Funded
$24.5
$34.8
$-
$5
$10
$15
$20
$25
$30
$35
$40
Loans Funded
Q1 2012
Q1 2013 |
 www.thesba.com
Servicing Portfolio
Servicing Portfolio
15
The SBF servicing portfolio –
March 31, 2013 vs. 2012:
•
NEWT portfolio increased by 28.1%; third-party servicing portfolio increased by
23.1% •
Related
servicing
fee
income
on
all
portfolios
increased
by
$379
thousand
to
$1.5
million,
or
35.0%,
for
the
three
months
ended
March
31,
2013
vs.
2012
•
Anticipate
total
servicing
portfolio
to
increase
to
between
$650
and
$750
million
by
12/31/13
In Q1 2013, approximately $65 million transferred to NEWT servicing portfolio from large
multi-billion dollar bank
Expect
2013
funded
loans
to
create
$175
million
of
new
servicing
at
midpoint
*Principal balance of loans serviced (dollars in millions)
$295.9
$135.9
$431.8
$379.2
$167.2
$546.4
NEWT Loans*
Servicing Other Loans*
Total Loans*
31-Mar-12
31-Mar-13 |
 www.thesba.com
Q1 2013 pretax income increased by 15.1% to $1.8 million from $1.6 million in Q1
2012
Q1 2013 EPP revenue increased by 5.1% to $21.7 million from $20.6 million in Q1
2012
Eric Turille assumed role as President of EPP division in Q1 2013
Randy
Sagar
and
his
team
in
Louisville,
KY
will
focus
on
growing
revenue
in the
second half
of
2013
through
independent
sales
organization
(ISO)
channel
Electronic Payment Processing
Electronic Payment Processing
16
Q1 2013 EPP revenue was 63.5% of total operating revenue
Q1
2013
Total
Operating
Revenue:
$34.1
million
EPP
Revenue
$21.7M
$18.8
$20.1
$20.6
$21.7
$0
$5
$10
$15
$20
$25
Q1' 10
Q1' 11
Q1' 12
Q1' 13
EPP Revenue Trend |
 www.thesba.com
Electronic Payment Processing
Electronic Payment Processing
17
Expect a significant increase in revenue in the EPP segment in the
second half of 2013 through anticipated uptick in contracts
with
ISOs
The Louisville, KY group will focus on adding significant ISO contracts by
December 31, 2013
The Louisville, KY group currently has 30 additional ISO contracts out for
signature
Expect to add 30 to 50 signed contracts by 12/31/2013
On average, we expect each ISO to produce a minimum of 5-10
merchant accounts per month
Independent Sales Organization (ISO) Contribution |
 www.thesba.com
Managed Technology Solutions
Managed Technology Solutions
18
Q1 2013 MTS revenue decreased by 6.4% to $4.4 million from $4.7 million in Q1 2012
This segment is being transformed to take advantage of shift to cloud-based business
trends including: eCommerce, Payroll and Insurance
•
Q1 2013 average Cloud revenue per user up 22.5% over Q1 2012
•
Q1 2013 average number of Cloud instances increased by 16.9% to 670 from 573 in Q1
2012
Plan to increase average number of monthly plans with upgrade of
Linux-based
platforms
Q1 2013 MTS revenue was 12.9% of total operating revenue
Q1 2013
Total
Operating
Revenue:
$34.1
million
MTS
$4.4M
$4.8
$4.8
$4.7
$4.4
$-
$1
$2
$3
$4
$5
$6
Q1' 10
Q1' 11
Q1' 12
Q1' 13
MTS Revenue Trend |
 www.thesba.com
Shift to Linux-based Platforms
Shift to Linux-based Platforms
Recently upgraded Linux Apache and Linux Nginx platforms
•
Should capture additional market opportunities
•
NTS created associated control panels, service support and billing, which allows
NTS to participate in growth of 100% of the market of new web design (vs. 33%
represented by Microsoft)
•
All platforms are available with NTS’s Cloud and non-Cloud environment, and are
fully managed offerings unlike NTS’s competitors
•
Newtek Advantage™
leverages NTS’s underlying technologies to deliver real-time
information and actionable business intelligence to new and existing customers
•
NTS launched a complete line of Cloud-based business and eCommerce
packages, or Cloud Spaces, to streamline the decision process for business
owners and accommodate designers and developers who wish to build sites in
both Microsoft and Linux environments
19 |
 www.thesba.com
Invested for the Future
Invested for the Future
20
During Q1 2013:
•
Total shared Linux accounts increased by 126.3%, to 430 accounts
•
Total cloud service accounts increased by 33.9%, to 21,809* accounts
Q1 2013 average cloud-computing instances increased by 16.9% over Q1 2012, to
670 instances
*Includes the 430 shared Linux accounts
Linux and Cloud
190
251
318
430
0
100
200
300
400
500
December
January
February
March
Growth in New Shared Linux Accounts in
Cloud Environment
16,285
16,861
17,182
21,809
0
5,000
10,000
15,000
20,000
25,000
December
January
February
March
Growth in Total Cloud Services |
 www.thesba.com
Cloud Computing
Cloud Computing
21 |
 www.thesba.com
MTS Referral Trends
MTS Referral Trends
22
Q1 2012 vs. Q1 2013
Q1 2012 vs. Q1 2013
•
Total MTS referrals increased by 24.6% to 3,983
•
Total closed referrals increased by 32.0% to 2,928
•
Referral close rate increased to 74.3%, from 69.4% in Q1 2012
3,196
3,983
0
1,000
2,000
3,000
4,000
Q1 2012
Q1 2013
Total MTS Referrals
2,217
2,928
0
1,000
2,000
3,000
4,000
Q1 2012
Q1 2013
Total Closed MTS Referrals |
  www.thesba.com
Managed Technology Solutions
Managed Technology Solutions
23
6.6% quarter-over-quarter increase
6.4% quarter-over-quarter increase
22.5% quarter-over-quarter increase
7.8% quarter-over-quarter increase
Upward Trend in Average Revenue per User Q1 2012 vs. Q1 2013
$18.1
$19.3
$0
$4
$8
$12
$16
$20
Q1 2012
Q1 2013
Shared
$331.6
$0
$70
$140
$210
$280
$350
Q1 2012
Q1 2013
Dedicated
$352.8
$167.3
$205.0
$0
$70
$140
$210
Q1 2012
Q1 2013
Cloud
$158.3
$170.6
$0
$60
$120
$180
Q1 2012
Q1 2013
Virtual Private Server |
 www.thesba.com
Reaffirming 2013 Guidance
Reaffirming 2013 Guidance
24
Operating Revenue:
•
Midpoint of $148.2 million, with a range of $145.1 million and $151.2
million
•
Increase of 12.1% over 2012 revenue of $131.1 million
Pretax Income:
•
Midpoint of $11.5 million, with a range of $10.0 million and $13.0 million
•
Increase of 22.3% over 2012 pretax income of $9.4 million
Diluted EPS:
•
Midpoint
of
$0.18,
with
a
range
of
$0.17
-
$0.19
per
share
•
Increase of 20.0% over 2012 diluted EPS of $0.15 per share
Modified EBITDA*:
•
Midpoint of $20.9 million, with a range of $19.3 million and $22.4 million
•
Increase of 26.7% over 2012 Modified EBITDA* of $16.5 million
*See slide 35 for definition of Modified EBITDA |
 www.thesba.com
Managed Technology Solutions
Electronic Payment Processing
2013 Segment Guidance
2013 Segment Guidance
25
Revenue: $90.4 -
$94.1M
Pretax
Income:
$8.2
-
$9.0M
Modified
EBITDA*:
$8.5
-
$9.3M
All Other
Small Business Finance
Revenue: $34.0 -
$35.6M
Pretax
Income:
$10.0
-
$10.8M
Modified
EBITDA*:
$17.1
-
$17.9M
Revenue:
$2.2
-
$2.2M
Pretax
Loss:
$(1.1)
-
$(0.9)M
Modified
EBITDA*:
$(1.0)
-
$(0.8)M
Revenue by Segment
*See slide 35 for definition of Modified EBITDA
EPP
SBF
MTS
Revenue: $18.4 - $19.2M
Pretax Income: $3.9 - $4.7M
Modified EBITDA*: $5.5 - $6.3M
|
 www.thesba.com
2013 Segment Guidance
2013 Segment Guidance
*Note: totals may not add due to rounding
In millions of dollars
Electronic
Small
Managed
Total
Inter-
Payment
Business
Technology
All
Corporate
Business
CAPCO
Company
Processing
Finance
Solutions
Other
Activities
Segments
Segment
Eliminations
Total
Low
High
Low
High
Low
High
Low
High
Low
High
Low
High
Low
High
Low
High
2013 Full Year
Revenue
90.4
94.1
34.0
35.6
18.4
19.2
2.2
2.2
0.8
0.8
145.8
151.9
0.1
0.1
(0.8)
145.1
151.2
Pretax Income (Loss)
8.2
9.0
10.0
10.8
3.9
4.7
(1.1)
(0.9)
(9.6)
(9.3)
11.4
14.3
(1.5)
(1.3)
-
10.0
13.0
Income from tax credits
-
-
-
-
-
-
-
-
-
-
-
-
(0.1)
(0.1)
-
(0.1)
(0.1)
Net change in fair value of
credits in lieu of cash and
notes payable in credits in
lieu of cash
-
-
-
-
-
-
-
-
-
-
-
-
-
-
-
-
-
Deferred compensation
expense
-
-
-
-
-
-
-
-
0.4
0.4
0.4
0.4
-
-
-
0.4
0.4
Lease loss amortization
-
-
-
-
-
-
-
-
(0.3)
(0.3)
(0.3)
(0.3)
-
-
-
(0.3)
(0.3)
Interest Expense
-
-
5.9
5.9
0.1
0.1
-
-
-
-
6.0
6.0
0.2
0.2
-
6.2
6.2
Depreciation and
Amortization
0.3
0.3
1.2
1.2
1.5
1.5
0.1
0.1
0.1
0.1
3.2
3.2
-
-
-
3.2
3.2
Modified EBITDA
8.5
9.3
17.1
17.9
5.5
6.3
(1.0)
(0.8)
(9.4)
(9.1)
20.7
23.6
(1.4)
(1.2)
-
19.3
22.4
26 |
 www.thesba.com
27
Growth Strategy
Growth Strategy
Increased
advertising
budget by
50%
Grow brand
organically & via
www.thesba.com
Corporate
re-brand:
authoritative
presence in small
business economy
Cross sell
and cross
market
Continue to
grow alliance
channels
Grow
applications
hosted in the
Cloud
•
Remain #1 in Non-bank
Government Guaranteed
Lender
•
Grow Newtek Advantage
Platform
•
Grow revenues between
9-11% organically |
 www.thesba.com
28
Marketing Campaign –
Marketing Campaign –
National
National
Television Commercials
Television Commercials
•
CNN
•
Fox News
•
Fox Business
On average, 190 or more monthly commercials which have aired on the
following properties:
Commercial
schedule
primarily
Monday
to
Thursday
from
5am
-
11pm
Improvement in Website statistics since start of TV campaign
•
32% increase in average time on site
•
20% improvement in our bounce rate
•
MSNBC
•
Headline News
•
The Outdoor Channel |
 www.thesba.com
Visitor Trend to www.thesba.com
Visitor Trend to www.thesba.com
29
As a result of our Direct Marketing Initiatives:
•
Total Quarterly Unique Visitors* increased by 62.0% for Q1 2013 vs. Q1 2012
•
Total Quarterly Visitors** increased by 87.2% in Q1 2013 vs. Q1 2012
*Represents the total of unique visitors that visited
www.thesba.com
during each of the first quarters in 2012 and 2013.
**Represents the total visitors to
www.thesba.com
during each of the first quarters in 2012 and 2013.
Total Visitors and Unique Visitors for Q1 2012 vs. Q1 2013
49,871
80,785
73,903
138,374
0
20,000
40,000
60,000
80,000
100,000
120,000
140,000
160,000
Q1 2012
Q1 2013
Unique Vistors
Total Visitors |
 www.thesba.com
Mobile real-time SMB management platform; puts all of a business’
critical
transactions and economic, eCommerce and web site traffic data on a smartphone,
tablet, laptop or PC
Provides intelligence that businesses require, giving them the advantage to succeed
Allows
owners
and
operators
of
small-
and
medium-sized
businesses
to
manage
their
businesses from their mobile device anywhere, anytime, without an IT department
Developing all inclusive applications, eCommerce in the Cloud, Payroll in the Cloud,
Insurance Agency in the Cloud
The Newtek Advantage™
The Newtek Advantage™
30
The Newtek Advantage ™
is SMART:
S:
Sales
Increased
—
less
time
on
administration;
more
time
spent
on
sales
and
servicing
customers
M:
More
Control,
Fewer
Surprises
—
key
business
stats
and
metrics
available
in
real
time
for
faster, more informed decisions
A:
Accelerated
Profits
—
real-time
information
means
better
and
more
profitable
decisions
R:
Real-time
information
means
key
business
management
data
is
only
seconds
away,
whenever
and wherever the business operator is
T:
Technology
Enhancements
—
decreased
cost
of
an
IT
department
—
everything
in
the
Cloud |
 www.thesba.com
Comparable Company Statistics
Comparable Company Statistics
On Deck Capital –
$500 million market valuation
Lending Club –
$1.55 billion market valuation
Digital
River
(DRIV)
announces
purchase
of
LML
Payment
Systems
(LMLP)
Universal Business Payment Solutions (UBPS) announced $179 million planned
acquisition of credit/debit card sales and processing, payroll processing and tax filing
companies
GoDaddy announced strategic purchase of a cloud-based financial management
application company to reach more small businesses
Newtek has the advantage of experience providing a “suite of services”
which operate
on a similar, coordinated platform, and will also be available in the cloud;
it’s called The Newtek Advantage™
Publicly Traded Comparables
Medallion Financial Corp (TAXI)
Heartland Payment Systems (HPY)
Web.com Group, Inc. (WWWW)
Cbeyond, Inc. (CBEY)
8 x 8, Inc. (EGHT)
ReachLocal, Inc. (RLOC)
Stamps.com, Inc. (STMP)
Marchex, Inc. (MCHX)
Vistaprint, NV (VPRT)
31 |
 www.thesba.com
Investment Summary
Investment Summary
Publicly traded Company since 2000
Management’s interests aligned with shareholders
•
CEO alone owns over 14.5% of outstanding shares*
Trades at slightly more than 3x 2013 forecasted Modified EBITDA**
•
2013 forecasted Modified EBITDA** of $20.9 million, an increase of approximately
26.7% over FY 2012 Modified EBITDA** of $16.5 million
Trades at 1.1x book value
Growing revenues
•
Expect to grow revenues by approximately 13% in 2013
Tremendous opportunity to penetrate market
•
Over 27 million small businesses in the U.S.
Inexpensive relative to market comparables
•
Market comps: LMLP, VNTV
32
*As of March 31, 2013
**See slide 35 for definition of Modified EBITDA |
 www.thesba.com
Key Statistics –
NASDAQ: NEWT
33
Stock Price (at 5/6/13)
$2.05
52-Week Range
$1.14-$2.21
Common Shares O/S
37.7M
Market Cap (at 5/6/13)
$72.2M
Avg. Daily Trading Vol.
34,723
(200-day average as of 5/6/2013)
Share
Statistics
(USD)
-------------------------------------------------------------
Revenue
$148.2M
Pre-tax Income
$11.5M
Diluted EPS
$0.18
Modified EBITDA*
$20.9M
**2013 forecast
*See slide 35 for definition of Modified EBITDA
Financial Highlights**
-------------------------------------------------------------
|
 www.thesba.com
Financial Review
Financial Review
Jennifer C. Eddelson -
Jennifer C. Eddelson -
CAO
CAO |
 www.thesba.com
Non-GAAP Financial Measures
Non-GAAP Financial Measures
35
In evaluating its business, Newtek considers and uses modified EBITDA as a supplemental measure
of its operating performance. The Company defines modified EBITDA as earnings
before income from tax credits, interest expense, taxes, depreciation and amortization,
stock compensation expense, other than temporary decline in value of investments, Capco
fair value change and the amortization of the 2011 accrued loss on the lease
restructure. Newtek uses modified EBITDA as a supplemental measure to review and
assess its operating performance. The Company also presents modified EBITDA because it
believes it is frequently used by securities analysts, investors and other interested parties as
a measure of financial performance.
The term modified EBITDA is not defined under U.S. generally accepted accounting principles, or
U.S. GAAP, and is not a measure of operating income(loss), operating performance or
liquidity presented in accordance with U.S. GAAP. Modified EBITDA has limitations
as a analytical tool and, when assessing the Company’s operating performance,
investors should not consider modified EBITDA in isolation, or as a substitute for net
income (loss) or other consolidated income statement data prepared in accordance with U.S.
GAAP. Among other things, modified EBITDA does not reflect the Company’s actual cash
expenditures. Other companies may calculate similar measures differently than Newtek,
limiting their usefulness as comparative tools. Newtek compensates for these
limitations by relying primarily on its GAAP results and using modified EBITDA only
supplementally.
Our Capcos operate under a different set of rules in each of the 7 jurisdictions and these place
varying requirements on the structure of our investments. In some cases, particularly in
Louisiana or in certain situations in New York, we do not control the equity or
management of a qualified business, but that cannot always be presented orally or in
written presentations. |
 www.thesba.com
In millions of dollars
*Note: totals may not add due to rounding
Q1 2013 Actual vs. Q1 2012 Actual
Q1 2013 Actual vs. Q1 2012 Actual
36
Revenue For
The Quarter
Ended
March 31, 2013
Revenue For
The Quarter
Ended
March 31, 2012
Pretax Income
(Loss) For The
Quarter Ended
March 31, 2013
Pretax Income
(Loss) For The
Quarter Ended
March 31, 2012
MODIFIED
EBITDA For The
Quarter Ended
March 31, 2013
MODIFIED
EBITDA For The
Quarter Ended
March 31, 2012
Electronic
Payment
Processing
21.679
20.618
1.835
1.594
1.950
1.844
Small
Business
Finance
7.449
4.839
2.175
1.466
3.686
2.273
Managed
Technology
Solutions
4.394
4.693
0.896
1.102
1.256
1.430
All Other
0.646
0.546
(0.462)
(0.234)
(0.404)
(0.213)
Corporate
Activities
0.200
0.250
(1.956)
(1.800)
(1.854)
(1.738)
CAPCO
0.050
0.200
(0.286)
(0.495)
(0.275)
(0.482)
Interco
Eliminations
(0.274)
(0.417)
–
–
–
–
Total
34.144
30.729
2.202
1.633
4.359
3.114 |
 www.thesba.com
2013 Segment Guidance
2013 Segment Guidance
*Note: totals may not add due to rounding
In millions of dollars
Electronic
Small
Managed
Total
Inter-
Payment
Business
Technology
All
Corporate
Business
CAPCO
Company
Processing
Finance
Solutions
Other
Activities
Segments
Segment
Eliminations
Total
Low
High
Low
High
Low
High
Low
High
Low
High
Low
High
Low
High
Low
High
2013 Full Year
Revenue
90.4
94.1
34.0
35.6
18.4
19.2
2.2
2.2
0.8
0.8
145.8
151.9
0.1
0.1
(0.8)
145.1
151.2
Pretax Income (Loss)
8.2
9.0
10.0
10.8
3.9
4.7
(1.1)
(0.9)
(9.6)
(9.3)
11.4
14.3
(1.5)
(1.3)
-
10.0
13.0
Income from tax credits
-
-
-
-
-
-
-
-
-
-
-
-
(0.1)
(0.1)
-
(0.1)
(0.1)
Net change in fair value of
credits in lieu of cash and
notes payable in credits in
lieu of cash
-
-
-
-
-
-
-
-
-
-
-
-
-
-
-
-
-
Deferred compensation
expense
-
-
-
-
-
-
-
-
0.4
0.4
0.4
0.4
-
-
-
0.4
0.4
Lease loss amortization
-
-
-
-
-
-
-
-
(0.3)
(0.3)
(0.3)
(0.3)
-
-
-
(0.3)
(0.3)
Interest Expense
-
-
5.9
5.9
0.1
0.1
-
-
-
-
6.0
6.0
0.2
0.2
-
6.2
6.2
Depreciation and
Amortization
0.3
0.3
1.2
1.2
1.5
1.5
0.1
0.1
0.1
0.1
3.2
3.2
-
-
-
3.2
3.2
Modified EBITDA
8.5
9.3
17.1
17.9
5.5
6.3
(1.0)
(0.8)
(9.4)
(9.1)
20.7
23.6
(1.4)
(1.2)
-
19.3
22.4
37 |
 www.thesba.com
Addenda
Addenda |
 www.thesba.com
Pretax
Income
(Loss)
Income
from Tax
Credits
Net Change
in Fair Value
of Credits in
Lieu of Cash
and Notes
Payable in
Credits in
Lieu of Cash
Deferred
Comp
Expense
Amortization of
2011 Lease
restructuring
charge
Interest
Expense
Depreciation
and
amortization
First
Quarter
2013
Modified
EBITDA
Electronic Payment
Processing
1.835
-
-
0.002
-
-
0.113
1.950
Small Business Finance
2.175
-
-
0.023
-
1.217
0.271
3.686
Managed Technology
Solutions
0.896
-
-
0.009
-
0.024
0.326
1.256
All Other
(0.462)
-
-
0.008
-
-
0.051
(0.404)
Corporate Activities
(1.956)
-
-
0.124
(0.073)
0.005
0.044
(1.854)
CAPCO
(0.286)
(0.026)
(0.019)
-
-
0.056
0.001
(0.275)
Total
2.202
(0.026)
(0.019)
0.166
(0.073)
1.302
0.807
4.359
Modified EBITDA Reconciliation
Modified EBITDA Reconciliation
Modified EBITDA Reconciliation from Pretax Income (Loss)
For the three months ended March 31, 2013
In millions of dollars
*Note: totals may not add due to rounding
39 |
 www.thesba.com
Pretax
Income
(Loss)
Income
from Tax
Credits
Net Change
in Fair Value
of Credits in
Lieu of Cash
and Notes
Payable in
Credits in
Lieu of Cash
Deferred
Comp
Expense
Amortization of
2011 Lease
restructuring
charge
Interest
Expense
Depreciation
and
amortization
First
Quarter
2012
Modified
EBITDA
Electronic Payment
Processing
1.594
-
-
0.009
-
-
0.241
1.844
Small Business Finance
1.466
-
-
0.011
-
0.577
0.219
2.273
Managed Technology
Solutions
1.102
-
-
0.008
-
0.022
0.298
1.430
All Other
(0.234)
-
-
0.008
-
-
0.014
(0.213)
Corporate Activities
(1.800)
-
-
0.106
(0.073)
0.001
0.027
(1.738)
CAPCO
(0.495)
(0.191)
(0.036)
-
-
0.237
0.002
(0.482)
Total
1.633
(0.191)
(0.036)
0.142
(0.073)
0.837
0.801
3.114
Modified EBITDA Reconciliation
Modified EBITDA Reconciliation
Modified EBITDA Reconciliation from Pretax Income (Loss)
For the three months ended March 31, 2012
In millions of dollars
*Note: totals may not add due to rounding
40 |